Article

The Effects of Fast Food Restaurant Attributes on Customer Satisfaction, Revisit Intention, and Recommendation Using DINESERV Scale

Department of Business Administration, Seoul National University of Science and Technology, Seoul 01811, Korea
*
Author to whom correspondence should be addressed.
Sustainability 2020, 12(18), 7435; https://doi.org/10.3390/su12187435
Submission received: 19 August 2020 / Revised: 3 September 2020 / Accepted: 5 September 2020 / Published: 10 September 2020
(This article belongs to the Special Issue Sustainable Food Production and Consumption)

Abstract

:
The fast food restaurant business is one of the fastest-growing industries in the world. International and local restaurant chains are trying to satisfy the demands of customers for a variety of products and services. Along with changing market trends, customers are now becoming more sophisticated and demanding. Customer satisfaction is an essential business issue, as entrepreneurs have realized that favorable customer feedback is key for a long-term sustainable operation. Customers who have an excellent experience at a restaurant may recommend the restaurant to others, spread positive information, or become a loyal customer. The fast food industry has only recently developed in Mongolia and an increasing number of global fast food chains are now entering the market every year. The purpose of this paper is to examine and evaluate the factors affecting customer satisfaction, revisit intention, and likelihood of recommendation for Mongolian fast food restaurants, as well as a global fast food restaurant in Mongolia using the DINESERV scale. This study focuses on comparing directly competing food chains; only two brands were studied because of the limited fast food presence in Ulaanbaatar. Then, it aims to analyze how satisfaction levels influence a customer’s revisit intention and likelihood of recommending a restaurant. Furthermore, an in-depth analysis of the difference between local and global fast food brands is a key element that this paper analyzes. Moreover, this paper investigates how results can be different according to whether the respondent resides in Mongolia or Korea and discusses business implications. The results of this paper show that four factors (food quality, service quality, price, and atmosphere of a restaurant) positively influence customer satisfaction, revisit intention, and likelihood of recommendation for Mongolian and global fast food restaurants, and customer satisfaction has a positive influence on customer revisit intention and likelihood of recommendation for both types of restaurants. However, depending on whether it is a Mongolian fast food restaurant or a global fast food restaurant, the factors affecting customer satisfaction, revisit intention, and recommendation are different.

1. Introduction

The fast food restaurant business is one of the fastest-growing industries in the world and the global fast food market is expected to grow at a compound annual growth rate (CAGR) of 5.1% from 2020 to 2027 [1]. International and local restaurant chains are trying to satisfy the demand of customers for a variety of products and services. People prefer to use fast food restaurants for their convenience and to save time, and there have been certain changes in consumer trends that have increased the popularity of eating out; therefore, the fast food restaurant industry is growing rapidly. Like other industries, customer satisfaction is an essential business issue for restaurant businesses. In the competitive hospitality sector, customer satisfaction has become a key element of business strategy. Restaurants wish to maximize the positive experience of a consumer in order to increase their intentions of revisiting [2,3]. Entrepreneurs have realized that favorable customer feedback is key for developing a long-term sustainable operation. A thorough understanding and knowledge of the factors that influence customer satisfaction is useful to allow restaurant owners and managers to design and deliver the right products to customers. Thus, customer satisfaction plays an important role in every business organization, whether it is providing a service or a product. The obvious reason for satisfying the firm’s customers is to allow the business to expand and gain a higher market share, leading to improved profitability.
In recent years, domestic and foreign direct investment has drastically increased, becoming an important driver of economic growth [4]. Moreover, the GDP growth rate in Mongolia averaged 5.45 percent from 1991 until 2018, reaching an all-time high of 17.50 percent in the fourth quarter of 2011 and a record low of −30 percent in the fourth quarter of 1992 [5].
Although the franchise industry in Mongolia is in its infancy, the fast food industry has grown in Mongolia in the last few years. KFC was the first Western food chain to open a store in Mongolia in 2013. In 2015, Burger King opened its first store in Mongolia, following the opening of KFC and Pizza Hut [6]. For Burger King, there were a total of nine outlets as of December, 2018 [7]. In 2018, the South Korean Lotte’s fast food chain Lotteria opened its first Mongolian store in the country’s capital city of Ulaanbaatar [8]. Furthermore, Mongolia’s food and beverage business is one of the most advanced local industries in terms of technology, equipment, and know-how and seeks to capitalize on the nation’s abundant agricultural resources to not only meet the local market demand, but also export to neighboring countries. Many leading companies of the Food & Beverages sector, such as APU JSC, SUU JSC, are listed on the Mongolian Stock Exchange [4]. Mongolian brands include BD’s Mongolian Barbeque and Berlin Burger, the latter being Mongolia’s very first fast food restaurant, which opened in 1992. As of 2020, there are a total of nine Berlin Burger stores in Ulaanbaatar. Multinational chains, such as Burger King, and local chains, such as Berlin Burger, are growing in Mongolia because of their product development, quality standards, and effective localization [9]. With an increasing number of people eating out, the industry offers a major opportunity to capture a larger consumer base. As a result of the trend, international food chains are investing huge amounts of money to grab a share of this highly lucrative market. They are spending all their resources and efforts to understand their customers better and give them the best possible services.
Currently, research in the Mongolian fast food industry is lacking, largely due to the early stage the industry is in. Thus, in this paper, we analyze various factors for the success of the fast food market in Mongolia. We examine and evaluate the factors affecting customer satisfaction, revisit intention, and likelihood of recommendation for Mongolian fast food restaurants and global fast food restaurants in Mongolia and compare the satisfaction levels of customers with reference to restaurants in Mongolia. We investigate which factors among food quality, service quality, atmosphere and interior, and price and value affect customer satisfaction using a factor analysis and regression analysis. We also analyze how customer satisfaction is related to customer revisit intention and likelihood of recommendation. For this, we aggregate the data through Google’s survey form and email methods.
The results of this paper show that four factors (food quality, service quality, price, and atmosphere of a restaurant) positively influence customer satisfaction, revisit intention, and likelihood of recommendation for Mongolian and global fast food restaurants, and customer satisfaction has a positive influence on customer revisit intention and likelihood of recommendation for both types of restaurants. Moreover, the results show that preference for global food chains over local ones owes greatly to customer experiences regarding the atmosphere of a restaurant.
The remainder of the paper is organized as follows. Section 2 reviews previous literature and presents the theoretical background. Section 3 presents the research methodology, and Section 4 discusses the results and implications. Section 5 concludes the study and discusses future research directions.

2. Research Background

The DINESERV is well known to be a reliable, relatively simple measurement tool for determining how consumers view a restaurant’s quality [10]. Similar to SERVQUAL [11], DINESERV was developed by Stevens et al. [12] to assess customers’ perceptions of restaurant service quality. In many previous studies, the DINESERV instrument has been used to investigate ways to improve a restaurant’s quality and increase customer satisfaction, which, in turn, determines revisit intentions and likelihood of recommendation [10,12,13,14].

2.1. Service Quality

Service quality is a measure of how well a service conforms to the customer’s expectations and the success factor of a fast food restaurant [11]. Service quality is the main component of a fast food restaurant that can be measured and improved continuously. When there is a close interaction between a service employee and a customer, the perception of what is being delivered is as important as what is actually delivered [15]. In other words, it is the result of the comparison between expectations about service and perceptions of the way the service has been performed that customers make. Therefore, the employees’ behaviors and attitudes can influence a customer’s perception of quality for the service offered [16].

2.2. Food Quality

Food quality is an important component and it has been constantly shown to be a core value that a customer considers in deciding which fast food restaurant to eat at [17]. Many studies have investigated food quality characteristics, such as the freshness of food, food presentation, food taste, a variety of menu options, and food temperature. Food quality is considered to be a key foundation for customer satisfaction and customers’ revisit intention [18,19,20]. According to Peri [21], food quality is an absolute requirement to satisfy the needs and expectations of restaurant customers. Youth-aged customers who mostly prefer eating delicious food require good quality food and beverages to satisfy them. Analysts have stated that the quality of menu items affects customers’ revisit intention [22].

2.3. Atmosphere

Nowadays, people prefer to eat a lot more often. Customers are more aware of the atmosphere in which they are dining in than they were before. This requires restaurant owners to put more effort into designing and providing more comfortable surroundings for their customers. The atmosphere of a restaurant can be as important as the food itself [23]. The restaurant atmosphere is influenced by several factors, such as the interior design, temperature, cleanliness, music, and table arrangement.

2.4. Price

The price of a product or service can affect the level of satisfaction among customers because it has an associated sense of fairness. A customer’s perceptions of unfair pricing lead to negative outcomes, such as a lower level of revisit intention, dissatisfaction, and negative word of mouth. The pricing of restaurant items also varies according to the type of restaurant. If the price is high, customers are likely to expect high quality, otherwise, it can induce a sense of being “ripped off.” Likewise, if the price is low, customers may question the ability of the restaurant to deliver product and service quality. Moreover, due to the competitiveness of the restaurant industry, customers are able to establish internal reference prices. When establishing prices for a restaurant, an internal reference price is defined as a price in a buyer’s memory that serves as a basis for judging or comparing actual prices [24].

2.5. Customer Satisfaction

Customer satisfaction is becoming a common goal for businesses. Customer satisfaction, as defined by Oliver [25], is the after-purchase judgment or evaluation of a product or service. It is also frequently described as the extent to which the chosen product meets or exceeds consumer expectations. It is, hence, a comprehensive domain that is the result of several inter-related variables impacting each other on an ongoing basis, rather than a single variable [23]. Customer satisfaction is an overall evaluation that compares post-purchase perceived performance with purchase expectations [26].
Taking the past as an example, when consumers decide to have a meal in a specific restaurant, they will have an expectation of how they will be served. After the meal, they will compare the serving experience with their level of anticipation. If the service quality the restaurant offered is equal to or higher than expected, they will be satisfied with this restaurant and likely come to the same restaurant again [27]. Based on this theory, customer satisfaction is the measure of the gap between a customer’s expectations and perceived performance. Therefore, to enlarge the market segments in the restaurant industry, customer satisfaction is a powerful predictor of customer intent to repurchase [28].
In Qu’s study, by analyzing data from Chinese restaurants in Indiana, it was found that the higher a customer’s satisfaction with food and environment, service and courtesy, price and value, location, and advertising and promotion, the greater the likelihood of the customer returning [13]. Different from Qu’s conclusion, Weiss et al. [29] found that customer revisit intention is only influenced by satisfaction with the restaurant food quality and atmosphere. Although dimensions used to estimate customer satisfaction in different studies have not been identical, the use of satisfaction as a determinant factor of customer revisit intention has been consistent across different studies. Many studies have identified factors that influence customer satisfaction, including service quality, variety of the menu, price, food quality, food presentation, ambience, and convenience.

2.6. Revisit Intention and Recommendation

When a company offers a product or service, it is possible that there are many similar products or services on the market provided by their competitors. Customers usually have many alternative choices. Therefore, it is important for companies to improve the value experienced by existing customers and take effective steps to encourage their repurchase behaviors, as well as attract new customers. Repeat customers are more profitable than new customers. Chen and Hu [30] described customer revisit intention as a customer’s intention to revisit the same restaurant and recommend it to members of their circle. Customers that have an excellent experience at the restaurant will recommend the restaurant to others, spread positive information, or become a loyal customer. Customer revisit intention has been studied in many domains, such as tourism services, catering services, hospital services, retail business, bank services, and telecom businesses. A number of models of factors driving revisit intention have been constructed by means of structural equation modeling or logistic regression. The factors considered in these models include satisfaction, number of previous visits, cost, and customer value. Among the factors influencing revisits is customer satisfaction [27].

3. Research Model and Methodology
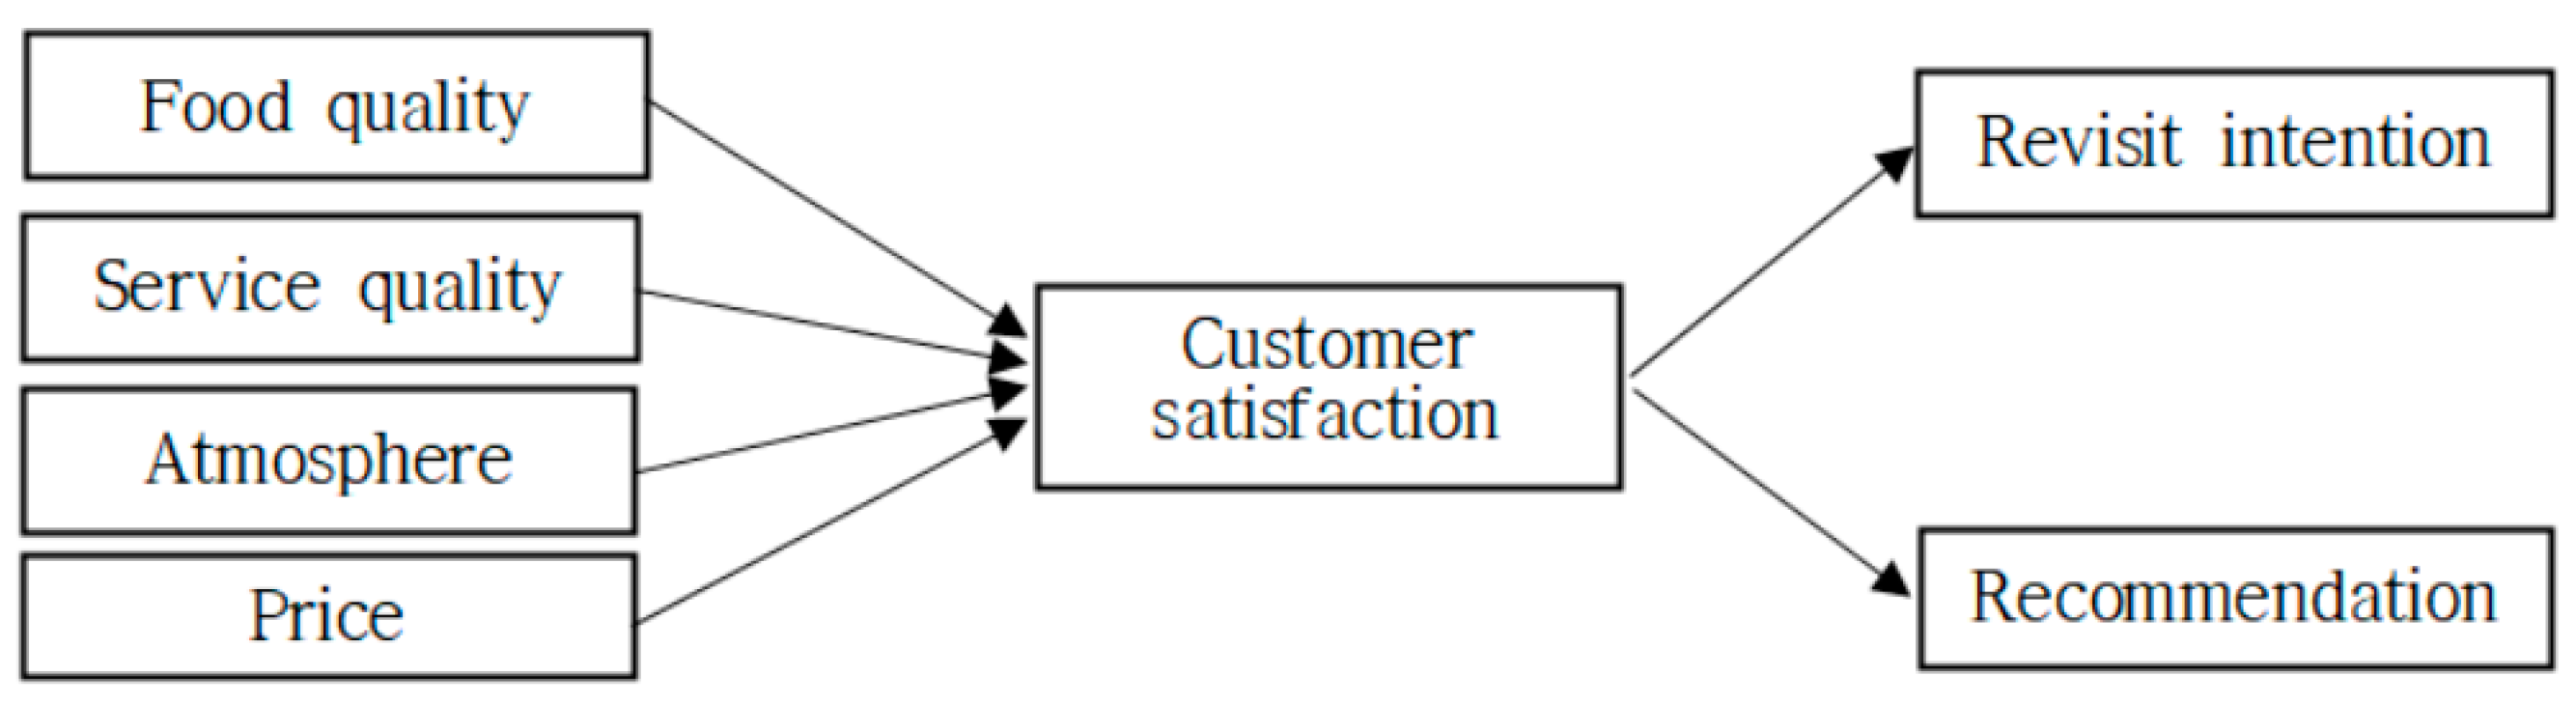
Like Kim and Choi [31], we investigated which factors—such as food quality, service quality, atmosphere and interior, and price and value—affect customer satisfaction, which, in turn, determines revisit intentions and likelihood of recommendation, using a factor analysis and a regression analysis.
There is a variety of measurement tools and techniques for assessing service quality. One of the most popular and widely used is the SERVQUAL (service quality) instrument [32]. In restaurant settings, service quality is usually measured with an adapted version of SERVQUAL, called DINESERV [12]. A modified version of DINESERV is applied in this study as well. The DINESERV is considered a reliable and relatively simple tool for determining how customers view a restaurant’s quality [33] and has been used in many restaurant settings, such as fine dining [34], casual dining [35], fast food [36,37], food courts [38], and chain restaurants [39]. During the last two decades, SERVQUAL and DINESERV have been widely used to measure service quality in the hospitality industry [40]. The DINESERV tool was applied to assess managers’ perceptions of service quality, and firms’ financial reports were used to analyze operational efficiency and profitability [41].

3.1. Research Model

The DINESERV, constructed by Stevens et al. [12], consists of service-quality standards that fall into DINESERV factors: assurance, empathy, reliability, responsiveness, and tangibles. Kim et al. [42] found that the five restaurant factors—food quality, service quality, price and value, atmosphere, and convenience—had a significant impact on the customer’s satisfaction with dining facilities [43]. Kim and Choi [31] used four factors—food quality, service quality, interior, and price and value—to investigate the perception gap of service attributes between operators and customers. Like Kim and Choi [31], we investigated how four factors—food quality, service quality, atmosphere and interior, and price and value—affect customer satisfaction, which, in turn, determines revisit intentions and likelihood of recommendation, using a factor analysis and a regression analysis. Table 1 shows the four service factors of restaurants used in this study and related results in previous studies.
Figure 1 shows the conceptual research model proposed to investigate how four service factors of restaurants, such as food quality, service quality, atmosphere, and price, affect the customer’s satisfaction, revisit intention, and likelihood of recommendation.
Based on the above review of literature regarding DINESERV factors, the following research questions were derived:
  • Research Question 1: Which institutional DINESERV factors will have greater impacts on customer satisfaction?
  • Research Question 2: Which institutional DINESERV factors will have greater impacts on revisit intention?
  • Research Question 3: Which institutional DINESERV factors will have greater impacts on recommendations?
  • Research Question 4: Do DINESERV factors and the customers’ overall satisfaction levels differ with respect to different restaurants (between global restaurants and local restaurants)?
  • Research Question 5: Are there any significant relationships among customer satisfaction, revisit intention, and likelihood of recommendation?

3.2. Data Collection and Methods

Two of the most popular fast food restaurants in Ulaanbaatar were selected for the study: namely, Burger King and Berlin Burger. This study focused on comparing directly competing food chains; only two brands were studied. The limited fast food presence in Ulaanbaatar inevitably led to this limitation, but further research may take a more comprehensive approach of studying the entire fast food environment in Mongolia. Data were collected over a two-week period in October, 2018. The data analysis was based on 151 valid questionnaire responses collected through Google surveys. The period of data collection was short, and for this reason, only 151 questionnaires were returned.
Data were analyzed using the statistical package SPSS. A structured questionnaire using a five-point Likert scale was used to collect the data. The content of the questionnaire was divided into four sections. The first section, related to the respondent’s demographic profile, included their age, gender, marital status, occupation, and income. The second section focused on how often the respondent eats out and what influences him/her to visit that restaurant. The third section measured the respondent’s perceptions of the independent variables in the fast food restaurant: atmosphere, service quality, price, and food quality. A five-point Likert scale ranging from 1 (strongly disagree) to 5 (strongly agree) was used to measure the customer’s perceptions of the factors. This was intended to help respondents make their choice for each question. The fourth section measured the respondent’s willingness to revisit and recommend the restaurant. The questionnaire consisted of 19 questions.

4. Results of the Study and Implications

4.1. Demographic Profile of Respondents

A descriptive statistical analysis was run on respondents’ demographic profiles. To gain a better understanding of the customer’s level of satisfaction from fast food restaurants, the demographic characteristics of the respondents were analyzed. The results are shown in Table 2. The demographic data of respondents, including gender, age, marital status, occupation, and income, are shown in Table 2. The sample contained more females (53.6%) than males (46.4%). Almost 52 percent of them were aged between 26 and 40 years old. Ninety of the respondents (59.6%) lived in Mongolia and 61 of them (40.4%) lived in South Korea. In terms of occupation, 40.4% of them were students and 40.4% of respondents worked in the private sector. A total of 38.4% of the respondents had an annual income of more than 1,500,000 tugruk, and 27.2% of them had an income between 1,000,000 and 1,500,000 tugruk.

4.1.1. Frequency of Visits of Respondents to Fast Food Restaurants

Table 3 shows the responses to how often the participants reported eating at the fast food restaurant. A total of 22.5% of Burger King customers reported eating out once a week, and 13.2% of them reported eating out once every two weeks. A total of 37.1% reported eating out once a month. The results also show that 7.3% of Mongolian fast food restaurant respondents reported eating out once a week, 10.6% reported eating out once every two weeks, and 30.5% reported eating out once a month.

4.1.2. Comparison of Mean for Each Item (t-Test)

The results of the t-tests on food quality, service quality, atmosphere, customer satisfaction, revisit intention, and likelihood of recommendation for Mongolian and global fast food restaurants are shown in Table 4.
Table 4 shows that the mean scores were higher for Burger King than Berlin Burger in all groups—that is, whether the respondent resided in Mongolia or Korea, they preferred Burger King, a global fast food chain. This trend shows consistency over all items. The restaurant temperature (3.5828) and food taste (3.5629) had the highest mean scores for the global fast food restaurant, while the variety of menu options (3.0331) and portions (3.0265) had the highest mean scores for the Mongolian fast food restaurant. Discount had the lowest mean score for both restaurants: 3.0530 for the global fast food restaurant and 2.5099 for the Mongolian fast food restaurant. Burger King outperformed Berlin Burger most in the “atmosphere” factor. Moreover, for the “good portions” and “valuable price” items, the score between the two fast food chains was smallest. Berlin Burger seemed to have an advantage in price relative to other items; although the difference was statistically significant, it was also the smallest.
In addition, Table 4 exhibits a difference in perception scores depending on whether the respondent was living in Korea or Mongolia. Overall, respondents residing in Korea gave higher scores for all items. Moreover, they regarded Burger King’s relative superiority over Berlin Burger less significant for most items; the score difference for the two fast food chains were smaller for this group. Such perception difference depending on the respondent’s residence may be due to several factors, including experience of other global fast food chains and long term perception. The score difference between Burger King and Berlin Burger was relatively smaller for Korea-residing respondents, especially for freshness and taste of food, and less so for items such as music and feeling, temperature, clean dining areas, and well-trained employees. These findings suggest that the positive reputation of Burger King in atmosphere-related areas had a lasting effect in comparison to food-related items.
Furthermore, one can also infer that such differences may be due to the fact that Mongolians residing in Korea have greater accessibility to fast food and are more familiar with it; therefore, these respondents may generally have more lenient standards for judging fast food options. Such findings imply the following: first, the preference for Burger King over Berlin Burger owes greatly to perception differences for the “atmosphere” factor. This suggests that Berlin Burger should focus on enhancing customer experiences regarding service and ambience. This is especially important as these items seemed to have a greater lasting effect on customer perception. Furthermore, as Burger King’s superiority in food quality was least significant, especially in the long-term perspective, it would be prudent for the brand to invest more resources in related areas.

4.2. Factor Analysis

The principal component analysis started with 16 items. After performing the principal component analysis with varimax rotation, the results revealed that the 16-item scale fell into four factors. All items had loadings of greater than 0.5, and there were no items that needed to be removed. Table 5 and Table 6 show the results of the four factors for Burger King and Berlin Burger.
A KMO test is a measure of how suited the data are for factor analysis. The test measures the sampling adequacy for each variable in the model and for the complete model. If the value for the KMO test is greater than 0.50, then a factor analysis can be done for the same data set. It should also be significant at the 5% level and the p-value should be less than 0.05. Based on Table 5, it can be observed that the KMO measure was 0.942, which meant that the variables were suitable for factor analysis.
Cronbach’s alpha was used to examine the internal reliability of the 16 items used to measure the four factors. The Cronbach’s alpha varies from 0 to 1, and a value of 0.6 or less indicates unsatisfactory reliability. Table 5 shows that all factors had values exceeding 0.6. The service quality was measured by five items and had the highest alpha coefficient of 0.977. Atmosphere was measured by five items and had an alpha coefficient of 0.969. Price was measured by two items and showed the lowest alpha coefficient of 0.897.
Table 6 shows that the KMO measure for Berlin Burger was 0.941, which meant that the variables used were suitable for factor analysis. It was also significant at the 5% level because the p-value was 0.000, which is less than 0.05. Table 6 also shows that the Cronbach’s alpha exceeded 0.6 for all factors. Service quality was measured by five items and showed the highest alpha coefficient of 0.983. Price was measured by two items and showed the lowest alpha coefficient of 0.871.

4.3. Factors Affecting Customer Satisfaction, Revisit Intention, and Recommendation

4.3.1. Customer Satisfaction

A regression analysis was conducted to investigate the influence of the institutional DINESERV factors on customer satisfaction. Table 7 shows the results of the regression analysis with the four factors as independent variables and customer satisfaction as the dependent variable.
Table 7 shows the regression results indicating that four factors had significant and positive effects on customer satisfaction. The adjusted R square value of this model, which was a more conservative estimate of the variance by considering error variance, was found to be 0.824, indicating that 82.4% of customer satisfaction could be explained by the four independent factors. Thus, the explanatory power of the model was satisfactory. Moreover, the coefficients of the four factors were significant at the 1% level, suggesting a positive relationship between customer satisfaction and food quality, service quality, atmosphere, and price. In other words, all factors (food quality, service quality, price and value, and atmosphere) were found to be significant predictors affecting customer satisfaction. Meanwhile, the “atmosphere” variable was shown to have the highest standardized coefficient (β = 0.550, p < 0.01) with regards to customer satisfaction for the global fast food restaurant, which implied that atmosphere was the most influential factor for predicting customer satisfaction in the case of Burger King. Next was food quality (β = 0.457, p < 0.01), followed by atmosphere (β = 0.454, p < 0.01) and service quality (β = 0.332, p < 0.01).
Table 8 indicates that the coefficients of the four factors were significant at the 1% level, suggesting a positive relationship between customer satisfaction and food quality, service quality, atmosphere, and price. The adjusted R square value of 0.768 indicated that 76.8% of the customer satisfaction could be explained by the four independent variables. The results showed that service quality was the highest standardized coefficient (β = 0.502, p < 0.01) of customer satisfaction for the Mongolian fast food restaurant, which implied that service quality was the most influential factor for Berlin Burger, followed by food quality (β = 0.441, p < 0.01), atmosphere (β = 0.415, p < 0.01), and service quality (β = 0.395, p < 0.01). All factors (food quality, service quality, price and value, and atmosphere) were found to be significant predictors affecting customer satisfaction for Berlin Burger.

4.3.2. Revisit Intention

Table 9 shows that the coefficients of the four factors were significant at the 1% level, suggesting a positive relationship between customer revisit intention and food quality, service quality, atmosphere, and price. The results indicated that price attained the highest beta coefficient, which implied that price was the most influential factor (β = 0.528, p < 0.01) in predicting customer revisit intention for the global fast food restaurant. The second highest was atmosphere (β = 0.475, p < 0.01), followed by food quality (β = 0.407, p < 0.01) and service quality (β = 0.275, p < 0.01). The adjusted R square value of 0.739 indicated that 73.9% of customer revisit intention was explained by the four factors. The results indicated that these factors had a positive impact on customer revisit intention.
Table 10 shows that the coefficients of the four factors for Berlin Burger were significant at the 1% level, suggesting a positive relationship between customer revisit intention and food quality, service quality, atmosphere, and price. The results indicate that service quality attained the highest standardized coefficient, which implies that service quality was the most influential factor (β = 0.517, p < 0.01) of customer revisit intention for the Mongolian fast food restaurant. The next was food quality (β = 0.416, p < 0.01), followed by price (β = 0.385, p < 0.01) and atmosphere (β = 0.377, p < 0.01). The adjusted R square value of 0.723 indicated that 72.3% of the customer revisit intention could be explained by the four independent variables. Research Question 2 asked whether food quality, service quality, atmosphere, and price have positive influences on the customer revisit intention. The results indicated that these factors had positive impacts on customer revisit intentions, supporting a positive answer to Research Question 2.

4.3.3. Recommendation

Table 11 shows that the coefficients of the four factors were significant at the 1% level, suggesting a positive relationship between customer likelihood of recommendation and food quality, service quality, atmosphere, and price. The regression results in Table 11 indicate that price attained the highest standardized coefficient, which implies that price was the most influential factor (β = 0.552, p < 0.01) affecting the likelihood of a customer recommending the global fast food restaurant. The next highest was atmosphere (β = 0.464, p < 0.01), followed by food quality (β = 0.406, p < 0.01) and service quality (β = 0.302, p < 0.01). The adjusted R square value of 0.770 indicates that 77% of the customer likelihood of recommendation could be explained by the four factors.
Table 12 indicates that the coefficients of the four factors were significant at the 1% level, suggesting a positive relationship between customer revisit intention and food quality, service quality, atmosphere, and price. The regression results indicate that service quality attained the highest standardized coefficient, which implies that service quality was the most influential factor (β = 0.464, p < 0.01) affecting the likelihood of a customer recommending the Mongolian fast food restaurant. The next highest was the price (β = 0.427, p < 0.01), followed by food quality (β = 0.396, p< 0.01) and atmosphere (β = 0.356, p < 0.01).

4.3.4. Comparison of Two Restaurants

Table 13 indicates that all four factors (food quality, service quality, atmosphere, and price) had significant effects on customer satisfaction, revisit intention, and customer likelihood of recommendation. However, differences between the global fast food restaurant and Mongolian fast food restaurant were found in terms of t-values. The t-values of the food quality, atmosphere, and price for the global fast food restaurant were higher than those of the Mongolian fast food restaurant, and the t-value of service quality was lower than the t-value of the Mongolian fast food restaurant. The results answered research question 4, showing that the DINESERV factors and the customers’ overall satisfaction level differed between the global and Mongolian restaurants.

4.4. The Relationship between Customer Satisfaction, Revisit Intention, and Recommendation

Research Question 5 asked whether there are any significant relationships among customer satisfaction, revisit intention, and likelihood of recommendation. The question can be interpreted through the following hypotheses.
Hypothesis 1. 
Customer satisfaction will have a positive influence on customer revisit intention and customer likelihood of recommendation.
Hypothesis 2. 
Customer revisit intention will have a positive influence on customer likelihood of recommendation.
In order to answer the research question about the association between customer satisfaction and revisit intention and likelihood of recommendation, the results of Pearson correlations for three variables are presented in Table 14.
Customer satisfaction was found to have a strong, positive relationship (r1 = 0.907 for Burger King and 0.919 for Berlin Burger, p < 0.01) with revisit intention. This result indicates a strong relationship between the satisfaction level of the respondents with their revisit intention. Customer satisfaction was also strongly positively correlated (r1 = 0.909 for Burger King and 0.913 for Berlin Burger, p < 0.01) with likelihood of recommendation. This high correlation shows that high customer satisfaction leads to a high likelihood of recommendation. In addition, likelihood of recommendation was strongly correlated (r1 = 0.884 for Burger King and 0.915 for Berlin Burger, p < 0.01) with revisit intention. The finding implies that likelihood of recommendation helped to enhance the revisit intention of fast food restaurant customers. Thus, Hypothesis 1, customer satisfaction will have a positive influence on revisit intention, was supported (p < 0.000). The results show that customer satisfaction had a significant effect on customer revisit intention for both restaurants. Furthermore, the hypothesis that customer satisfaction will have a positive influence on customer likelihood of recommendation was supported (p < 0.000) for both restaurants. Table 14 shows that the level of satisfaction had an effect on the global fast food restaurant and the Mongolian fast food restaurant. However, the t-values of revisit intention and likelihood of recommendation for the Mongolian fast food restaurant were higher than those for the global fast food restaurants. This means that customer satisfaction influenced customer revisit intention and likelihood of recommendation for the Mongolian fast food restaurant to a greater extent. Moreover, Hypothesis 2, customer revisit intention will have a positive influence on customer likelihood of recommendation, was supported (p < 0.000) for both restaurants.

4.5. Discussion and Implications

This research delves into the competitive advantages of global and local food chains for the sustainability of the Mongolian fast food industry, including suggestions regarding which factors are relatively more essential from the management perspective. Both the t-test and regression analysis show that the “atmosphere” factor, which includes music, comfortable seats, cleanliness, interior, and temperature, is a key asset of global franchises. Although brand perceptions of the global food chain were more positive than the local brand for all categories, both score differences and regression coefficients imply that atmosphere is the global food chain’s prime advantage over local ones. Furthermore, the results of this study show that this factor is especially important, since it seems to have an enduring effect on positive customer perceptions. These findings relay significant business implications; in order for local food chains to thrive, they must invest more resources into enhancing customer experiences related to the “atmosphere” category, and should continue to achieve comparative advantages in “service quality,” which was found to be the key element in predicting customer satisfaction for the local food chain.
This study also provides evidence regarding perception differences between customer groups that have greater accessibility to various franchises and those that have not. Compared to South Korea, residents of Mongolia have less experience in global food chains as the introduction of such franchises is very recent, and the simple presence of stores in Seoul and Ulaanbaatar is incomparable. Such environmental differences lead to different customer perceptions; customers residing in Korea appear to harbor more positive attitudes towards fast food in general, as scores for both franchises were higher than for respondents residing in Mongolia. Furthermore, the results show a difference in perception scores depending on whether the respondent was living in Korea or Mongolia. The score difference between Burger King and Berlin Burger was relatively smaller for Korea-residing respondents, especially for freshness and taste of food, and less so for items such as music and feeling, temperature, clean dining areas, and well-trained employees. These findings suggest that the positive reputation of Burger King in atmosphere-related areas has a lasting effect in comparison to food-related items. This suggests that Berlin Burger should focus on enhancing customer experiences regarding service and ambience. Furthermore, as Burger King’s superiority in food quality is least significant, especially in the long-term perspective, it would be prudent for the brand to invest more resources in related areas.

5. Conclusions

This study was conducted to gain a better understanding of customer satisfaction in restaurants by studying the factors of food quality, service quality, atmospherics, and price. It fulfilled its aims of identifying the relationships among the four variables with customer satisfaction, which leads to revisit intention and likelihood of recommendation. The results show that all four factors (food quality, service quality, price, and atmosphere of a restaurant) positively affect customer satisfaction, revisit intention and likelihood of recommendation for the global fast food and Mongolian restaurants. Moreover, the results show that customer satisfaction will have a positive influence on revisit intention and likelihood of customer recommendation for both restaurants. However, depending on whether it is a Mongolian fast food restaurant or a global fast food restaurant, the level of factors affecting customer satisfaction were different. For a global fast food chain, the restaurant atmosphere was considered the most important factor influencing customer satisfaction. Price was also considered the most important factor for customer revisit intention and likelihood of recommendation. This shows that customers of global fast food restaurants in Mongolia consider atmosphere to be the most important factor for customer satisfaction, revisit intention, and likelihood of customer recommendation. Thus, managers of global fast food restaurants in Mongolia should pay attention to the polite behavior of staff and whether there is a comfortable atmosphere, which, in turn, enhances customer satisfaction. For the Mongolian fast food restaurant, service quality was considered the most important factor influencing customer satisfaction, revisit intention, and likelihood of customer recommendation. Food quality was the second most important factor affecting customer satisfaction and revisit intention, and price was the second most important factor affecting customer recommendation. This means that customers of the Mongolian fast food restaurant put more focus on service quality and food quality. Thus, restaurant owners need to make a constant effort to improve service quality and offer delicious meals at valuable prices to their customers.
This study also showed a difference in perception scores depending on whether the respondent was living in Korea or Mongolia. Overall, respondents residing in Korea gave higher scores for all items. They regarded Burger King’s relative superiority over Berlin Burger less significant for most items. The score difference between Burger King and Berlin Burger was relatively smaller for Korea-residing respondents, especially for freshness and taste of food, and less so for items such as music and feeling, temperature, clean dining areas, and well-trained employees. These findings suggest that the positive reputation of Burger King in atmosphere-related areas has a lasting effect in comparison to food-related items. One can also infer that such differences may be due to the fact that Mongolians residing in Korea have greater accessibility to fast food and are more familiar with it; therefore, these respondents may generally have more lenient standards for judging fast food options.
This study aimed to investigate factors affecting customer satisfaction, revisit intention, and recommendations for fast food restaurants in Mongolia. As the industry has only recently developed, research is currently lacking in the field. This paper provides a starting point in research in the Mongolian fast food market, as well as customer perceptions. Furthermore, this study conducts an in-depth analysis of the difference between local and global fast food chains, especially depending on whether the customer resides in a fast food-friendly environment or not. The findings in this study also lead to important managerial implications regarding competitive advantages.
There are some limitations associated with this study. First, the sample size could have been larger. The period of data collection was short, and for this reason, only 151 questionnaires were returned. This suggests that the research should take place over a couple of months. Secondly, as our study focused on comparing directly competing food chains, only two brands were studied. The limited fast food presence in Ulaanbaatar inevitably led to this limitation, but further research may take a more comprehensive approach of studying the entire fast food environment in Mongolia. Further studies may also examine the restaurant service quality for a particular type of restaurant using a larger sample size or using different sets of factors for each type of restaurant. An extension of the study range and inclusion of other study methodologies to analyze the restaurant service quality may also develop the implications of this study.

Author Contributions

Conceptualization, A.N.-O. and S.-H.C.; formal analysis, A.N.-O. and S.-H.C.; methodology, S.-H.C.; software, A.N.-O. and S.-H.C.; visualization, A.N.-O. All authors have read and agreed to the published version of the manuscript.

Funding

This work was supported by the Ministry of Education of the Republic of Korea and the National Research Foundation of Korea (NRF-2019S1A5A2A01046398).

Conflicts of Interest

The authors declare no conflict of interest.

References

  1. Grand View Research. Fast Food & Quick Service Restaurant Market Size, Share & Trends Analysis Report by Type (Chain, Independent), by Cuisine (American, Turkish & Lebanese), by Region, and Segment Forecasts, 2020–2027. Available online: https://www.grandviewresearch.com/industry-analysis/fast-food-quick-service-restaurants-market (accessed on 6 August 2020).
  2. Abdelkafi, N.; Täuscher, K. Business Models for Sustainability from a System Dynamics Perspective. Organ. Environ. 2015, 29, 74–96. [Google Scholar] [CrossRef]
  3. Gupta, S.; McLaughlin, E.; Gomez, M. Guest Satisfaction and Restaurant Performance. In The Next Frontier of Restaurant Management: Harnessing Data to Improve Guest Service and Enhance the Employee Experience; Cornell University Press: Ithaca, NY, USA, 2019; pp. 33–53. [Google Scholar]
  4. Mongolian Business Sectors. Available online: http://www.mse.mn/uploads/files/mongolian%20business%20sectors%201_compressed.pdf (accessed on 6 August 2020).
  5. Mongolia GDP Growth Rate YoY. Available online: https://tradingeconomics.com/mongolia/gdp-growth (accessed on 6 August 2020).
  6. Zhu, Z. Burger King Opens in Mongolia, Bringing Burgers to Their Birthplace. Available online: https://asiamattersforamerica.org/articles/burger-king-opens-in-mongolia-bringing-burgers-to-their-birthplace (accessed on 6 August 2020).
  7. Great Food Comes First. Available online: http://www.burgerking.mn (accessed on 6 August 2020).
  8. Yonhap, S. Korean Fast-Food Chain Lotteria Opens in Mongolia. Available online: http://www.koreaherald.com/view.php?ud=20180625000515 (accessed on 6 August 2020).
  9. Gikonyo, L.; Berndt, A.; Wadawi, J. Critical Success Factors for Franchised Restaurants Entering the Kenyan Market. SAGE Open 2015, 5, 1–8. [Google Scholar] [CrossRef] [Green Version]
  10. Markovic, S.; Raspor, S.; Sergaric, K. Does restaurant performance meet customers’ expectations? An assessment of restaurant service quality using a modified DINESERV approach. Tour. Hosp. Manag. 2010, 16, 81–195. [Google Scholar]
  11. Parasuraman, A.; Zeithaml, V.A.; Berry, L.L. SERVQUAL: A Multiple-Item Scale for Measuring Consumer Perceptions of Service Quality. J. Retail. 1988, 64, 12–40. [Google Scholar]
  12. Stevens, P.; Knutson, B.; Patton, M. Dineserv: A Tool for Measuring Service Quality in Restaurants. Cornell Hotel. Restaur. Adm. Q. 1995, 36, 56–60. [Google Scholar] [CrossRef]
  13. Qu, H. Determinant Factors and Choice Intention for Chinese Restaurant Dining. J. Restaur. Foodserv. Mark. 1997, 2, 35–49. [Google Scholar] [CrossRef]
  14. Pettijohn, L.S.; Pettijohn, C.E.; Luke, R.H. An Evaluation of Fast Food Restaurant Satisfaction. J. Restaur. Foodserv. Mark. 1997, 2, 3–20. [Google Scholar] [CrossRef]
  15. Rashid, I.; Abdullah, M. The impact of service quality and customer satisfaction on customer’s loyalty: Evidence from Fast Food restaurant of Malaysia. Int. J. Inf. Bus. Manag. 2015, 7, 784–793. [Google Scholar]
  16. Brady, M.K.; Cronin, J.J. Customer Orientation. J. Serv. Res. 2001, 3, 241–251. [Google Scholar] [CrossRef]
  17. Namin, A. Revisiting customers’ perception of service quality in fast food restaurants. J. Retail. Consum. Serv. 2017, 34, 70–81. [Google Scholar] [CrossRef]
  18. Namkung, Y.; Jang, S. Does Food Quality Really Matter in Restaurants? Its Impact on Customer Satisfaction and Behavioral Intentions. J. Hosp. Tour. Res. 2007, 31, 387–409. [Google Scholar] [CrossRef]
  19. Ha, J.; Jang, S. The effects of dining atmospherics on behavioral intentions through quality perception. J. Serv. Mark. 2012, 26, 204–215. [Google Scholar] [CrossRef]
  20. Ryu, K.; Han, H. Influence of the Quality of Food, Service, and Physical Environment on Customer Satisfaction and Behavioral Intention in Quick-Casual Restaurants: Moderating Role of Perceived Price. J. Hosp. Tour. Res. 2009, 34, 310–329. [Google Scholar] [CrossRef]
  21. Peri, C. The universe of food quality. Food Qual. Prefer. 2006, 17, 3–8. [Google Scholar] [CrossRef]
  22. Kumar, I.; Garg, R.; Rahman, Z. Influence of retail atmospherics on customer value in an emerging market. Great Lakes Her. 2010, 4, 1–13. [Google Scholar]
  23. Banerjee, S.; Singhania, S. Determinants of Customer Satisfaction, Revisit Intentions and Word of Mouth in the Restaurant Industry–Study Conducted In Selective Outlets of South Kolkata. Int. J. Bus. Manag. Invent. 2018, 6, 63–72. [Google Scholar]
  24. Andaleeb, S.S.; Conway, C. Customer satisfaction in the restaurant industry: An examination of the transaction-specific model. J. Serv. Mark. 2006, 20, 3–11. [Google Scholar] [CrossRef]
  25. Oliver, R.L. A Cognitive Model of the Ancedents and Consequences of Satisfaction Decisions. J. Mark. Res. 1980, 17, 460–469. [Google Scholar] [CrossRef]
  26. Fornell, C. A national customer satisfaction barometer: The Swedish experience. J. Mark. 1992, 56, 6–21. [Google Scholar] [CrossRef]
  27. Yan, X.; Wang, J.; Chau, M. Customer revisit intention to restaurants: Evidence from online reviews. Inf. Syst. Front. 2013, 17, 645–657. [Google Scholar] [CrossRef]
  28. Oh, H. Diners’ Perceptions of Quality, Value, and Satisfaction. Cornell Hotel. Restaur. Adm. Q. 2000, 41, 58–66. [Google Scholar] [CrossRef]
  29. Weiss, R.; Feinstein, A.H.; Dalbor, M. Customer Satisfaction of Theme Restaurant Attributes and Their Influence on Return Intent. J. Foodserv. Bus. Res. 2004, 7, 23–41. [Google Scholar] [CrossRef]
  30. Chen, P.-T.; Hu, H.-H. How determinant attributes of service quality influence customer-perceived value: An empirical investigation of the Australian coffee outlet industry. Int. J. Contemp. Hosp. Manag. 2010, 22, 535–551. [Google Scholar] [CrossRef]
  31. Kim, K.-J.; Choi, K. Bridging the Perception Gap between Management and Customers on DINESERV Attributes: The Korean All-You-Can-Eat Buffet. Sustainability 2019, 11, 5212. [Google Scholar] [CrossRef] [Green Version]
  32. Markovic, S.; Komsic, J.; ve Stifanic, M. Measuring Service Quality in City Restaurant Settings Using DINESERV Scale. 2013. Available online: http://www.wseas.us/elibrary/conferences/2013/Dubrovnik/MATREFC/MATREFC-27.pdf (accessed on 14 April 2017).
  33. Adeinat, I. Measuring Service Quality Efficiency Using Dineserv. Int. J. Qual. Res. 2019, 13, 591–604. [Google Scholar] [CrossRef]
  34. Knutson, B.J.; Stevens, P.; Patton, M. DINESERV. J. Hosp. Leis. Mark. 1996, 3, 35–44. [Google Scholar] [CrossRef]
  35. Kim, H.J.; McCahon, C.; Miller, J. Assessing Service Quality in Korean Casual-Dining Restaurants Using DINESERV. J. Foodserv. Bus. Res. 2003, 6, 67–86. [Google Scholar] [CrossRef]
  36. Bougoure, U.-S.; Neu, M.-K. Service Quality in the Malaysian Fast Food Industry: An Examination Using DINESERV. Serv. Mark. Q. 2010, 31, 194–212. [Google Scholar] [CrossRef]
  37. Wang, C.H.; Lin, I.H.; Tsai, J.Y. Combining fuzzy integral and GRA method for evaluating the service quality of fast-food restaurants. J. Interdiscip. Math. 2018, 21, 447–456. [Google Scholar] [CrossRef]
  38. Keith, N.K.; Simmers, C.S. Measuring Service Quality Perceptions of Restaurant Experiences: The Disparity Between Comment Cards and DINESERV. J. Foodserv. Bus. Res. 2011, 14, 20–32. [Google Scholar] [CrossRef]
  39. Polyorat, K.; Sophonsiri, S. The influence of service quality dimensions on customer satisfaction and customer loyalty in the chain restaurant context: A Thai case. J. Glob. Bus. Technol. 2010, 6, 64–76. [Google Scholar]
  40. Hansen, K.V. Development of SERVQUAL and DINESERV for Measuring Meal Experiences in Eating Establishments. Scand. J. Hosp. Tour. 2014, 14, 116–134. [Google Scholar] [CrossRef]
  41. Kukanja, M.; Planinc, T. Toward cost-effective service excellence: Exploring the relationship between managers’ perceptions of quality and the operational efficiency and profitability of restaurants. Qual. Manag. J. 2020, 27, 95–105. [Google Scholar] [CrossRef]
  42. Kim, W.G.; Ng, C.Y.N.; Kim, Y.-S. Influence of institutional DINESERV on customer satisfaction, return intention, and word-of-mouth. Int. J. Hosp. Manag. 2009, 28, 10–17. [Google Scholar] [CrossRef]
  43. Tan, Q.; Oriade, A.; Fallon, P. Service quality and customer satisfaction in Chinese fast food sector: A proposal for CFFRSERV. Adv. Hosp. Tour. Res. 2014, 2, 30–53. [Google Scholar]
  44. DiPietro, R. Restaurant and foodservice research. Int. J. Contemp. Hosp. Manag. 2017, 29, 1203–1234. [Google Scholar] [CrossRef]
  45. Marinković, V.; Senic, V.; Mimovic, P.M. Factors affecting choice and image of ethnic restaurants in Serbia. Br. Food J. 2015, 117, 1903–1920. [Google Scholar] [CrossRef]
  46. Oyewole, P. Multiattribute Dimensions of Service Quality in the All-You-Can-Eat Buffet Restaurant Industry. J. Hosp. Mark. Manag. 2013, 22, 1–24. [Google Scholar] [CrossRef]
  47. Wu, H.-C.; Mohi, Z. Assessment of Service Quality in the Fast-Food Restaurant. J. Foodserv. Bus. Res. 2015, 18, 358–388. [Google Scholar] [CrossRef]
  48. Ulkhaq, M.M.; Nartadhi, R.L.; Akshinta, P.Y. Evaluating Service Quality of Korean Restaurants: A Fuzzy Analytic Hierarchy Approach. Ind. Eng. Manag. Syst. 2016, 15, 77–91. [Google Scholar] [CrossRef] [Green Version]
Figure 1. Research model.
Sustainability 12 07435 g001
Table 1. Factors, items, and questionnaire sources.
FactorsItemsSources
Food qualityTaste of food[43]
[44]
[42]
[45]
Freshness of food
Menu variety
Good portions
Service qualityKindness[15]
[46]
[19]
Good attitude
Quick service response
Well trained
Chef’s knowledge
AtmosphereGood interior and decoration[43]
[47]
[48]
Clean dining areas and restroom
Comfortable seats
Comfortable temperature
Music and pleasant feeling
PriceValuable price[46]
[42,44]
Discount
SatisfactionOverall satisfaction[10]
RevisitRevisit[27,29]
RecommendationRecommendation[30]
Table 2. Demographic characteristics of the respondents (n = 151).
ItemsFrequencyPercent
Country of residenceMongolia9059.6%
South Korea6140.4%
GenderMale7046.4%
Female8153.6%
Age18–256442.4%
26–407851.7%
41–6096%
61 and above00%
Marital statusMarried6140.4%
Single9059.6%
OccupationStudent6140.4%
Civil servant127.9%
Private sector6140.4%
Others1711.3%
Income
(tugruk)
<500,000127.9%
500,000–1,000,0004026.5%
1,000,000–1,500,0004127.2%
>1,500,0005838.4%
Table 3. Demographic profile of respondents.
Frequency of VisitBurger KingBerlin Burger
No. of RespondentsPercentNo. of RespondentsPercent
Once a week2722.5467.3
Once every two weeks3213.21610.6
Once a month6637.11130.5
Total12572.87348.3
System (missing)2627.27851.7
Total151100151100
Table 4. t-test of means between Burger King vs. Berlin Burger.
FactorsItemsBurger King vs. Berlin Burger
Residence (Mongolia)
n = 90
Residence (Korea)
n = 61
Total
n = 151
Food qualityTaste of food3.4889 vs. 2.6556 *3.6721 vs. 3.3443 **3.5629 vs. 2.9338 *
Freshness3.4111 vs. 2.6111 *3.5410 vs. 3.2787 ***3.4636 vs. 2.8808 *
Menu variety3.2360 vs. 2.8000 *3.6885 vs. 3.3770 **3.4200 vs. 3.0331 *
Good Portions3.1910 vs. 2.8000 **3.6885 vs. 3.3607 **3.3933 vs. 3.0265 *
Service qualityKindness3.4889 vs. 2.6222 *3.6230 vs. 2.9836 *3.5430 vs. 2.7682 *
Good attitude3.4778 vs. 2.6333 *3.6393 vs. 3.0000 *3.5430 vs.2.7815 *
Quick service3.3778 vs. 2.6111 *3.5902 vs. 3.0656 *3.4636 vs. 2.7947 *
Well trained3.4000 vs. 2.6333 *3.6066 vs. 2.9508 *3.4834 vs. 2.7616 *
Chef’s knowledge3.3778 vs. 2.6556 *3.5738 vs. 3.0000 *3.4570 vs. 2.7947 *
AtmosphereInterior/decoration3.4000 vs. 2.5111 *3.6885 vs. 3.0000 *3.5166 vs. 2.7086 *
Clean dining areas3.3556 vs. 2.5333 *3.6230 vs. 2.9016 *3.4636 vs. 2.6821 *
Comfortable seats3.4444 vs. 2.5333 *3.6885 vs. 3.0328 *3.5430 vs. 2.7351 *
Temperature3.4889 vs. 2.7111 *3.7213 vs. 3.0164 *3.5828 vs. 2.8344 *
Music and feeling3.2333 vs. 2.4000 *3.6721 vs. 2.9016 *3.4106 vs. 2.6026 *
PriceValuable price3.0222 vs. 2.7333 **3.6230 vs. 3.1311 *3.2649 vs. 2.8940 *
Discount2.7333 vs. 2.3333 *3.5246 vs. 2.7705 *3.0530 vs. 2.5099 *
Satisfaction3.2111 vs. 2.5111 *3.5410 vs. 3.0000 *3.3444 vs. 2.7086 *
Revisit intention3.1444 vs. 2.4333 *3.6557 vs. 3.1148 *3.3510 vs. 2.7086 *
Recommendation3.0333 vs. 2.3000 *3.5574 vs. 3.0000 *3.2450 vs. 2.5828 *
* denotes p < 0.01, ** denotes p < 0.05, *** denotes p < 0.1.
Table 5. Rotated Component Matrix (Burger King).
ItemsFactors
Service Quality (SQ)Atmosphere
(A)
Food Quality (FQ)Price
(P)
Cronbach’s Alpha
Well trained (SQ4)
Attitude (SQ2)
Availability (SQ3)
Staff knowledge (SQ5)
Kindness (SQ1)
0.8230.3790.2820.2100.977
0.8080.3960.2450.257
0.8050.3750.3110.216
0.7950.3120.3380.227
0.7760.3670.3040.250
Temperature (A4)
Comfortable seats (A3)
Interior (A1)
Cleanliness (A2)
Music (A5)
0.3310.7960.3920.1590.969
0.3830.7830.3510.218
0.4280.7710.2240.252
0.3970.7520.2630.316
0.4030.7210.2350.3610.931
Fresh (FQ2)
Tasty (FQ1)
Variety of menus (FQ3)
Good portions (FQ4)
0.3010.4060.7670.175
0.4410.3460.7360.196
0.2830.2770.7040.429
0.2980.1990.6930.457
Discount (P2)
Value (P1)
0.2460.2870.2640.8390.897
0.2950.3020.3620.757
KMO0.942
Bartlett’s Test of SphericityChi-square3368.902
df (sig.)120 (0.000)
Table 6. Rotated Component Matrix (Berlin Burger).
ItemsComponent
Service Quality (SQ)Atmosphere
(A)
Food Quality (FQ)Price
(P)
Cronbach’s Alpha
Staff knowledge (SQ5)0.7790.3580.3180.3290.983
Availability (SQ3)0.7760.3510.4020.240
Attitude (SQ2)0.7740.3880.3730.202
Well trained (SQ4)0.7550.3740.4270.242
Kindness (SQ1)0.7330.3890.4500.202
Variety of menu (FQ3)0.3620.8420.2660.1800.968
Tasty (FQ1)0.3340.7980.3400.240
Good portions (FQ4)0.3320.7820.3290.243
Fresh (FQ2)0.3400.7650.3460.288
Music (A5)0.3810.2110.7790.3020.967
Comfortable seats (A3)0.3390.4380.7690.208
Cleanliness (A2)0.4180.3350.7420.250
Interior (A1)0.4060.4260.7250.232
Temperature (A4)0.4250.3890.6210.304
Discount (P2)
Value (P1)
0.2710.2590.4280.7670.871
0.3660.4890.2440.687
KMO0.941
Bartlett’s Test of SphericityChi-square3964.552
df (sig.)120(0.000)
Table 7. Regression result for customer satisfaction (Burger King).
FactorsCustomer Satisfaction
Unstandardized
Coefficient
Standardized Coefficientst-ValueSig.
BStd. ErrorBeta
Constant3.3470.041 82.217 *0.000
Food quality0.5430.0410.45713.295 *0.000
Service quality0.3940.0410.3329.646 *0.000
Atmosphere0.6530.0410.55015.989 *0.000
Price0.5390.0410.45413.205 *0.000
* p < 0.01; R2 = 0.828, Adjusted R2 = 0.824.
Table 8. Regression result for customer satisfaction (Berlin Burger).
FactorsCustomer Satisfaction
Unstandardized
Coefficient
Standardized
Coefficients
t-ValueSig.
BStd. ErrorBeta
Constant2.7090.044 61.204 *0.000
Food quality0.4980.0440.44111.217 *0.000
Service quality0.5660.0440.50212.752 *0.000
Atmosphere0.4680.0440.41510.544 *0.000
Price0.4460.0440.39510.042 *0.000
* p < 0.01; R2 = 0.774, adjusted R2 = 0.768.
Table 9. Regression result for customer revisit intention (Burger King).
FactorsRevisit Intention
Unstandardized
Coefficient
Standardized Coefficientst-ValueSig.
BStd. ErrorBeta
Constant3.3530.051 65.243 *0.000
Food quality0.5020.0520.4079.730 *0.000
Service quality0.3390.0520.2756.567 *0.000
Atmosphere0.5850.0520.47511.352 *0.000
Price0.6510.0520.52812.624 *0.000
* p < 0.01; R2 = 0.746, adjusted R2 = 0.739.
Table 10. Regression result for customer revisit intention (Berlin Burger).
FactorsRevisit Intention
Unstandardized
Coefficient
Standardized Coefficientst-ValueSig.
BStd. ErrorBeta
Constant2.7090.050 54.321 *0.000
Food quality0.4840.0500.4169.674 *0.000
Service quality0.6020.0500.51712.024 *0.000
Atmosphere0.4390.0500.3778.767 *0.000
Price0.4480.0500.3858.953 *0.000
* p < 0.01; R2 = 0.730, adjusted R2 = 0.723.
Table 11. Regression result for customer recommendation (Burger King).
FactorsCustomer Recommendation
Unstandardized
Coefficient
Standardized Coefficientst-ValueSig.
BStd. ErrorBeta
Constant3.2470.048 67.590 *0.000
Food quality0.4980.0480.40610.324 *0.000
Service quality0.3710.0480.3027.689 *0.000
Atmosphere0.5690.0480.46411.804 *0.000
Price0.6760.0480.55214.028 *0.000
* p < 0.01; R2 = 0.776, adjusted R2 = 0.770.
Table 12. Regression result for customer recommendation (Berlin Burger).
FactorsCustomer Recommendation
Unstandardized
Coefficient
Standardized Coefficientst-ValueSig.
BStd. ErrorBeta
Constant2.5830.054 47.645 *0.000
Food quality0.4600.0540.3968.455 *0.000
Service quality0.5390.0540.4649.907 *0.000
Atmosphere0.4140.0540.3567.617 *0.000
Price0.4960.0540.4279.120 *0.000
* p < 0.01; R2 = 0.680, adjusted R2 = 0.672.
Table 13. Comparison of regression results for two restaurants.
ModelBurger King (p-Value)Berlin Burger (p-Value)
Customer SatisfactionRevisit
Intention
Customer
Recommendation
Customer SatisfactionRevisit
Intention
Customer
Recommendation
Constant3.3473.3533.2472.7092.7092.583
Food
Quality
13.295 *
(0.000)
9.730 *
(0.000)
10.324 *
(0.000)
11.217 *
(0.000)
9.674 *
(0.000)
8.455 *
(0.000)
Service Quality9.646 *
(0.000)
6.567 *
(0.000)
7.689 *
(0.000)
12.752 *
(0.000)
12.024 *
(0.000)
9.907 *
(0.000)
Atmosphere15.989 *
(0.000)
11.352 *
(0.000)
11.804 *
(0.000)
10.544 *
(0.000)
8.767 *
(0.000)
7.617 *
(0.000)
Price13.205 *
(0.000)
12.624 *
(0.000)
14.028 *
(0.000)
10.042 *
(0.000)
8.953 *
(0.000)
9.120 *
(0.000)
* p < 0.01.
Table 14. Pearson correlations for pairs.
PairsBurger King
(p-Value)
Berlin Burger
(p-Value)
Customer satisfaction vs. revisit intention (r1)0.907 *(0.000)0.919 *(0.000)
Customer satisfaction vs. recommendation (r2)0.909 *(0.000)0.913 *(0.000)
Recommendation vs. revisit intention (r3)0.884 *(0.000)0.915 *(0.000)
n = 151, * p < 0.01.

