Assessment of the Odour Impact Range of a Selected Agricultural Processing Plant

 ,
,  , , , and
Abstract
1. Introduction
2. Materials and Methods
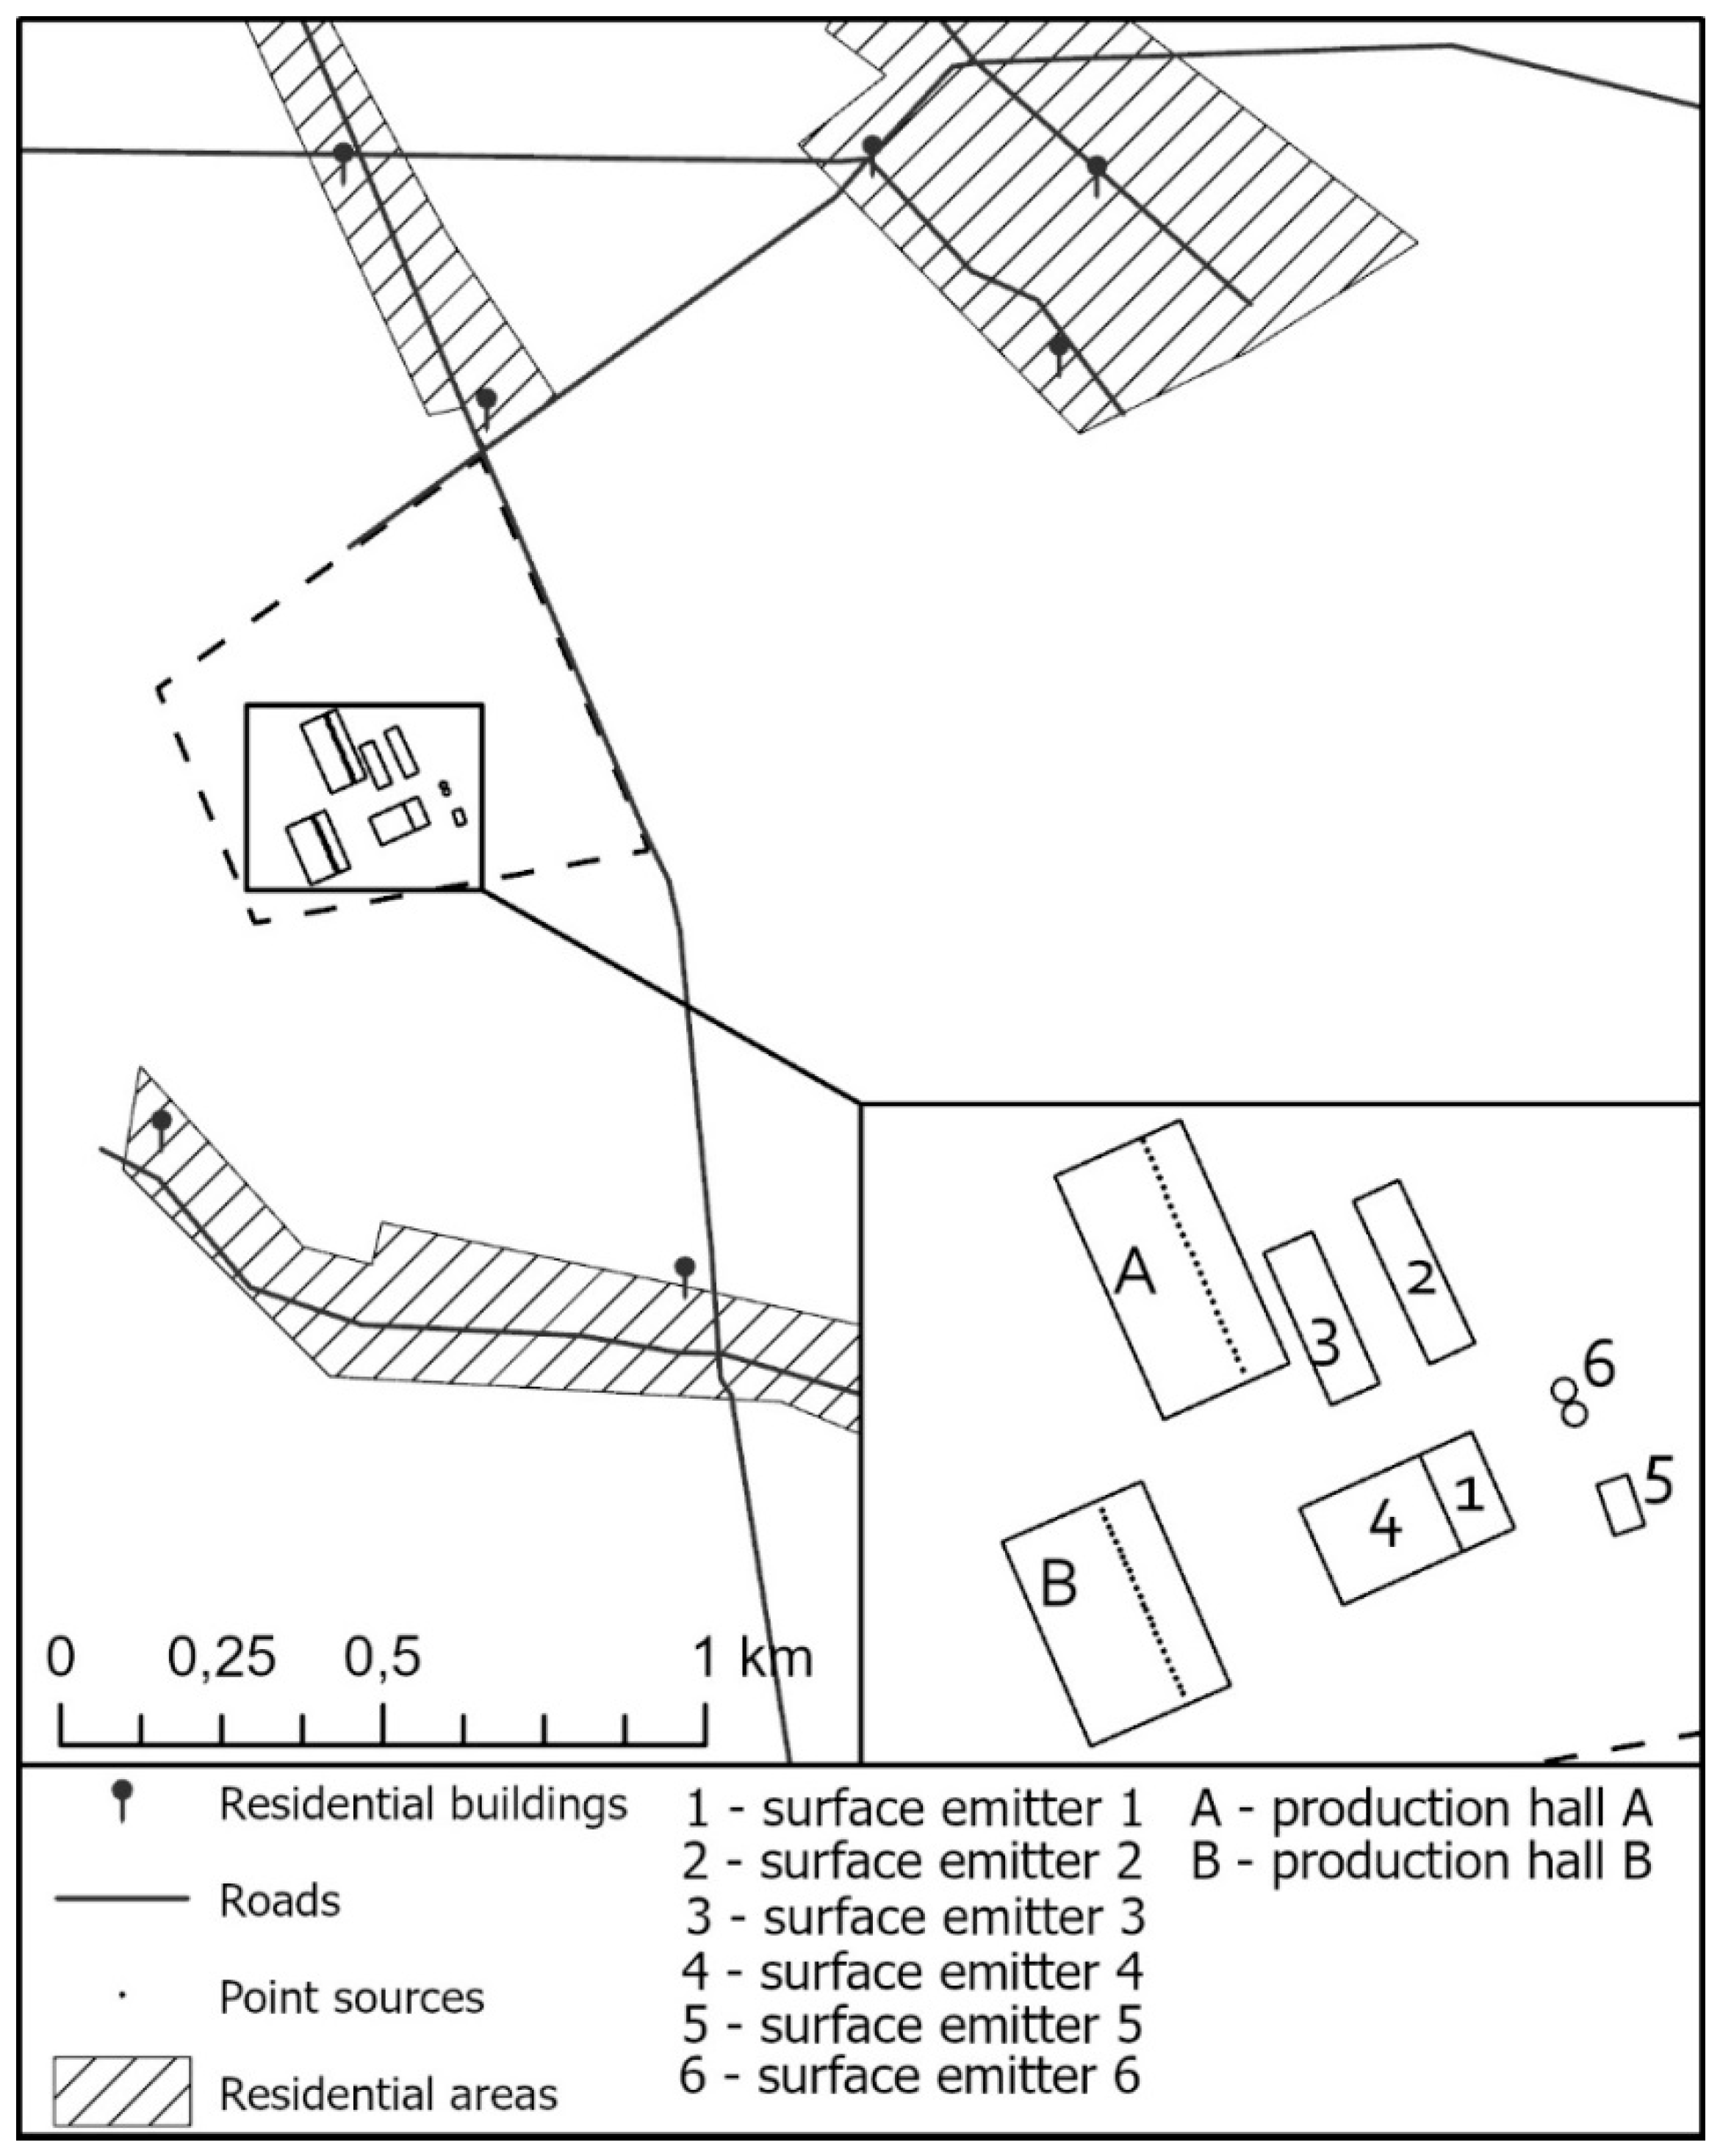
2.1. Characteristics of the Research Object
2.2. Research Methodology
2.2.1. Field Inspection
2.2.2. Determination of Odour Concentration and Odour Emissions from Selected Odour Emission Sources
2.2.3. Modelling of the Spread of Odour Pollutants
3. Research Results and Discussion
3.1. Odour Concentration Results
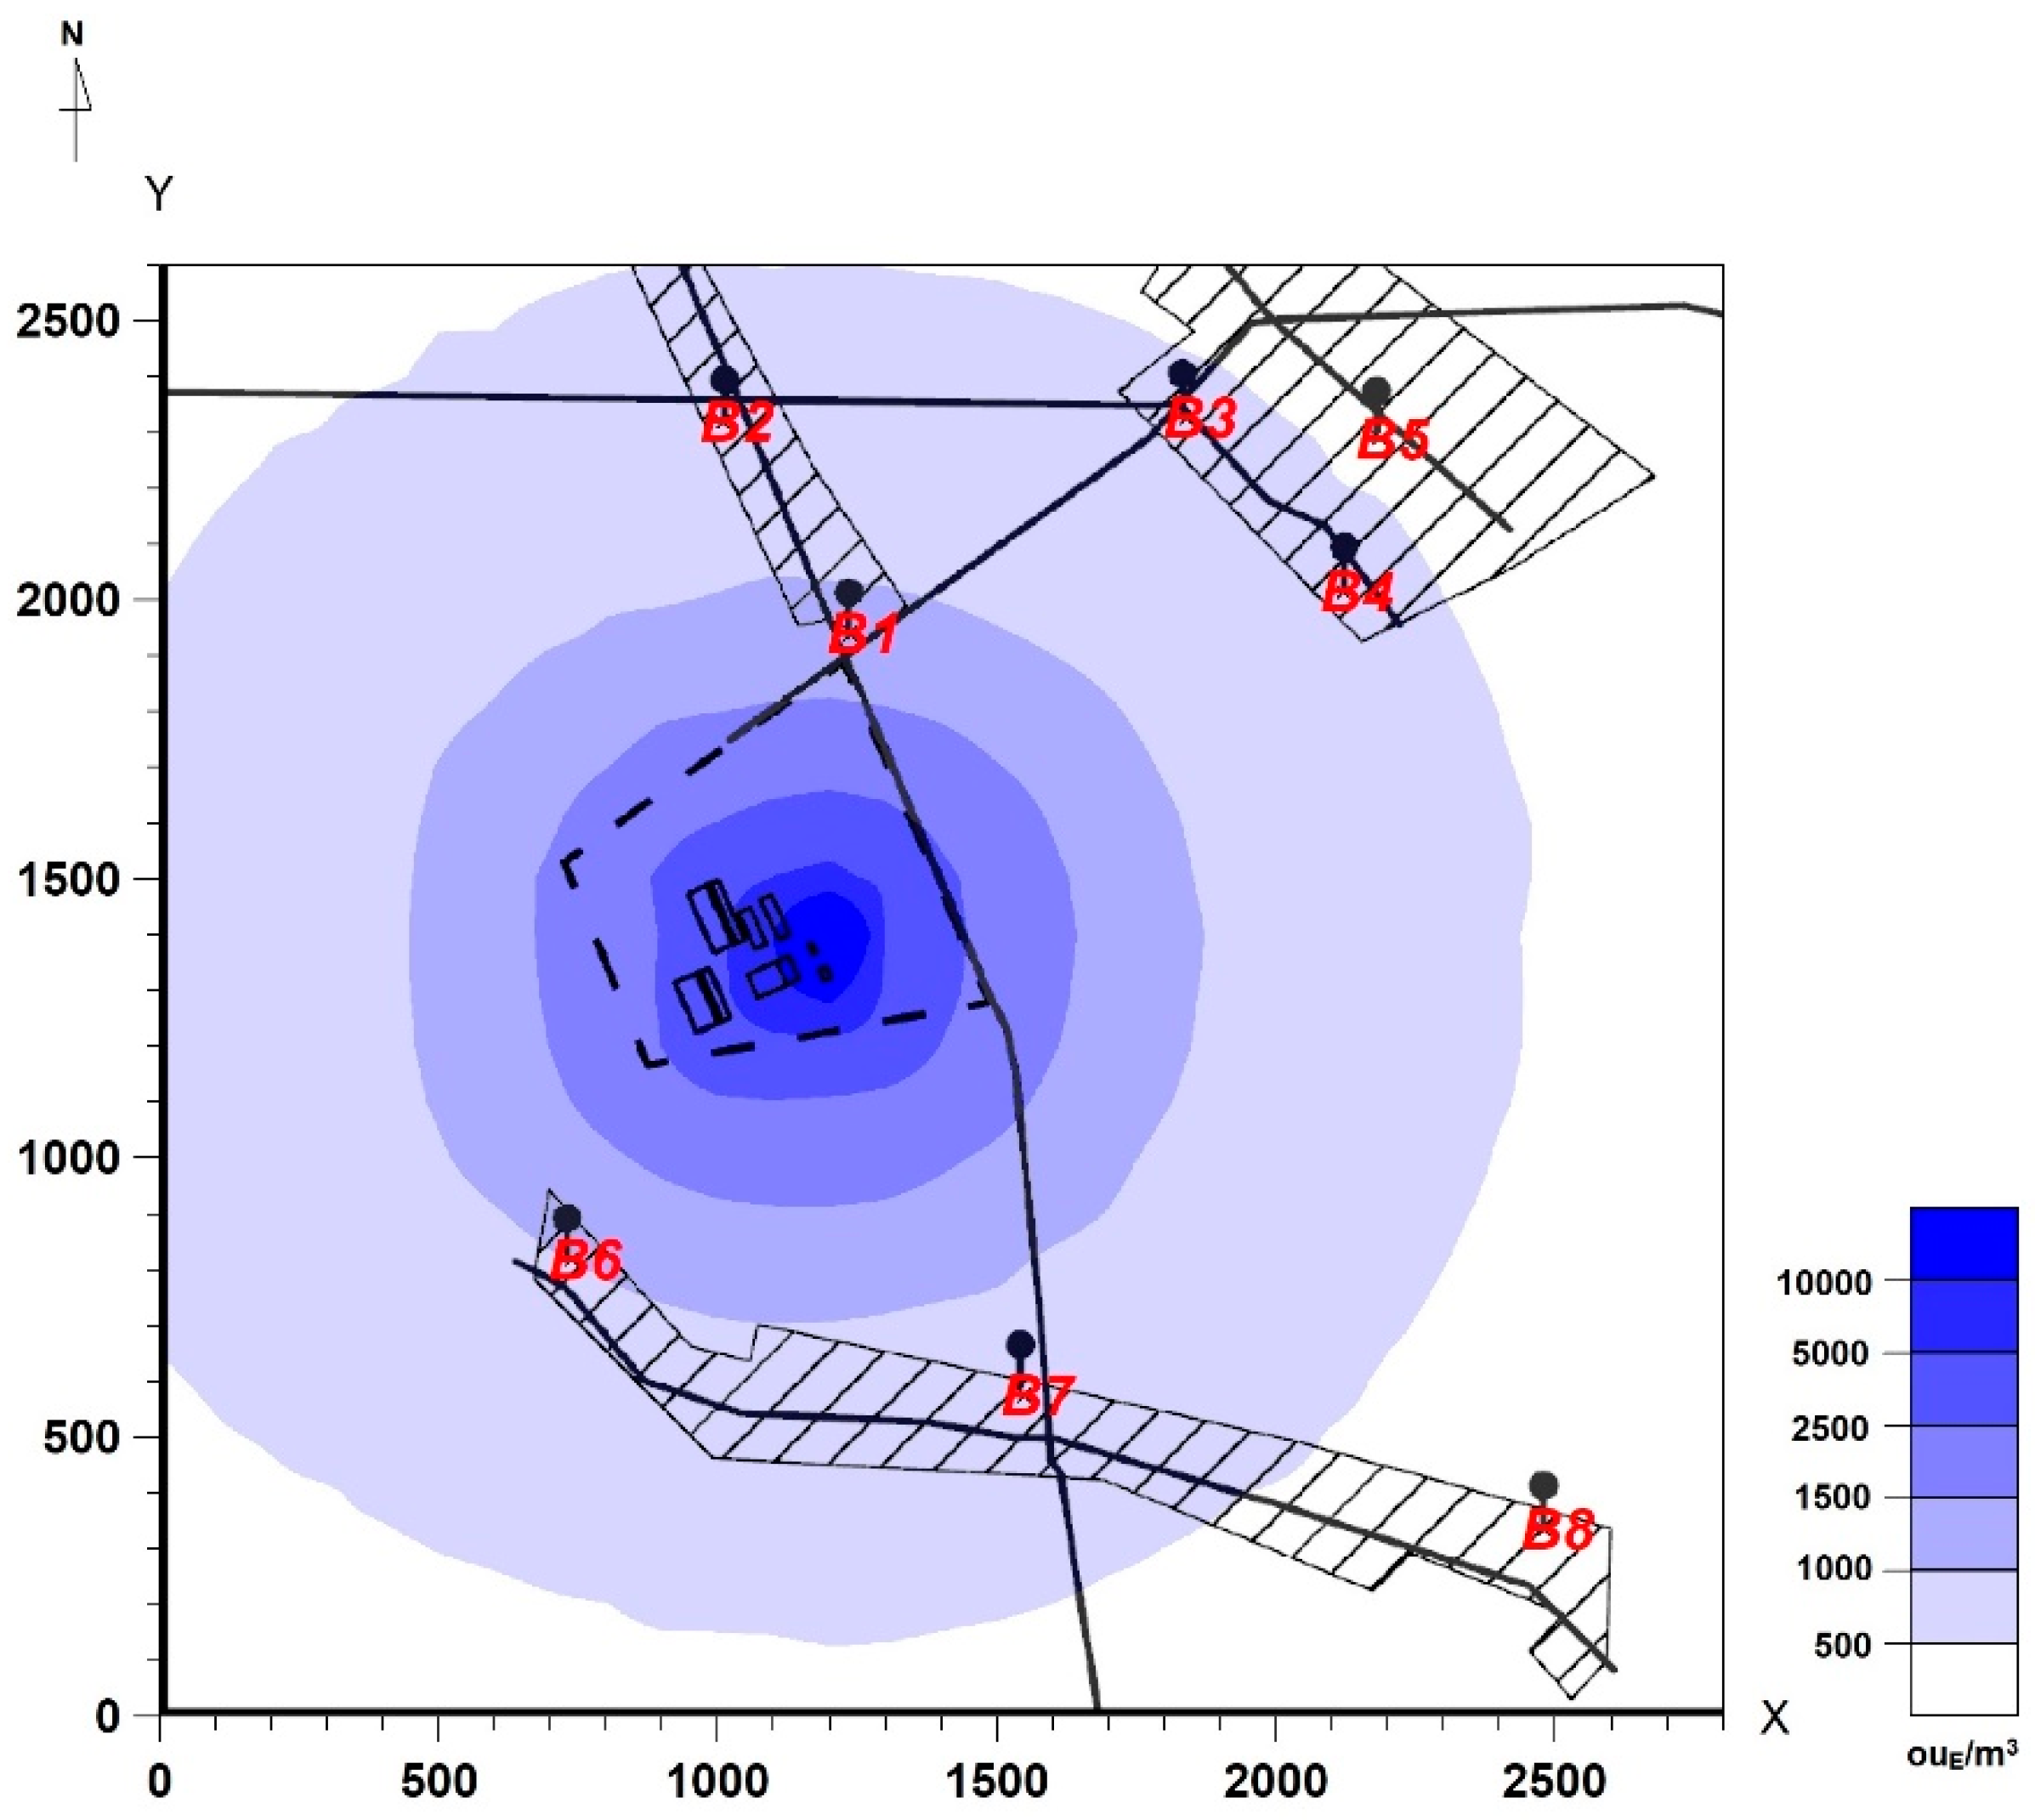
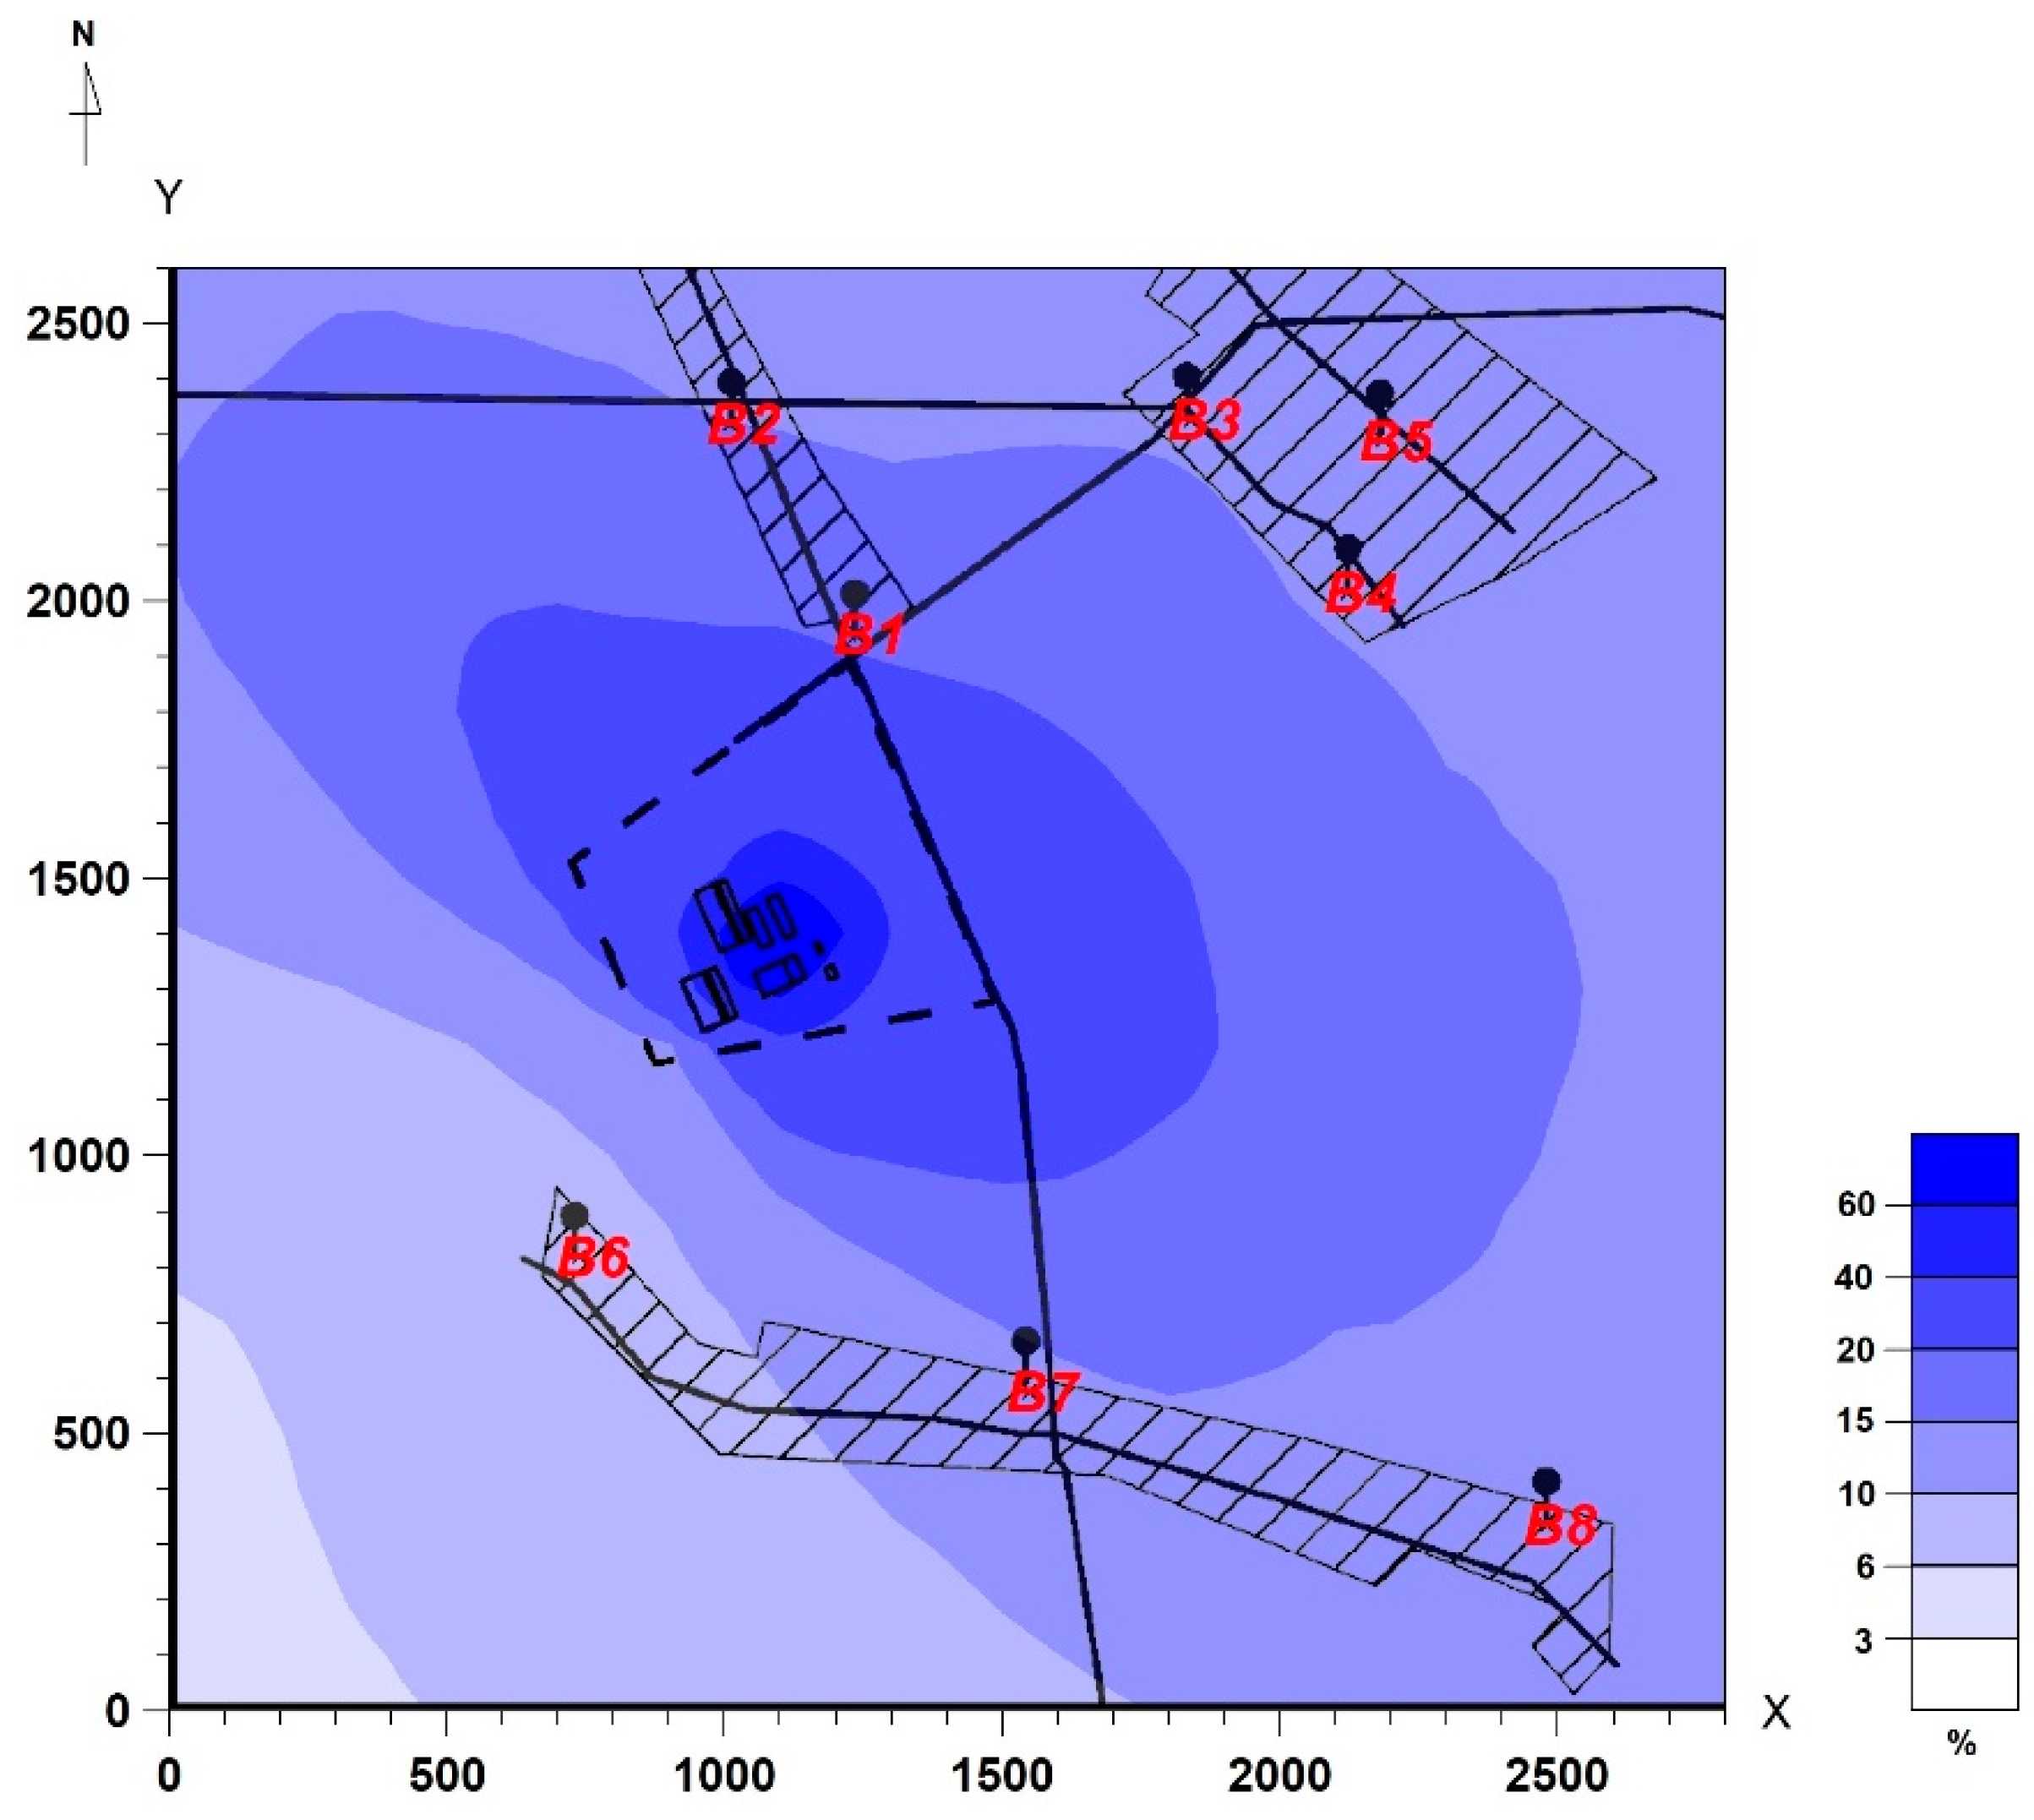
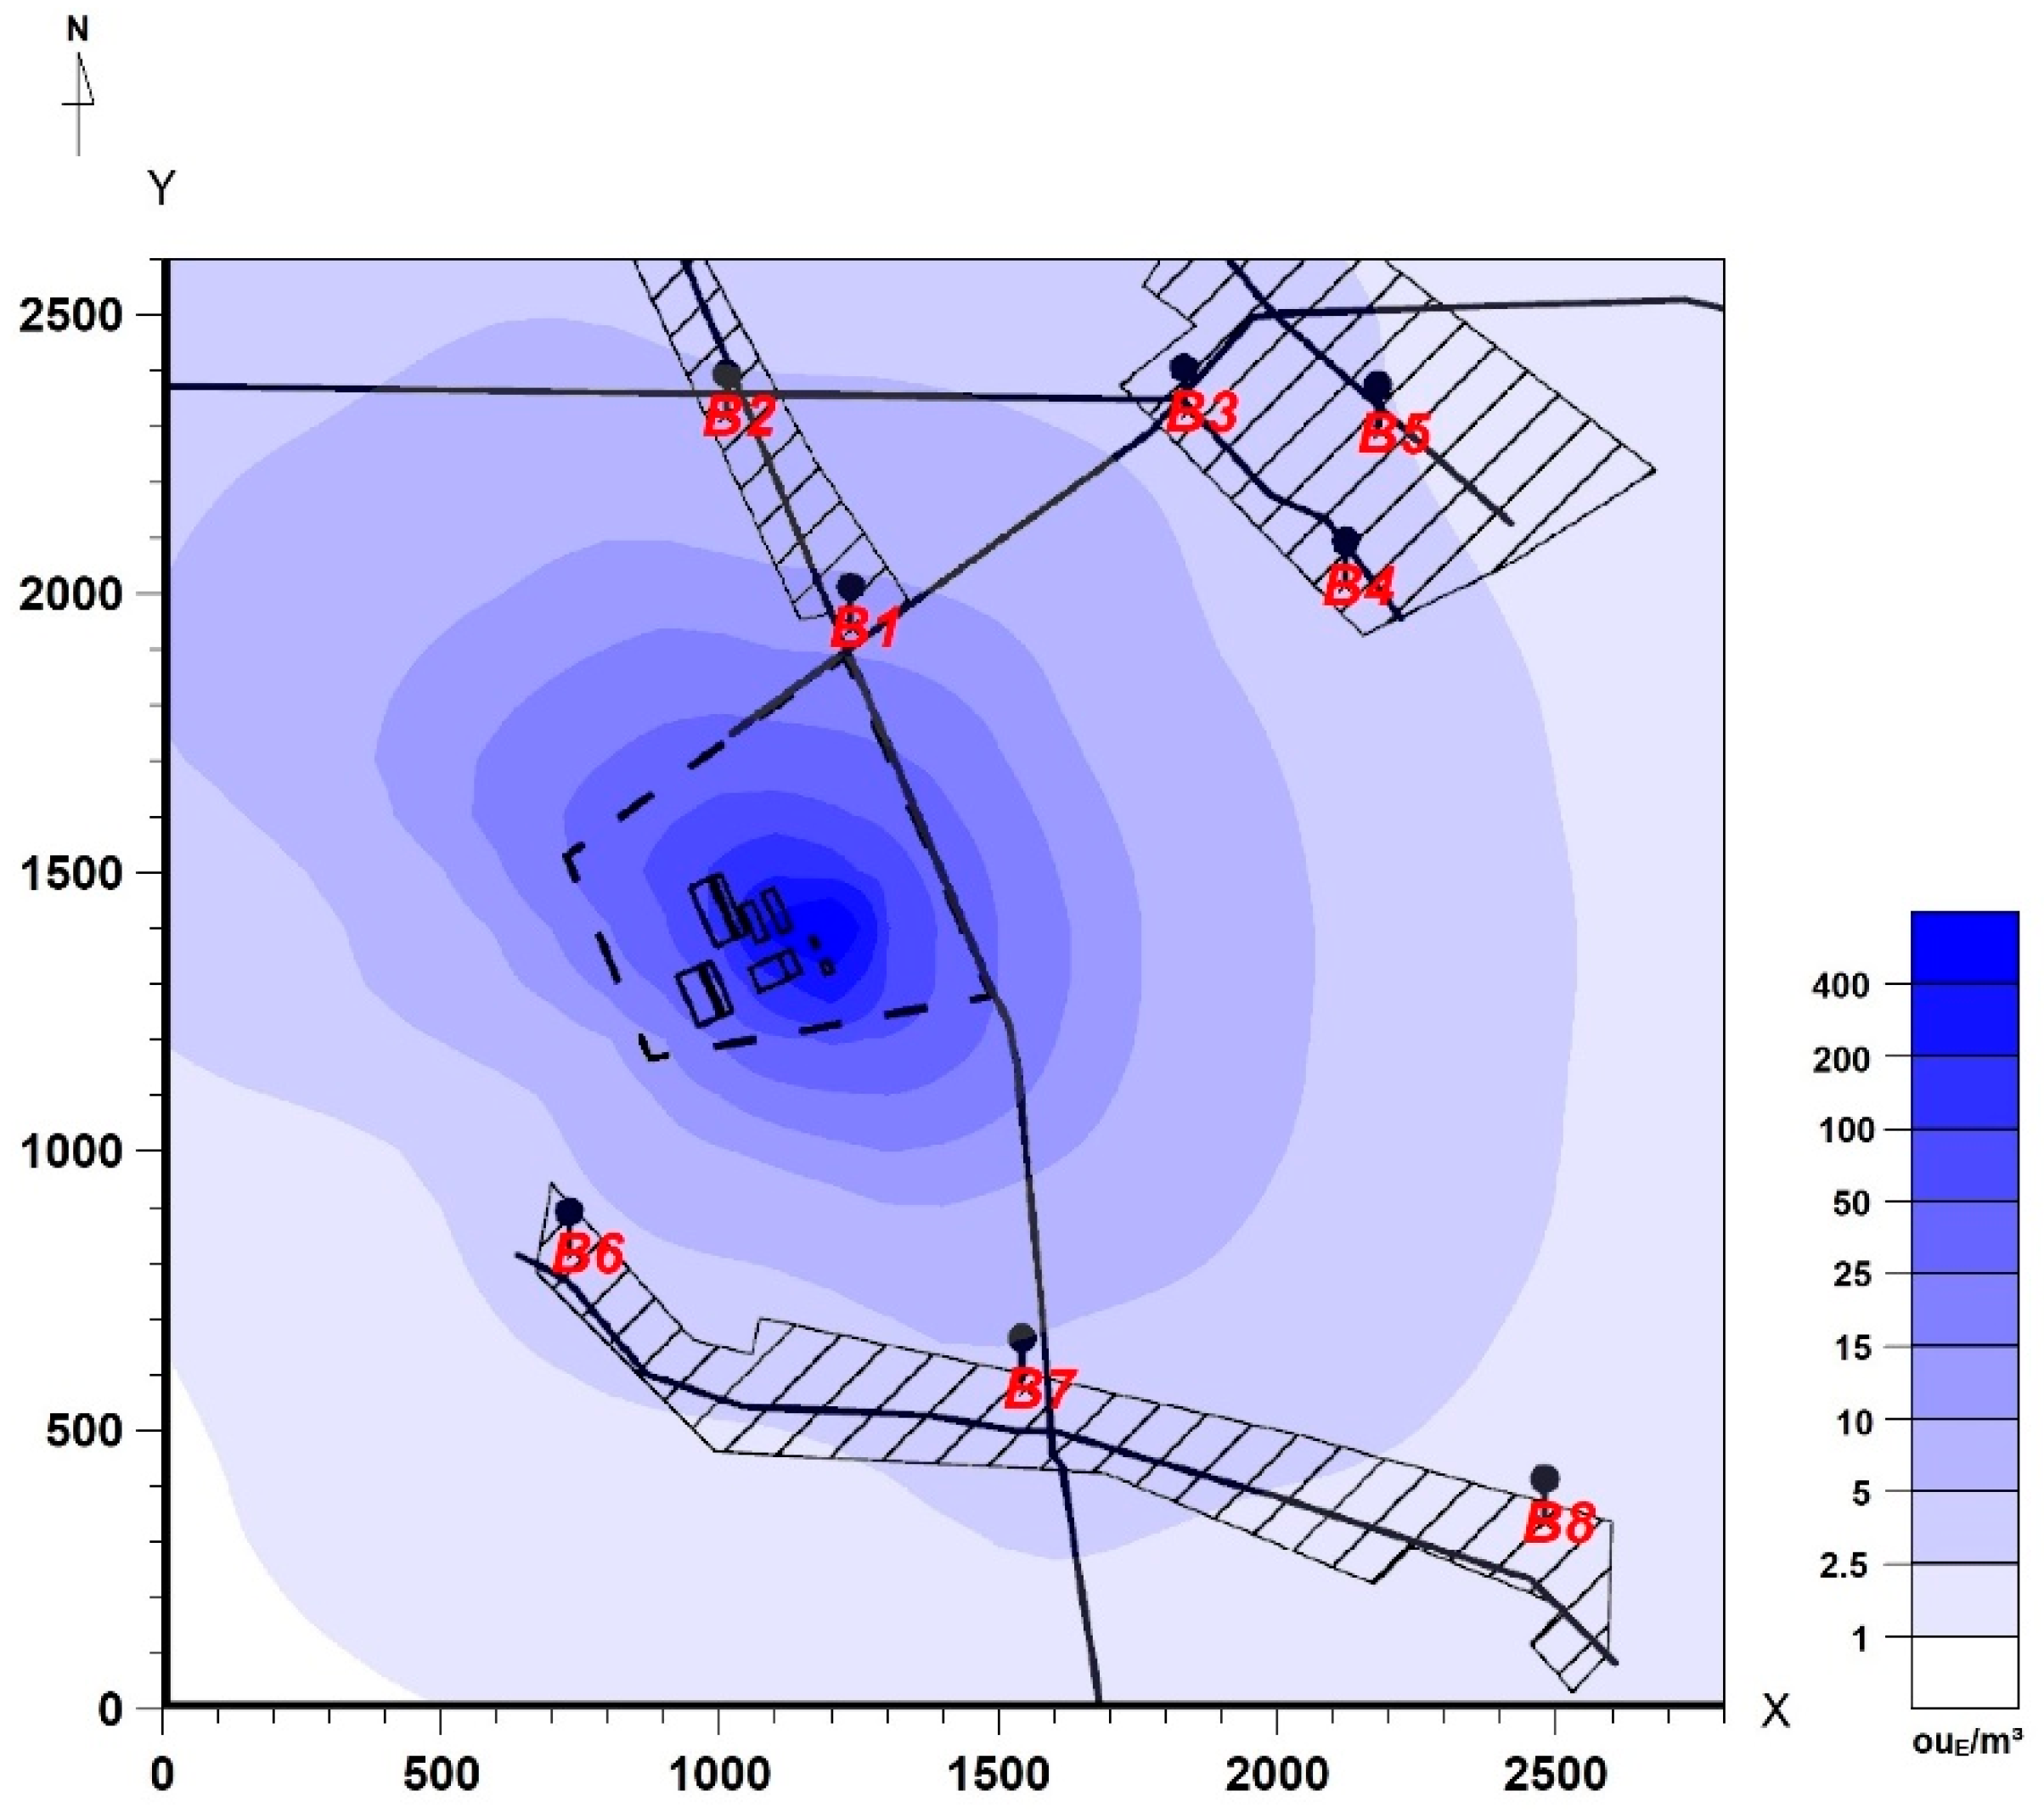
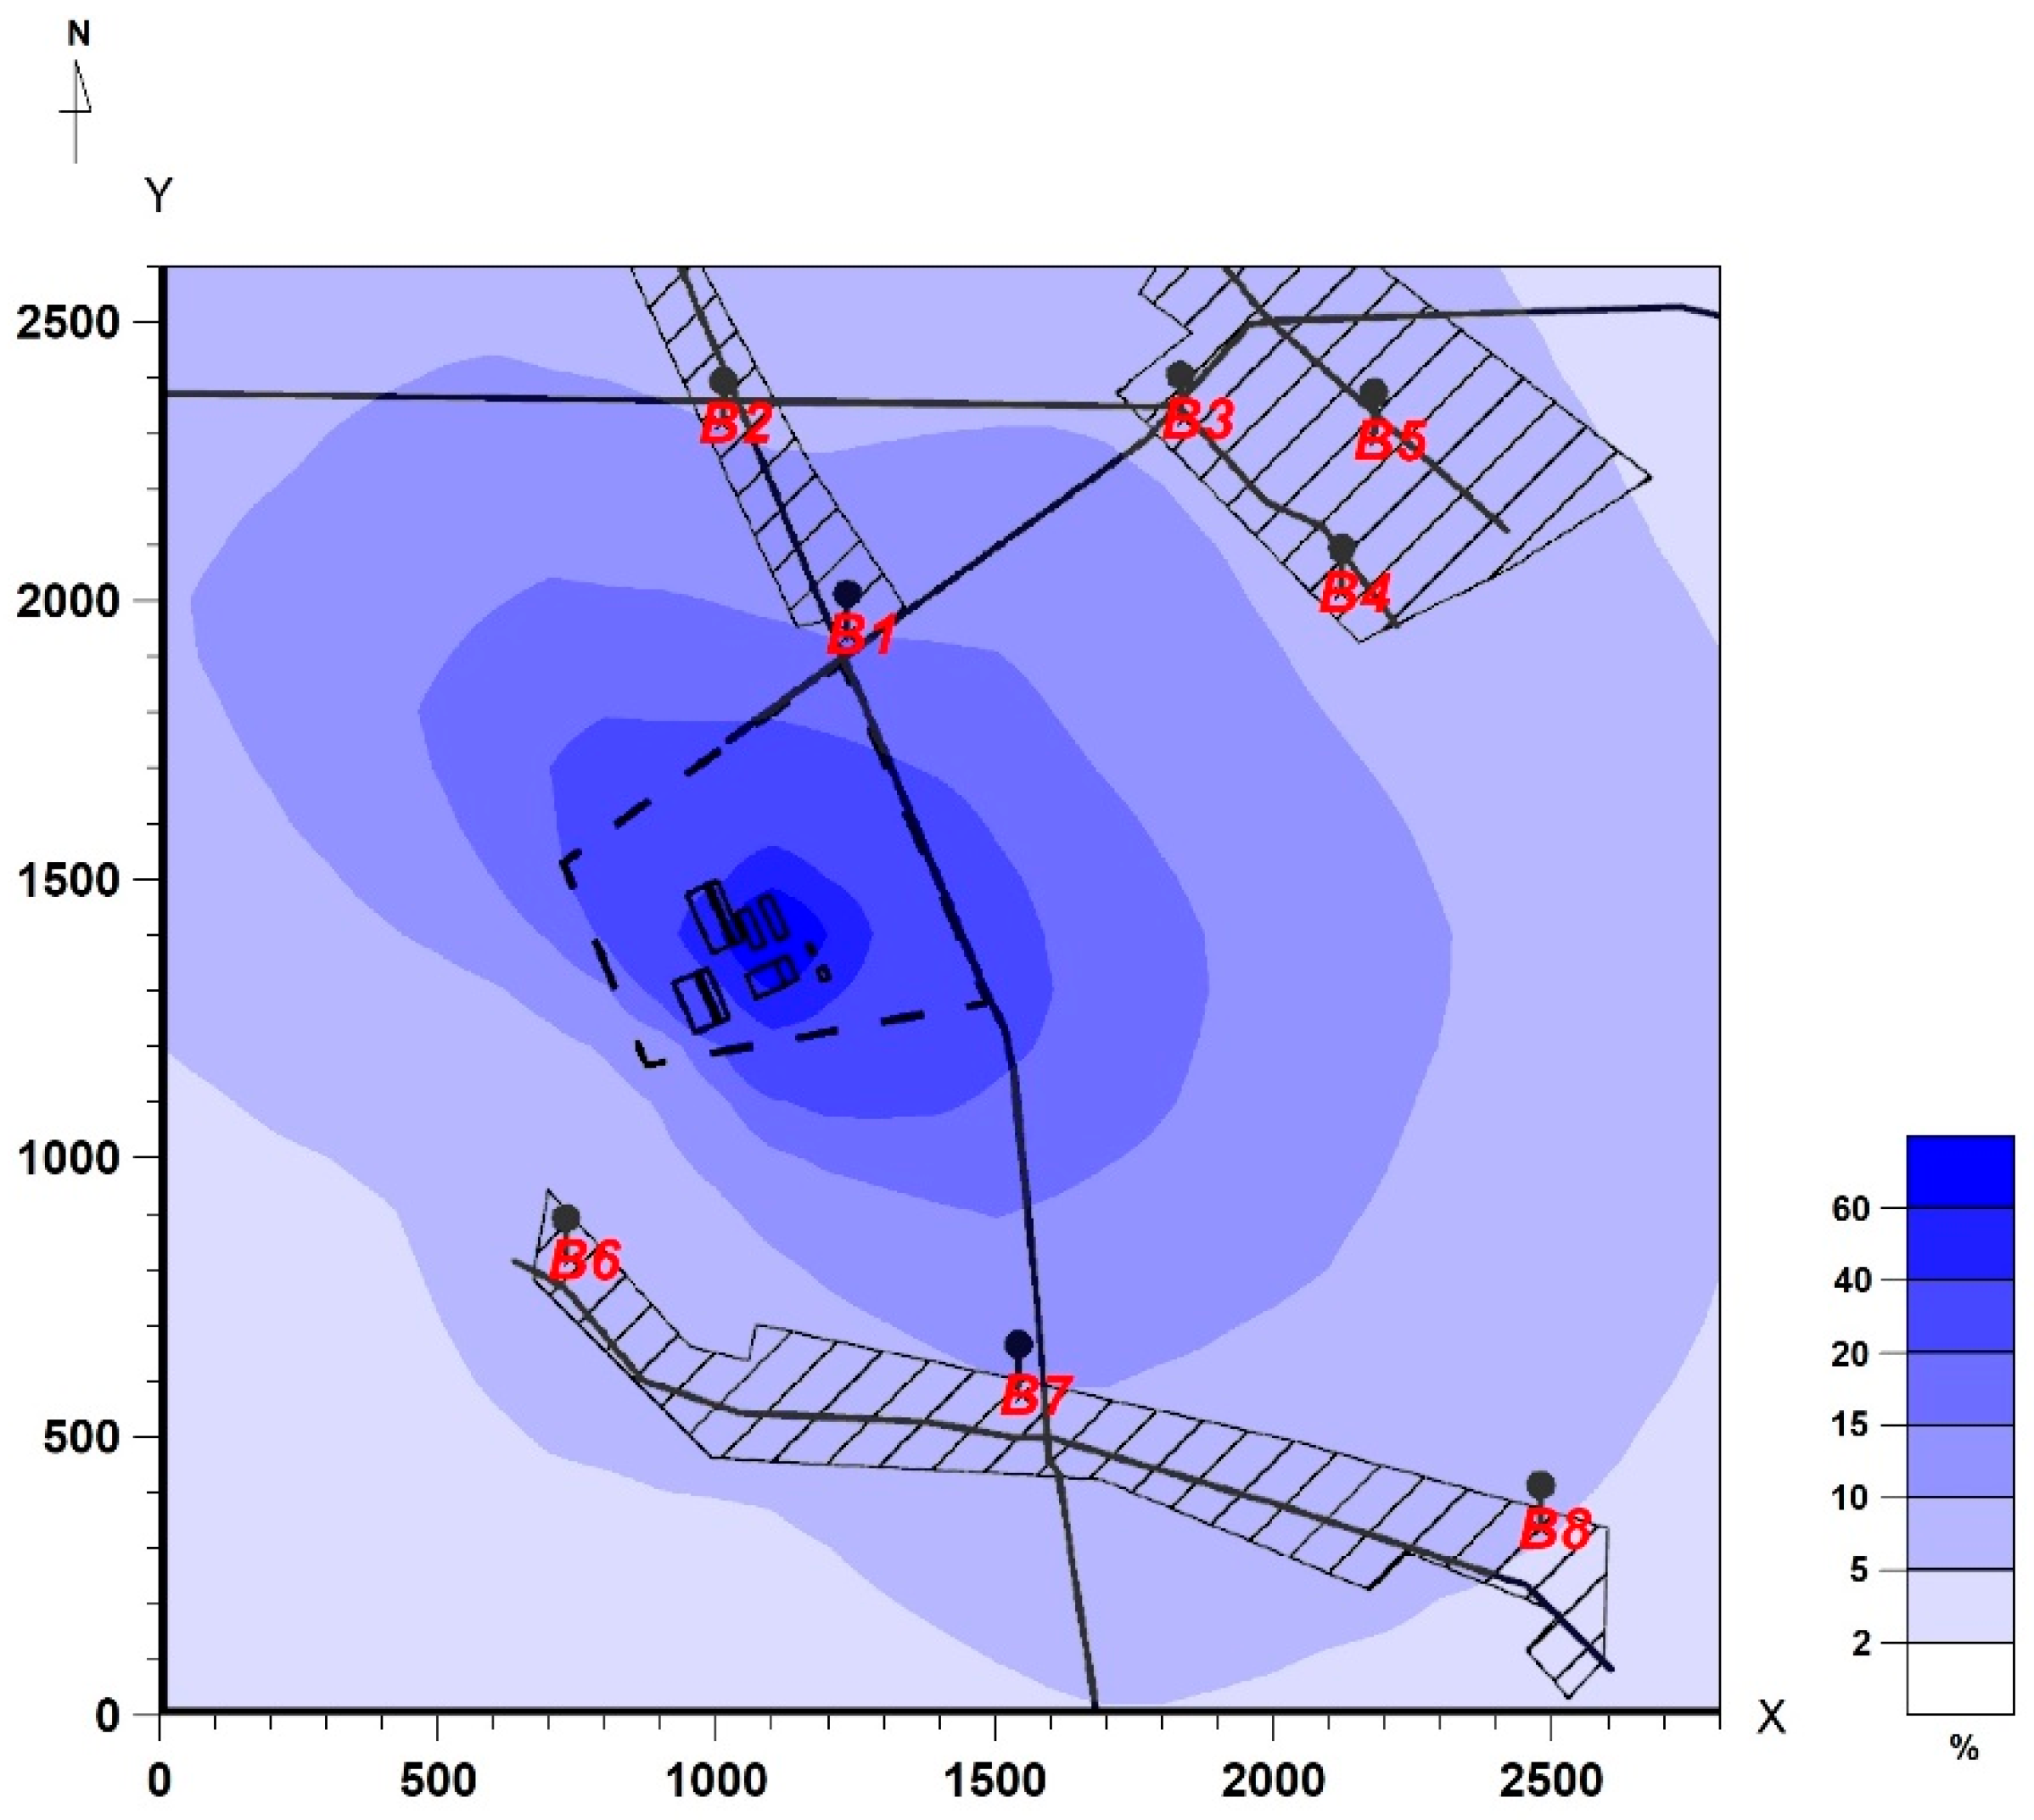
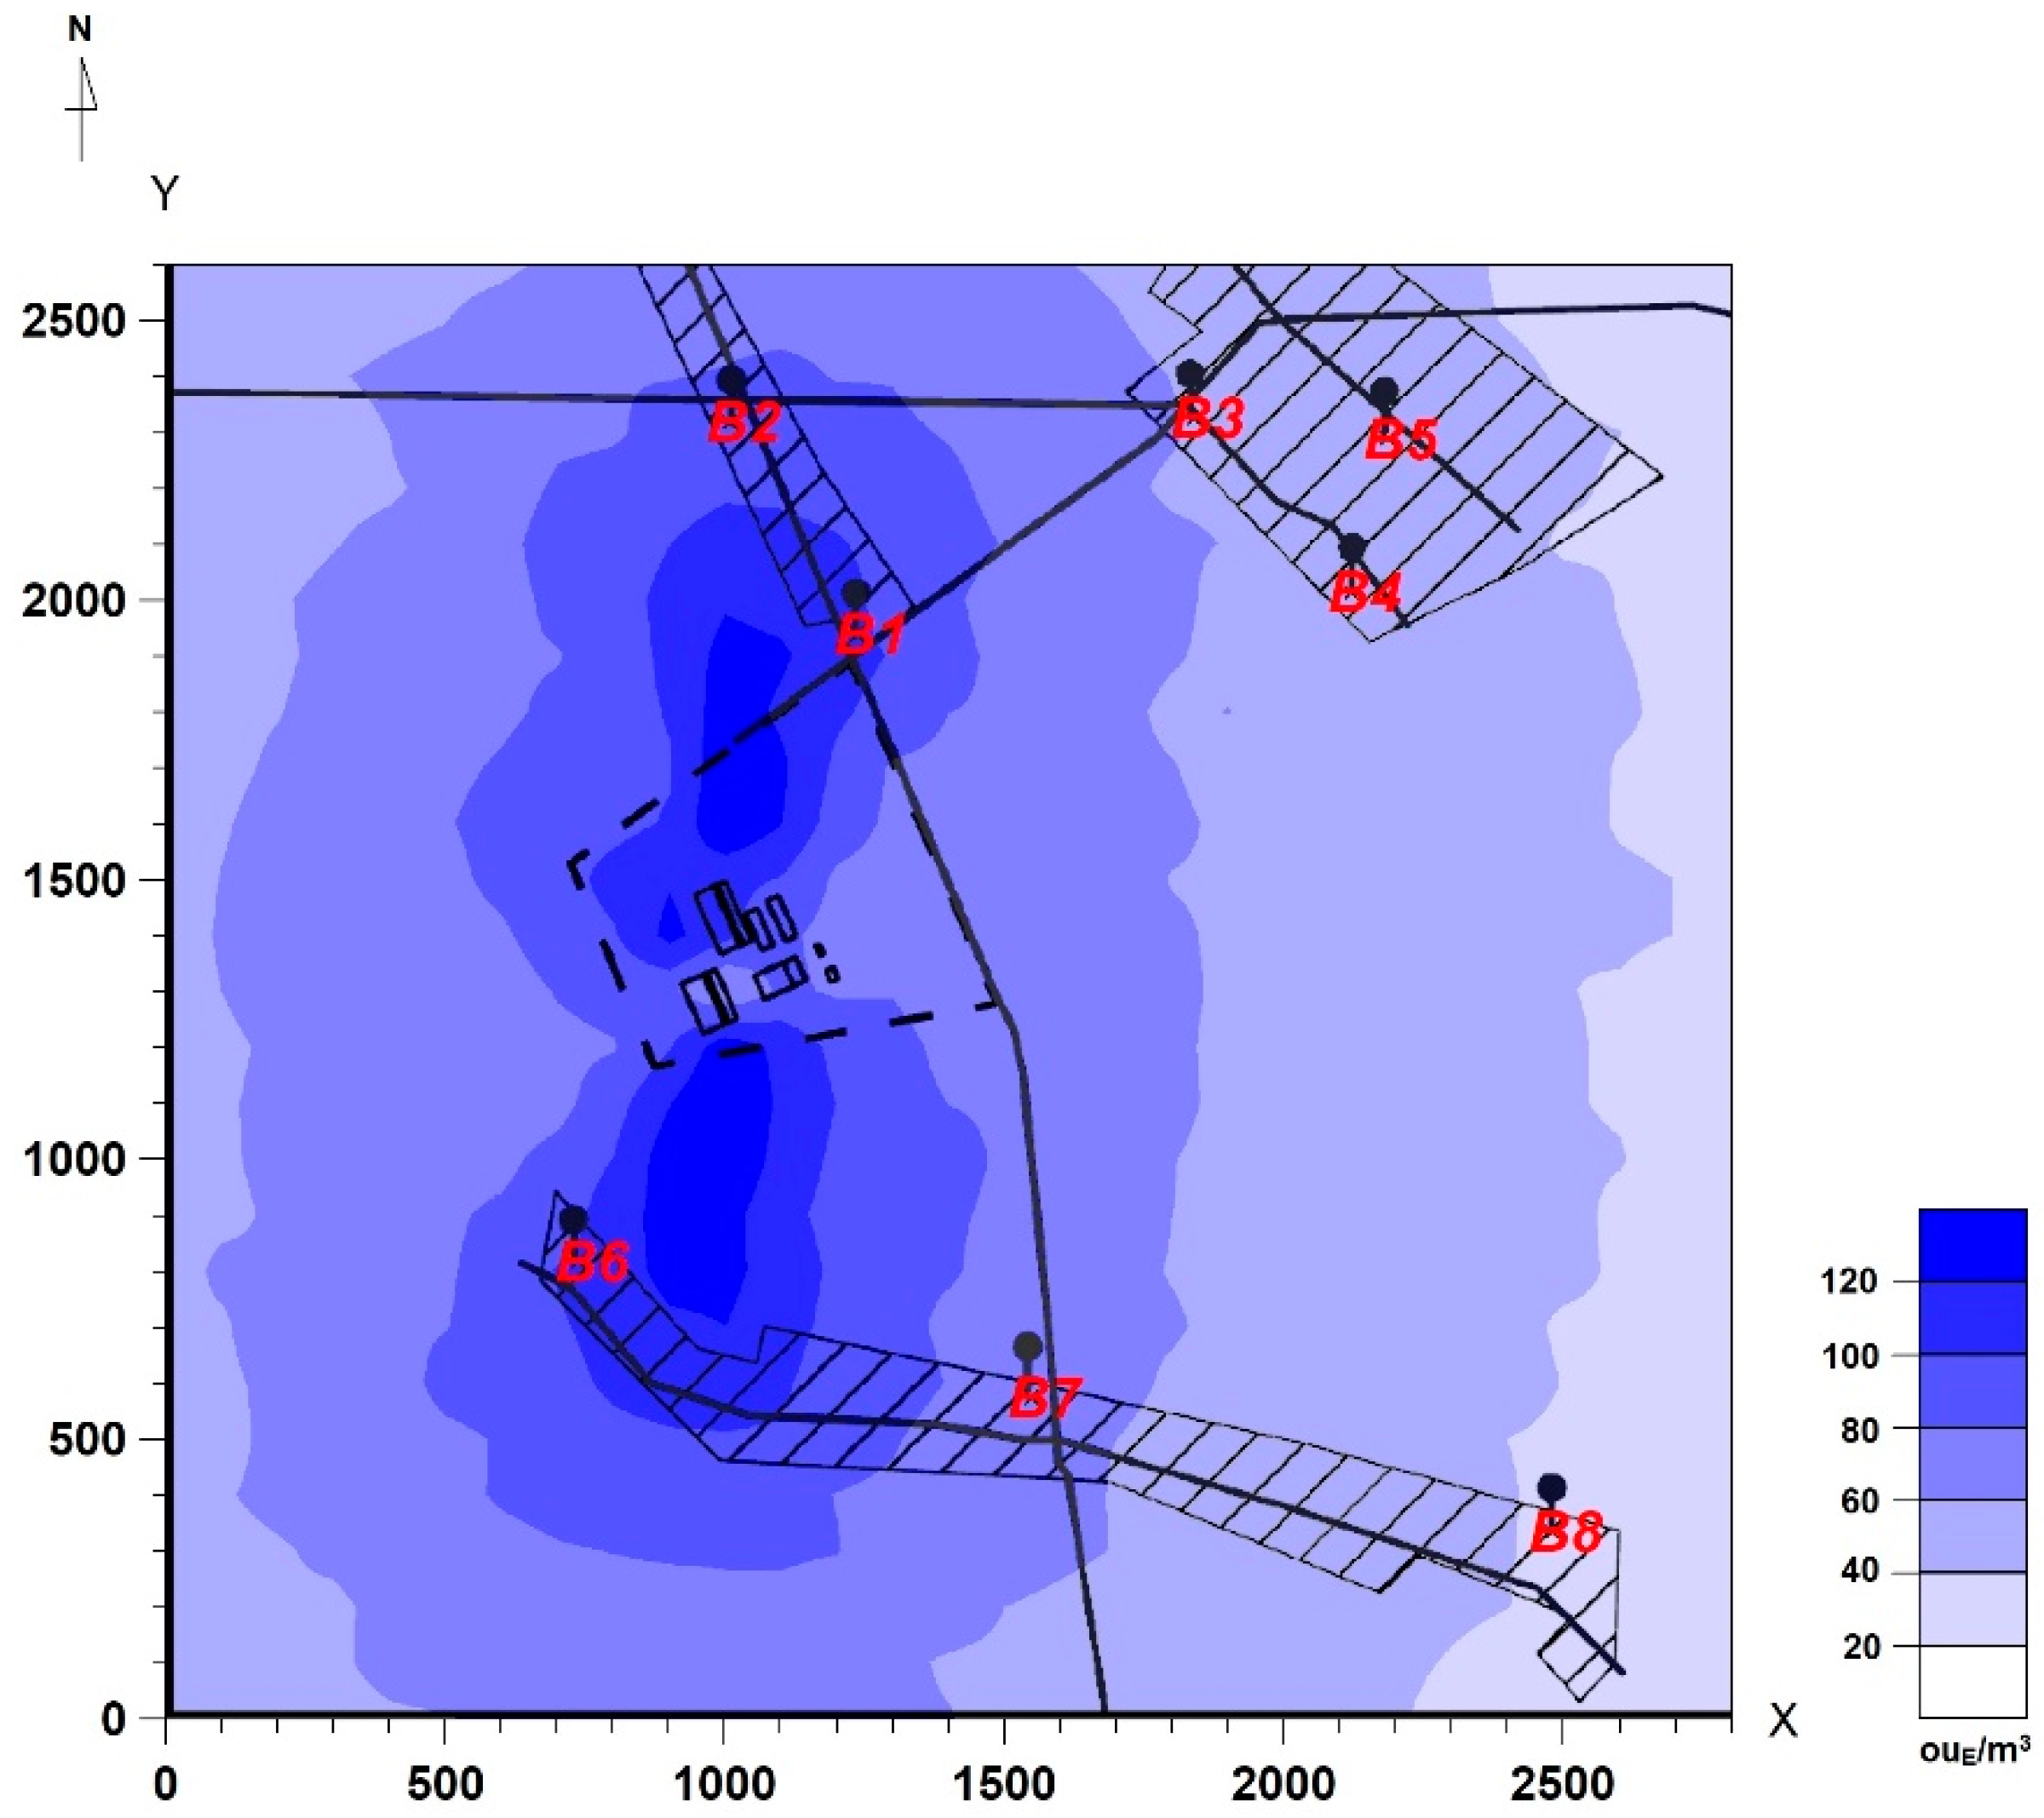
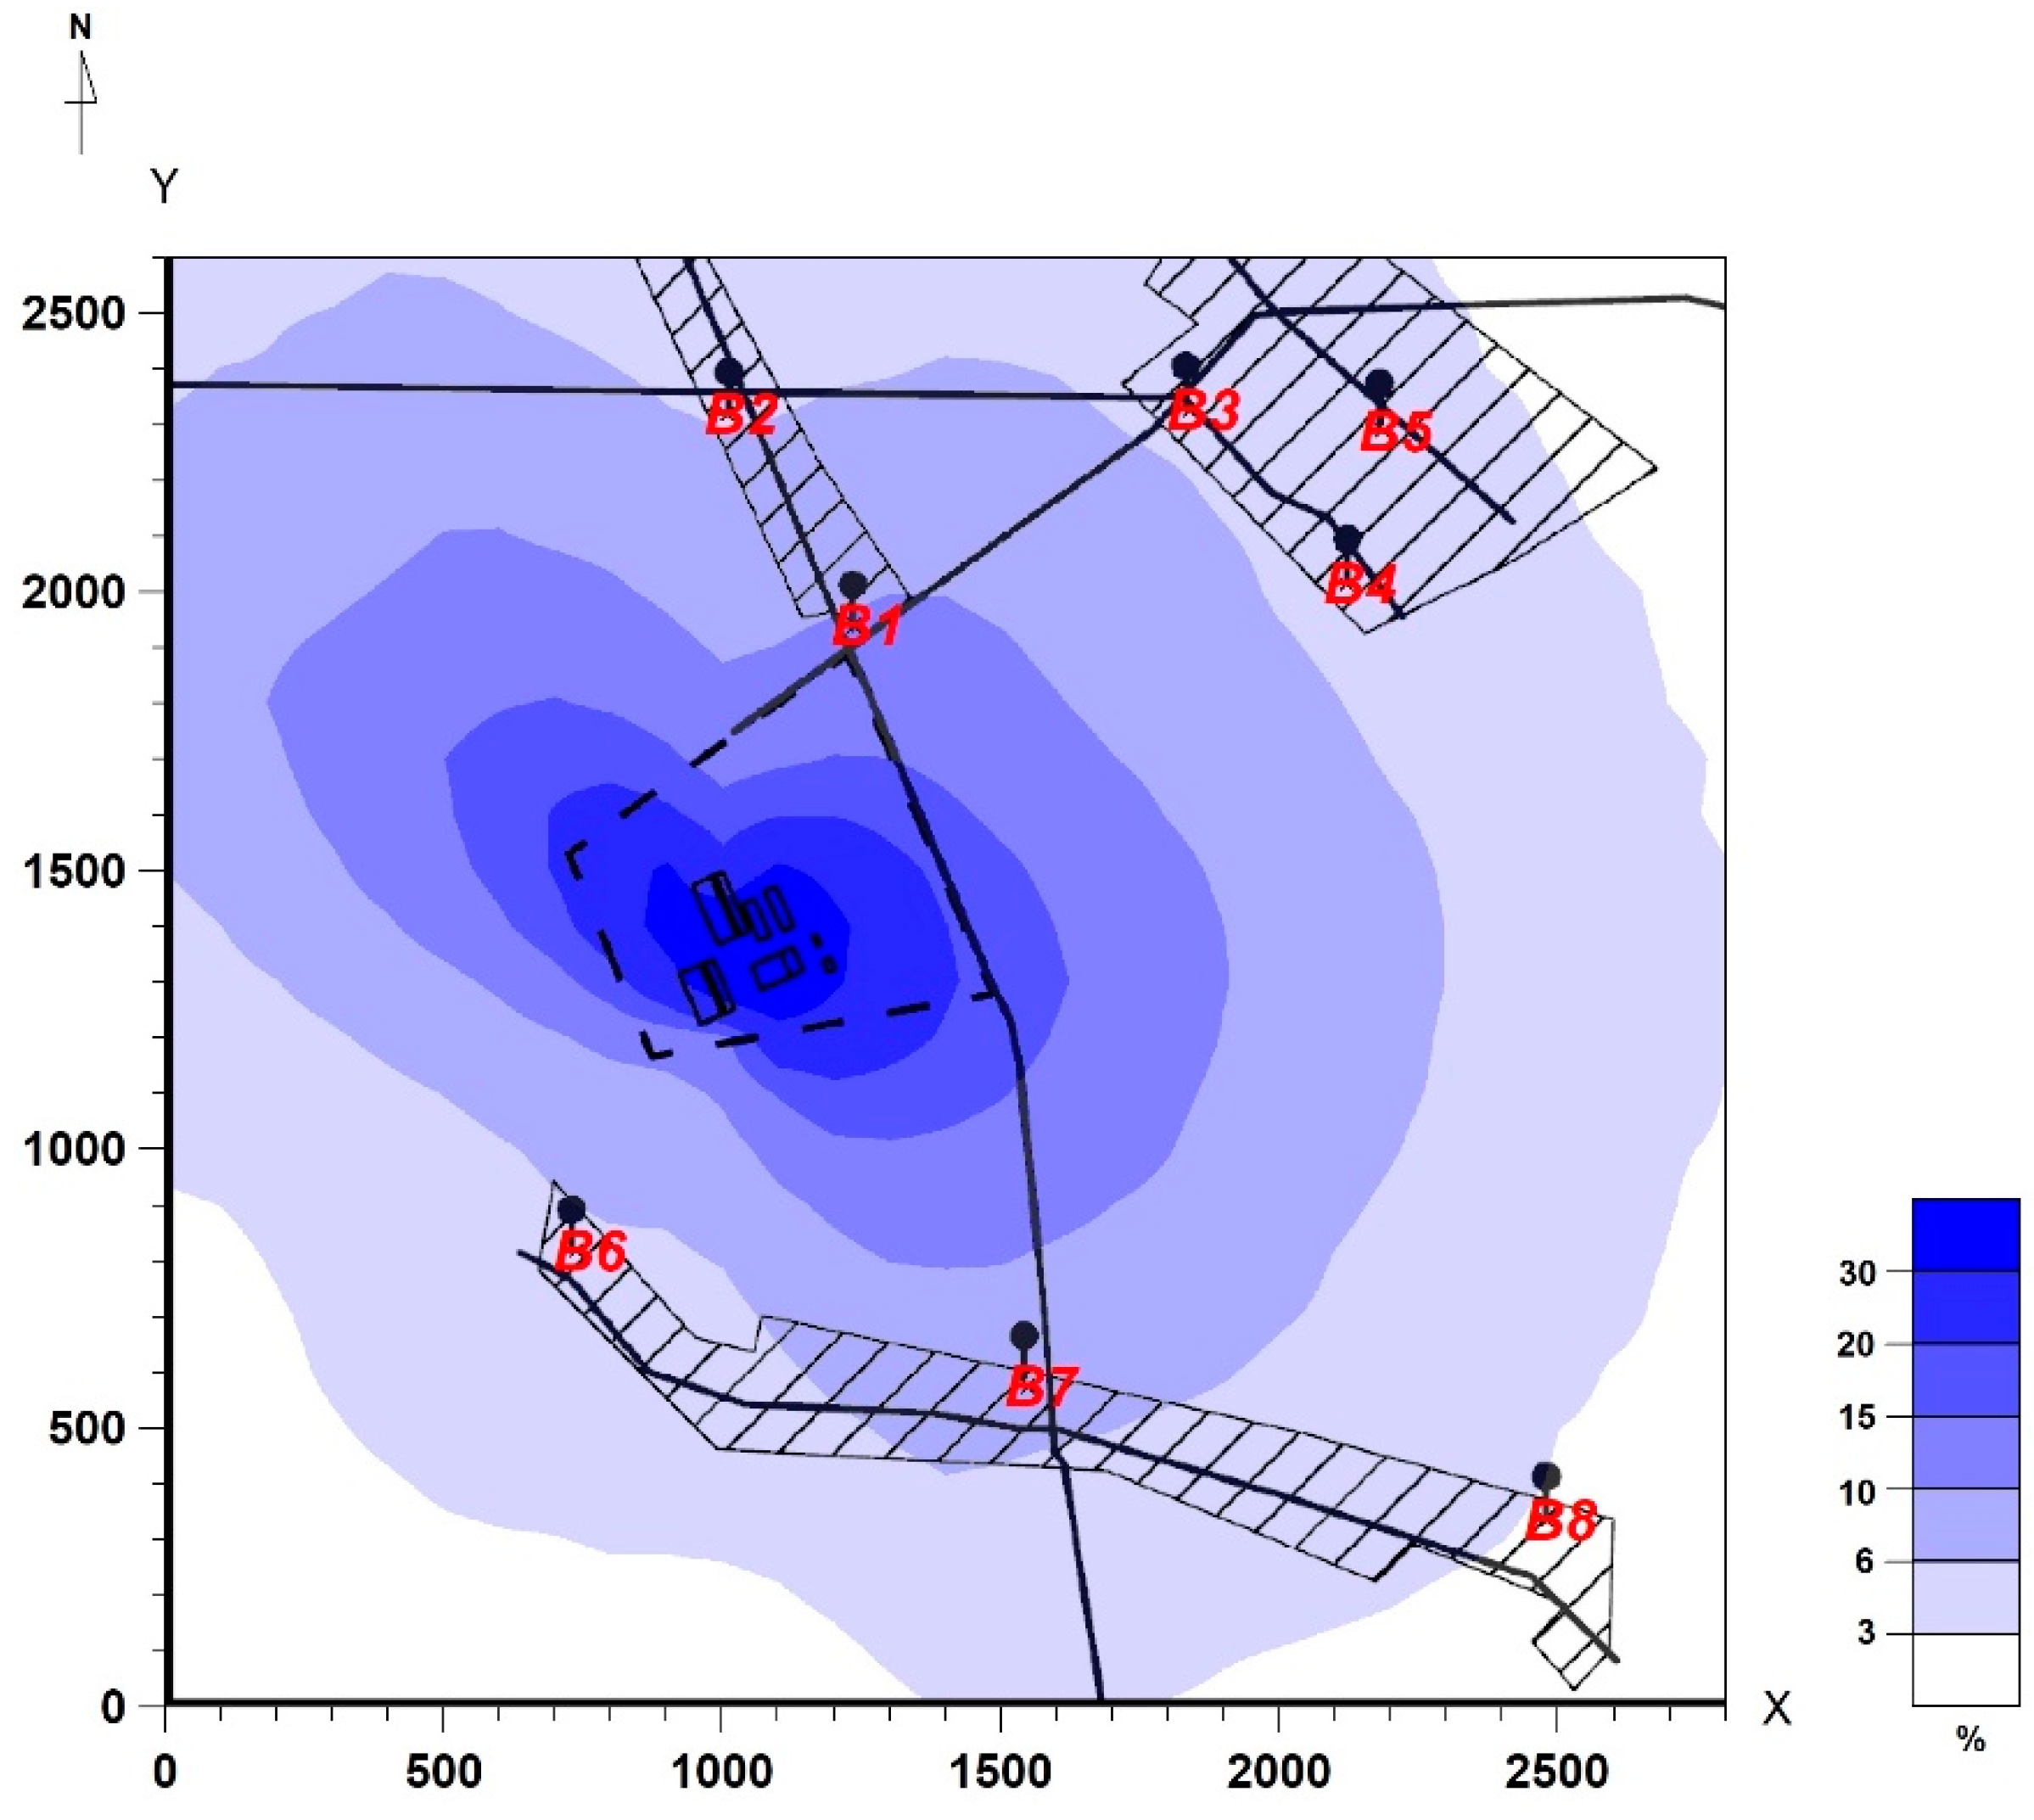
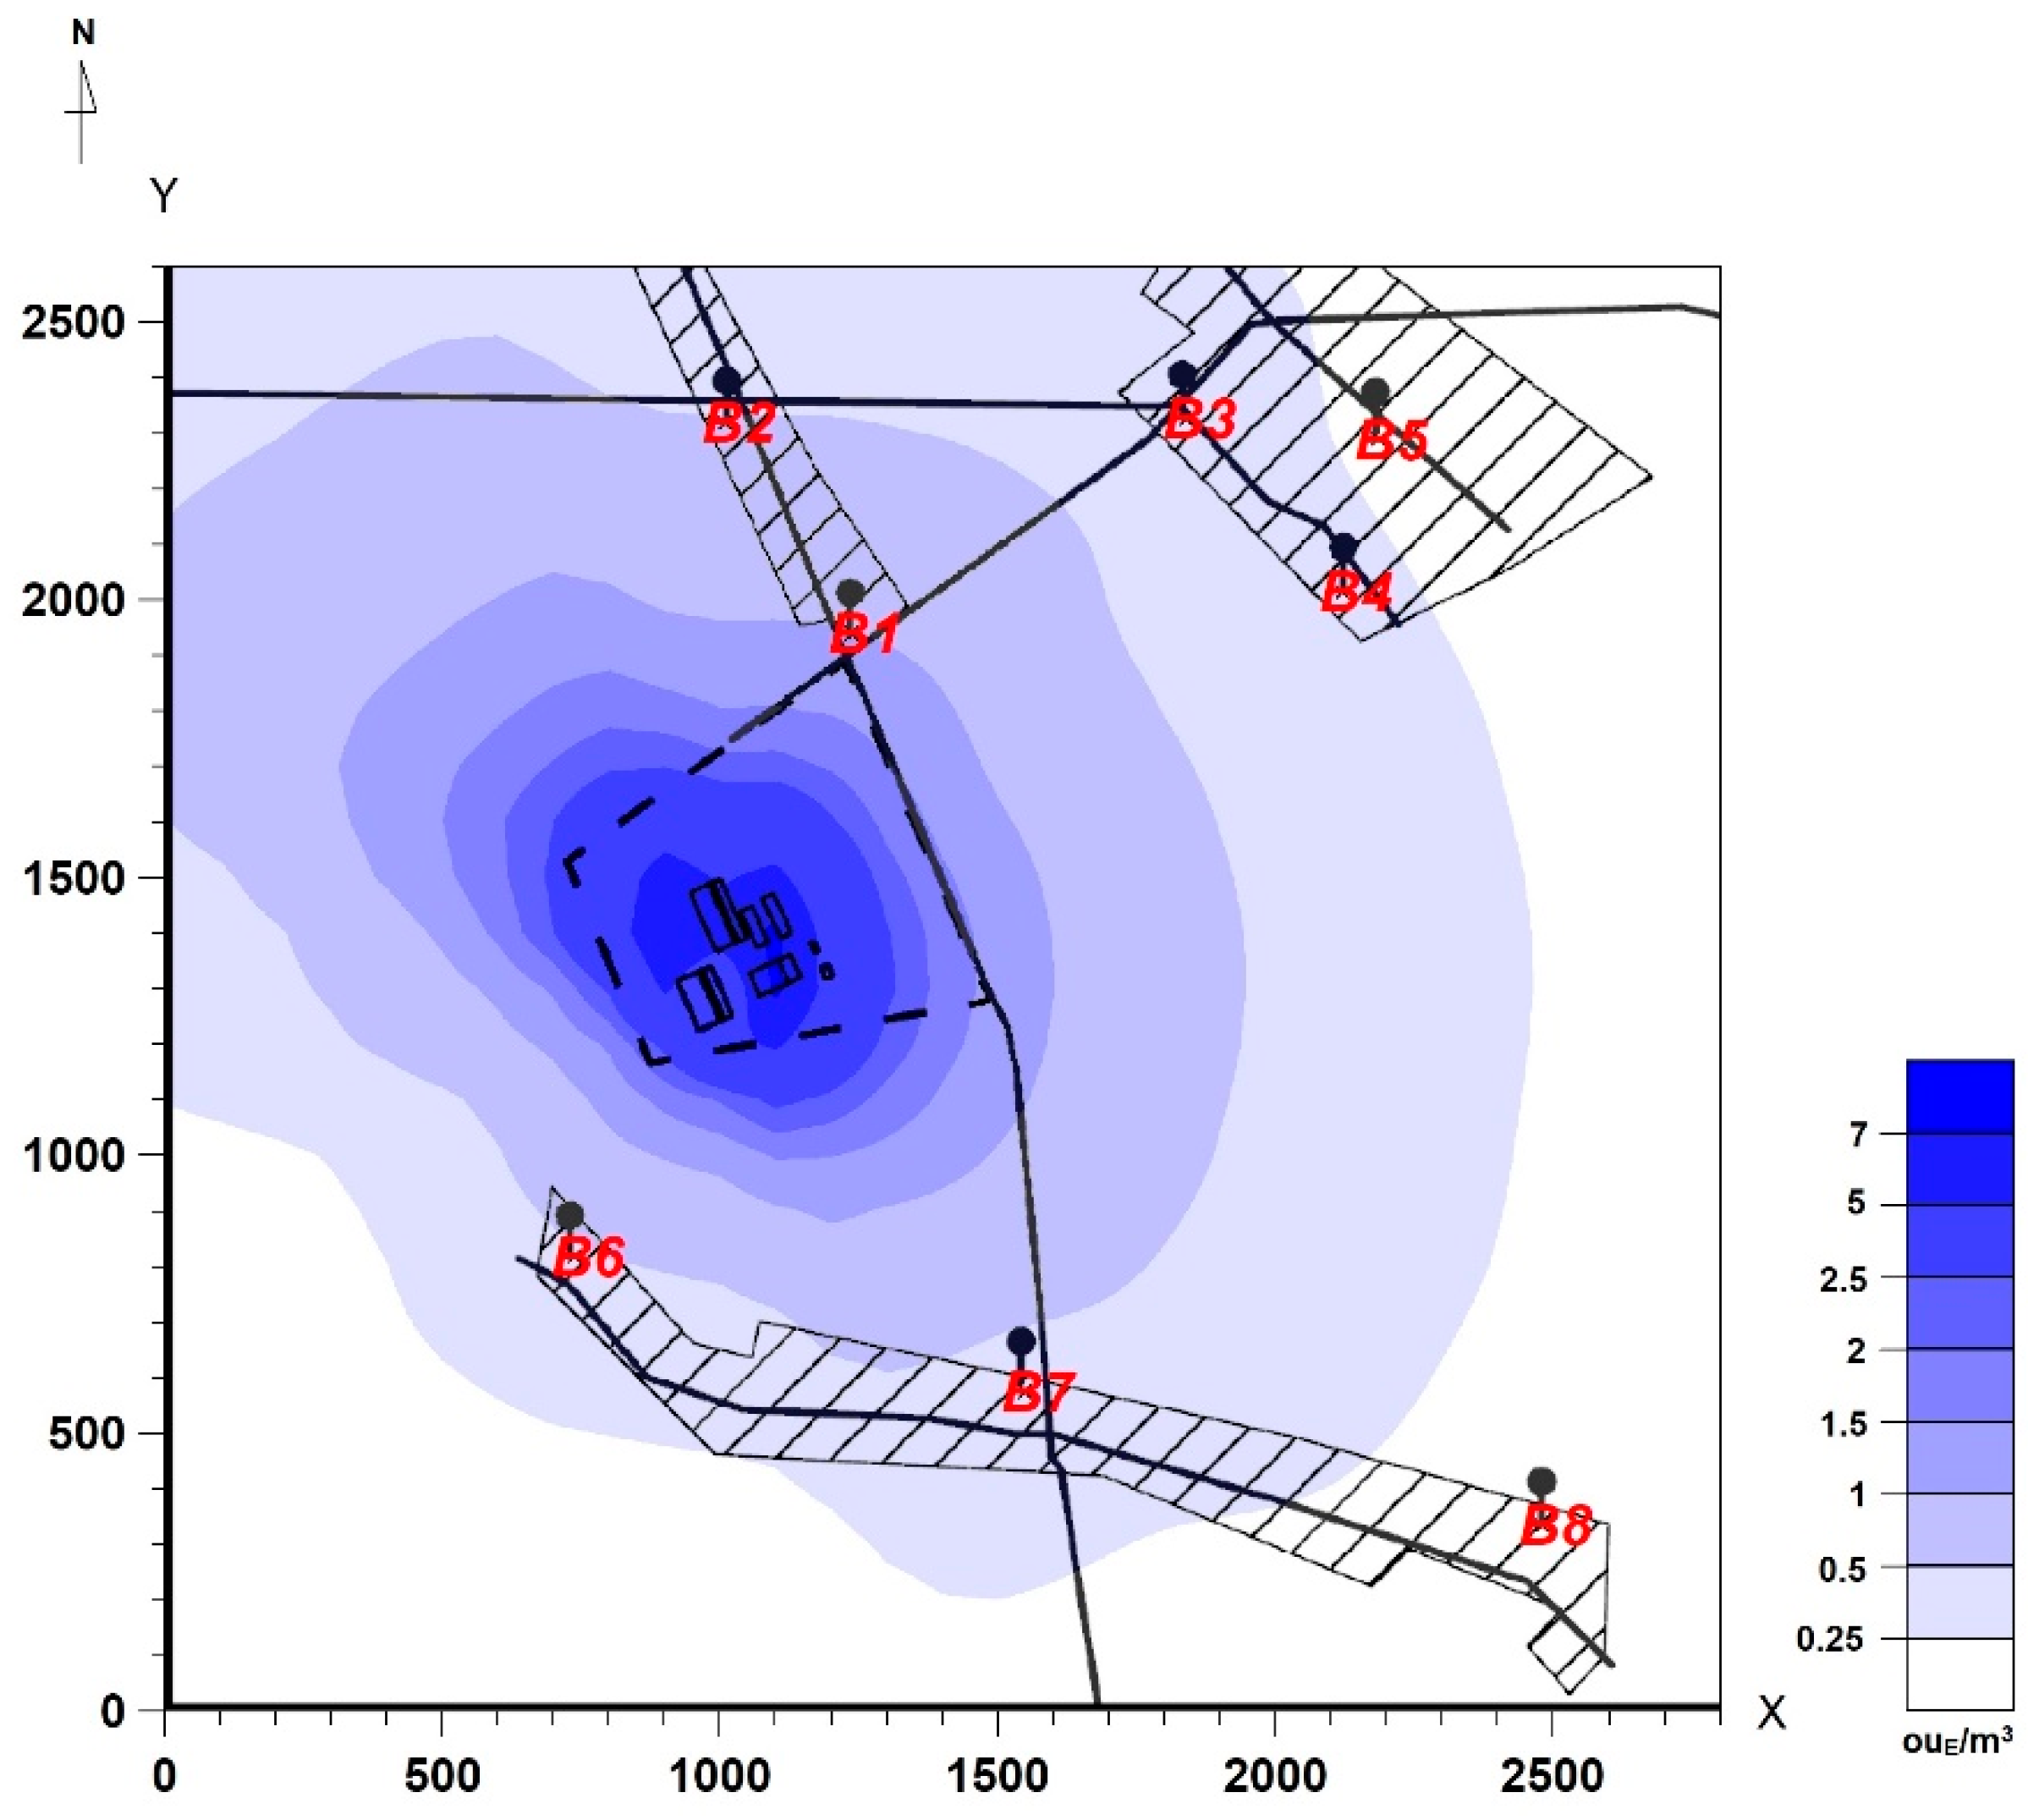
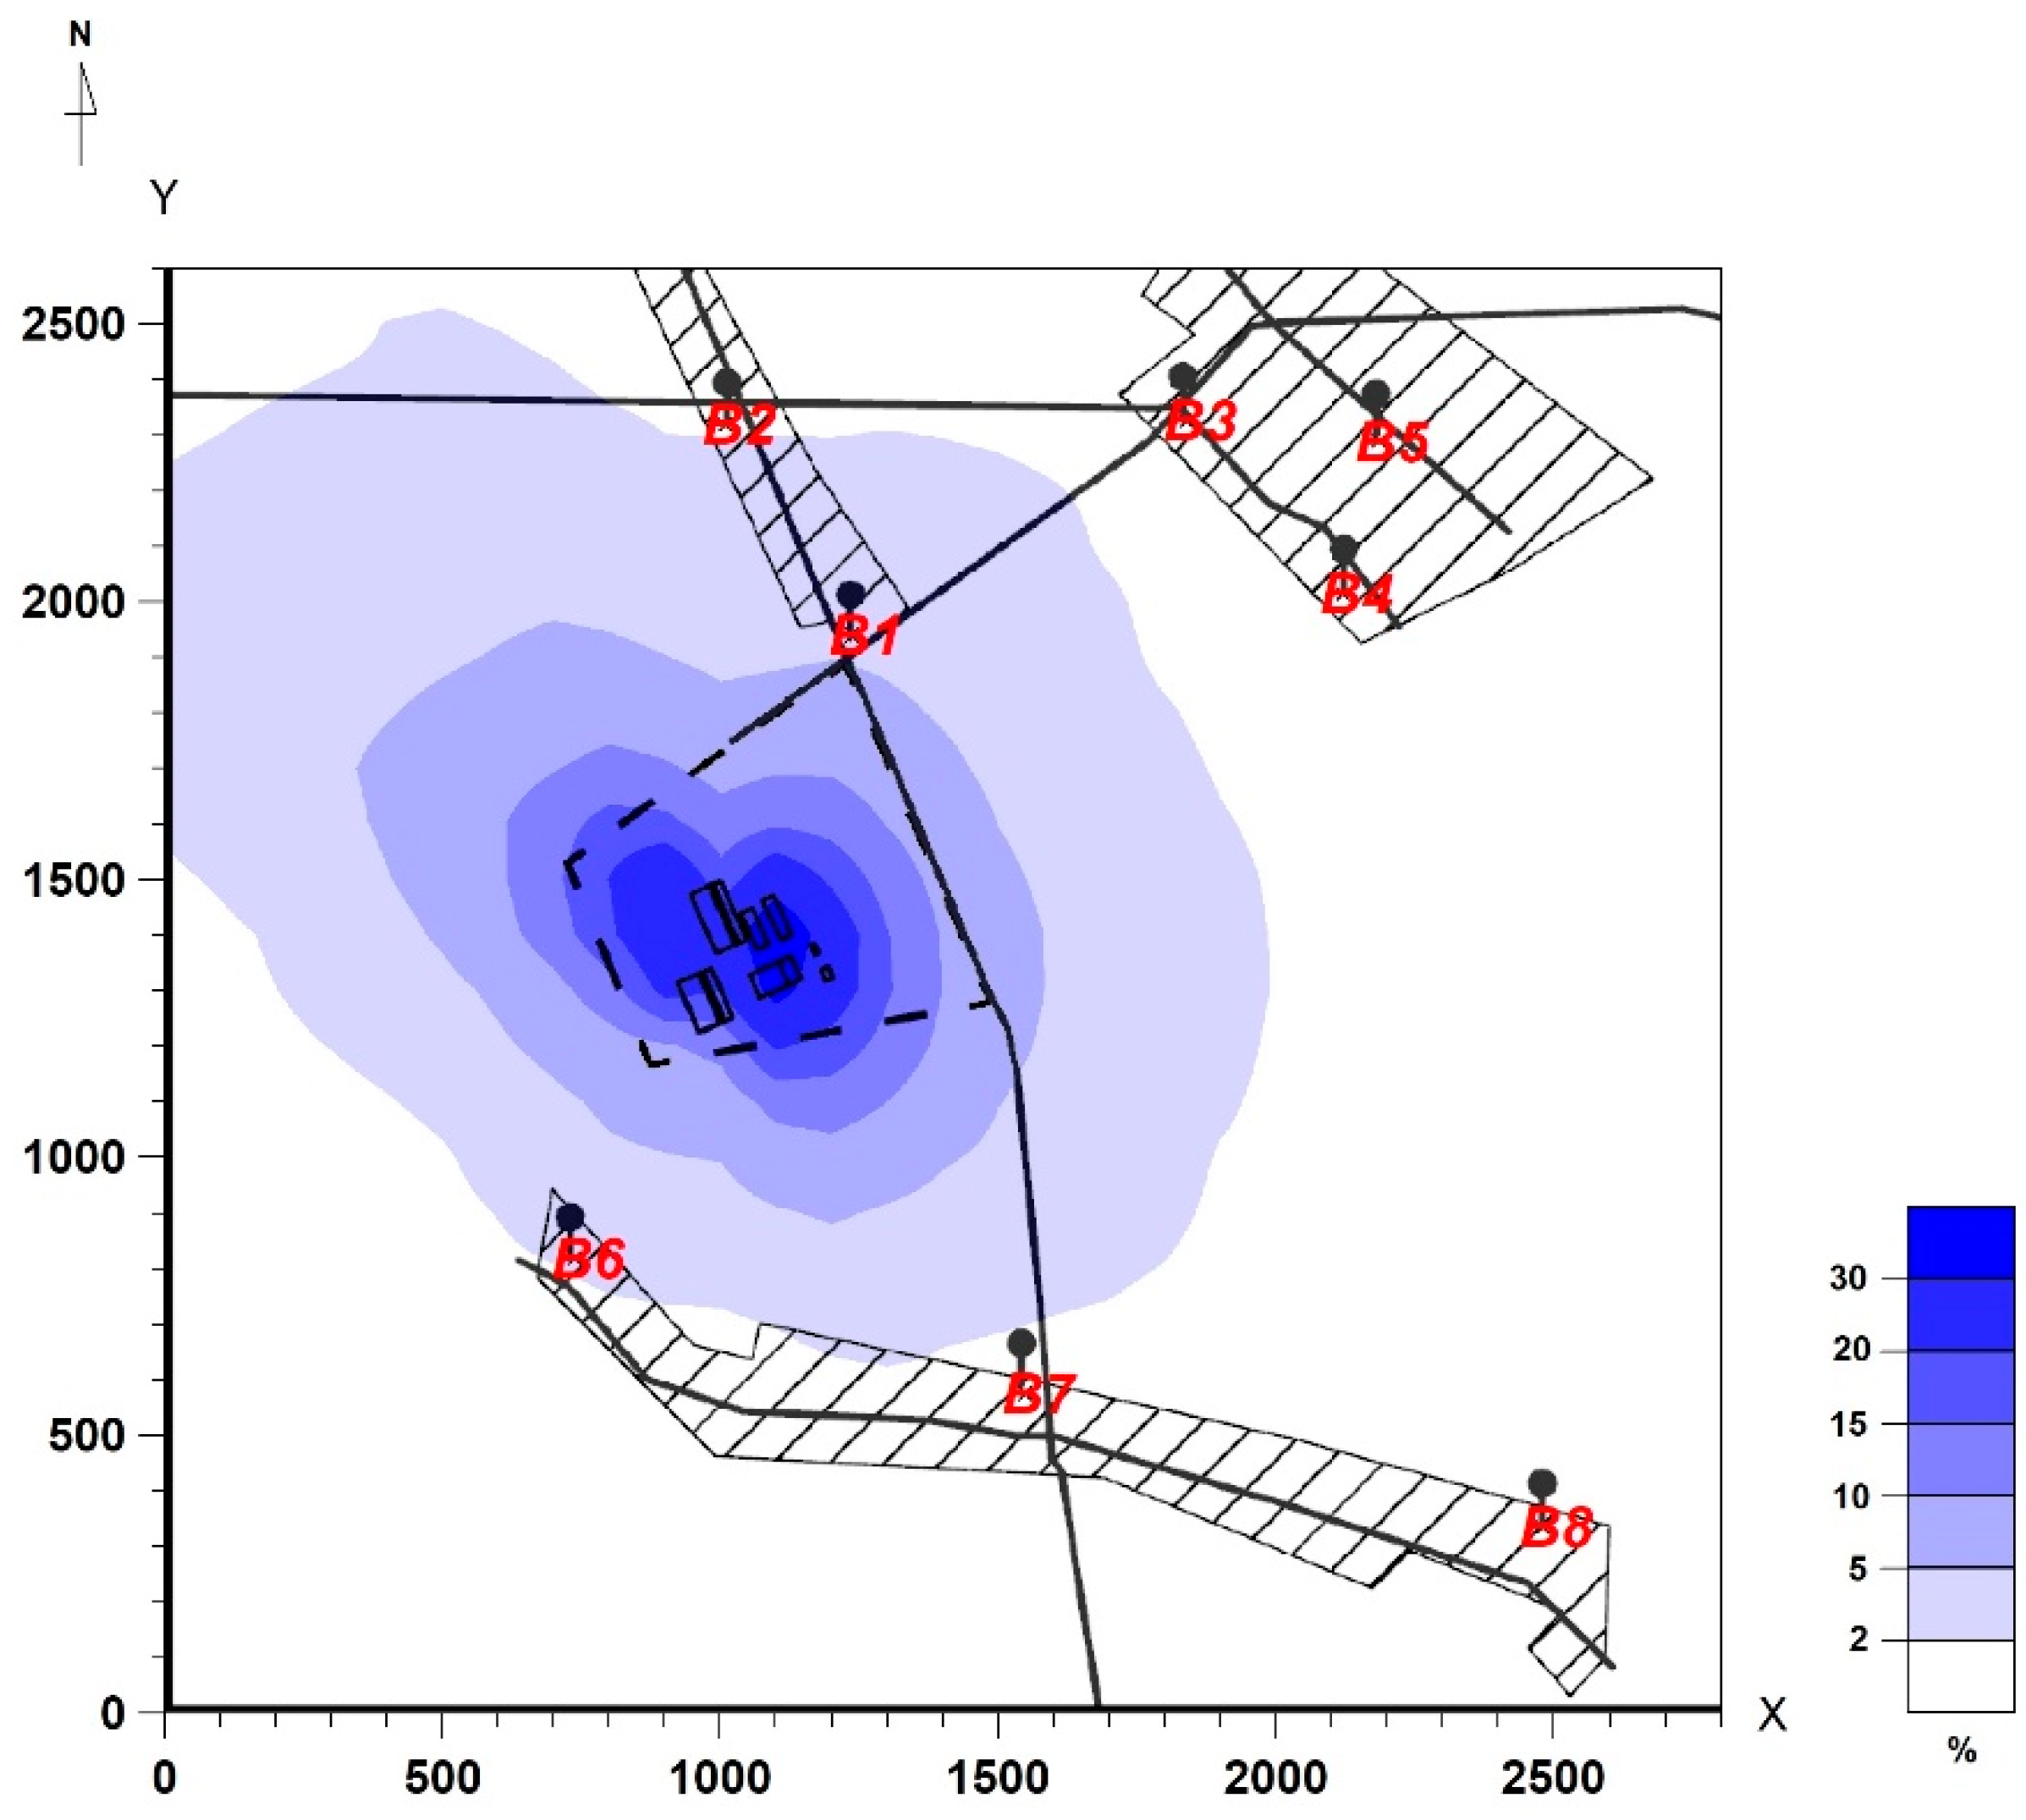
3.2. Modelling Results for Odour Spread
4. Conclusions
Author Contributions
Funding

Conflicts of Interest
References
- Rappert, S.; Müller, R. Odor compounds in waste gas emissions from agricultural operations and food industries. Waste Manag. 2005, 25, 887–907. [Google Scholar] [CrossRef]
- Sówka, I.; Miller, U.; Karski, L. Analysis of legal and technical solutions in terms of odours in Poland. Environ. Prot. Eng. 2019, 45, 127–138. [Google Scholar] [CrossRef]
- The Draft of Polish Law of 28 March 2019: Act on the Minimum Distance for a Planned Project in the Agricultural Sector, the Functioning of Which May Be Associated with the Risk of Odor Nuisance. Available online: https://legislacja.rcl.gov.pl/docs//2/12321413/12579307/12579308/dokument387164.pdf (accessed on 26 March 2020).
- Noble, R.; Hobbs, P.J.; Mead, A.; Dobrovin-Pennington, A. Influence of straw types and nitrogen sources on mushroom composting emissions and compost productivity. J. Ind. Microbiol. Biotechnol. 2002, 29, 99–110. [Google Scholar] [CrossRef] [PubMed]
- Noble, R.; Hobbs, P.J.; Dobrovin-Pennington, A.; Misselbrook, T.H.; Mead, A. Olfactory response to mushroom composting emissions as a function of chemical concentration. J. Env. Qual. 2001, 30, 760–767. [Google Scholar] [CrossRef] [PubMed]
- Pecchia, J.A.; Beyer, D.M.; Wuest, P.J. The Effects of Poultry ManureBased Formulations on odor generation during phase i mushroom composting. Compost. Sci. Util. 2020, 10, 188–196. [Google Scholar] [CrossRef]
- Capelli, L.; Sironi, S.; Del Rosso, R.; Huillot, J.M. Measuring odours in the environment vs. dispersion modelling: A review. Atmos. Environ. 2013, 79, 731–743. [Google Scholar] [CrossRef]
- Wroniszewska, A.; Zwoździak, J. Odor annoyance assessment by using logistic regression on an example of the municipal sector. Sustainability 2020, 12, 6102. [Google Scholar] [CrossRef]
- Moshammer, H.; Oettl, D.; Mandl, M.; Kropsch, M.; Weitensfelder, L. Comparing annoyance potency assessments for odors from different livestock animals. Atmosphere 2019, 10, 659. [Google Scholar] [CrossRef]
- Preamble to the Constitution of WHO as adopted by the International Health Conference. New York, NY, USA, 19 June–22 July 1946; Available online: https://www.who.int/governance/eb/who_constitution_en.pdf (accessed on 26 March 2020).
- Schiffman, S.S.; Williams, C.M. Science of odor as a potential health issue. J. Environ. Qual. 2005, 34, 129–138. [Google Scholar]
- Shusterman, D.; Lipscomb, J.; Neutra, R.; Satin, K. Symptom prevalence and odor-worry interaction near hazardous waste sites. Environ. Health Perspect. 1991, 94, 25–30. [Google Scholar]
- Beach, J.R.; Raven, J.; Ingram, C.; Bailey, M.; Johns, D.; Walters, E.H.; Abramson, M. The effects on asthmatics of exposure to a conventional water-based and a volatile organic compound-free paint. Eur. Respir. J. 1997, 10, 563–566. [Google Scholar] [PubMed]
- Pawnuk, M.; Sówka, I. Application of mathematical modelling in evaluation of odour nuisance from selected waste management plant. E3S Web Conf. 2019, 100, 1–8, ID: 00063. [Google Scholar] [CrossRef]
- Bax, C.; Sironi, S.; Capelli, L. How can odors be measured? An overview of methods and their applications. Atmosphere. 2020, 11, 92. [Google Scholar] [CrossRef]
- Park, S. Odor characteristics and concentration of malodorous chemical compounds emitted from a combined sewer system in Korea. Atmosphere. 2020, 11, 667. [Google Scholar] [CrossRef]
- Invernizzi, M.; Brancher, M.; Sironi, S.; Capelli, L.; Piringer, M. Odour impact assessment by considering short-term ambient concentrations: A multi-model and two-site comparison. Environ. Int. 2020, 144, 105990. [Google Scholar] [CrossRef] [PubMed]
- Wu, C.; Brancher, M.; Yang, F.; Liu, J.; Qu, C.; Schauberger, G.; Piringer, M. A comparative analysis of methods for determining odour-related separation distances around a dairy farm in Beijing, China. Atmosphere. 2019, 10, 231. [Google Scholar] [CrossRef]
- Sówka, I.; Bezyk, Y.; Grzelka, A.; Miller, U.; Pachurka, Ł. Seasonal odor impact range of selected wastewater treatment plants—modeling studies using Polish reference model. Water Sci. Technol. 2018, 2017, 422–429. [Google Scholar]
- Polish Ministry of Environment. Polish Ministry of Environment Draft Act: Law on the Prevention of Odor Nuisance; Polish Ministry of Environment: Warsaw, Poland, 2009.
- Romanik, E.; Pawnuk, M.; Sówka, I. Assessment of odour impact range of selected waste management plant with the use of mathematical tools (Model Tools). J. Ecol. Eng. 2019, 20, 94–101. [Google Scholar] [CrossRef]
- Romanik, E.; Bezyk, Y.; Pawnuk, M.; Miller, U.; Grzelka, A. Influence of the variability of the odour emission rate on its impact range: A case study of the selected industrial source. E3S Web Conf. 2019, 100, 1–8, ID: 00070. [Google Scholar] [CrossRef]
- Piringer, M.; Schauberger, G. Dispersion modelling for odour exposure assessment. In Odor Impact Assessment Handbook; Belgiorno, V., Naddeo, V., Zarra, T., Eds.; Wiley: New York, NY, USA, 2013; pp. 125–174. [Google Scholar]
- St. Croix Sensory, Inc., Nasal Ranger Field Olfactometer Operation Manual. Available online: https://www.fivesenses.com/equipment/nasalranger/nasalranger/ (accessed on 26 March 2020).
- Polish Committee for Standardization. Polish Standard PN-EN 13725:2007: Air Quality—Determination of Odour Concentration by Dynamic Olfactometry; Polish Committee for Standardization: Warsaw, Poland, 2007. [Google Scholar]
- VDI (Verein Deutscher Ingenieure). VDI 3880: Olfactometry. Static Sampling, Verein Deutscher Ingenieure; VDI (Verein Deutscher Ingenieure): Düsseldorf, Germany, 2011. [Google Scholar]
- Sówka, I.; Miller, U.; Sobczyński, P. Dynamic olfactometry and modeling as methods for the assessment of odour impact of public utility objects. Environ. Prot. Eng. 2016, 42, 143–152. [Google Scholar]
- Lucernoni, F. The evaluation of the odour emission rate for passive area sources: A new approach. Chem. Eng. Trans. 2015, 43, 2149–2154. [Google Scholar]
- Polish Minister of the Environment. Regulation of the Polish Minister of the Environment of 26 January 2010 on Reference Value for Some Substances in the Air; Polish Minister of the Environment: Warsaw, Poland, 2010; No. 16 item 87. (In Polish)
- PROEKO Ryszard Samoć, Operat Fb Software. Available online: https://www.proeko.kalisz.pl/Operat_FB.html (accessed on 26 March 2020).
- Prata, A.A.; Lucernoni, F.; Santos, J.M.; Capelli, L.; Sironi, S.; Le-Minh, N.; Stuetz, R.M. Mass transfer inside a flux hood for the sampling of gaseous emissions from liquid surfaces—Experimental assessment and emission rate rescaling. Atmos. Environ. 2018, 179, 227–238. [Google Scholar] [CrossRef]
- Hudson, N.; Ayoko, G.A. Odour sampling. 2. Comparison of physical and aerodynamic characteristics of sampling devices: A review. Bioresour. Technol. 2008, 99, 3993–4007. [Google Scholar] [CrossRef]
- Brancher, M.; Hieden, A.; Baumann-Stanzer, K.; Schauberger, G.; Piringer, M. Performance evaluation of approaches to predict sub-hourly peak odour concentrations. Atmos. Environ. X 2020, 7, 100076. [Google Scholar] [CrossRef]
- Codex on Preventing of Odour Nuisance. Available online: https://www.gov.pl/web/klimat/uciazliwosc-zapachowa. (accessed on 26 March 2020). (In Polish)


| Odour Source | Symbol | Height (m) | Dimensions (m × m) | Amount (pcs.) | Gas Velocity (m/s) | Gas Temperature (°C) | Working Time Per Year (in Reference to 8760 h) |
|---|---|---|---|---|---|---|---|
| Drain plate | Surface emitter 1 | 4.5 | 23.0 × 45.0 | 1 | - ** | 19.4 *** | 8760 |
| Storage boxes without a roof | Surface emitter 2 | 3.0 | 9.0 × 22.0 | 8 | - ** | 29.0 *** | 8760 |
| Covered storage boxes | Surface emitter 3 | 3.0 | 11.0 × 21.0 | 7 | - ** | 26.6 *** | 8760 |
| Covered storage boxes | Surface emitter 4 | 4.5 | 8.0 × 45.0 | 7 | - ** | 33.6 *** | 8760 |
| Storage boxes for droppings | Surface emitter 5 | 3.0 | 14.0 × 25.0 | 1 | - ** | 30.3 *** | 8760 |
| Leachate tank | Surface emitter 6 | 2.0 | diameter 10.0 m | 2 * | - ** | 19.4 *** | 2920 |
| Hall A/Phase II—ripening | Point emitter 1 | 11 | 1.0 × 1.4 | 6 | 3.16 | 47.1 | 6254 |
| Hall A/Phase II—pasteurisation | Point emitter 2 | 11 | 1.0 × 1.4 | 7 | 1.95 | 44.8 | 6254 |
| Hall A/Phase II—alignment | Point emitter 3 | 11 | 1.0 × 1.4 | 6 | 2.13 | 43.1 | 6254 |
| Hall A/Phase III—overgrowth | Point emitter 4 | 11 | 1.0 × 1.4 | 6 | 2.75 | 25.4 | 6254 |
| Hall B/Phase II—ripening | Point emitter 5 | 11 | 1.0 × 1.4 | 6 | 2.35 | 44.7 | 6254 |
| Hall B/Phase II—pasteurisation | Point emitter 6 | 11 | 1.0 × 1.4 | 6 | 2.22 | 52.4 | 6254 |
| Hall B/Phase II—alignment | Point emitter 7 | 11 | 1.0 × 1.4 | 6 | 1.66 | 45.1 | 6254 |
| Hall B/Phase III—overgrowth | Point emitter 8 | 11 | 1.0 × 1.4 | 6 | 2.24 | 23.3 | 6254 |
| Scenario No. | Comparative Level of Permissible Concentration of Odours in the Air (ouE/m3) | Permissible Frequency of Exceeding the Reference Level (%) | Based on Guidelines | Emitters Included |
|---|---|---|---|---|
| 1 | 1.0 | 3.0 | draft bill for the Polish Act on counteracting odour nuisance [16,17] | point emitters and surface emitters (Table 1 and Table 3) |
| 2 | 5.0 | 2.0 | Dutch guidelines [16] | point emitters and surface emitters (Table 1 and Table 3) |
| 3 | 1.0 | 3.0 | draft bill for the Polish Act on counteracting odour nuisance [16,17] | point emitters (Table 1 and Table 3) |
| 4 | 5.0 | 2.0 | Dutch guidelines [16] | Point emitters (Table 1 and Table 3) |
| Odour Source | Average Odour Concentration (ouE/m3) * | Odour Emission Form a Single Emitter (ouE/h) | Total Odour Emission (ouE/h) | Percentage Share in Total Emissions (%) |
|---|---|---|---|---|
| Surface emitter 1 | 3919 | 2190.33 | 2190.33 | 8.00 |
| Surface emitter 2 | 8865 | 947.85 | 7582.77 | 27.71 |
| Surface emitter 3 | 4910 | 612.47 | 4287.31 | 15.67 |
| Surface emitter 4 | 3623 | 704.31 | 4930.18 | 18.02 |
| Surface emitter 5 | 7268 | 1466.83 | 1466.83 | 5.36 |
| Surface emitter 6 | 123,613 | 5239.96 | 5239.96 | 19.15 |
| Point emitter 1 | 894 | 14.24 | 85.43 | 0.31 |
| Point emitter 2 | 5899 | 57.98 | 405.83 | 1.48 |
| Point emitter 3 | 1230 | 13.20 | 79.23 | 0.29 |
| Point emitter 4 | 454 | 6.29 | 37.75 | 0.14 |
| Point emitter 5 | 1000 | 11.84 | 71.06 | 0.26 |
| Point emitter 6 | 13,523 | 151.31 | 907.84 | 3.32 |
| Point emitter 7 | 571 | 4.78 | 28.66 | 0.10 |
| Point emitter 8 | 763 | 8.61 | 51.68 | 0.19 |
| SUM | 27,364.86 | 100 | ||
| Point Symbol | Scenario 1 | Scenario 2 | ||||
|---|---|---|---|---|---|---|
| Maximum One-Hour Concentrations (ouE/m3) | Average Annual Concentrations (ouE/m3) | Frequency of Exceedances (%) | Maximum One-Hour Concentrations (ouE/m3) | Average Annual Concentrations (ouE/m3) | Frequency of Exceedances (%) | |
| B1 | 1164 | 12.7 | 19.2 | 1164 | 12.7 | 14.8 |
| B2 | 668 | 5.8 | 15.1 | 668 | 5.8 | 9.9 |
| B3 | 555 | 4.0 | 14.5 | 555 | 4.0 | 8.8 |
| B4 | 578 | 3.3 | 14.4 | 578 | 3.3 | 8.7 |
| B5 | 463 | 2.6 | 13.2 | 463 | 2.6 | 7.1 |
| B6 | 989 | 3.7 | 8.8 | 989 | 3.7 | 6.7 |
| B7 | 761 | 4.2 | 13.7 | 761 | 4.2 | 9.7 |
| B8 | 361 | 1.9 | 12.1 | 361 | 1.9 | 5.2 |
| Point Symbol | Scenario 3 | Scenario 4 | ||||
|---|---|---|---|---|---|---|
| Maximum One-Hour Concentrations (ouE/m3) | Average Annual Concentrations (ouE/m3) | Frequency of Exceedances (%) | Maximum One-Hour Concentrations (ouE/m3) | Average Annual Concentrations (ouE/m3) | Frequency of Exceedances (%) | |
| B1 | 106 | 1.0 | 10.35 | 106 | 1.0 | 4.25 |
| B2 | 87 | 0.5 | 5.72 | 87 | 0.5 | 1.98 |
| B3 | 58 | 0.3 | 5.30 | 58 | 0.3 | 1.42 |
| B4 | 50 | 0.3 | 5.17 | 50 | 0.3 | 1.13 |
| B5 | 47 | 0.2 | 3.84 | 47 | 0.2 | 0.88 |
| B6 | 103 | 0.5 | 5.60 | 103 | 0.5 | 2.35 |
| B7 | 69 | 0.4 | 7.05 | 69 | 0.4 | 1.56 |
| B8 | 38 | 0.2 | 2.84 | 38 | 0.2 | 0.73 |
© 2020 by the authors. Licensee MDPI, Basel, Switzerland. This article is an open access article distributed under the terms and conditions of the Creative Commons Attribution (CC BY) license (http://creativecommons.org/licenses/by/4.0/).
Share and Cite
Sówka, I.; Pawnuk, M.; Miller, U.; Grzelka, A.; Wroniszewska, A.; Bezyk, Y. Assessment of the Odour Impact Range of a Selected Agricultural Processing Plant. Sustainability 2020, 12, 7289. https://doi.org/10.3390/su12187289
Sówka I, Pawnuk M, Miller U, Grzelka A, Wroniszewska A, Bezyk Y. Assessment of the Odour Impact Range of a Selected Agricultural Processing Plant. Sustainability. 2020; 12(18):7289. https://doi.org/10.3390/su12187289
Chicago/Turabian StyleSówka, Izabela, Marcin Pawnuk, Urszula Miller, Agnieszka Grzelka, Alicja Wroniszewska, and Yaroslav Bezyk. 2020. "Assessment of the Odour Impact Range of a Selected Agricultural Processing Plant" Sustainability 12, no. 18: 7289. https://doi.org/10.3390/su12187289
APA StyleSówka, I., Pawnuk, M., Miller, U., Grzelka, A., Wroniszewska, A., & Bezyk, Y. (2020). Assessment of the Odour Impact Range of a Selected Agricultural Processing Plant. Sustainability, 12(18), 7289. https://doi.org/10.3390/su12187289