Article

Comparing Human Activity Density and Green Space Supply Using the Baidu Heat Map in Zhengzhou, China

1
College of Forestry, Henan Agricultural University, Zhengzhou 450002, China
2
College of Information and Management Sciences, Henan Agricultural University, Zhengzhou 450002, China
3
School of Forest Resources and Environmental Science, Michigan Technological University, Houghton, MI 49931, USA
*
Authors to whom correspondence should be addressed.
Sustainability 2020, 12(17), 7075; https://doi.org/10.3390/su12177075
Submission received: 18 June 2020 / Revised: 24 August 2020 / Accepted: 26 August 2020 / Published: 30 August 2020
(This article belongs to the Special Issue Big Data in a Sustainable Smart City)

Abstract

:
Rapidly growing cities often struggle with insufficient green space, although information on when and where more green space is needed can be difficult to collect. Big data on the density of individuals in cities collected from mobile phones can estimate the usage intensity of urban green space. Taking Zhengzhou’s central city as an example, we combine the real-time human movement data provided by the Baidu Heat Map, which indicates the density of mobile phones, with vector overlays of different kinds of green space. We used the geographically weighted regression (GWR) method to estimate differentials in green space usage between weekdays and weekends, utilizing the location and the density of the aggregation of people with powered-up mobile phones. Compared with weekends, the aggregation of people in urban green spaces on workdays tends to vary more in time and be more concentrated in space, while the highest usage is more stable on weekends. More importantly, the percentage of weekday green space utilization is higher in small parks and green strips in the city, with the density increasing in those small areas, while the green space at a greater distance to the city center is underutilized. This study validates the potential of applying Baidu Heat Map data to provide a dynamic perspective of green space use, and highlights the need for more green space in city centers.

1. Introduction

Creating urban green space has many economic and ecological benefits, such as improving air quality [1], mitigating the urban heat-island effect [2], providing wildlife habitats [3,4], preventing floods and soil erosion [5], increasing recreational opportunities [6], enhancing aesthetic value [7], promoting physical and mental health [8], and encouraging people’s sense of spiritual well-being [9]. Planning urban green space requires consideration of its ecological service functions and a thorough understanding of the factors that promote its use, which in turn requires information about the frequency and distribution of access to these green spaces if equitable access to green space is to be maintained. At present, a number of studies have examined the factors associated with people’s utilization of urban green space [10,11] and the extent and frequency of urban green-space use [12]. This knowledge is critical to the planning of green space in high-density cities, however, collecting green space usage data is expensive and time-consuming if collected in person in the field.
The Chinese government began systematic planning of urban green space comparatively later than other countries. For example, Zhengzhou started to build parks in the 1990s when the existing green space did not meet the needs of its growing population. With the recent increase in economic development and the expansion of cities, new towns have more green-space resources and lower human density, while old towns have higher human density and insufficient park area due to the lack of unoccupied areas in which to build more parks [13]. Thus, adding green space to old towns is far more difficult given the competing demands for land. In 2008, the Chinese government implemented the “landscape garden city” policy, dictating that a city’s percentage of green space should be no less than 37% of the total administrative area [14]. The policy does not require that these additional green spaces should be in specific areas, nor does it stipulate requirements for use. Thus, although landscape architects and urban planners have considerable discretion to meet the policy target (often determined more by political processes than technical feasibility), these professions must determine how and where to add more green space.
Identifying spatial and temporal patterns of human activity in green spaces provides evidence of the utility of these elements and support for urban planning and management decisions [15]. Personal location-aware devices and location-based services, such as mobile phones and exercise trackers, provide critical information for citizen science and big data projects [16,17,18]. For instance, GPS tracker enabled mobile devices and online platforms hosting geolocated user-generated content provide detailed information about the location and activities of large numbers of individuals over time. Different elements of user-generated data sets, such as geotags, timestamps, digital content, and user information, provide new possibilities for studying the use of green spaces from different perspectives [6,19]. Big data generated by geographical location software, such as the Baidu Heat Map, offer a new perspective for urban research, enabling the visualization of the use of popular attractions and urban space in cities from a dynamic perspective [20]. The Baidu Heat Map was developed by the Baidu company to provide image data services for optimizing user travel decisions; the data has been integrated into the service function of the Baidu map mobile application. The Baidu Heat Map is based on the location data generated by the users of popular Baidu products that use the positioning service. The “heat” of the map represents the density (humans per area) per cell of the map, and the density is presented as different colors and continuously updated every 15 min. Early applications of these data for spatially explicit urban activity have used mobile phone data to examine how people move within and between cities [21,22,23,24,25], while others utilized user-generated geographic information to calculate core density and analyze the distribution and supply of infrastructure [26,27,28].
Here, we demonstrate a novel approach for analyzing the temporal and spatial use of green spaces in Zhengzhou city, based on Internet-collected big data. In this approach, we focus on the identification of spatial hotspots of green space use, specifically when and where green space utilization is highest, as well as the popularity of different kinds of green space by comparing their use relative to their availability. By doing so, we demonstrate the utility of spatially explicit personal device data to inform sustainable spatial planning and green space management in cities.
This article is structured as follows: Section 2 describes the Baidu database, processing, analytical framework, and methods. Section 3 presents the spatiotemporal features of human activity density and relationship between human activity and different types of green space. Section 4 and Section 5, respectively, offer the discussion and final conclusions.

2. Materials and Methods
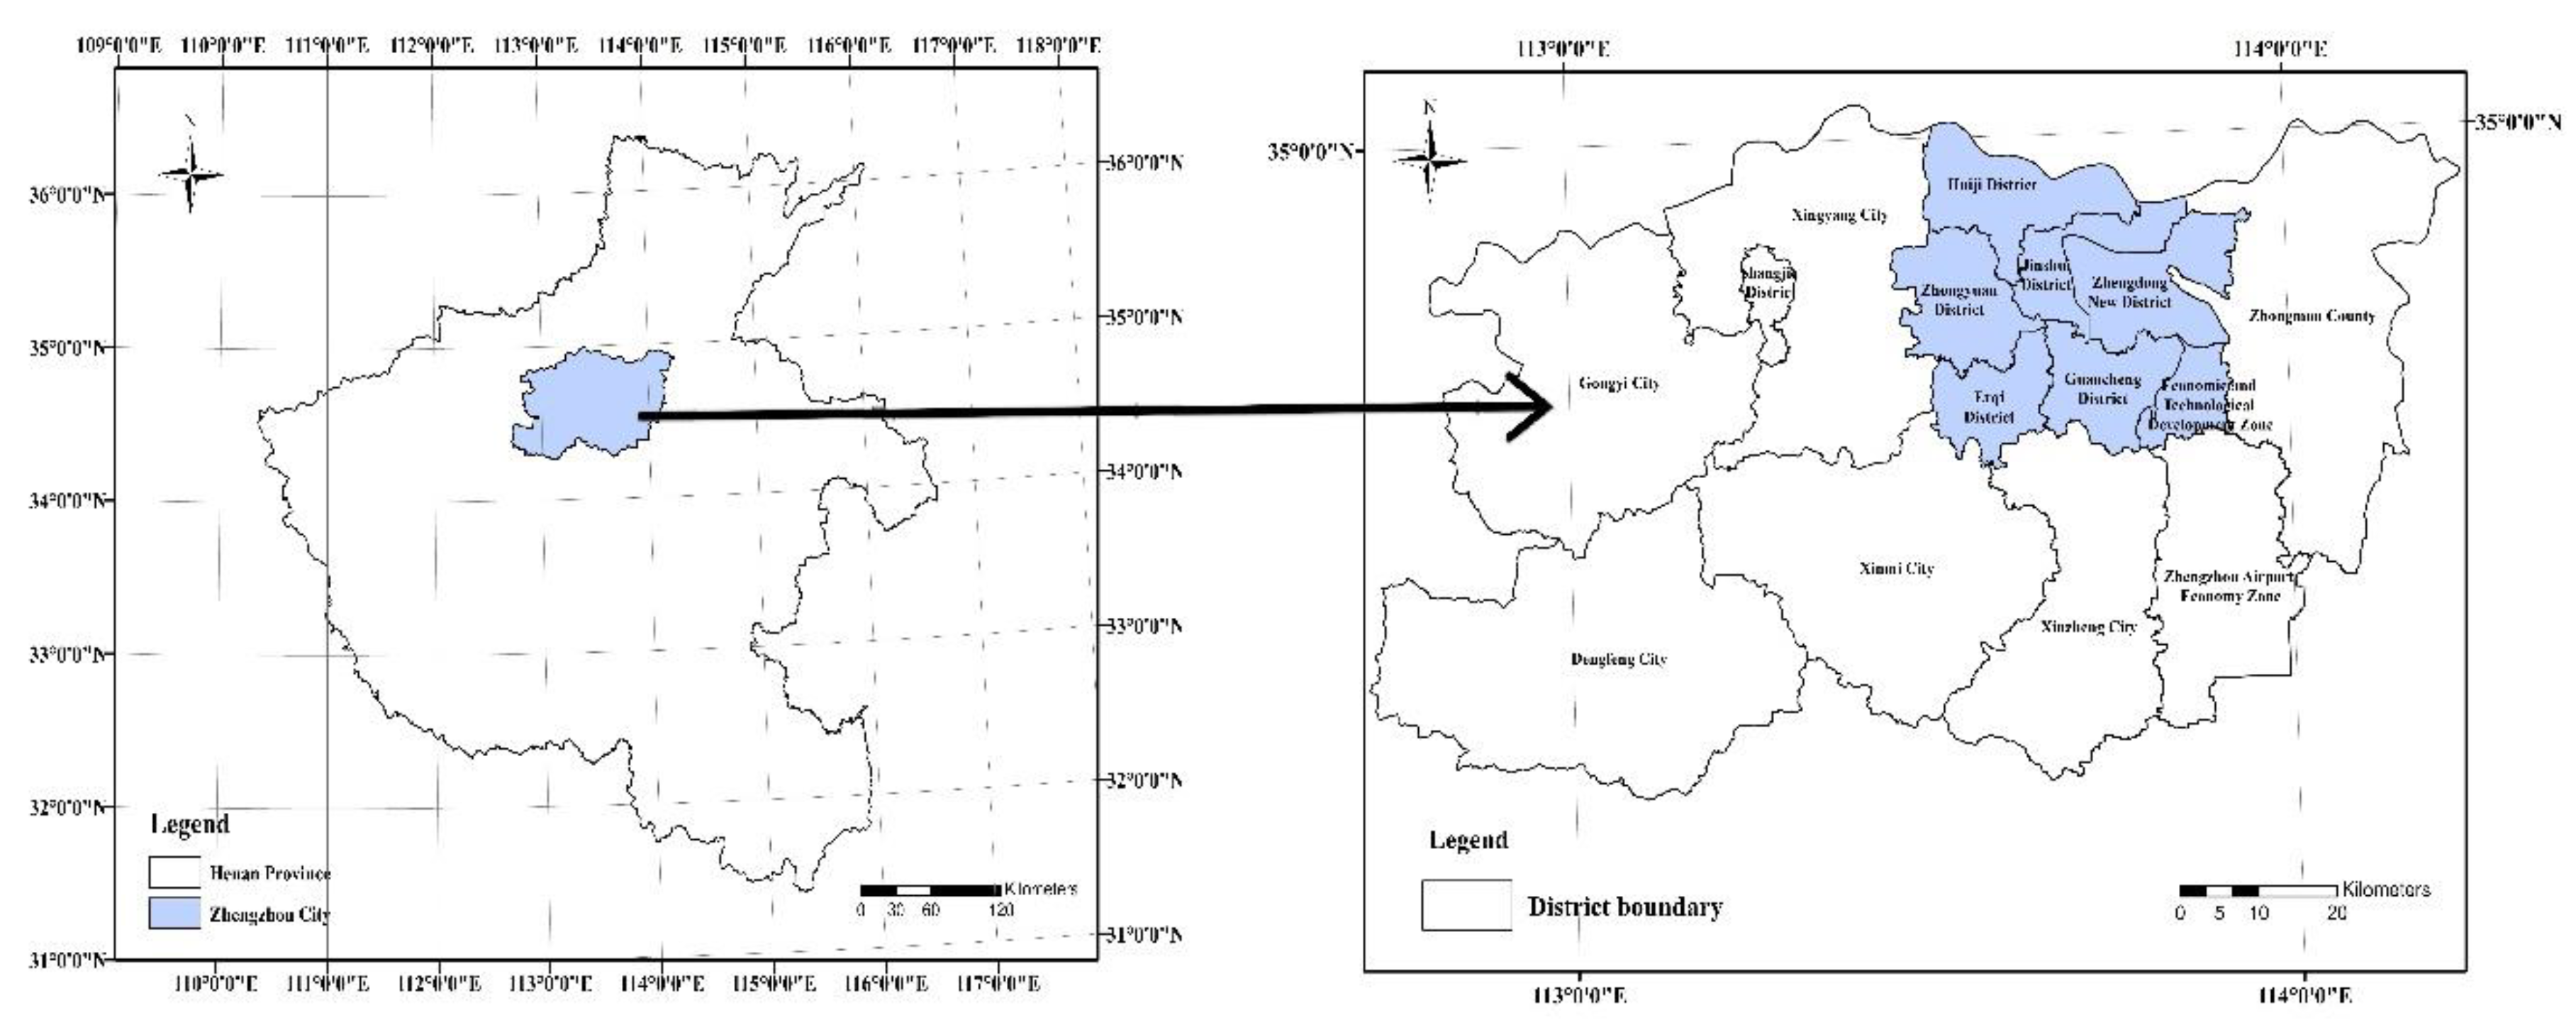
2.1. Study Area

Zhengzhou, the capital of Henan Province, is a typical Chinese megacity. Its boundaries lie between 112.42° E and 114.14° E longitude and 34.16° N and 34.58° N latitude (Figure 1). According to the Zhengzhou Statistical Information Net, at the end of 2019 the area under the city’s administration was 7511 km2, and its built-up area was 549.33 km2. The total population of Zhengzhou at the end of 2019 was 10.14 million (2018 Henan Statistical Yearbook). We selected Zhengzhou’s central districts as our study area, which included the seven districts of Jingshui, Zhongyuan, Erqi, Quancheng, Huiji, Zhengdongxinqu, and Jingjijishukaifaqu.

2.2. Data Sources and Preprocessing

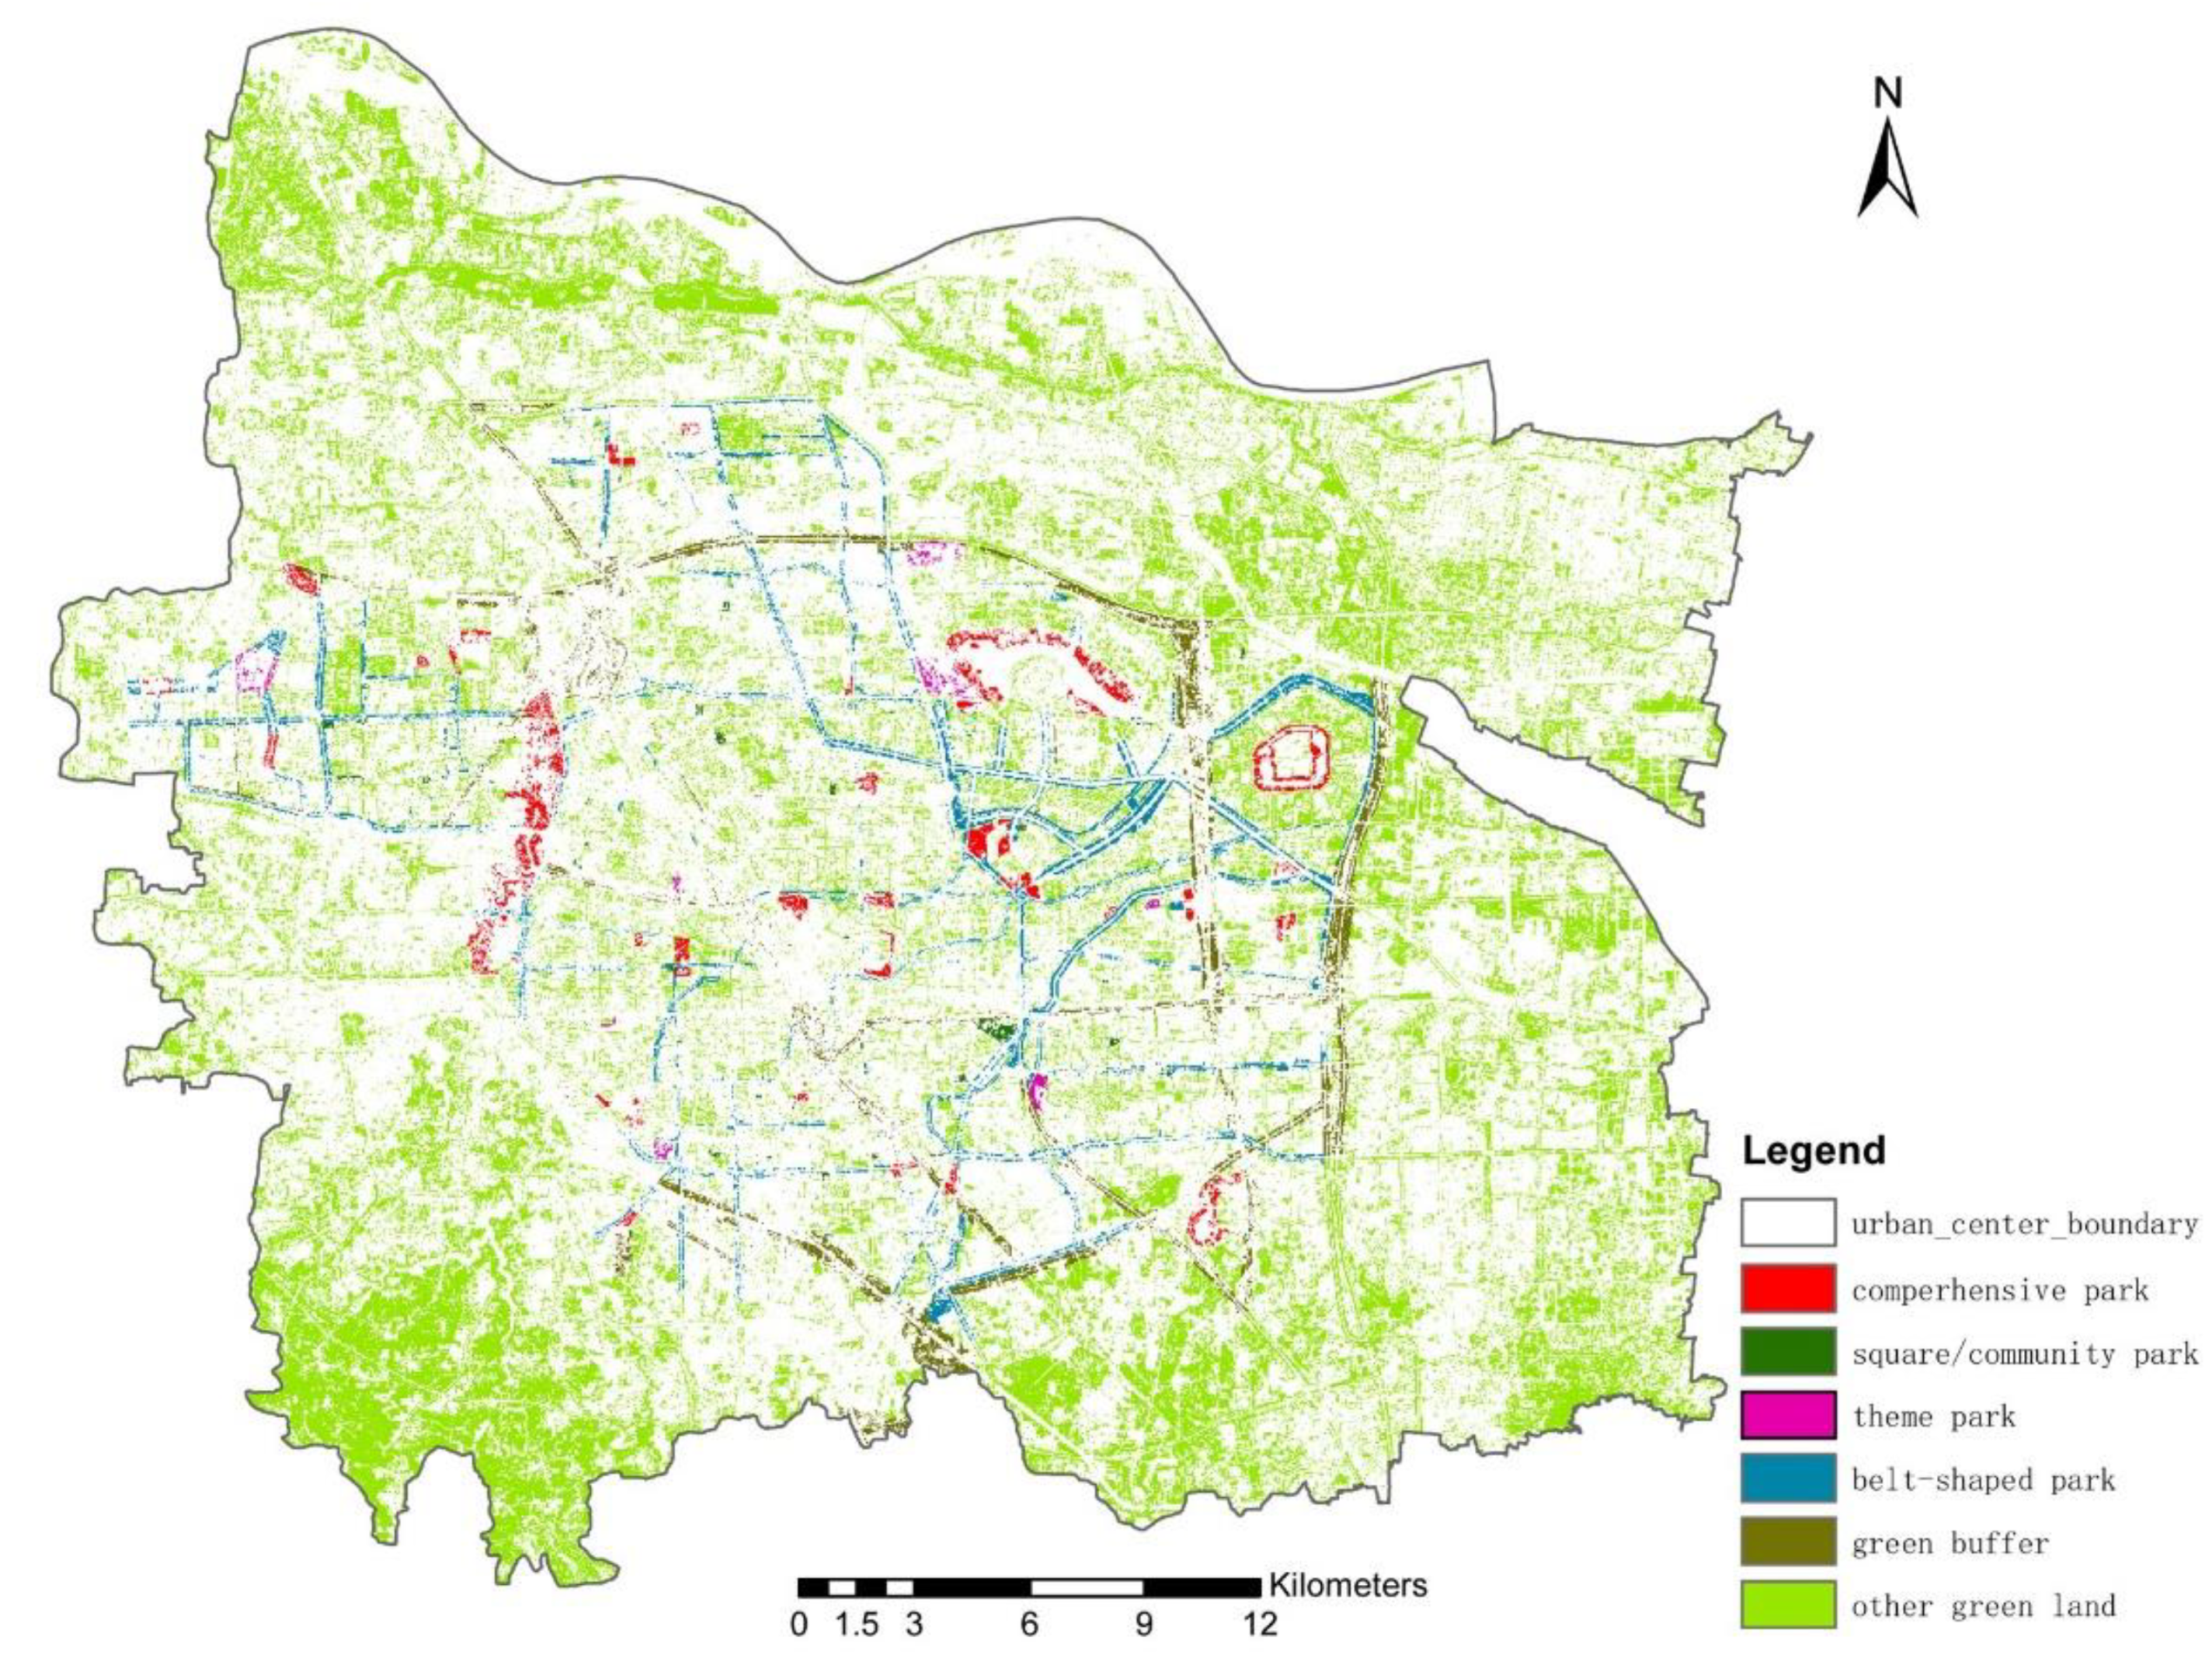
2.2.1. Classification of Urban Green Space

We used satellite images (Landsat 8 OLI_TIRS, resolution 30 m × 30 m) taken on 5 May 2017 from the Geospatial Data Cloud website (http://www.gscloud.cn) to classify land use and green space cover in the Zhengzhou region. The images were re-projected into the World Geodetic System (WGS) 1984_UTM_49N coordinates and geometrically corrected with specification error <0.5 pixels. Images were corrected for atmospheric radiation and topography using a DEM image (30 m) that was downloaded from the Geospatial Data Cloud (www.gscloud.cn). An administrative map (1:250,000) was used for image registration. We used a combination of supervised classification and manual interpretation (using ENVI 5.0 and historical maps in Google Earth Pro) to interpret and classify the images, identifying current green space. This process utilized band combinations 6/5/4 and 5/3/2 for Landsat 8. Training data were selected for each class using the Maximum Likelihood Algorithm to produce the primary classification raster file in the Classification Workflow tool of ENVI 5.0. Then the current planning document for green space (Zhengzhou Green Space System Planning (2013–2030)) was superimposed to correct for classification errors, and the green space-type correction was identified (Figure 2). Spatial analysis was subsequently conducted using ArcGIS 10.0 software to analyze the spatial distribution characteristics of these spaces. We calculated the quantity and area of the six kinds of urban green spaces in central Zhengzhou (Table 1). Finally, we determined the current status of the distribution of green space. These six types of urban green spaces were the objects of the study: comprehensive parks, public square or community parks, theme parks, belt-shaped parks, green buffers, and other green spaces.

2.2.2. Human Activity Density Estimation (Baidu Heat Map Layout)

Baidu is a popular Chinese search engine. The Baidu Heat Map is the product of a service platform that contains the location data of mobile-phone users (Figure 3). The Baidu company uses the term “heat map” to refer to the density or concentration of users in an area, with “hotter” values indicating higher user densities. The software can display real-time differences in user distribution at the population level in different colors on the network map (Figure 4). As the Baidu Heat Map is a commercial product, the metadata behind the map is not open to the public, but one can identify changes in human activity density (HAD) by differences in map brightness [29,30]. To conduct a quantitative analysis, data were collected from the official application program interface (API) of Baidu (Ibsyun.baidu.com) for four consecutive days in May 2017 and four consecutive days in February 2019 (4 weekdays and 4 weekends) in the study area (format is a raster-based Geotiff with a resolution of 3.38 m × 3.38 m). A one-hour capture time interval was used and a total of 208 pieces of data were collected for the study. Geographic information system (GIS) tools were used to overlay the brightness values (values between 0 and 179 in each pixel) of the raster data (Figure 3) onto the fourth bands of Baidu’s Heat Map data. The superimposed raster data (per hour of weekdays and weekends overlaid) produces a map of population concentration, with cells of high values (brightness) indicating high mobile phone user density.

2.3. Methodology

2.3.1. Analytical Framework

This study conducted an exploratory spatial analysis of HAD and its relationship with different types of urban green space using an analytical framework. Figure 5 illustrates the two main sources of Internet-collected big data used in our research. The first source was location-based HAD data at different time-points and different days obtained from the Baidu Heat Map (based on the location-based service). The second data source was remote-sensing maps of classified urban green space, which were overlaid onto the Baidu Heat Map data. It was necessary to perform spatial matching on the different data sources using standardized grids covering the study area to rectify spatial scales. The geographically weighted regression (GWR) method used in this study and the estimation method of the gradient analysis of the spatiotemporal characteristics of HAD are shown below [31,32].

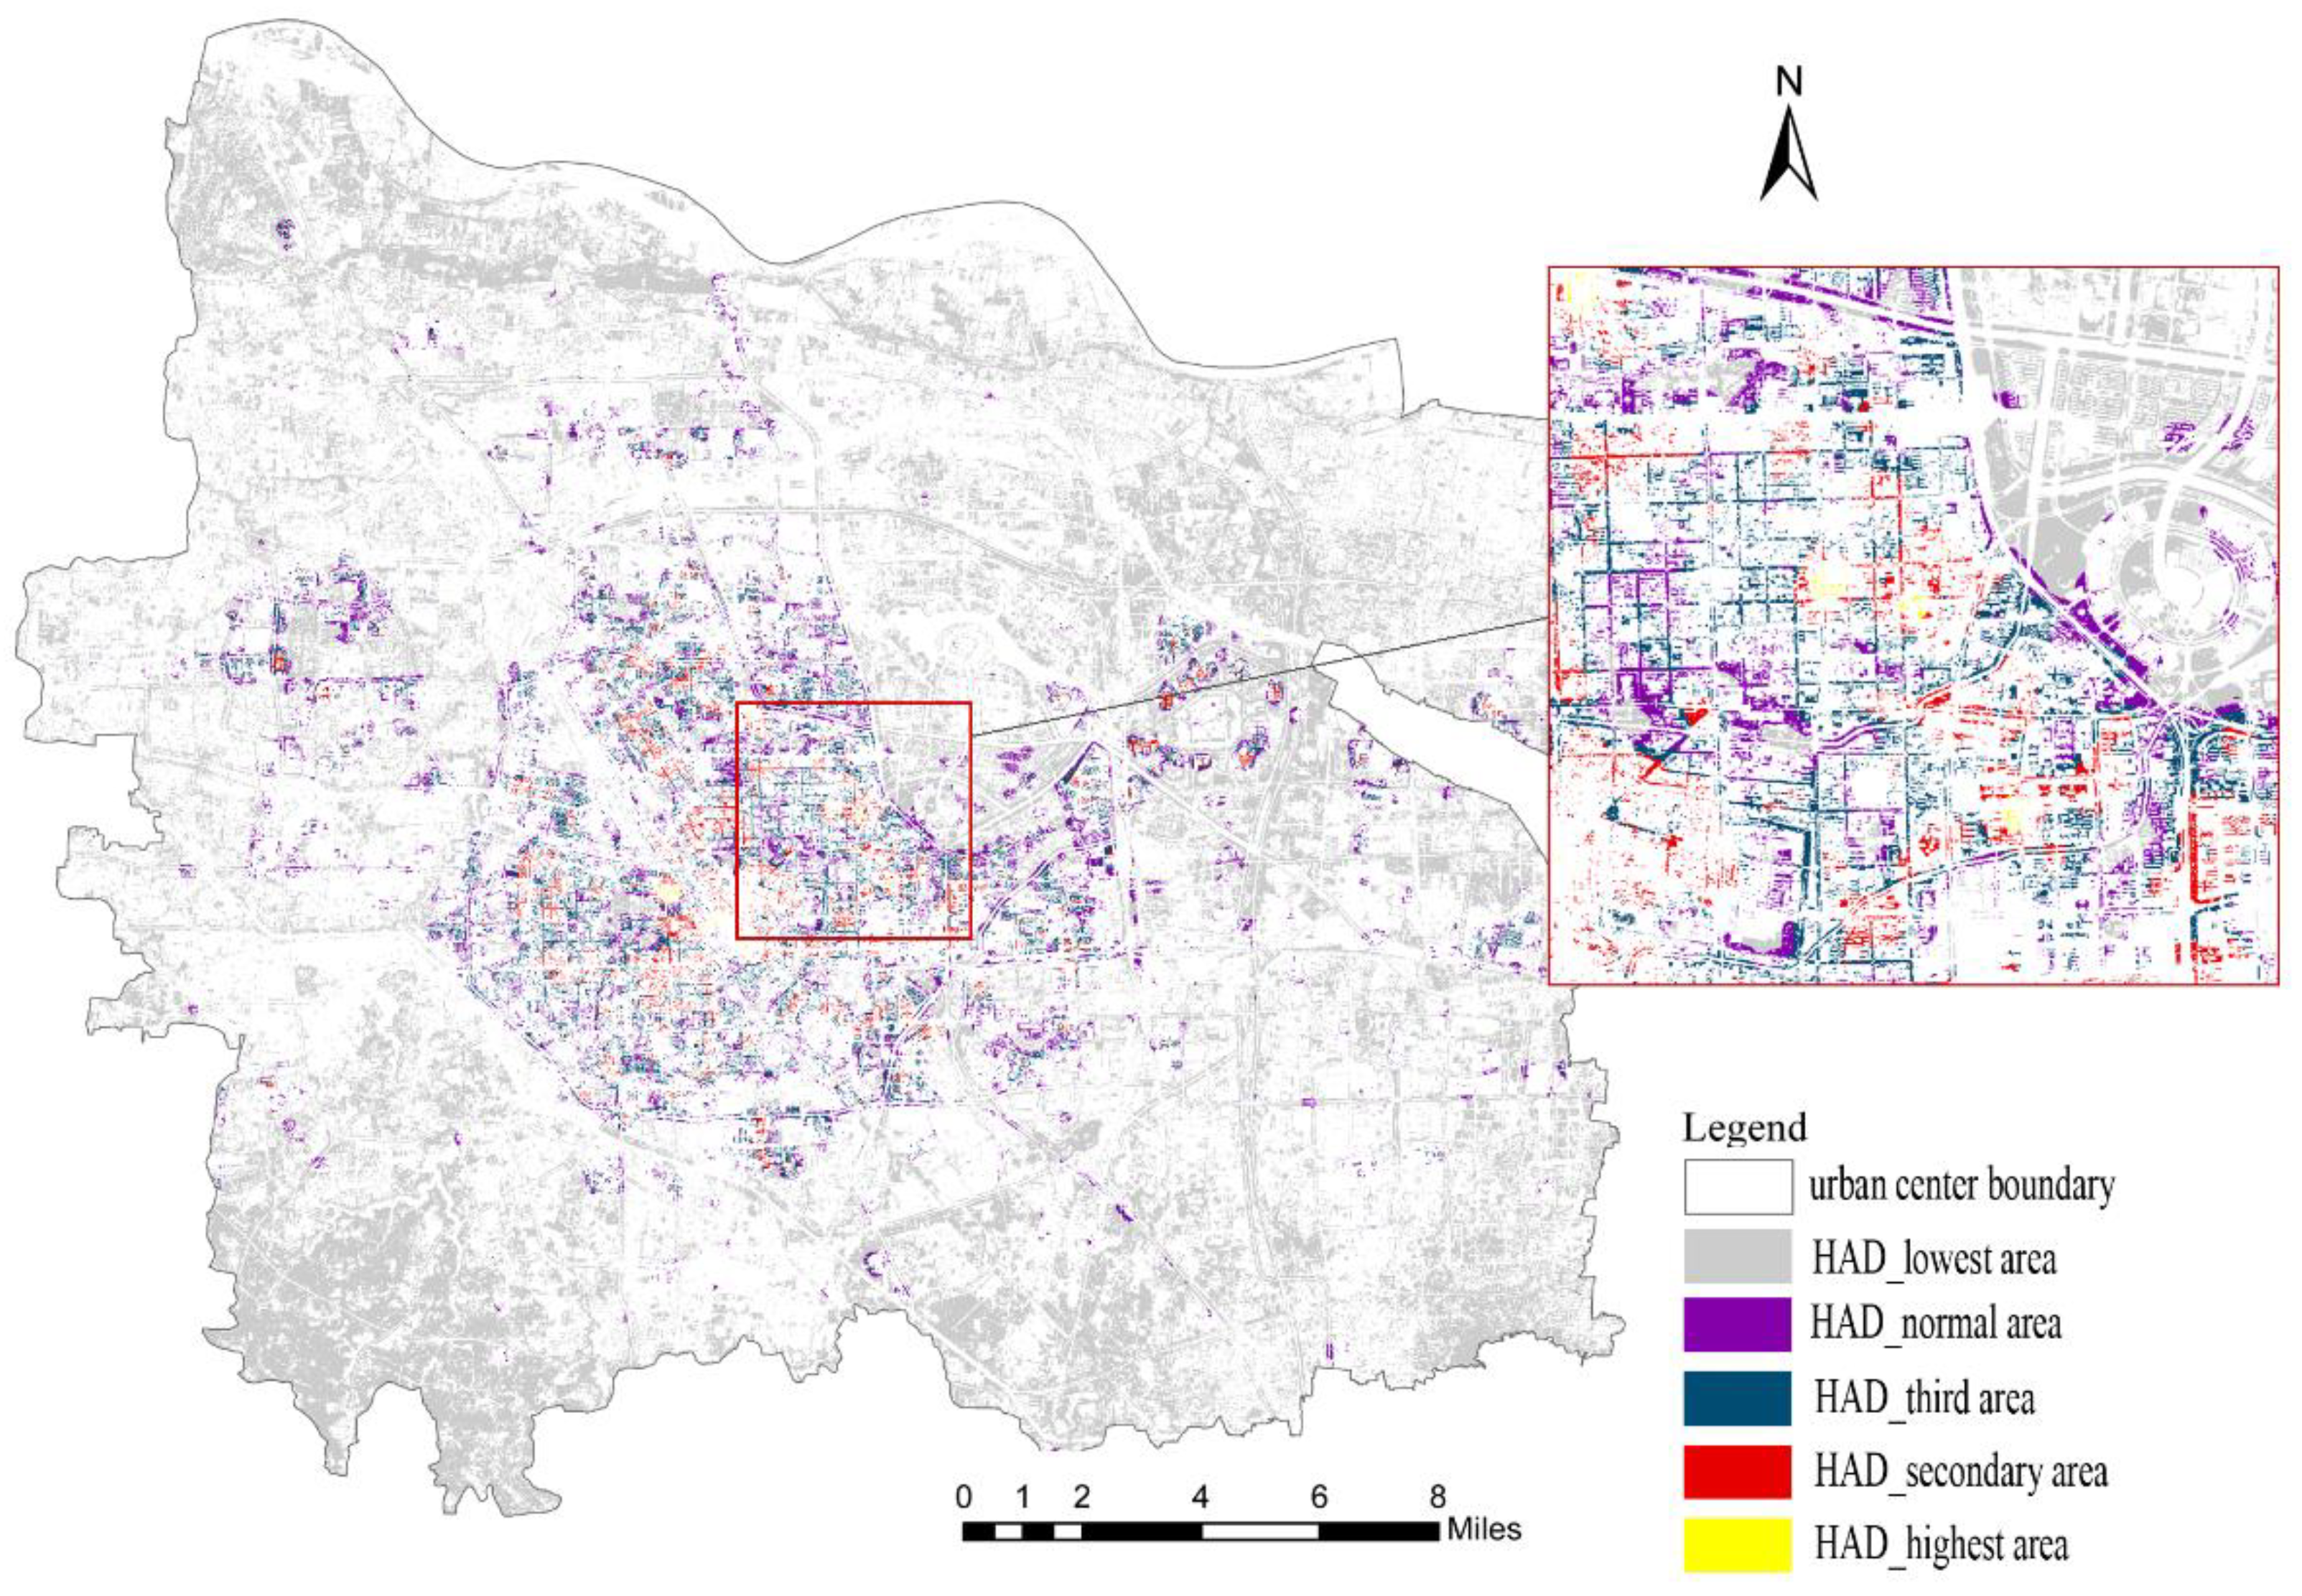
2.3.2. HAD Data Conversion and Assignment

As population-oriented data visualization software, the Baidu Heat Map can directly indicate population density as represented by the different colors in its application. We used GIS software to transform raster images into vector quantities for processing and geographic coordinate projection. We recognize that the use of mobile-phone data instead of real data on population distribution entails a certain degree of error, as it only collects data on individuals carrying mobile phones with the power on (it will fail to detect individuals with no phones or inactive phones). Therefore, the Heat Map is only able to show the approximate distribution of people in geographical space, and is not a substitute for actual data on population density. Nevertheless, for the purpose of this study, we used the raster intensity of the Baidu Heat Map as an approximate measure of population density [33]. We assumed for every hour the average heat value was given by:
H ¯ =   H ix / 17
where H ¯ is the average population intensity of unit i of per day, H ix the population intensity of unit i at x time, x = 7:00, 8:00, 9:00, … 23:00 (17 h of one day), i = unit 1, 2, 3, … n. Then, in order to ensure the accuracy of HAD value, we selected 4 days during the work week (17/05/08, 17/05/09, 19/02/25, 19/02/26) and 4 days on weekends (17/05/06, 17/05/07, 19/02/23, 19/02/24), and overlapped again to find the average of 4 days. Finally, we calculated the workday’s average HAD value H d and the weekend’s average HAD value H e based on Formula (1).
The superimposed results were reclassified according to the Jenks natural breaks classification method [34], which is a data clustering method designed to assign the best arrangement of values into different classes. To improve the quality of the data, we first geo-referenced a raster dataset, set the same environment, and then cleaned the abnormal data and no-value point. Then we recorded the raster intensity data of all the time points and calculated the normalized human activity density (ZHAD) at each time period for the weekdays and weekends, according to Formula (1). These were classified as 1, 3, 5, 7, and 10, respectively. We used set S to represent the classification result [34], where s i is an element in set S , taking the values 1, 3, 5, 7, and 10 when we used the natural break classification. Next, we used the overlay method in GIS to combine the green space distribution map of the city with the Heat Map raster data to calculate the urban green space usage rate (density of humans per cell). Green land was extracted from the urban land and defined as 10. After the overlay, the set of results were obtained: zero represents the highest HAD of green land, for the other 4 results, the higher the result, the higher the HAD, which is defined by
S = { s i max { S } }
Shighest represents the areas of the grid that had the largest number of people in the green space, which is considered to be excess occupancy; Ssecondary represents the area of the next highest tier of occupancy using the green space; Sthird represents the area of the third-highest tier of occupancy of green space; Snormal is the area of normal (average) occupancy; Slowest is the area in the lowest occupancy tier. In the end, we counted the area occupied by five classifications and these classifications represent the five classifications of HAD (HAD highest, HAD secondary, HAD third, HAD normal, HAD lowest).
According to the histogram of the S data distribution at different points in time (Figure 6), there was a significant difference between the mean and median of the data for weekdays and those for weekends, as well as between different time points.

2.3.3. Analysis of Human Activity Density Change in Urban Green Space

By comparing the HAD of weekdays and weekends and green space classification maps, we were able to analyze the spatial distribution map of the HAD of all types of urban green space (from the core city center to the urban suburbs). Then, we converted the raster dataset to polygon features in GIS software and calculated the area of each type of green space in each time period. We compared the location and area of human activity density by occupancy tiers in different time periods (weekdays + weekends) and compared them with the existing quantity of urban green space.

3. Results of the Analysis

3.1. Spatiotemporal Features of Human Activity Density

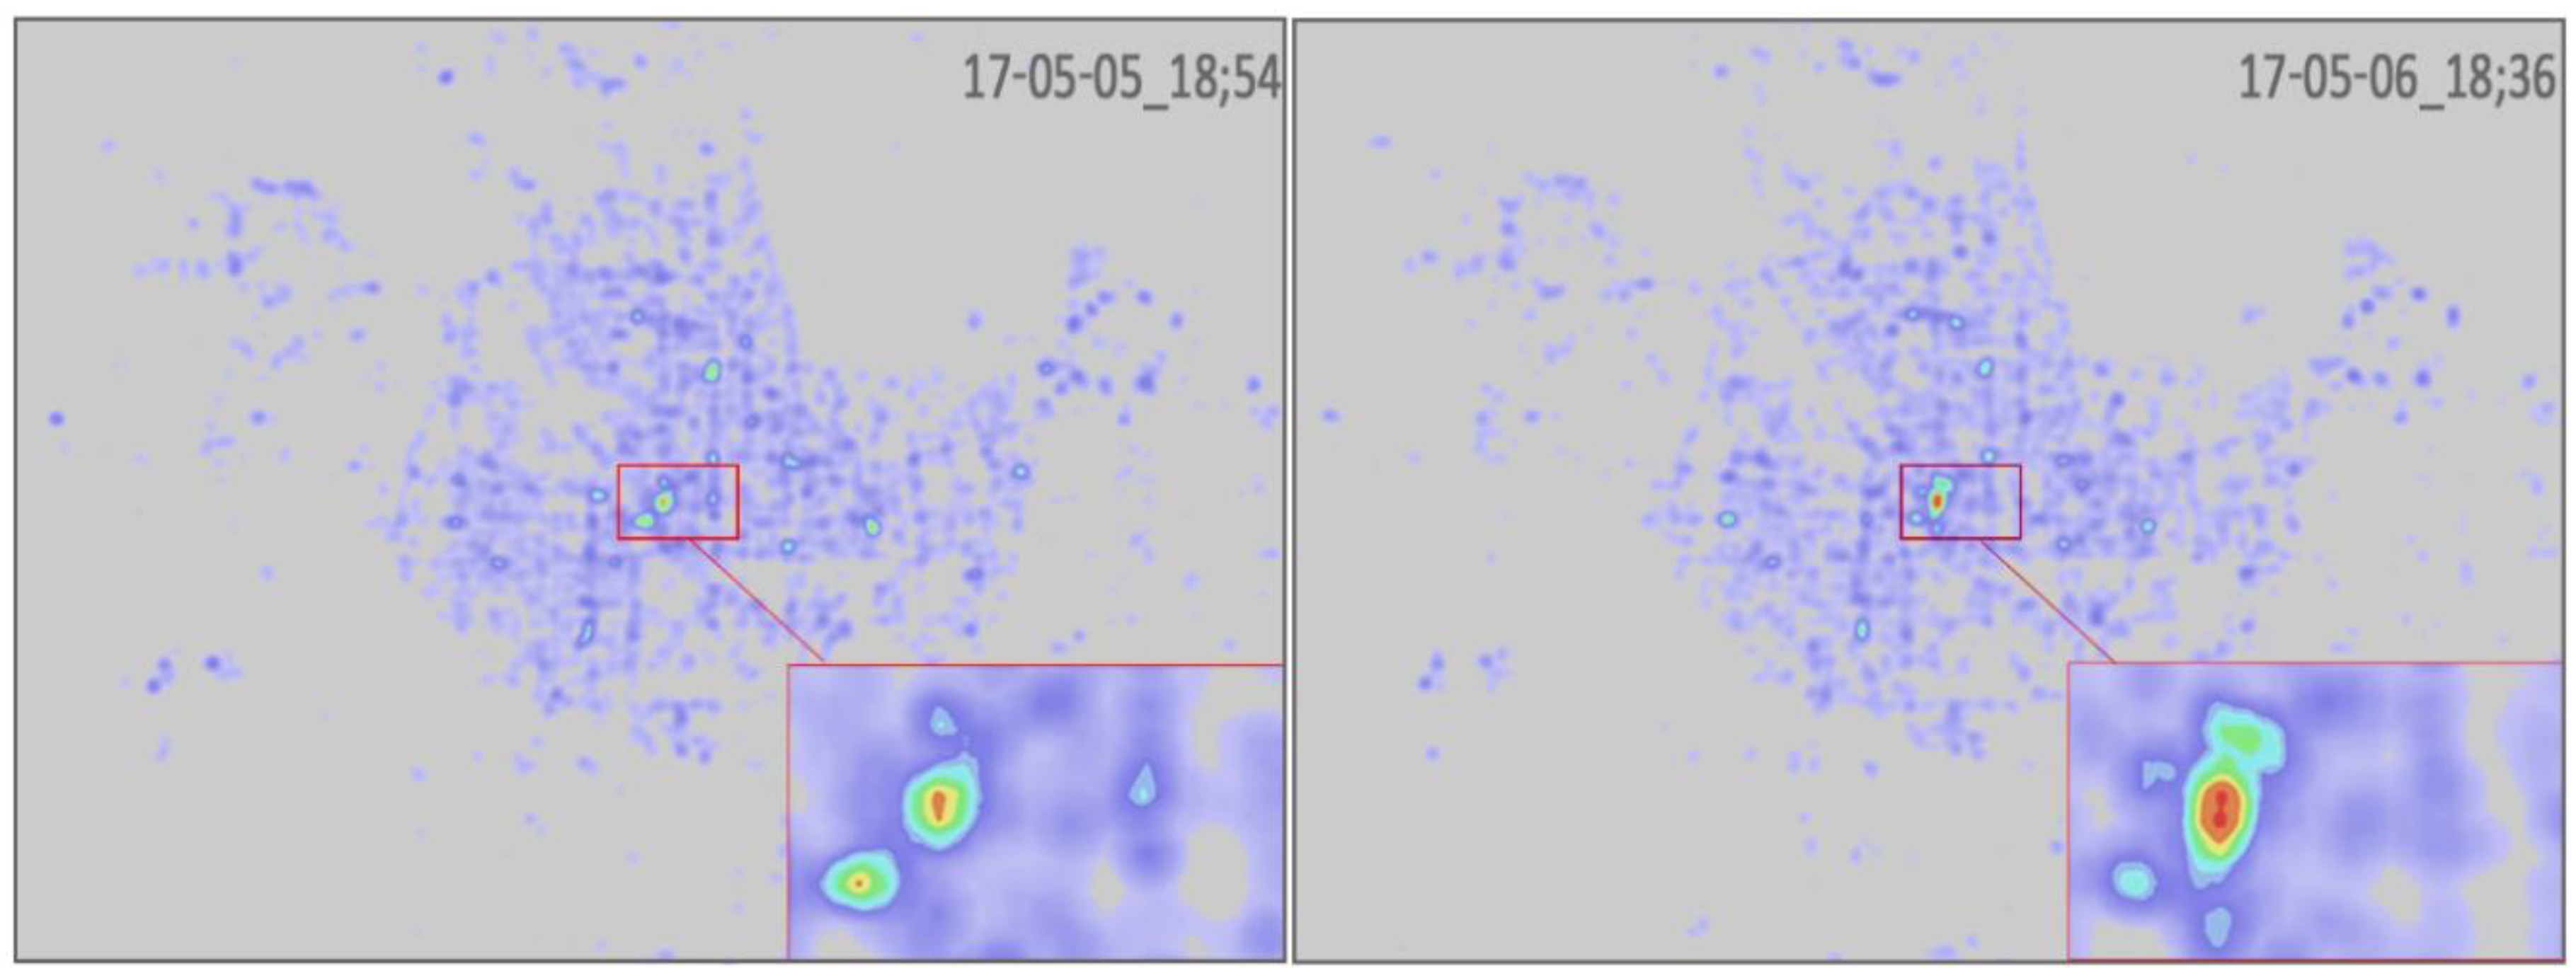
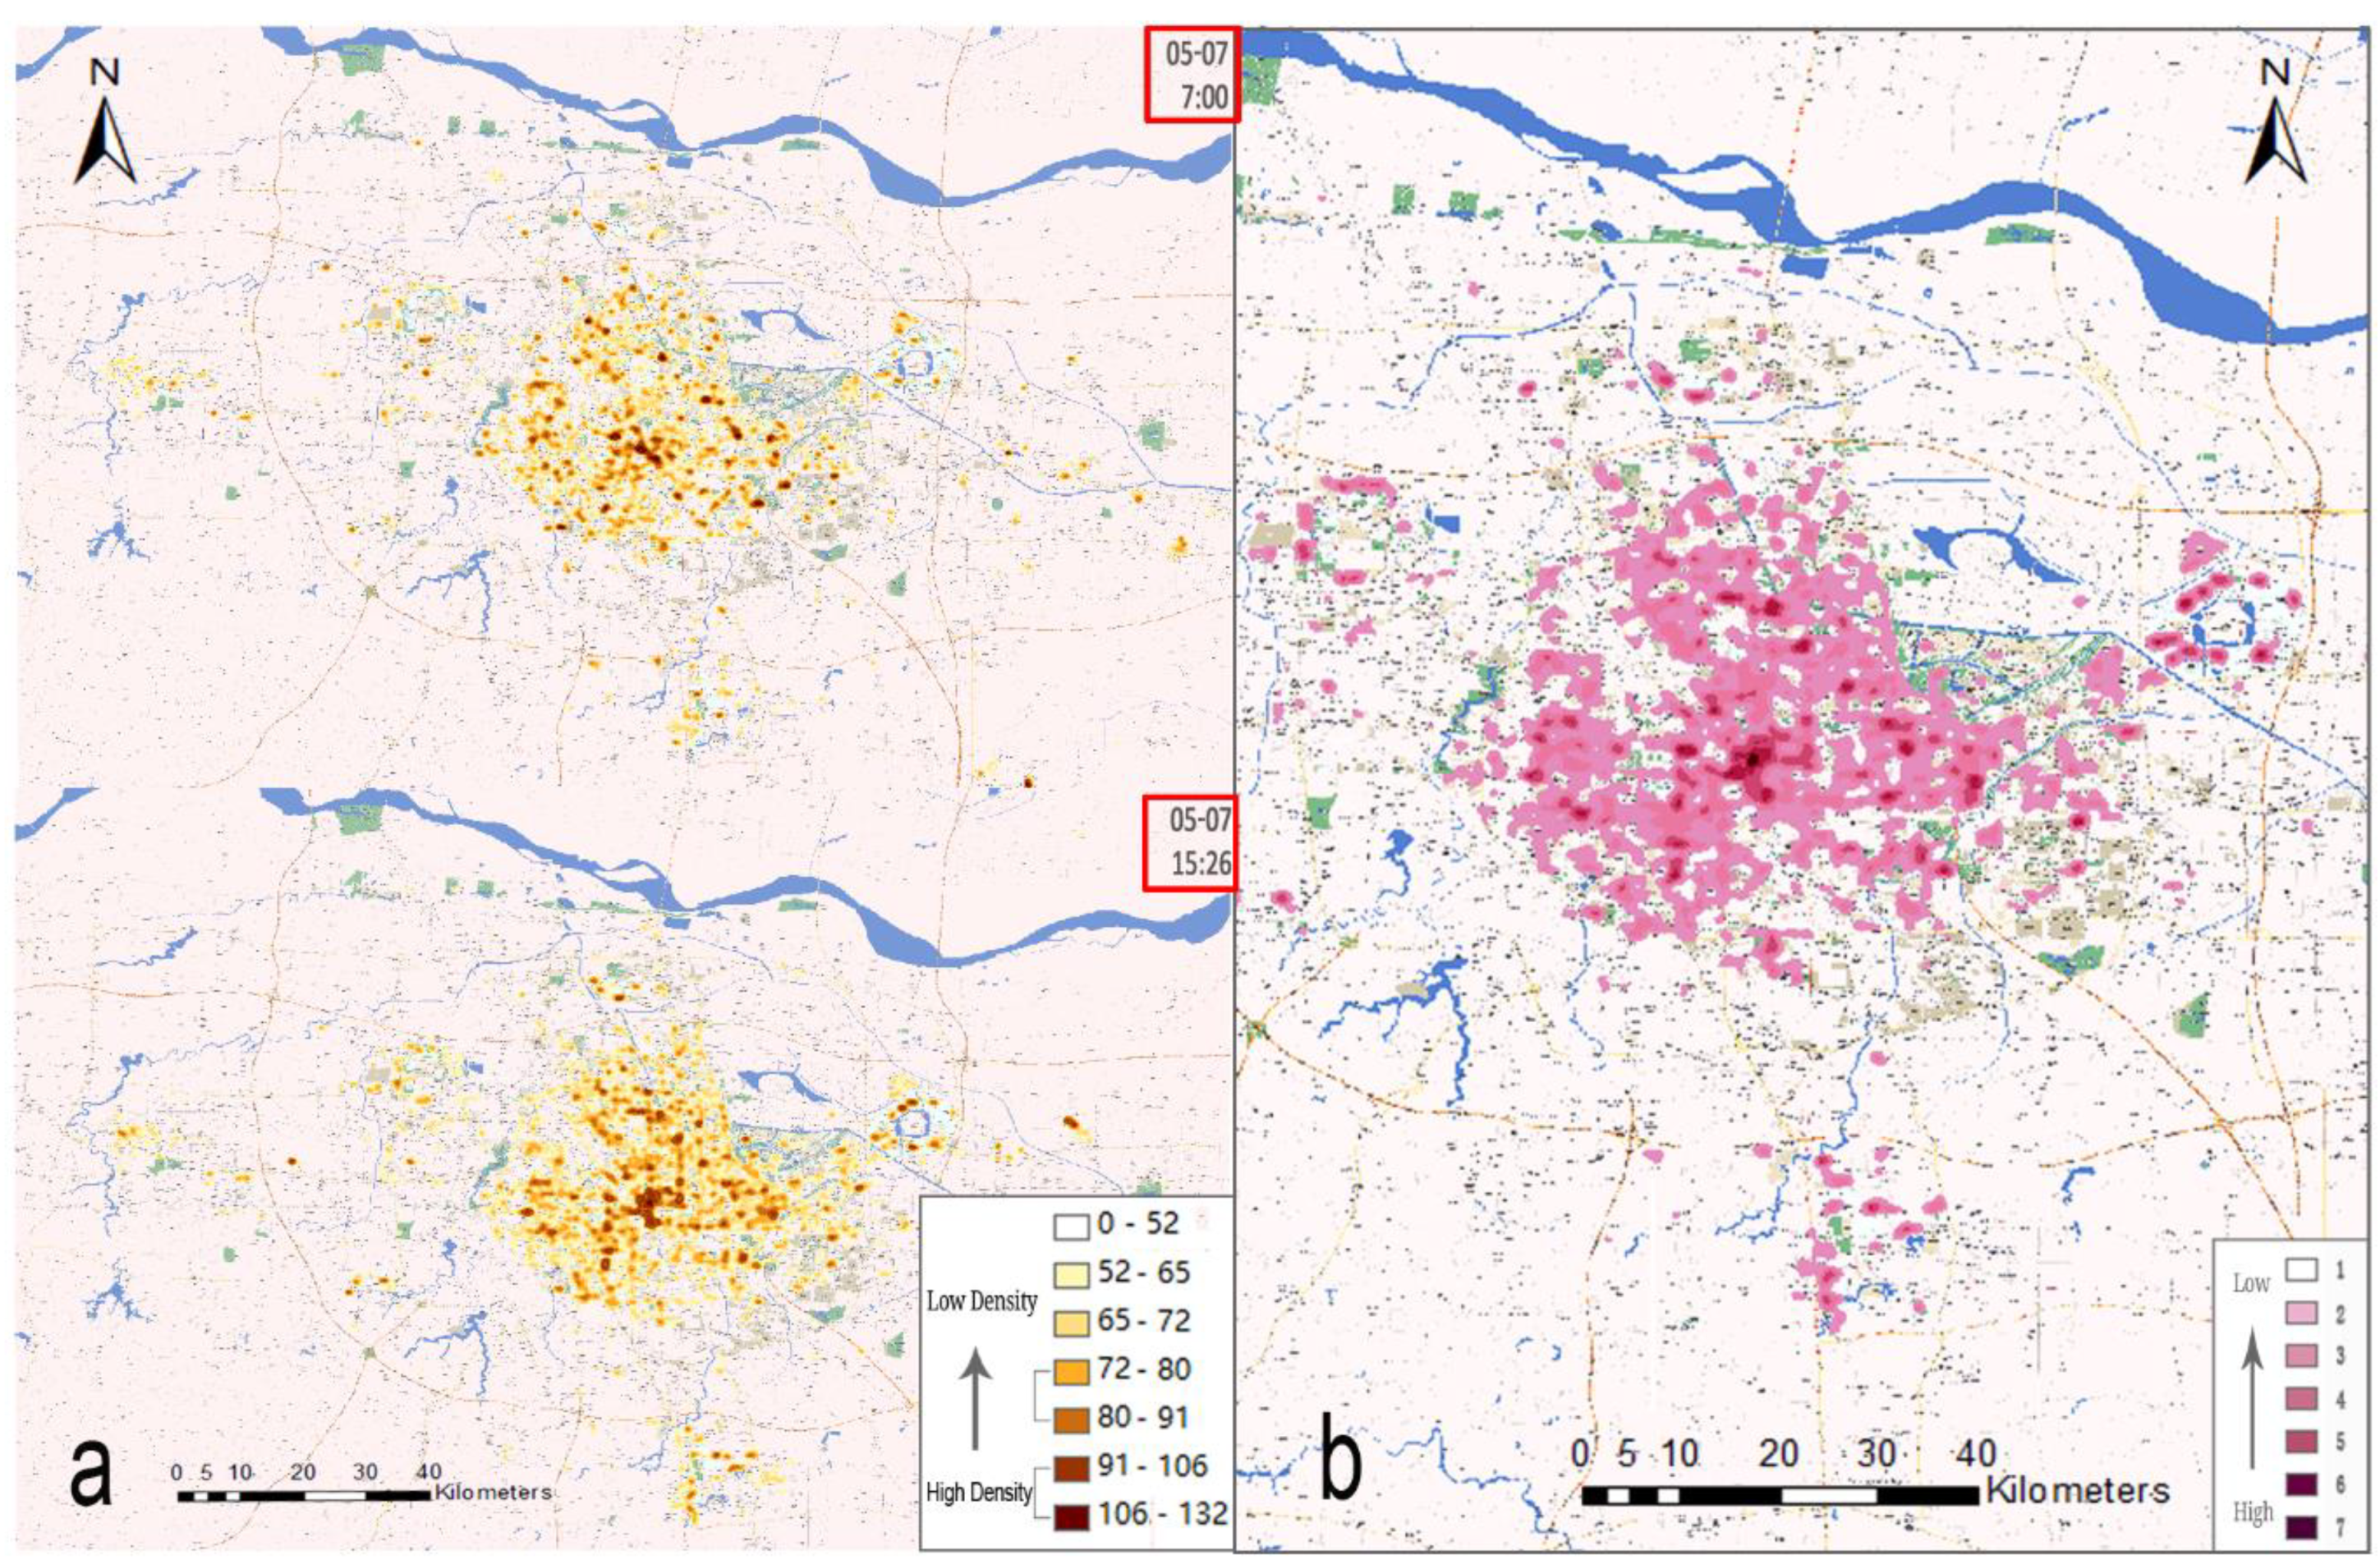
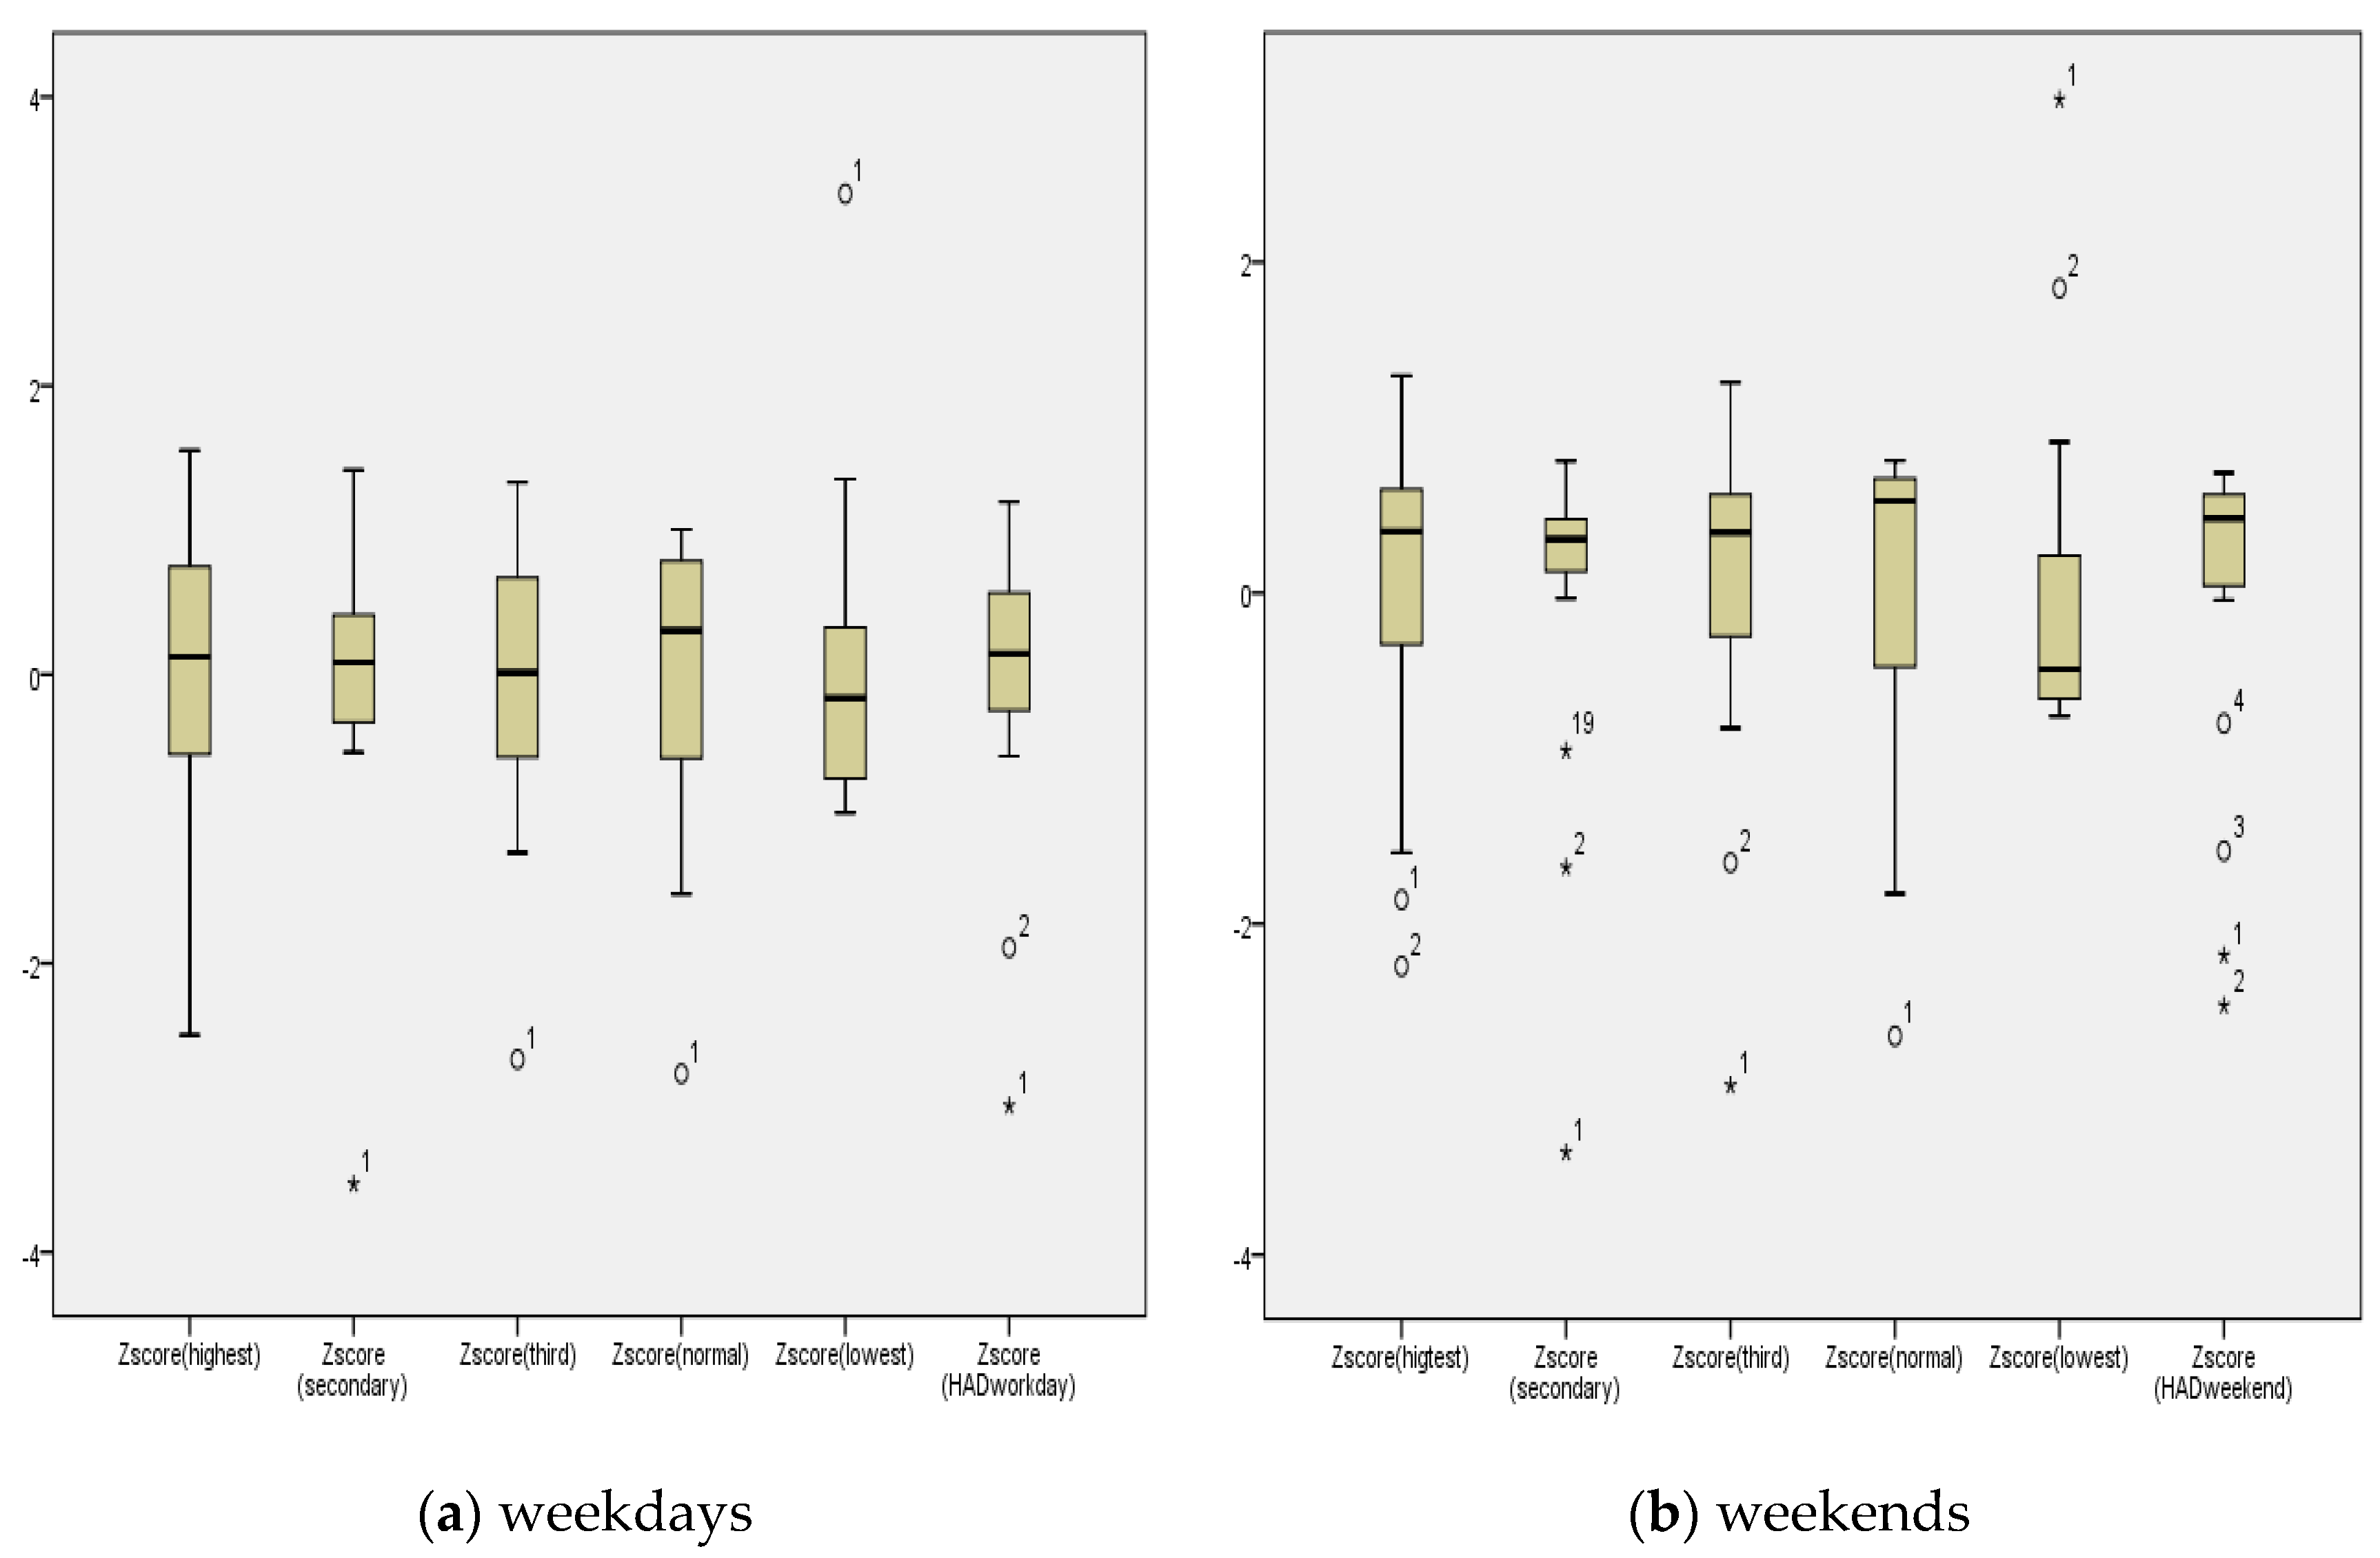
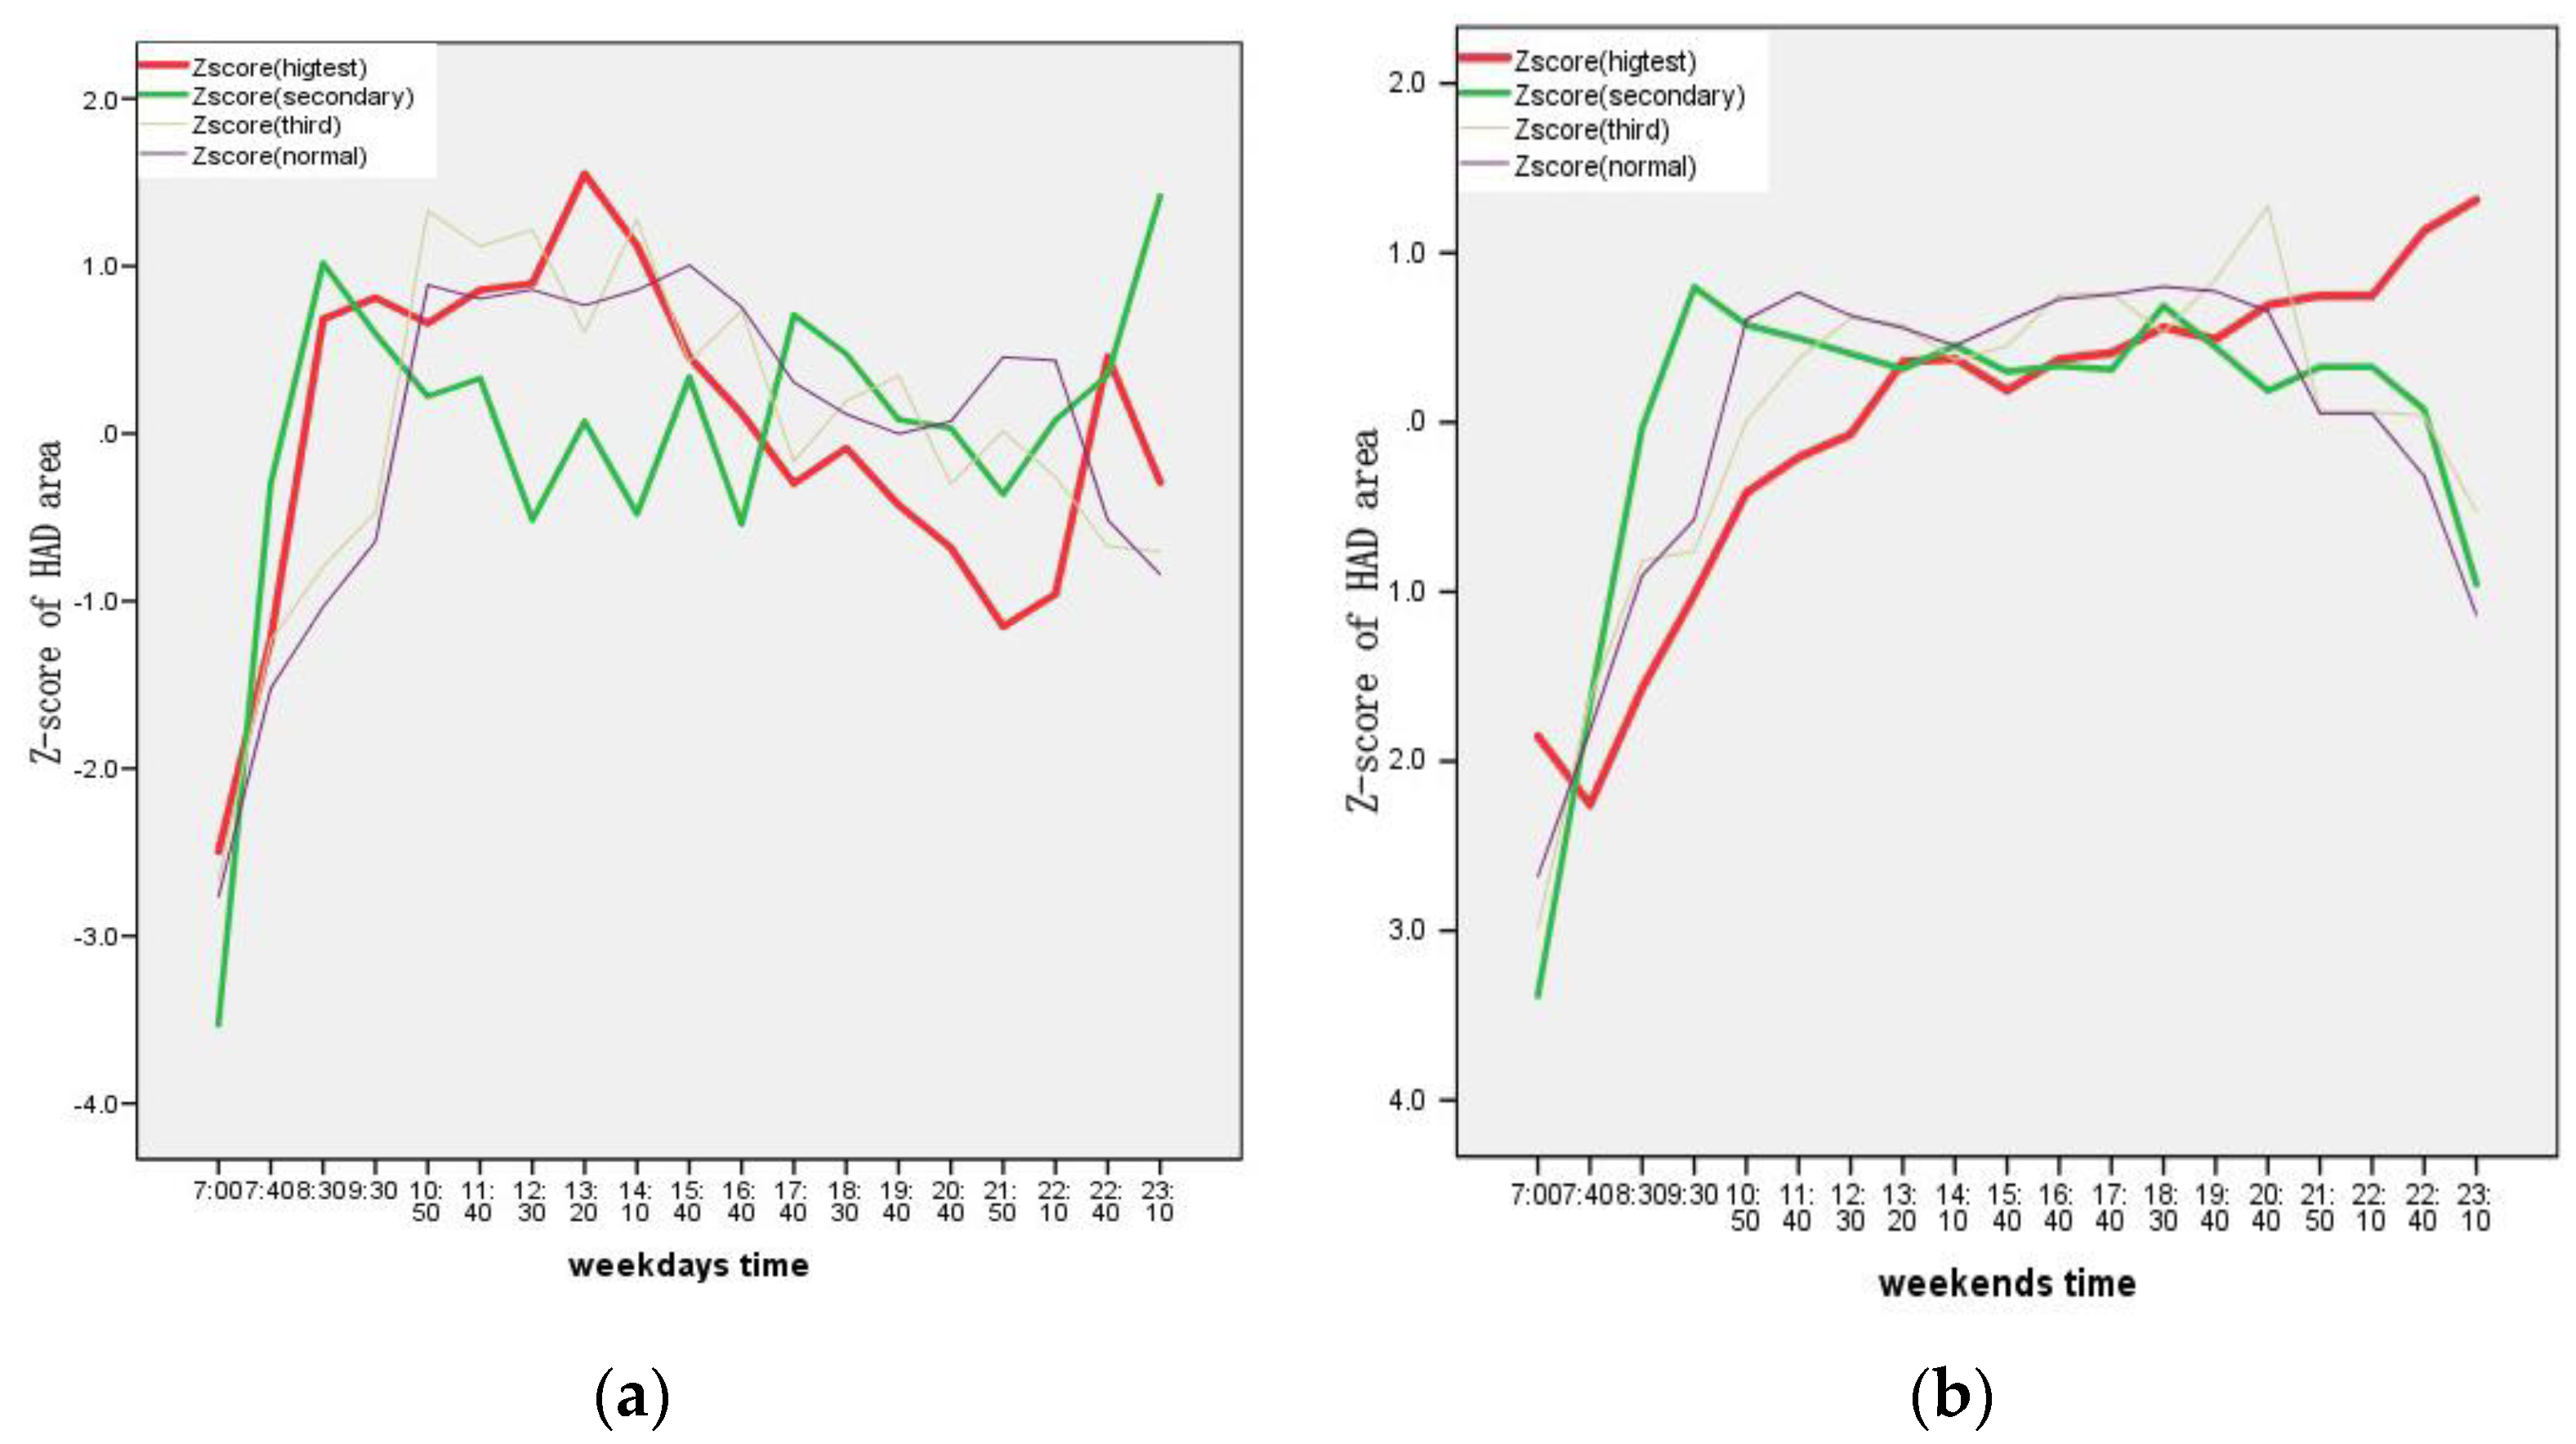
3.1.1. Comparison of Human Activity Density at Different Times

Data for different times for weekdays and weekends were used to calculate HAD changes (the larger the value, the larger the degree of aggregation) (Figure 7 and Figure 8). Although HAD remained relatively consistent during weekdays and weekends, the distribution of the activity peaks was very different. The distribution of the HAD over time on weekdays peaked at 8:30 → 13:20 → 18:30 → 22:40. The distribution of the HAD over the weekend peaked later in the day, from 10:50 → 12:10 → 18:00 → 23:10, and remained high, indicating a difference in the pattern of activities of populations on weekdays and weekends.

3.1.2. Comparison of the Area Used per Hour of Urban Green Space

To analyze the temporal distribution characteristics of green space visitors, we overlaid the Baidu Heat Map for eight days, and obtained data on the frequency of green space use every hour from 7:00 to 23:00. We analyzed the numbers of visitors in the urban green spaces during these time periods to assess temporal variations and differences between weekdays and weekends. Figure 8 shows the temporal variation in the numbers of visitors during weekdays and weekends. First, the frequency of green space use on weekends was generally higher than it was on weekdays (Figure 7). In the area of highest occupancy, the frequency of green space use on weekdays was close to the average value, and the frequency of green space use on weekends was higher than the average value. Second, the change in the area of green space used per hour was substantially larger on weekdays than it was on weekends. In the area of the high-heat zone, the weekdays peaked at 8:30, 13:20, and 22:40, respectively; the weekends reached their lowest point at 7:40, and then increased gradually. In the lowest occupancy areas weekday usage peaked at 8:30, 17:40, and 23:10; weekend usage reached its peak at 9:30, and then gradually declined.

3.2. Relationship between Human Activity and Different Types of Green Space

Table 2 shows the area, the percentage of utilization (as measured by the sum of the occupied areas of the top three tiers of HAD intensity of a green space type, divided by total area of the green space type) and proportion of total green space for the six types of green space. We only counted the highest intensity value, the second highest intensity value, and the third highest intensity value (there were six levels of intensity). As shown in the table, square/community parks, comprehensive parks and belt-shaped parks had the highest utilization ratio. Other green lands and green buffers had larger areas, mainly because these two types of space are protected green lands (for biodiversity or ecosystem functions), but they are all relatively inferior in recreational quality and distributed far away from the city center, so it had the lowest utilization ratio.
The table also shows the following findings:
(1)
For all types of urban green space, the usage rate was square/community park > belt-shaped park > comprehensive park > theme park > green buffer > other green land.
(2)
Community parks and belt-shaped parks were the two types of green space that were used most efficiently (63.6% and 43.6% occupied ratio), and they tended to be in short supply.
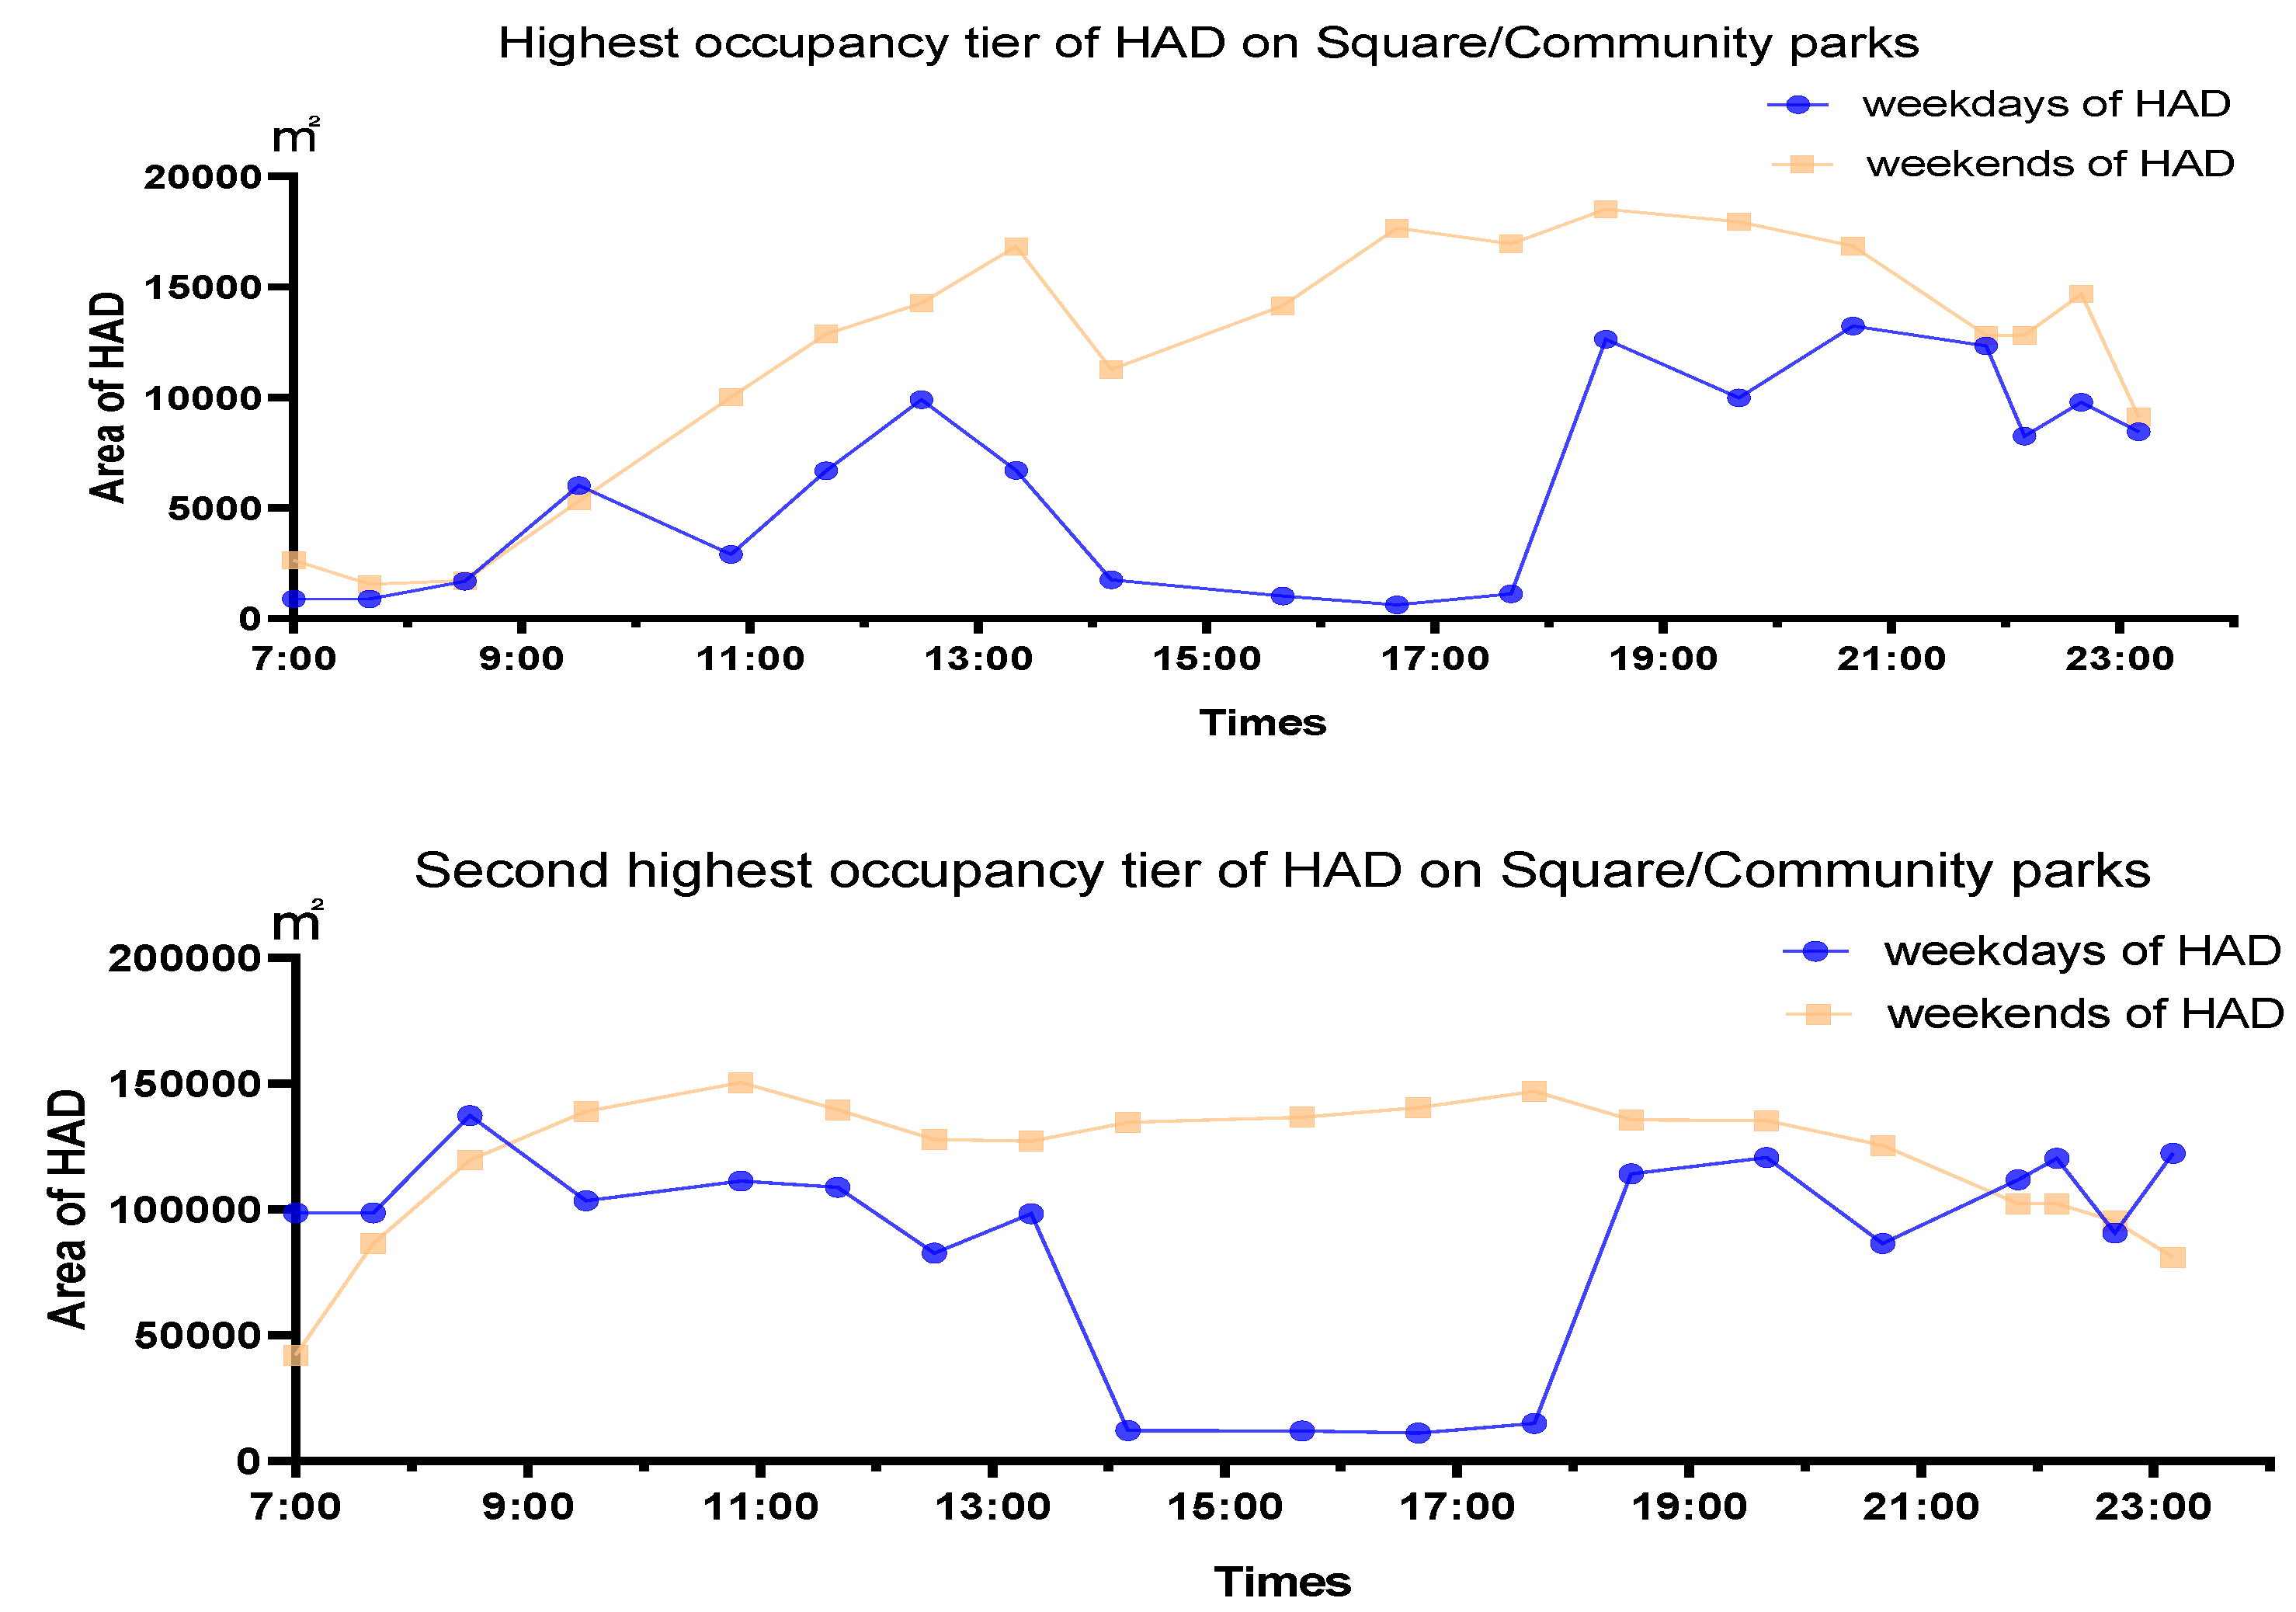
(3)
The square/community parks were generally located close to residential areas, and showed a high occupied ratio from 7:00 to 12:30 and 18:30 to 11:10. The trajectories of different HADs were similar on weekdays and weekends (Figure 9).
(1)
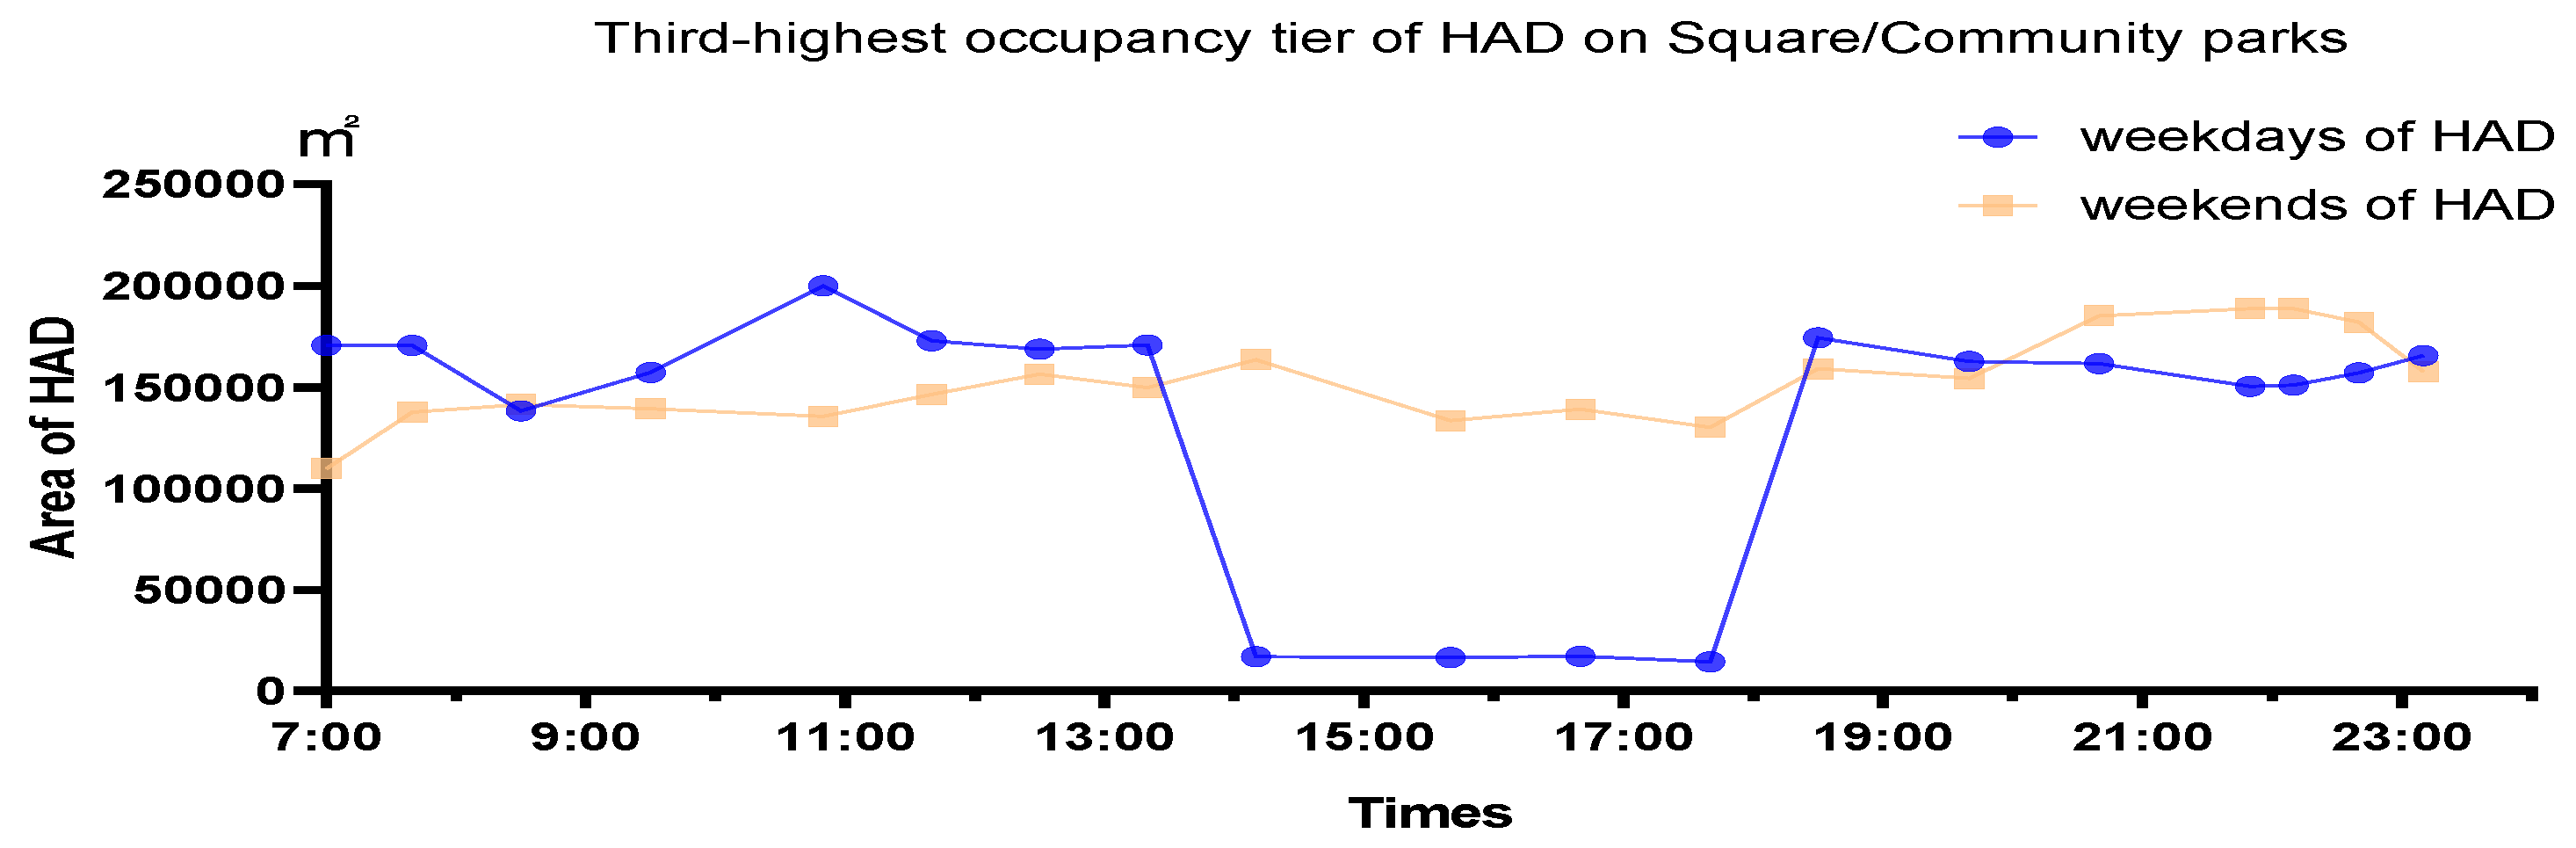
Belt-shaped parks had the highest percentage of utilization relative to their availability in the city (43.6%). Due to the flexibility of their shape, they largely compensate for the current shortage of green space and provide an alternative site for the morning and evening rush hours.
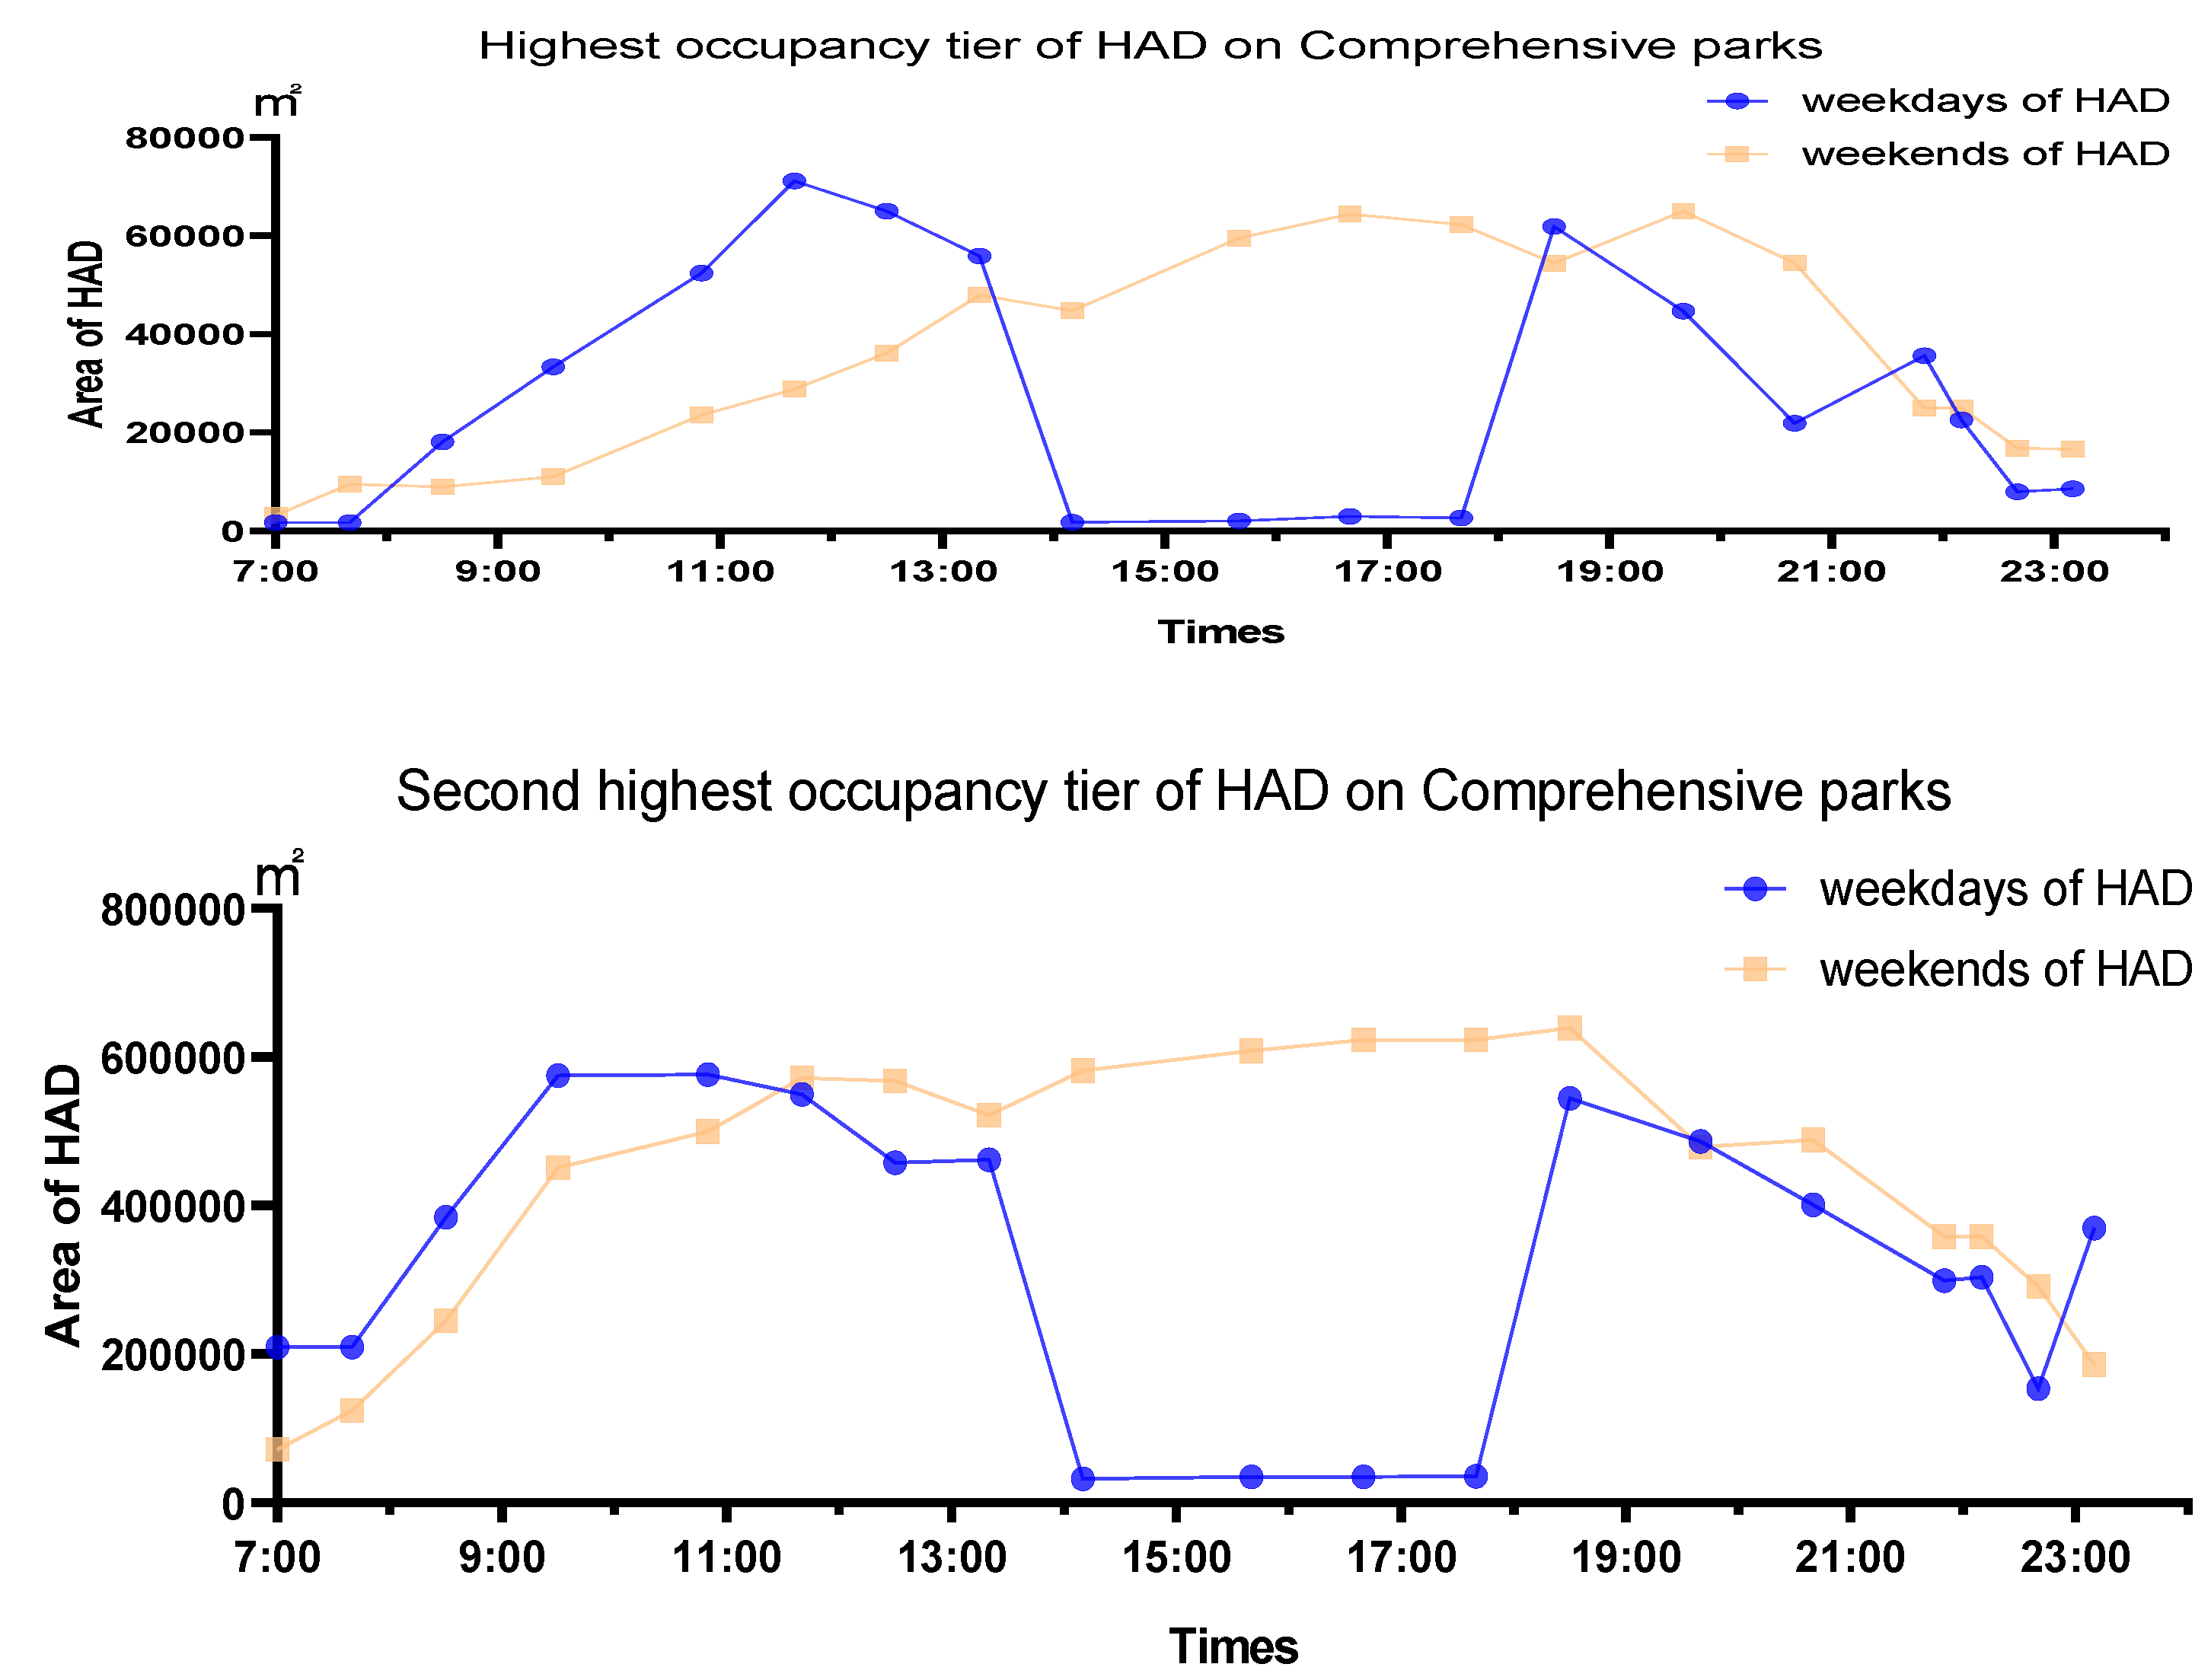
(2)
Comprehensive parks had a high efficiency and utility rate (36.4%). The frequency of use and the area used on weekends were higher than on weekdays (Figure 10).
(3)
There are many theme parks in the central city of Zhengzhou because of the implementation of green-space system planning and decision-making in recent years. However, most of them are far away from residential areas, so their percentage of utilization was only 19.3%.
(4)
The percentage of utilization of green buffers and other green lands was low, mainly because they are in the periphery of the city and play a role in ecological protection. However, these areas were visited more on weekends than weekdays.

4. Discussion

The hotspot usage map, overlaid with land use, can illuminate spatial and temporal green land usage patterns and dynamic real-time land use [35]. Some green spaces in Zhengzhou are always crowded, while others are used less often or less consistently throughout the day (Figure 11). First, there were significant differences in the spatial distribution of urban green spaces in central Zhengzhou. We found that the degree of aggregation was highest for community parks. The degree of spatial aggregation of comprehensive parks was relatively high, while belt-shaped parks were found to be well-distributed within central Zhengzhou. The distribution of belt-shaped parks demonstrated the gradual formation of a “ring pattern” around the Five Ring Road. Second, the spatiotemporal distribution pattern of human activity within urban green spaces also showed considerable variation. From the temporal perspective, the density of human activity in urban green spaces varied on both weekdays and weekends. The peak time of use during weekdays was 10:50–12:30, 6:30–20:40, and 14:10–17:40. These are common break times during the work and school day, indicating that workers and students are using these small green spaces. On weekends, the green-space usage was relatively higher than during weekdays, however, began with less usage from 7:00 to 9:30 but increasing sharply thereafter. Usage is heavier and consistent due to the increased amount of free time that workers, students, and families have during the weekends. From the spatial perspective, aggregation was highest in community parks and belt-shape parks on weekdays, whereas it was highest in theme parks and green buffers on weekends. Third, the density of human activity in urban green spaces in central Zhengzhou was closely correlated with convenient transportation, population density, and commercial facilities. This highlights the importance of both proximity and availability when planning for adequate green space.
Urban green spaces have great potential to promote an active and healthy lifestyle, increasing human health and well-being [11]. Therefore, further research should analyze the age and orientation of users and to provide the most suitable green-space environments. Our study is limited to those individuals who would be carrying mobile phones, which may exclude young children and the elderly, two demographics that also substantially benefit from green-space activities [36,37,38]. Finally, we suggest that government construction should focus on connecting well-used types of green space with greened corridors. After all, the population density is too high now and the green space that can be created is very limited in these areas. Places with a low HAD would be good choices for creating urban forests, which could bring fresh air from the city periphery to the center of the city by urban air passage structures.

5. Conclusions and Policy Recommendations

By analyzing the intensity of human activity, this study aimed to develop a data-intensive tool to balance the demand and supply of different kinds of green spaces, especially to identify those spaces that are now underutilized. We can conclude from our findings that: (1) for high-density cities, urban green space usage is correlated with the type of green space; (2) commercial facilities and commuting pathways have the greatest influence on the popularity of urban green spaces; (3) green space most proximate to residential areas is being used relatively more than its availability and therefore there is a shortage of it.
Better land-use policies can be formulated through a consideration of external factors that influence the use of urban green spaces when selecting sites for their development [39]. Given that the local Zhengzhou government is currently in a planning phase, our study can provide some guidance on the addition of green space into the city Stemming from our results, we recommend the addition of more small parks (including pocket parks) and green belts in the highest density residential and commercial areas, which can be used during break times for exercise and relaxation during the work and school day. Our results suggest that the number of visits to each green space per day (as measured by complementary methods to capture individuals without mobile phones) would be an important assessment metric for sustainable development of high-density cities. However, we recognize that there are few possibilities for adding new green spaces in crowded megacities. Consequently, our results recommend an emphasis on improving land use and creating open spaces with a high utilization ratio. Opportunities for elevated green space, such as green roofs or reclaimed transportation structures (e.g., the High Line park in New York City), would also increase green space connectivity, while improving the equity of green space access for urban residents in high-density communities in Zhengzhou.
“Big data” challenges traditional research and planning methods, but it is a tremendous impetus for developing and conducting research projects [40,41,42]. With this perspective, researchers and planners can see the aggregation and dispersion of people in the central urban area, how the location of crowd aggregation changes within a week, a day, or even a shorter period, and when urban spaces at different locations and/or with different functions are used with the highest intensity. This information is very helpful in understanding the operation of urban space and the layout of an urban green-space system. However, there are still some problems with the research data and methods, which have not been carefully considered in terms of measuring population and quality (visitor preferences), as well as the preferences of green spaces for people of all ages. Thus, these problems should be further examined in future research.

Author Contributions

Conceptualization, S.Z.; Data curation, W.Z.; Investigation, S.Z., Y.W., X.Z. and P.S.; Methodology, S.Z.; Resources, W.Z.; Supervision, G.T. and A.L.M.; Validation, S.Z.; Visualization, W.Z. Writing original draft, S.Z.; Writing review & editing, A.L.M. All authors have read and agreed to the published version of the manuscript.

Funding

This study was funded by Humanities and Social Sciences Research Projects Foundation of Henan Educational Committee (2019-ZZJH-422).

Conflicts of Interest

The authors declare no conflict of interest.

References

  1. Xiao, Y.; Wang, Z.; Li, Z.; Tang, Z. An assessment of urban park access in Shanghai–Implications for the social equity in urban China. Landsc. Urban Plan. 2017, 157, 383–393. [Google Scholar] [CrossRef]
  2. Zhao, R.; Shen, X.; Tian, G.; Guo, Y.; He, R. The influence of landscape characteristics of a park green space on the park cool island effect in Zhengzhou City. Acta Ecol. Sin. 2020, 40, 2886–2894. [Google Scholar]
  3. Barrico, L.; Azul, A.M.; Morais, M.C.; Coutinho, A.P.; Freitas, H.; Castro, P.; Planning, U. Biodiversity in urban ecosystems: Plants and macromycetes as indicators for conservation planning in the city of Coimbra (Portugal). Landsc. Urban Plan. 2012, 106, 88–102. [Google Scholar] [CrossRef]
  4. Greco, S.E.; Larsen, E.W. Ecological design of multifunctional open channels for flood control and conservation planning. Landsc. Urban Plan. 2014, 131, 14–26. [Google Scholar] [CrossRef] [Green Version]
  5. Hladnik, D.; Pirnat, J. Urban forestry—Linking naturalness and amenity: The case of Ljubljana, Slovenia. Urban For. Urban Green. 2011, 10, 105–112. [Google Scholar] [CrossRef]
  6. Daily, G.; Postel, S.; Bawa, K.; Kaufman, L. Nature’s Services: Societal Dependence on Natural Ecosystems; Island Press: Washington, DC, USA, 1997; pp. 11–17. [Google Scholar]
  7. Nisbet, E.K.; Zelenski, J.M. Underestimating nearby nature: Affective forecasting errors obscure the happy path to sustainability. Psychol. Sci. 2011, 22, 1101–1106. [Google Scholar] [CrossRef]
  8. Wolch, J.R.; Byrne, J.; Newell, J.P. Urban green space, public health, and environmental justice: The challenge of making cities just green enough. Landsc. Urban Plan. 2014, 125, 234–244. [Google Scholar] [CrossRef] [Green Version]
  9. Daniel, T.C.; Muhar, A.; Arnberger, A.; Aznar, O.; Boyd, J.W.; Chan, K.M.; Costanza, R.; Elmqvist, T.; Flint, C.G.; Gobster, P.H.; et al. Contributions of the N.A. of S. Contributions of cultural services to the ecosystem services agenda. Proc. Natl. Acad. Sci. USA 2012, 109, 8812–8819. [Google Scholar] [CrossRef] [Green Version]
  10. Chiesura, A. The role of urban parks for the sustainable city. Landsc. Urban Plan. 2004, 68, 129–138. [Google Scholar] [CrossRef]
  11. Thompson, C.W. Linking landscape and health: The recurring theme. Landsc. Urban Plan. 2011, 99, 187–195. [Google Scholar] [CrossRef]
  12. Mu, B.; Mayer, A.L.; He, R.Z.; Tian, G.H. Land use dynamics and policy implications in Central China: A case study of Zhengzhou. Cities 2016, 58, 39–49. [Google Scholar] [CrossRef]
  13. Artmann, M.; Kohler, M.; Meinel, G.; Gan, J.; Ioja, I.-C. How smart growth and green infrastructure can mutually support each other—A conceptual framework for compact and green cities. Ecol. Indic. 2019, 96, 10–22. [Google Scholar] [CrossRef]
  14. Zhengzhou Forestry Bureau. Forest Ecosystem Planning of Zhengzhou, China (2019–2025); Henan Provincial Government: Zhengzhou, China, 2019.
  15. See, L.; Mooney, P.; Foody, G.; Bastin, L.; Comber, A.; Estima, J.; Fritz, S.; Kerle, N.; Jiang, B.; Laakso, M. Crowdsourcing, citizen science or volunteered geographic information? The current state of crowdsourced geographic information. ISPRS Int. J. Geo. Inf. 2016, 5, 55. [Google Scholar] [CrossRef]
  16. Kitchin, R. Big Data, new epistemologies and paradigm shifts. Big Data Soc. 2014, 1, 2053951714528481. [Google Scholar] [CrossRef] [Green Version]
  17. Boyd, D.; Crawford, K. Critical questions for big data: Provocations for a cultural, technological, and scholarly phenomenon. Inf. Commun. Soc. 2012, 15, 662–679. [Google Scholar] [CrossRef]
  18. Hey, T.; Tansley, S.; Tolle, K. The Fourth Paradigm: Data-Intensive Scientific Discovery; Microsoft Research: Redmond, WA, USA, 2009; Volume 1. [Google Scholar]
  19. Di Minin, E.; Tenkanen, H.; Toivonen, T. Prospects and challenges for social media data in conservation science. Front. Environ. Sci. 2015, 3, 63. [Google Scholar] [CrossRef] [Green Version]
  20. Liu, L.; Liu, H.; Wang, Q.; Long, Y. Smart city planning in the era big data: International experience. Urban Plan. Int. 2014, 29, 38–43. [Google Scholar]
  21. Yan, X.-Y.; Wang, W.-X.; Gao, Z.-Y.; Lai, Y.-C. Universal model of individual and population mobility on diverse spatial scales. Nat. Commun. 2017, 8, 1–9. [Google Scholar] [CrossRef] [Green Version]
  22. Akiyama, Y. Analysis of Light Intensity Data by the DMSP/OLS Satellite Image Using Existing Spatial Data for Monitoring Human Activity in Japan. In Proceedings of the ISPRS Annals of the Photogrammetry, Remote Sensing and Spatial Information Sciences, I-2, XXII ISPRS Congress, Melbourne, Australia, 25 August–1 September 2012; Volume 25. [Google Scholar]
  23. Tana; Kwan, M.-P.; Chai, Y. Urban form, car ownership and activity space in inner suburbs: A comparison between Beijing (China) and Chicago (United States). Urban Stud. 2016, 53, 1784–1802. [Google Scholar] [CrossRef]
  24. Jahromi, K.K.; Zignani, M.; Gaito, S.; Rossi, G.P. Theory Simulating human mobility patterns in urban areas. Simul. Model. Pract. Theory 2016, 62, 137–156. [Google Scholar] [CrossRef]
  25. Meng, L.I. The Planning Strategies of a 15-Minute Community Life Circle Based on Behaviors of Residents. In Proceedings of the Urban Planning Forum, Dongguan, China, 19–21 October 2017; Volume 233, pp. 111–118. [Google Scholar]
  26. Li, F. Greenways Planning Methods from Environmental Justice Perspective—An Empirical Study Based on POI Big Data. Chin. Landsc. Archit. 2017, 33, 72–77. [Google Scholar]
  27. Li, F.; Zhang, F.; Li, X.; Wang, P.; Liang, J.; Mei, Y.; Cheng, W.; Qian, Y. Spatiotemporal patterns of the use of urban green spaces and external factors contributing to their use in central Beijing. Int. J. Environ. Res. Public. Health 2017, 14, 237. [Google Scholar] [CrossRef]
  28. Zhang, Z.; Xiao, Y.; Luo, X.; Zhou, M. Urban human activity density spatiotemporal variations and the relationship with geographical factors: An exploratory Baidu heatmaps-based analysis of Wuhan, China. Growth Chang. 2020, 51, 505–529. [Google Scholar] [CrossRef]
  29. Tan, X.; Huang, D.; Zhao, X.; Yu, Y.; Leng, B.; Feng, L. Jobs housing balance based on Baidu thermodynamic diagram. J. Beijing Norm. Univ. Nat. Sci. 2016, 52, 622–627. [Google Scholar]
  30. He, S.; Dang, H.; Zhang, M. Research on Dynamic Changes of Urban Square Space in Spatial and Temporal Based on Baidu Thermal Diagram a Case Study on the Wuyi Square of Changsha. In Proceedings of the 2017 IEEE 2nd International Conference on Big Data Analysis (ICBDA), Beijing, China, 10–12 March 2017; pp. 517–522. [Google Scholar]
  31. Fotheringham, A.S.; Brunsdon, C.; Charlton, M. Geographically Weighted Regression: The Analysis of Spatially Varying Relationships; John Wiley & Sons: Hoboken, NJ, USA, 2003; ISBN 0-470-85525-8. [Google Scholar]
  32. Tu, J.; Xia, Z.-G. Examining spatially varying relationships between land use and water quality using geographically weighted regression I: Model design and evaluation. Sci. Total Environ. 2008, 407, 358–378. [Google Scholar] [CrossRef] [PubMed]
  33. Jin, X.; Long, Y.; Sun, W.; Lu, Y.; Yang, X.; Tang, J. Evaluating cities’ vitality and identifying ghost cities in China with emerging geographical data. Cities 2017, 63, 98–109. [Google Scholar] [CrossRef]
  34. Jenks, G.F. The data model concept in statistical mapping. Int. Yearb. Cartogr. 1967, 7, 186–190. [Google Scholar]
  35. Zhou, J.; Pei, H.; Wu, H. Early warning of human crowds based on query data from Baidu maps: Analysis based on Shanghai stampede. In Big Data Support of Urban Planning and Management; Springer: Berlin/Heidelberg, Germany, 2018; pp. 19–41. [Google Scholar]
  36. Ji, J.S.; Zhu, A.; Bai, C.; Wu, C.-D.; Yan, L.; Tang, S.; Zeng, Y.; James, P. Residential greenness and mortality in oldest-old women and men in China: A longitudinal cohort study. Lancet Planet. Health 2019, 3, e17–e25. [Google Scholar] [CrossRef] [Green Version]
  37. Dadvand, P.; Nieuwenhuijsen, M.J.; Esnaola, M.; Forns, J.; Basagaña, X.; Alvarez-Pedrerol, M.; Rivas, I.; López-Vicente, M.; Pascual, M.D.C.; Su, J. Green spaces and cognitive development in primary schoolchildren. Proc. Natl. Acad. Sci. USA 2015, 112, 7937–7942. [Google Scholar] [CrossRef] [Green Version]
  38. Kahn, P.H., Jr.; Kellert, S.R. Children and Nature: Psychological, Sociocultural, and Evolutionary Investigations; MIT Press: Cambridge, MA, USA, 2002; ISBN 0-262-25012-8. [Google Scholar]
  39. Li, H.; Liu, Y. Neighborhood socioeconomic disadvantage and urban public green spaces availability: A localized modeling approach to inform land use policy. Land Use Policy 2016, 57, 470–478. [Google Scholar] [CrossRef]
  40. Tian, B.; Niu, X. Big Data Supported Urban Design: Public Activity Network Plan in Fuxing-Hengshan Road Historical and Cultural Area. In Proceedings of the Urban Planning Forum, Dongguan, China, 19–21 October 2017; Volume 2, pp. 78–86. [Google Scholar]
  41. Yuan, Y.; Wang, Y.; Zhou, X.; Zhang, X.L. Conceptual Exploration and Practical Application on Flexibility and Efifciency of Territory Spatial Planning Making from the Perspective of Big Data. China Land Sci. 2019, 33, 9–16. [Google Scholar]
  42. Fang, C.; Zhou, C.; Gu, C.; Chen, L.; Li, S. A proposal for the theoretical analysis of the interactive coupled effects between urbanization and the eco-environment in mega-urban agglomerations. J. Geogr. Sci. 2017, 27, 1431–1449. [Google Scholar] [CrossRef]
Figure 1. Research area: (left) location of Zhengzhou; (right) administrative districts of Zhengzhou.
Sustainability 12 07075 g001
Figure 2. Distribution of urban green spaces in central Zhengzhou in 2017.
Sustainability 12 07075 g002
Figure 3. Sample data (resolution of 3.38 m × 3.38 m) of Baidu Heat Map (Friday and Saturday) in Zhengzhou.
Sustainability 12 07075 g003
Figure 4. (a) Baidu Heat Map in different time periods; (b) Heat Map overlay of whole day. Activity weekends and green space.
Sustainability 12 07075 g004
Figure 5. Analytical framework of urban human activity density mapped onto urban green space.
Sustainability 12 07075 g005
Figure 6. Area of human activity density histogram at different times. Area of human activity density (HAD) = number of pixels falling into each HAD tier multiplied by area per pixel, where pixel area is 11.42 m2 (3.38 m × 3.38 m).
Sustainability 12 07075 g006
Figure 7. Human activity density (HAD) box-plot diagram at different heat values in the Z-score area at different times. The “○” “*” above indicates outliers (o1, *1, are 7:00 in different heat values, o2, *2, are 7:40 in different heat values, o3 is 8:30, o4 is 9:30, *19 is 23:10).
Sustainability 12 07075 g007
Figure 8. Changes in the amount of green space usage per hour on weekdays (a) and weekends (b).
Sustainability 12 07075 g008
Figure 9. Comparison of the use area of square/community parks on weekdays and weekends by occupancy tier.
Sustainability 12 07075 g009aSustainability 12 07075 g009b
Figure 10. Comparison of the usage area of comprehensive parks on weekdays and weekends by occupancy tier.
Sustainability 12 07075 g010aSustainability 12 07075 g010b
Figure 11. Different tiers of HAD by location (weekdays and weekends combined).
Sustainability 12 07075 g011
Table 1. The areas of the six types of urban green space.
Green Space CategoryArea (km2)
None901.83
Comprehensive park7.70
Square/community park0.97
Theme park1.09
Belt-shaped park18.16
Green buffer14.85
Other green space273.44
Table 2. Occupied ratio of different types of green space.
CategoryArea (km2)Percent of UtilizationProportion of Total Green Space
Square/community park0.9763.6%0.31%
Belt-shaped park18.1643.6%5.74%
Comprehensive park7.7036.4%2.43%
Theme park1.0919.3%0.35%
Green buffer14.8514.8%4.70%
Other green land273.4410.5%86.48%

