Article

Measuring System-Level Impacts of Corporate Mobility as a Service (CMaaS) Based on Empirical Evidence

1
Integrated Transport Research Lab, KTH Royal Institute of Technology, 114 28 Stockholm, Sweden
2
Institute for Transport Studies, University of Natural Resources and Life Sciences (BOKU), A-1190 Vienna, Austria
*
Author to whom correspondence should be addressed.
Sustainability 2020, 12(17), 7051; https://doi.org/10.3390/su12177051
Submission received: 27 June 2020 / Revised: 23 August 2020 / Accepted: 25 August 2020 / Published: 29 August 2020

Abstract

:
Corporate Mobility as a Service (CMaaS) is a type of MaaS that enables mobility within as well as to and from a worksite for employees. The expected benefits of CMaaS are to support a shift towards more sustainable and more effective work-related transport activities. There is a lack of knowledge regarding the impacts of CMaaS and how its performance should be measured. This paper proposes an evaluation framework to measure CMaaS impacts at a system level. The proposed evaluation framework is then applied to evaluate a real CMaaS deployment in Sweden. This paper contributes to knowledge building and guidance to support policy and decision making for CMaaS development and implementation in the future.

1. Introduction

A large part of our daily traffic flow can be attributed to people commuting to and from work. Based on datasets from 52 countries, [1] reported that the time spent on commuting varies from 39 min to 97 min with an average commuting time of 69 min. Commuting times are anticipated to become longer as cities continue to grow and people relocate to live further and further away from the city center due to housing shortages and high rents [2]. Some companies have started to provide a variety of transport services to make commuting to/from work easier for their employees, considering that commuting satisfaction may influence employees’ productivity [3,4,5,6].
The authors of [7] described how Mobility as a Service (MaaS) can be applied within a company’s context for commuting and work-related travel, given that MaaS is considered to have the potential for providing an efficient and sustainable transport system [7]. Research [8] defined this specific type of MaaS as Corporate Mobility as a Service (CMaaS), which fulfills the criteria of MaaS [9] and offers mobility services to specifically cater to the transport needs of employees within a company (in this paper, we use the word company to denote the organization that offers the CMaaS service). There are mainly two ways of operating CMaaS; first, it is provided and operated by the beneficiary company, and second, the beneficiary company pays for different mobility services in collaboration with a third party provider [8]. The type of services in CMaaS could be limited, and in some cases, transport services could be fully paid by the company. By providing a well-planned service combined with accessible range of transport modes and well-designed infrastructure, CMaaS could have the potential to enable efficient mobility to/from and within work for all employees of a company. This would in turn increase work efficiency and help achieve the company’s sustainability goals [8].
MaaS concepts have been discussed broadly since it was first introduced by [10]. Several previous studies [11,12,13] of MaaS have focused on individual travel impacts. However, there has not yet been much discussion on the impacts on the economic side of the users, impacts for operators, or the wider well-being and social impacts of the MaaS system. The authors of [14] presented a multi-level evaluation framework that can be used to systematically assess the environmental, economic, and social impacts of MaaS on individual, organizational, and a societal level. This framework, however, is illustrated on a theoretical and hypothetical case only. There is a lack of empirical evidence where their proposed framework has been applied to evaluate the impacts. Further, many of the abovementioned studies only focus on general MaaS service context.
MaaS is a complex and dynamic sociotechnical system. The development and operation of MaaS involves a range of actors and a range of variables that may affect each other directly or indirectly. For example, actions that the individuals take impact the organizations and vice versa. In order to understand, anticipate, and prepare for impacts of MaaS, it is crucial to understand these interdependencies, and to take an integrated system-level approach. However, not many previous studies have reflected upon the system-level impacts of MaaS.
This paper aims to contribute to this research gap by introducing a framework for evaluating CMaaS impacts, applying the framework to a CMaaS pilot, and discussing how the findings can be generalized to other MaaS systems. Although it is operated within a specific company’s context, CMaaS is still a complex system as it involves a range of actors that interact with each other directly or indirectly. Actors include employees at the individual level, employer and transport (CmaaS) providers/operators at the company level, and the city where the company is located at the societal level. For a company that operates CMaaS, it is crucial that the CMaaS system not only improves the travel experience and work efficiency for its employees, and the sustainability goals of the company, but also is financially viable. Hence, it is crucial for the CMaaS operators to have a thorough, robust, and practical evaluation framework to investigate the impacts of the services systematically. In particular, the objective of this paper is to:
  • Identify Key Performance Indicators (KPIs) to evaluate the impacts of CMaaS.
  • Develop a system-level evaluation framework that can show the interactions among individual, company, and societal levels with the intention of providing feedback to the companies.
  • Apply this system level evaluation framework to a CMaaS pilot to gain insight into the impacts of a CMaaS system.
As CMaaS is still relatively limited in number of applications, this paper also briefly discusses how the evaluation framework can be generalized to other MaaS services. The rest of the paper is structured in the following way: Section 2 provides the state-of-the-art related to CMaaS. Section 3 describes the theoretical thinking underlying the proposal system level evaluation framework. Section 4 shows how the evaluation framework functions by applying it to a CMaaS pilot in a large factory in Sweden. Section 5 discusses the results and concludes the paper with remarks and future work.

2. State-of-the-Art

MaaS was first introduced by [10], stating that MaaS is a distribution model to deliver what the user needs in their everyday travel. The concept of MaaS could be easily adapted to different contexts and perspectives such as user needs, business models, sustainability effects, and improving the efficiency of the transport system [9,15]. MaaS is a user-centric, on-demand service that brings together different elements of transportation [16,17]. Among those elements, three essential ones are: transport modes, Information and Communication Technology (ICT), and payment [9,18,19]. MaaS integrates different service providers, offering the user a wider range of transport modes through one interface [12]. MaaS can be seen as a complex interconnected system that forms a network of services open for multiple actors [20]. It is considered to have the potential to enable flexible shared mobility and to reduce congestion, emissions, as well as private vehicle use [21,22].
As MaaS is gaining popularity, companies are tapping into its potential by providing a certain type of shared mobility solutions to make commuting easier for their employees. For example, IKEA in Sweden has been providing shuttle buses for its employees who commute longer than two hours, and short-term shuttle buses have also been provided to employees due to disruption of the transport system [23]. Google has been providing shuttle buses for more than 1200 employees who commute 2 hours daily from the San Francisco Bay area to Silicon Valley [24]. Recently, Google has also offered support to employees using carpooling and bike sharing. Amazon and Microsoft also offer employee shuttles in Seattle [25]. In Malaysia, several universities are providing shuttle services to both employees and students, aiming to decrease commuting by private cars [26].
There are three main reasons that initiate a company to provide solutions to ease the hassle of employees’ commuting [27,28]. First: The company’s main activity location is in a remote area that is far away from the concentrated residential areas which lack well-connected transport solutions. Second: This specific type of transport service or subsidies can be seen as a strategy to attract a specific type/group of employees. Third: It helps the company’s employees to beat the uncertainty and stress surrounding the commuting rush and can improve the employees’ work efficiency and productivity.
In many abovementioned cases, the provided transport service tends to be limited to one specific type, i.e., shuttle bus. The services are typically fixed to a particular timetable with a specific set of stop locations. Most of those services are only accessible to a limited number of people. Even so, these companies could be potential early adopters for applying more mobility services from a MaaS system since they are willing to address the diverse travel needs of people for work-related travel in the company [29]. According to [8], when MaaS is applied within a company’s context, it is defined as CMaaS. They pointed out that CMaaS fulfills the criteria of MaaS whilst offering mobility services to specifically cater to the transport needs of employees within a given corporation.
One of the common issues in MaaS is the commercial competitiveness due to different transport providers and operators engaged in offering the same service to the users [30]. The engagement of multiple service providers in MaaS makes it difficult to be operated and implemented [18]. It is expected that CMaaS could avoid operational issues of general MaaS as the service is either provided by the company itself or by a third party and is only limited to employees. Service providers and operational actors in CMaaS are less complicated, which could be easier to operate compared to general MaaS, although implementing CMaaS could still be time-consuming, costly, and facing barriers.
A couple of studies that investigated service design and employees’ travel behavior towards CMaaS have been found [8,31]. The authors of [8] found that in order to implement CMaaS, there is a need to integrate the service with external modes of transport and reform the current laws and regulations that restrict the development of the service. There is also a need to integrate the company’s policies and regulations that seem to be clashing with the usage of the CMaaS system. They pointed out that taking an integrated perspective to understand the users’ attitudes towards CMaaS will help identify various other aspects that influence the users’ daily travel. The authors of [31] investigated the users’ attitudes and expectations towards CMaaS service. The authors identified two classifications, being car-oriented and shared-mobility-oriented, by using latent segmentation analysis. Based on the users’ interest, the need for a flexible, well-informed system was highly valued and the willingness of giving up private car ownership was noticed.
Nevertheless, understanding CMaaS only from service design and users’ attitudes is not enough to fully understand the impacts of it. There is a risk of conflicts that may arise between the service provider (i.e., the company) and employees because of different needs, expectations, and requirements from CMaaS. Taking only one perspective to understand the impacts of a complex system like CMaaS will not be sufficient. It is important to consider all perspectives in order to stimulate a company to provide a flexible integrated mobility service that the company, the employees, and the society can benefit from. Furthermore, insights from the impacts of CMaaS can be used to resolve challenges in implementing general MaaS.
There is a need to measure the impact of CMaaS based on system level [20,32]. The framework proposed by [14] is based on MaaSiFiE (Mobility-as-a-Service for Linking Europe [14]) and IRIMS (Institutional Frameworks for Integrated Mobility Services [33]). It was developed to support the roadmap for implementation of MaaS in Sweden [34], an initiative by the Swedish government’s cooperation group for ‘Next Generation Travel and Transport’. In [14], it is described how the framework and the KPIs identified can be applied to a general business-to-customer (B2C) MaaS scenario. In this paper, the KPIs and framework developed by [14] are adjusted for the evaluation of CMaaS systems. The following section describes the methodology of how the evaluation framework is modified and how the system level impacts of CMaaS can be identified.

3. Methodology

The previous sections confirm that there is a need for a system-level framework for the evaluation of CMaaS. A crucial step in creating such a framework is to select a set of Key Performance Indicators (KPIs) in order to measure the performance of the CMaaS system. Using the selected KPIs the evaluation framework is constructed for individual, company, and societal levels in order to evaluate possible impacts as well show how these impacts influence each other at an integrated system level. Finally, in order to demonstrate how the evaluation framework can be used, we apply the framework to a real CMaaS pilot that was launched by a company in Sweden.

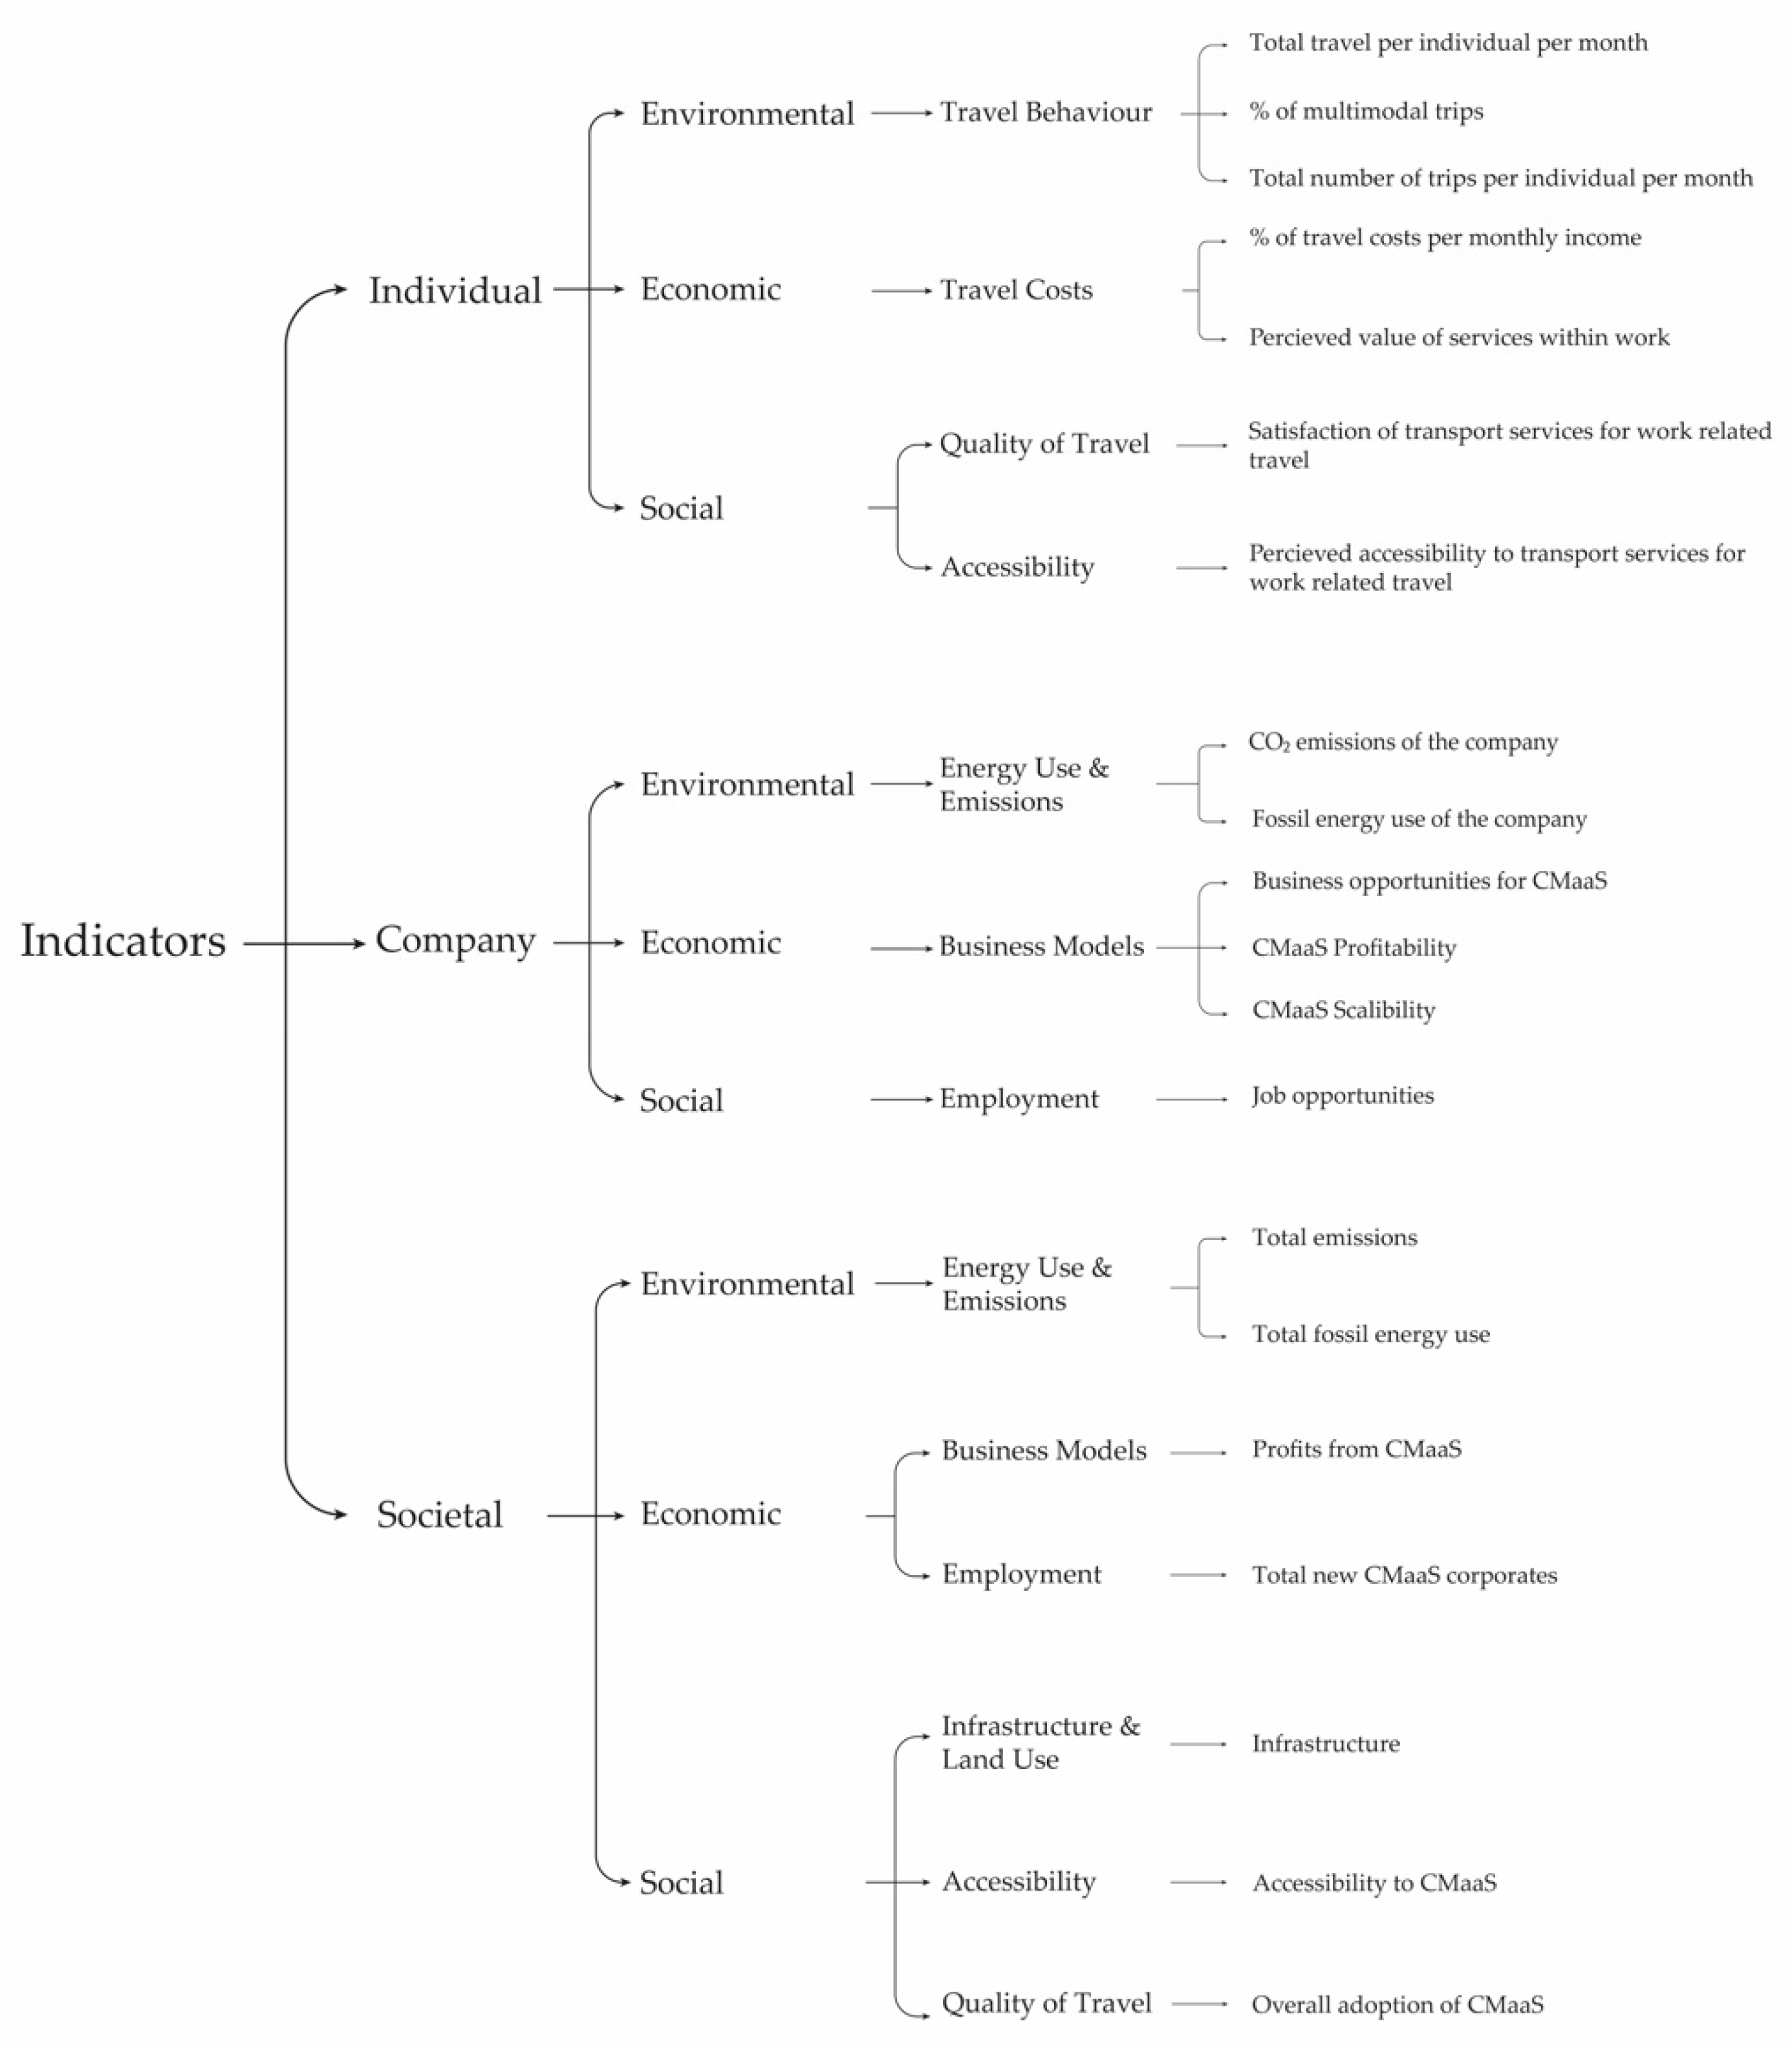
3.1. Selection of KPIs

KPIs are qualitative and quantitative measures that are used to assess a service and to successfully achieve goals and strategies set by the organization [35,36]. KPIs can provide inputs for setting priorities, generate critical information that helps decision-makers detect potential problems and make amends to the objectives and goals [37]. The intention of using KPIs in this study is to utilize its ability to assist and advise decision-makers in the process of implementation of CMaaS. It is important to choose versatile indicators that are clear and strong and can be successfully applied in various research contexts [38].
The selection of KPIs was based on a literature review and state-of-the-art analysis that was conducted by using a range of strategic transport policy documents from EU and Swedish policies. Additionally, studies that have defined and/or applied KPIs in measuring urban mobility, sustainable transportation, and MaaS were also used. The documents were identified by using ResearchGate, Scopus, and Google Scholar along with snowball method (The snowball method is a technique that helps in finding relevant literature using a key document and its bibliography as a starting point). The search was based on the keyword’s “transport”, “sustainable transport”, “mobility”, “passenger” “indicators”, “quality”, “service”, and “impact assessment”.
The European Union strategies paint a general picture of basic requirements for quality of passenger transport. The most common indicators identified were flexibility, reliability, satisfaction, sustainability, quality of life, and costs [39,40,41]. The Swedish parliament states that transport policy should support sustainable, socio-economically efficient, and long-term transport provision for citizens of Sweden [42].
In order to achieve this, Swedish Transport Administration 2011 states that indicators of transport should consider aspects related to improving accessibility, health, environment, and safety aspects of the transport system [43]. The potential of MaaS to create, capture, and deliver value for relevant stakeholders is also an important factor to consider [44]. A summary of the most commonly occurring indicators identified from the related literature are presented in Table 1.
As CMaaS is a variation of MaaS that is implemented within the context of a workplace, the category of indicators mentioned above are applicable to measure the impacts of CMaaS. The above identified KPIs are classified into individual, company, and societal levels, which is in line with [14]. Each of these three levels are further classified into economic, environmental, and social dimensions. The selected KPIs have the features of universality and generality and relate to each other directly or indirectly. Figure 1 below illustrates how the KPIs have been distributed in the three levels and the three dimensions. Each specific KPI is further linked to certain targeted measurements that connects to the CMaaS system. This relationship tree is set up as the foundation for constructing the evaluation framework.

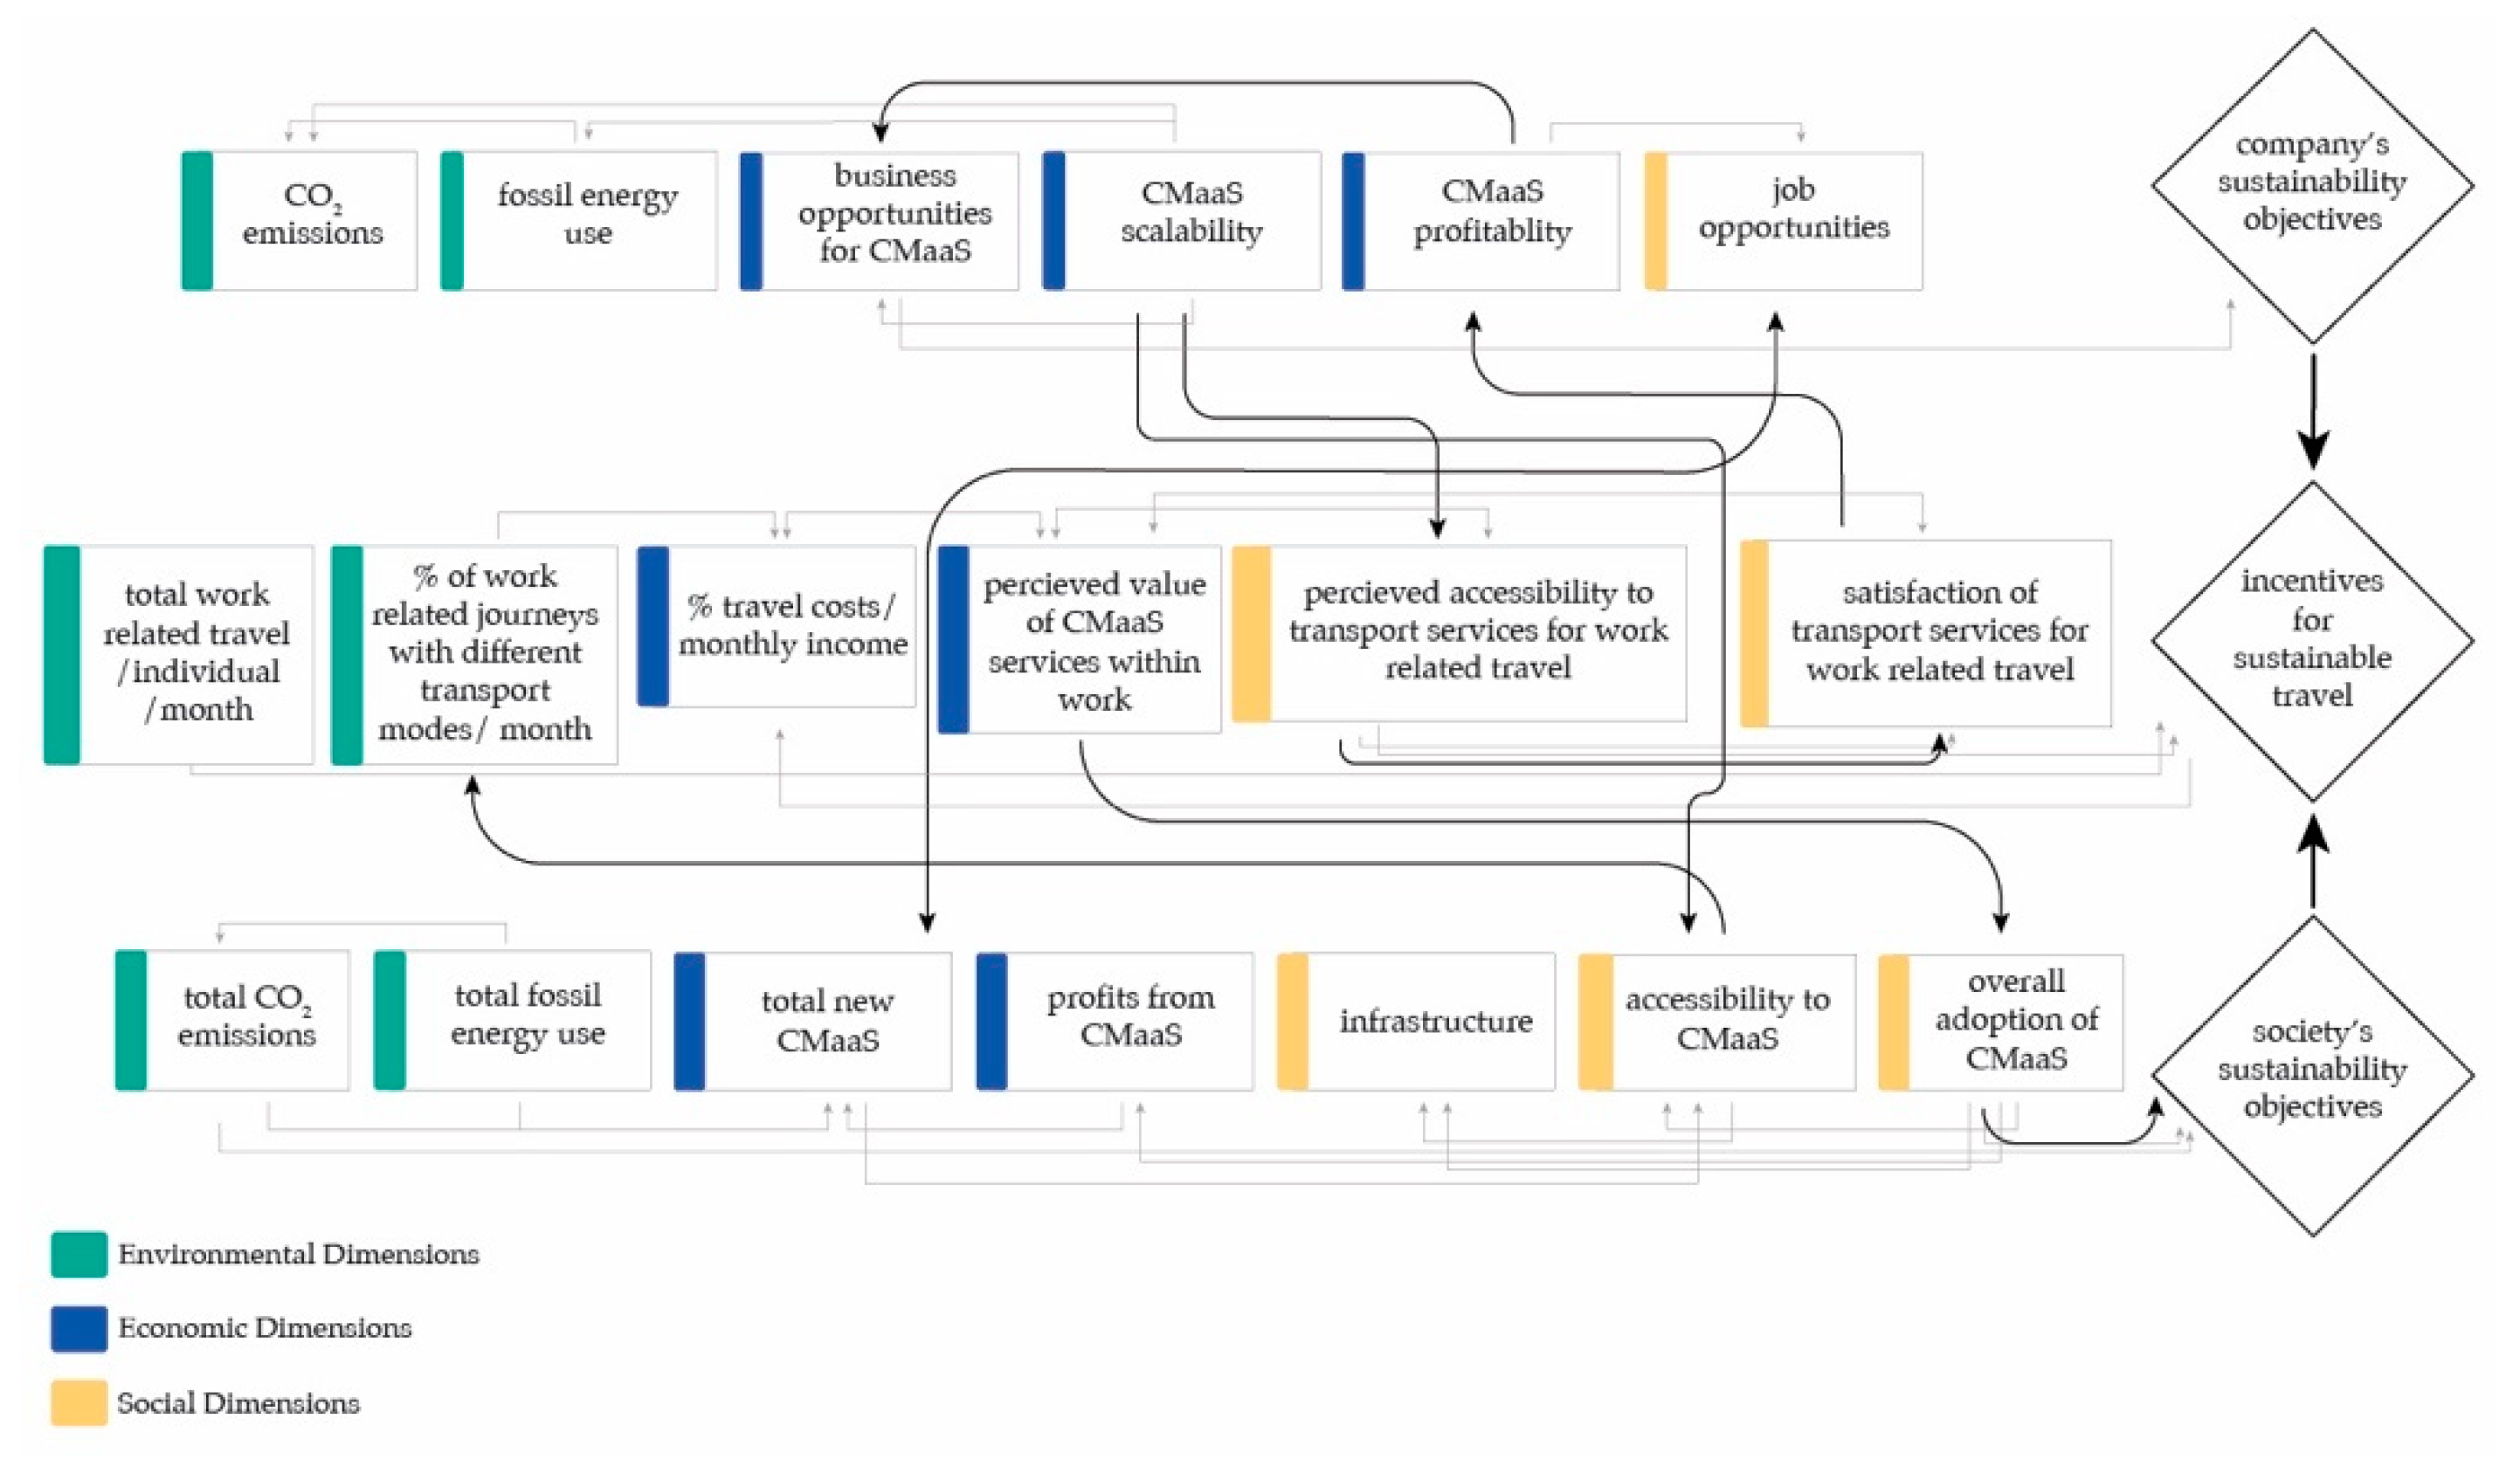
3.2. Definition of Evaluation Framework

Based on the selection of the KPIs and the configured relationship, the evaluation framework is constructed on different levels. In doing so, the framework is not only able to evaluate different plausible impacts of CMaaS implementation at the individual, company, and societal levels but is also able to show how these impacts influence each other at an integrated system level. The individual level in this study refers to the employees within a company using CMaaS services. The company level refers specifically to a company that adopts CMaaS services. The societal level refers to the local city in which such a company is located. The innovative aspects of the proposed evaluation framework are twofold. First, it extracts features from a general MaaS evaluation framework [14], and modifies and fits these features into a CMaaS context. Second, the framework evaluates impacts at a system level by examining how the economic, environmental, and social dimensions interacts and how the individual, company, and societal levels influence each other.

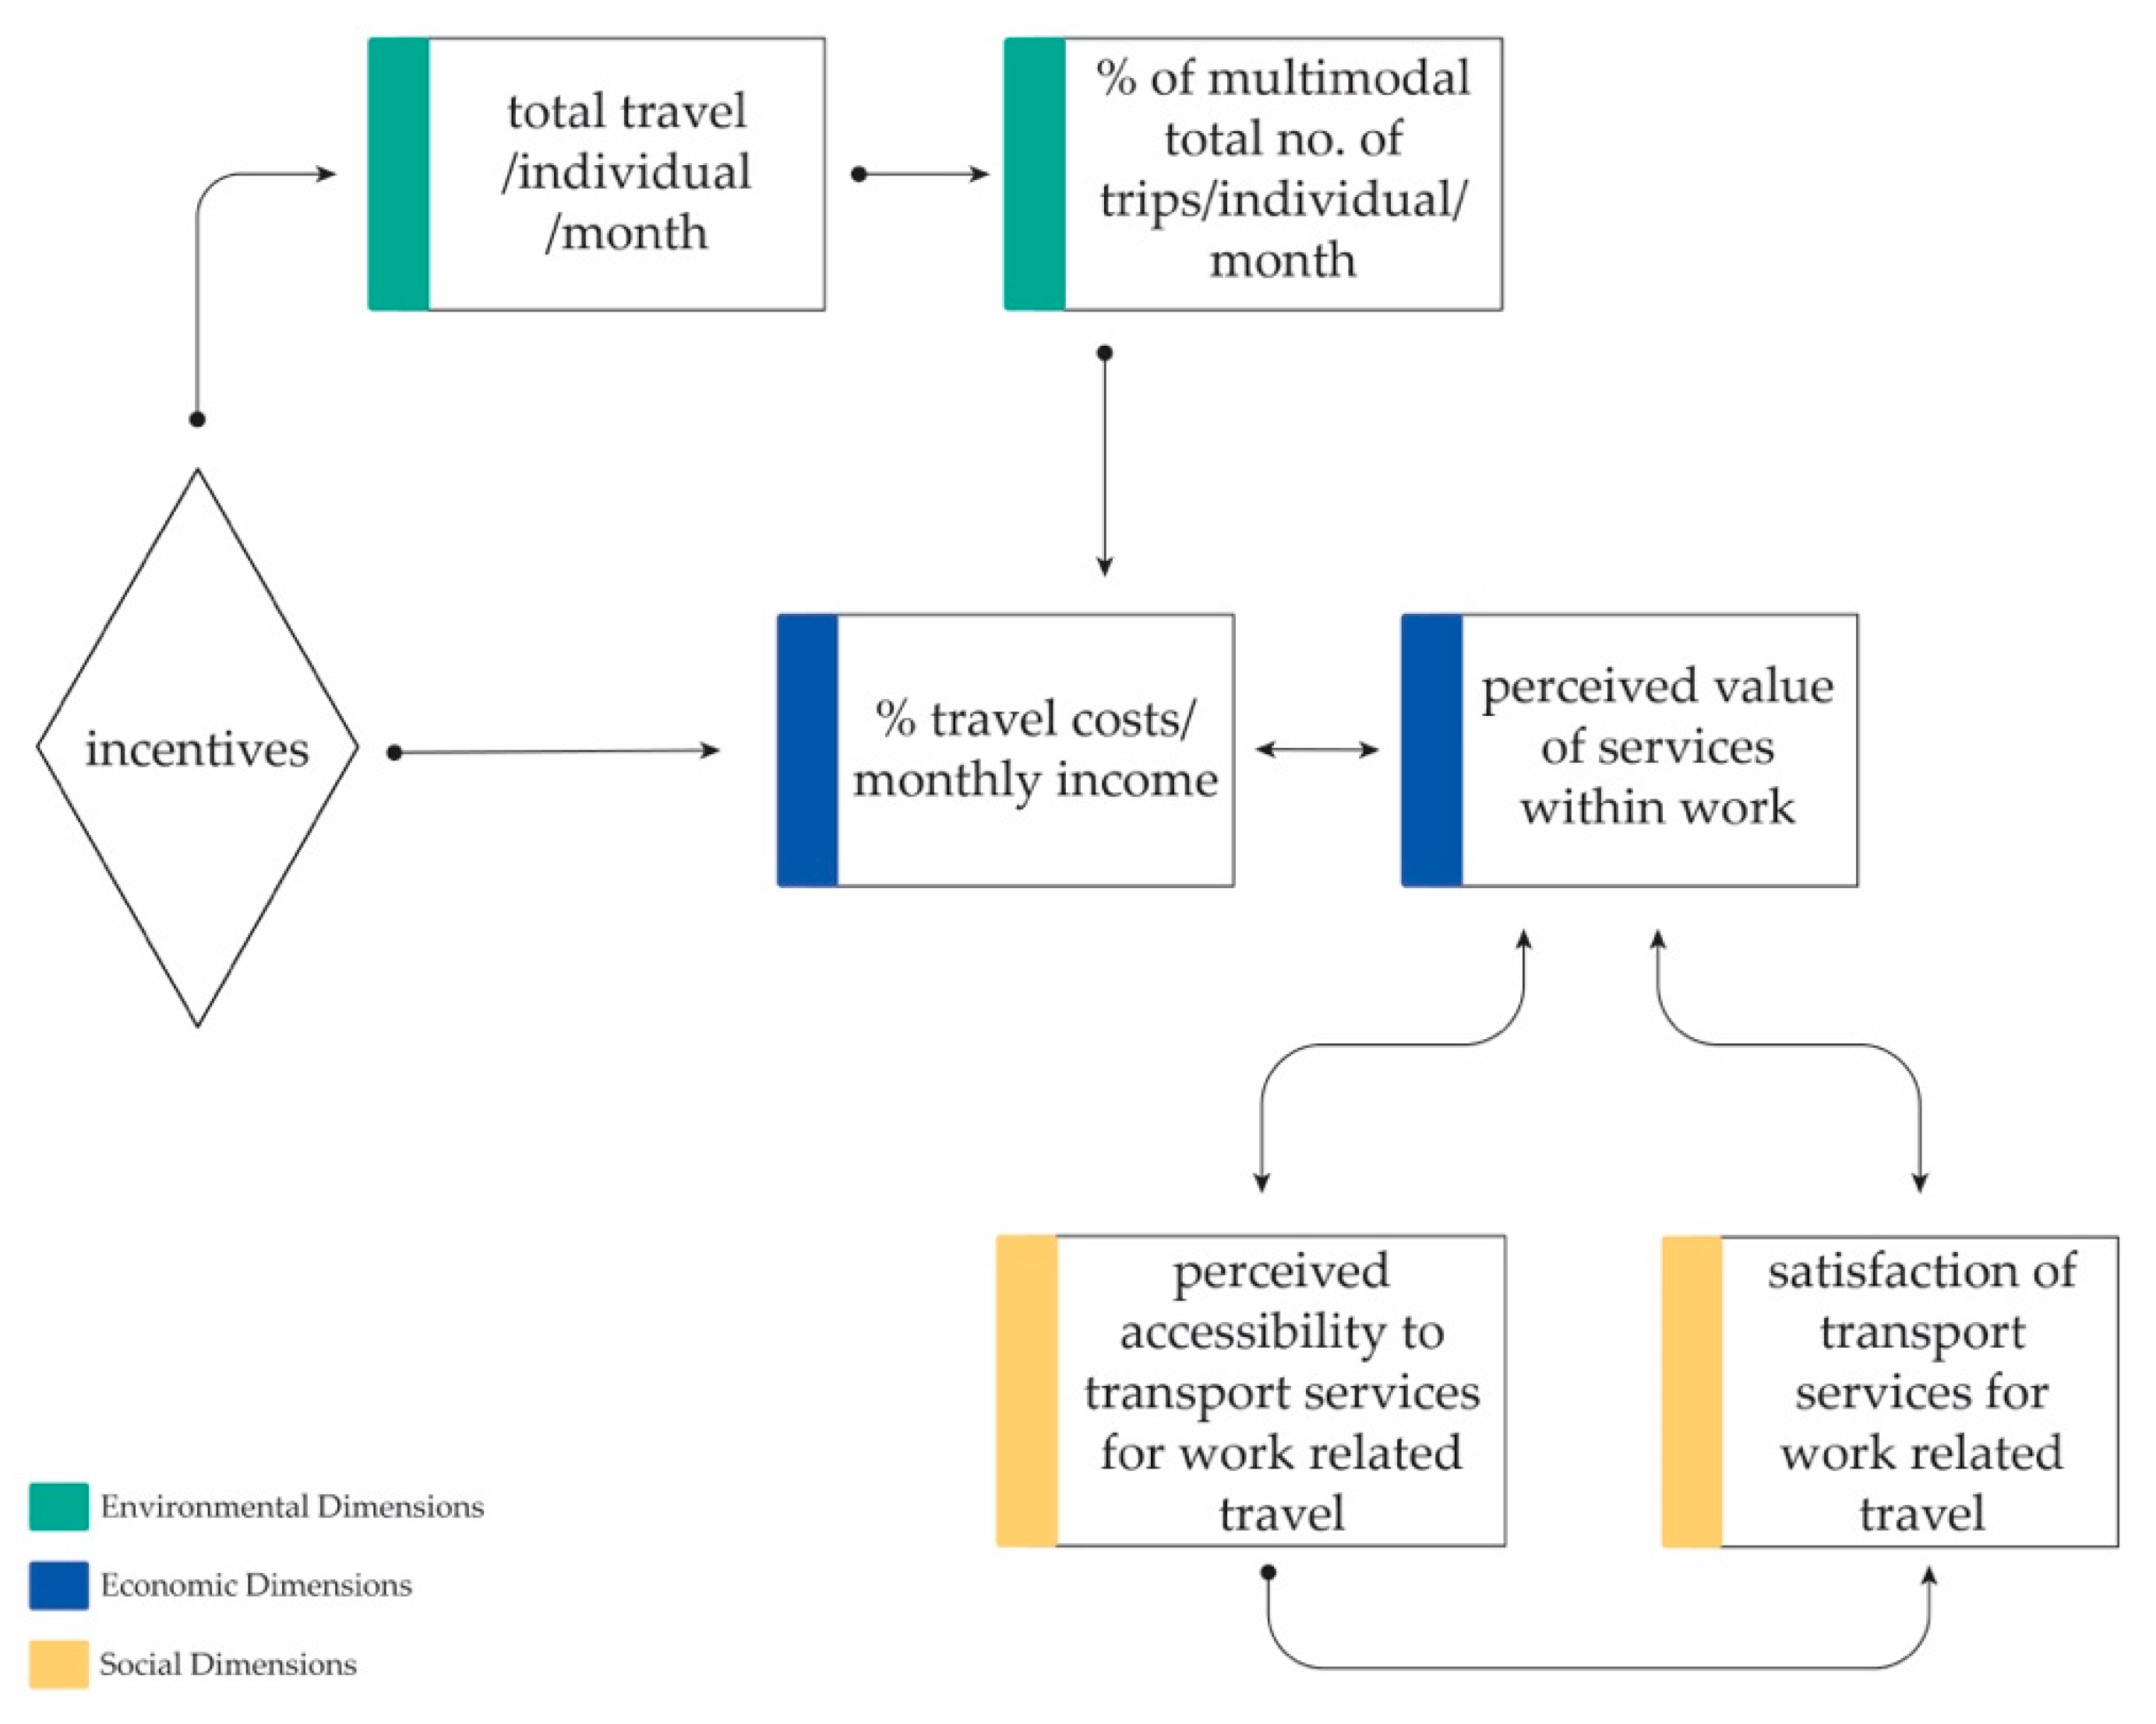
3.2.1. Framework at the Individual Level

This level captures the employees’ travel behavior and travel patterns while using CMaaS. The KPIs chosen to evaluate impacts at the individual level are described in Table 2.
The three dimensions are color coded for better illustration, in which green represents the environmental dimension, blue represents the economic dimension, and yellow represents the social dimension. The color codes are in line with [14] and are consistent for the rest of the tables and figures in the paper. The descriptions on what specific measurements are of interests are given in the right column of the tables.
As is illustrated in Figure 2, KPIs for travel behavior and quality of travel such as total work-related travel per employee per month, means of transport, and satisfaction with the transport services are mainly reflected on the economic dimension. The employees’ decision on whether to use the provided CMaaS services depends on the degree to which the service is perceived to fulfill the user’s transport needs and satisfactions, and vice versa, which reflects upon the social dimension. The travel behavior and the perceived value varies among employees and choices made by each individual will reflect on the environmental dimension, like induced CO2 emissions and fossil energy consumption. A key component in the individual level is the incentives for sustainable travel that can be provided to employees for adopting CMaaS.

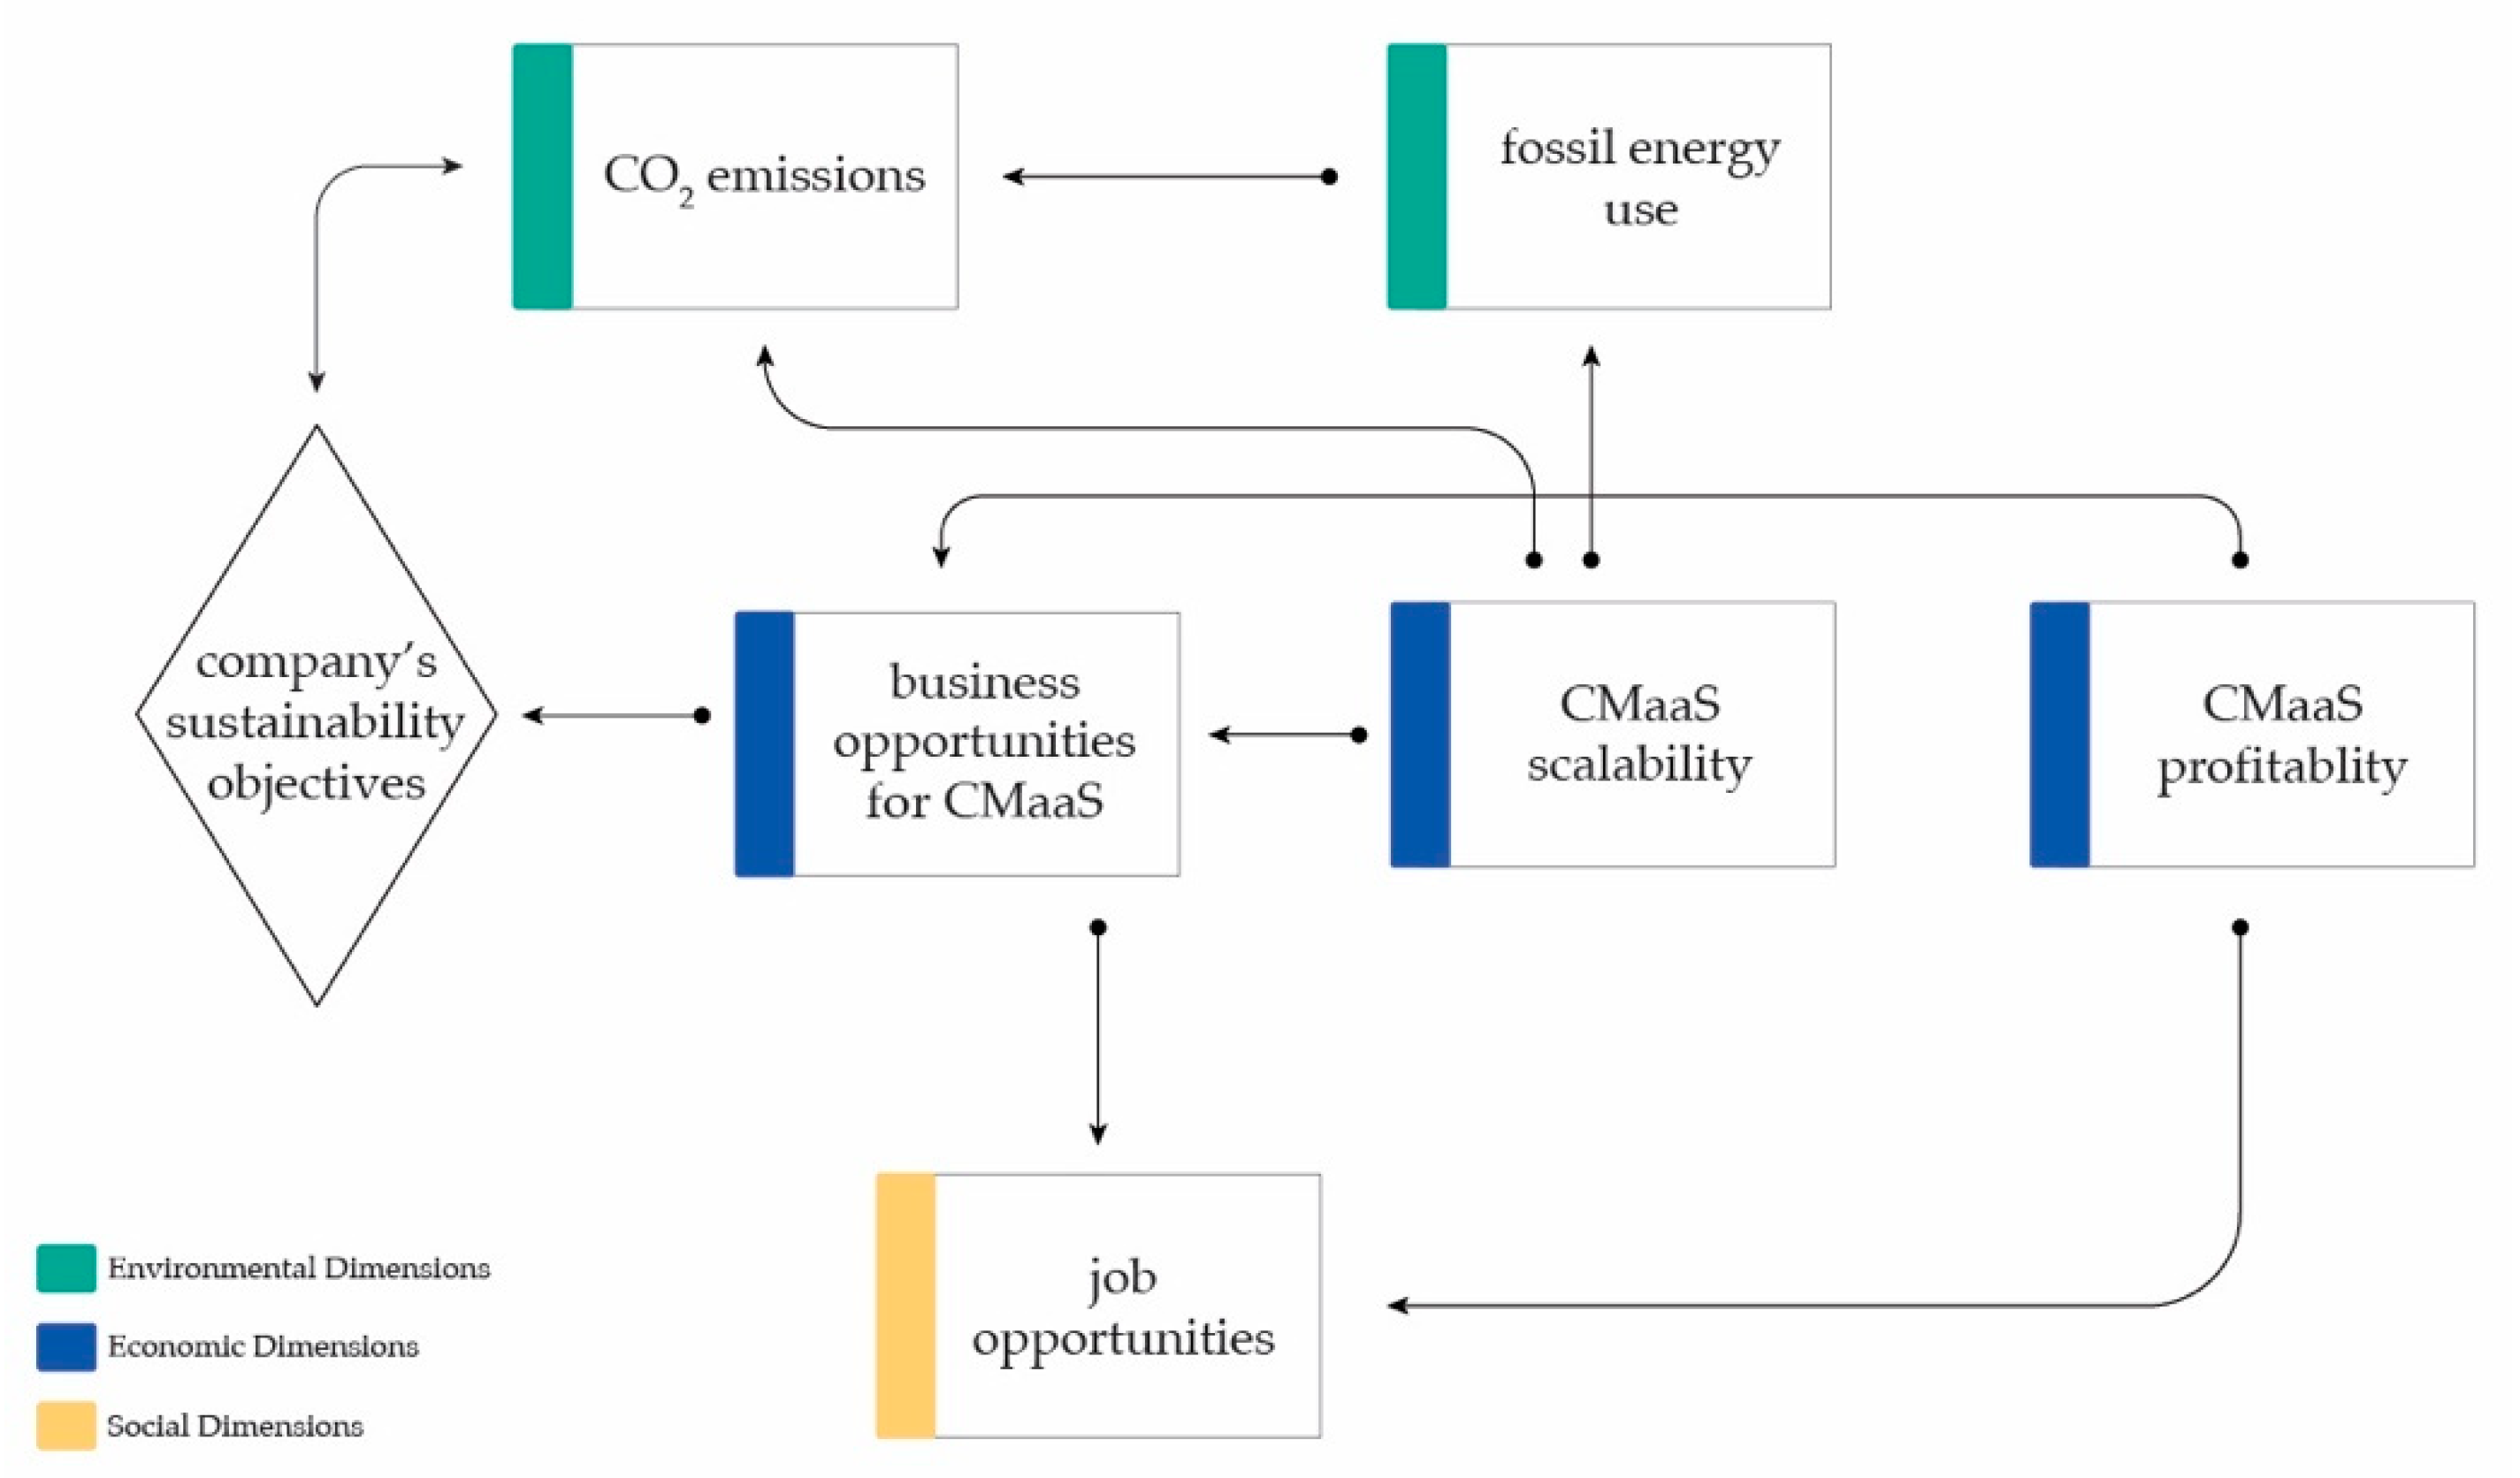
3.2.2. Framework at the Company Level

A company that adopts CMaaS services could be the service provider and/or operator, or the company could have a third party that design, deliver, operate, and manage the CMaaS services. The KPIs chosen to evaluate impacts at the company level are described in Table 3.
One of the most important aspects of this level, as is shown in Figure 3, is the sustainability objectives within the company. The company can offer services that include more environmentally friendly transport modes and more energy-efficient vehicles for employees at the individual level. Decisions made by the company will have an impact on employees and vice versa. Impacts on the social dimension link directly to the economic dimension. The business opportunity, the profitability, and the scalability of CMaaS are associated with the number of new jobs that are created due to the introduction of CMaaS services.

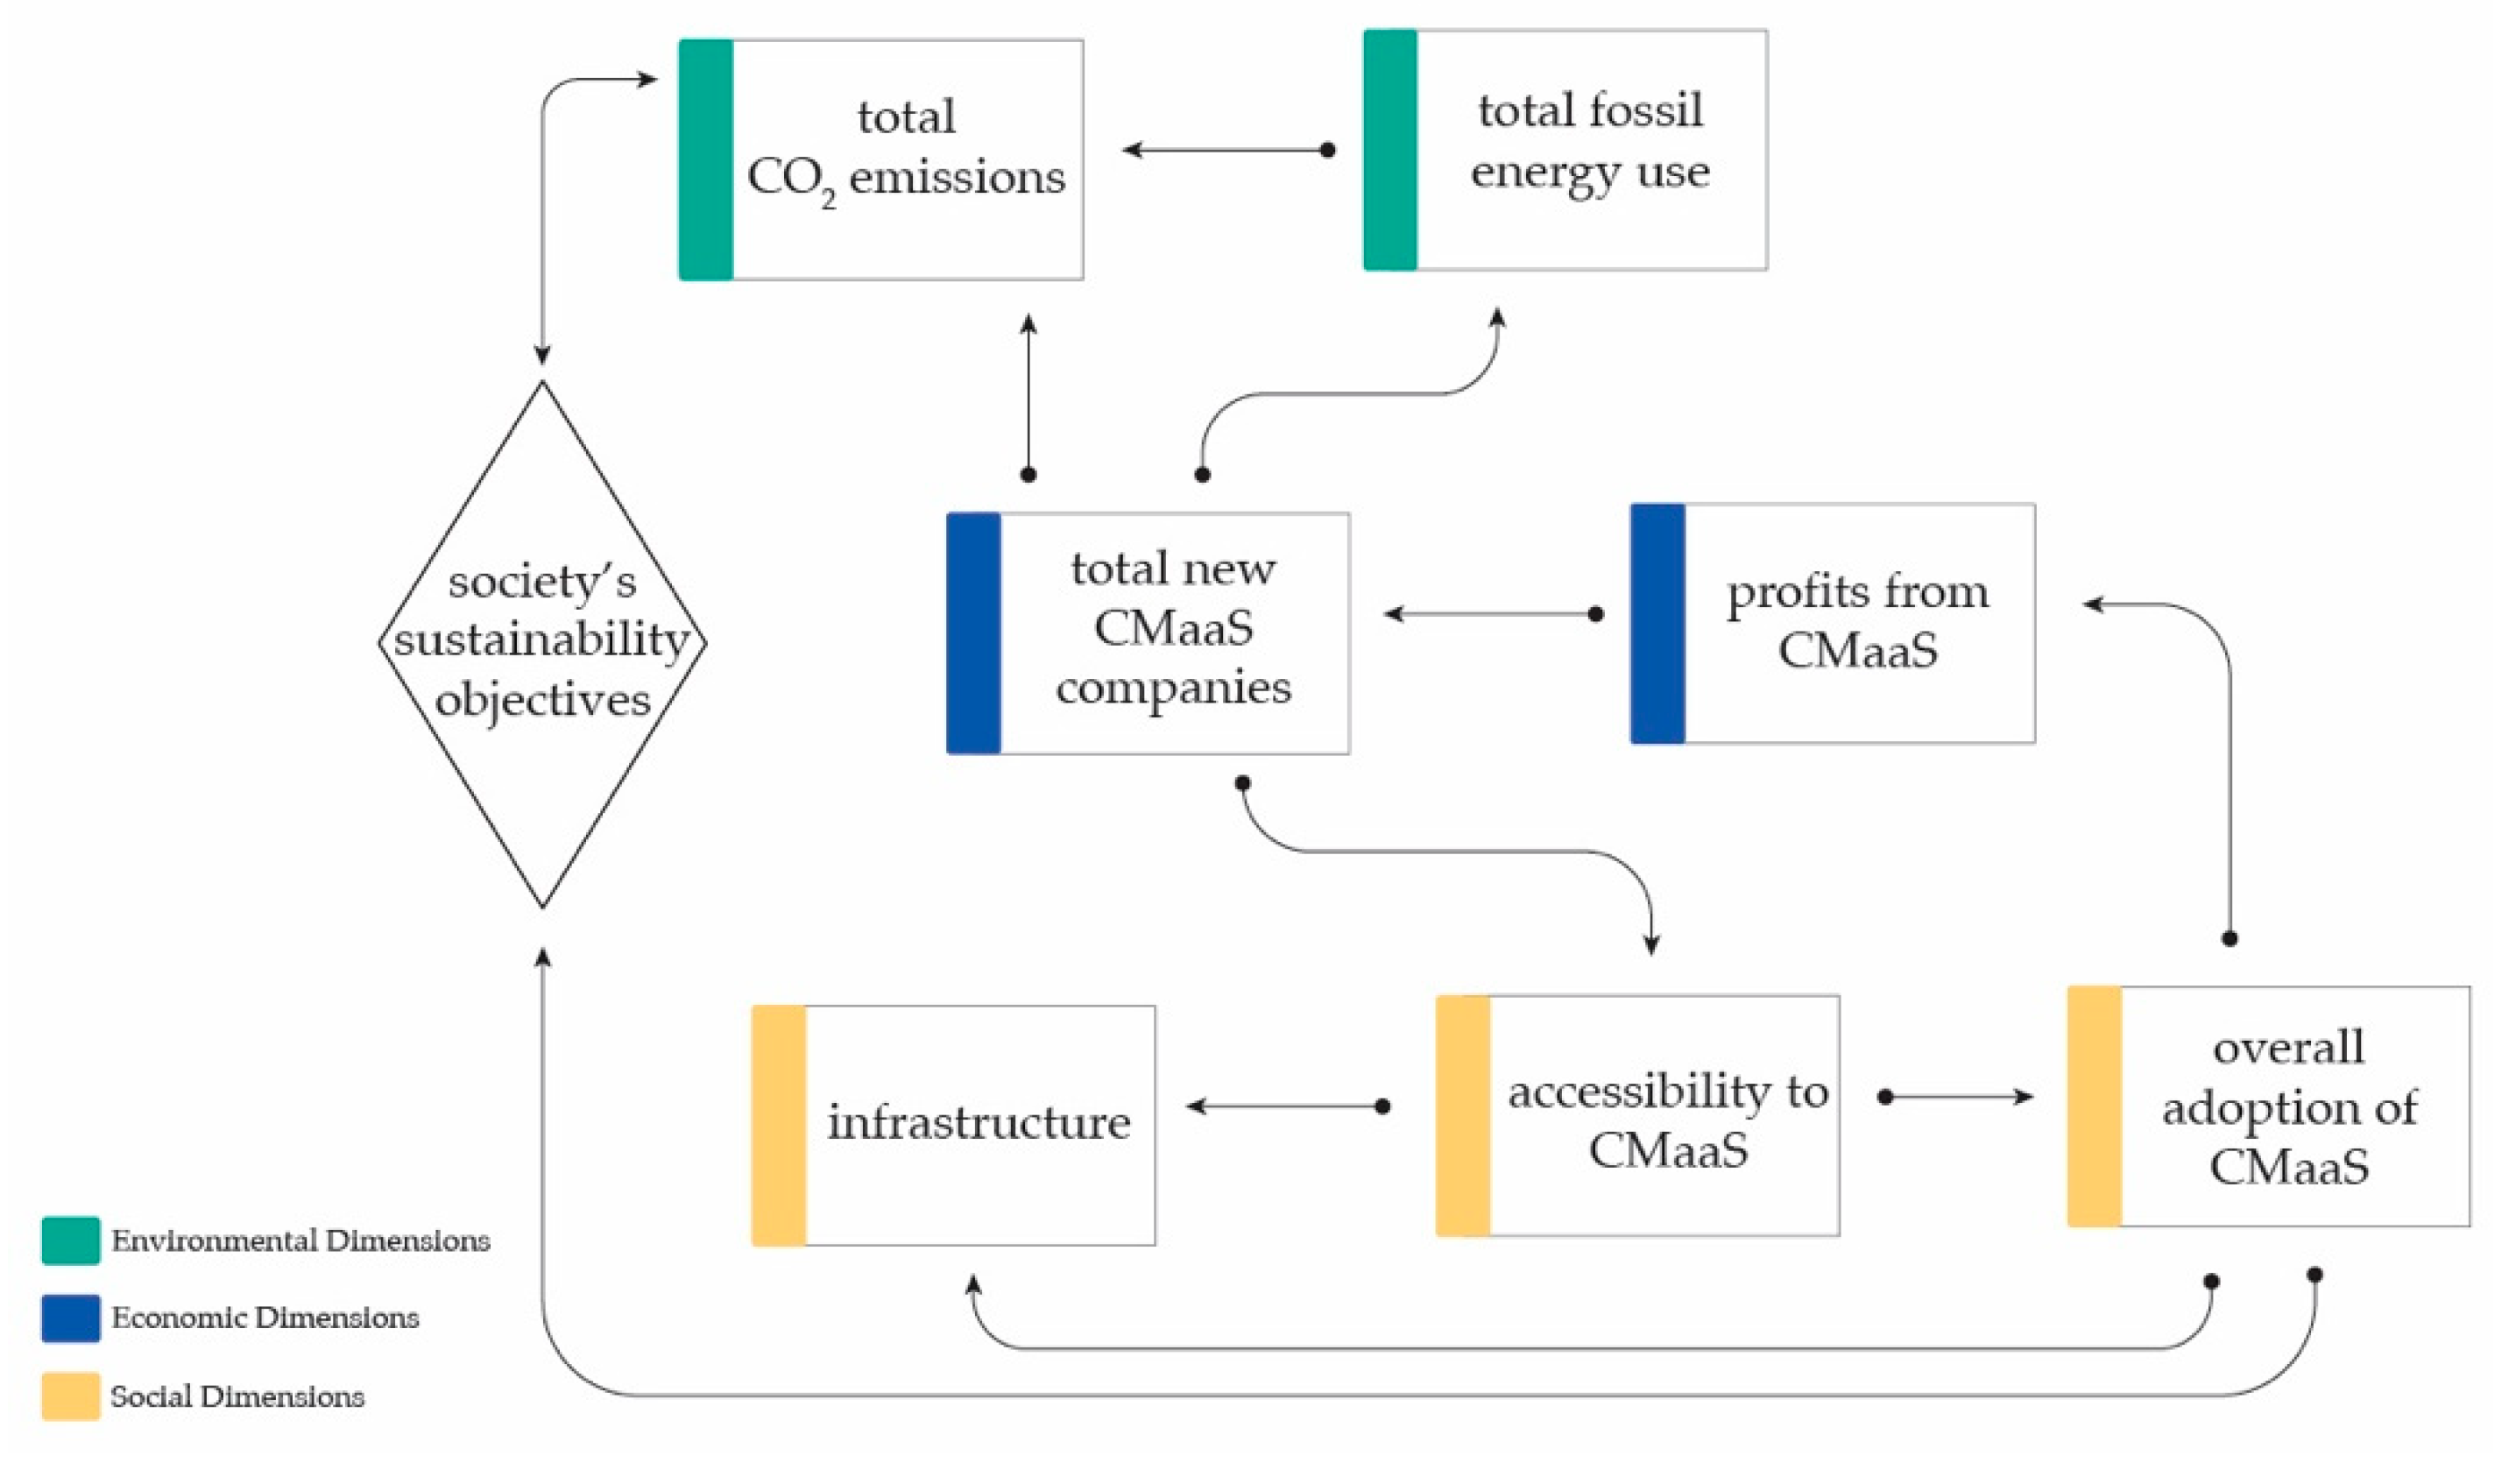
3.2.3. Framework at the Societal Level

In this paper, the societal level is assumed to be the local city/town in which the company is located in. This assumption is mainly due to two reasons: first, impacts on the societal level are the accumulated impacts at a larger scale. Second, since CMaaS pertains to work-related travel operating within the company’s boundaries, it is difficult to observe impacts at a larger societal scale such as a region. The KPIs chosen to evaluate impacts at the societal level are described in Table 4.
The framework at the societal level, as is shown in Figure 4, suggests that if one company has economic benefits from CMaaS, more companies may also start providing and/or operating CMaaS. The adoption of CMaaS, accessibility to CMaaS for non-employees, and repurposing of infrastructure facilities would then have impacts on the social dimension. The environmental impacts at the societal level still address the CO2 emissions and fossil energy consumption in transportation but with a focus at the local city.

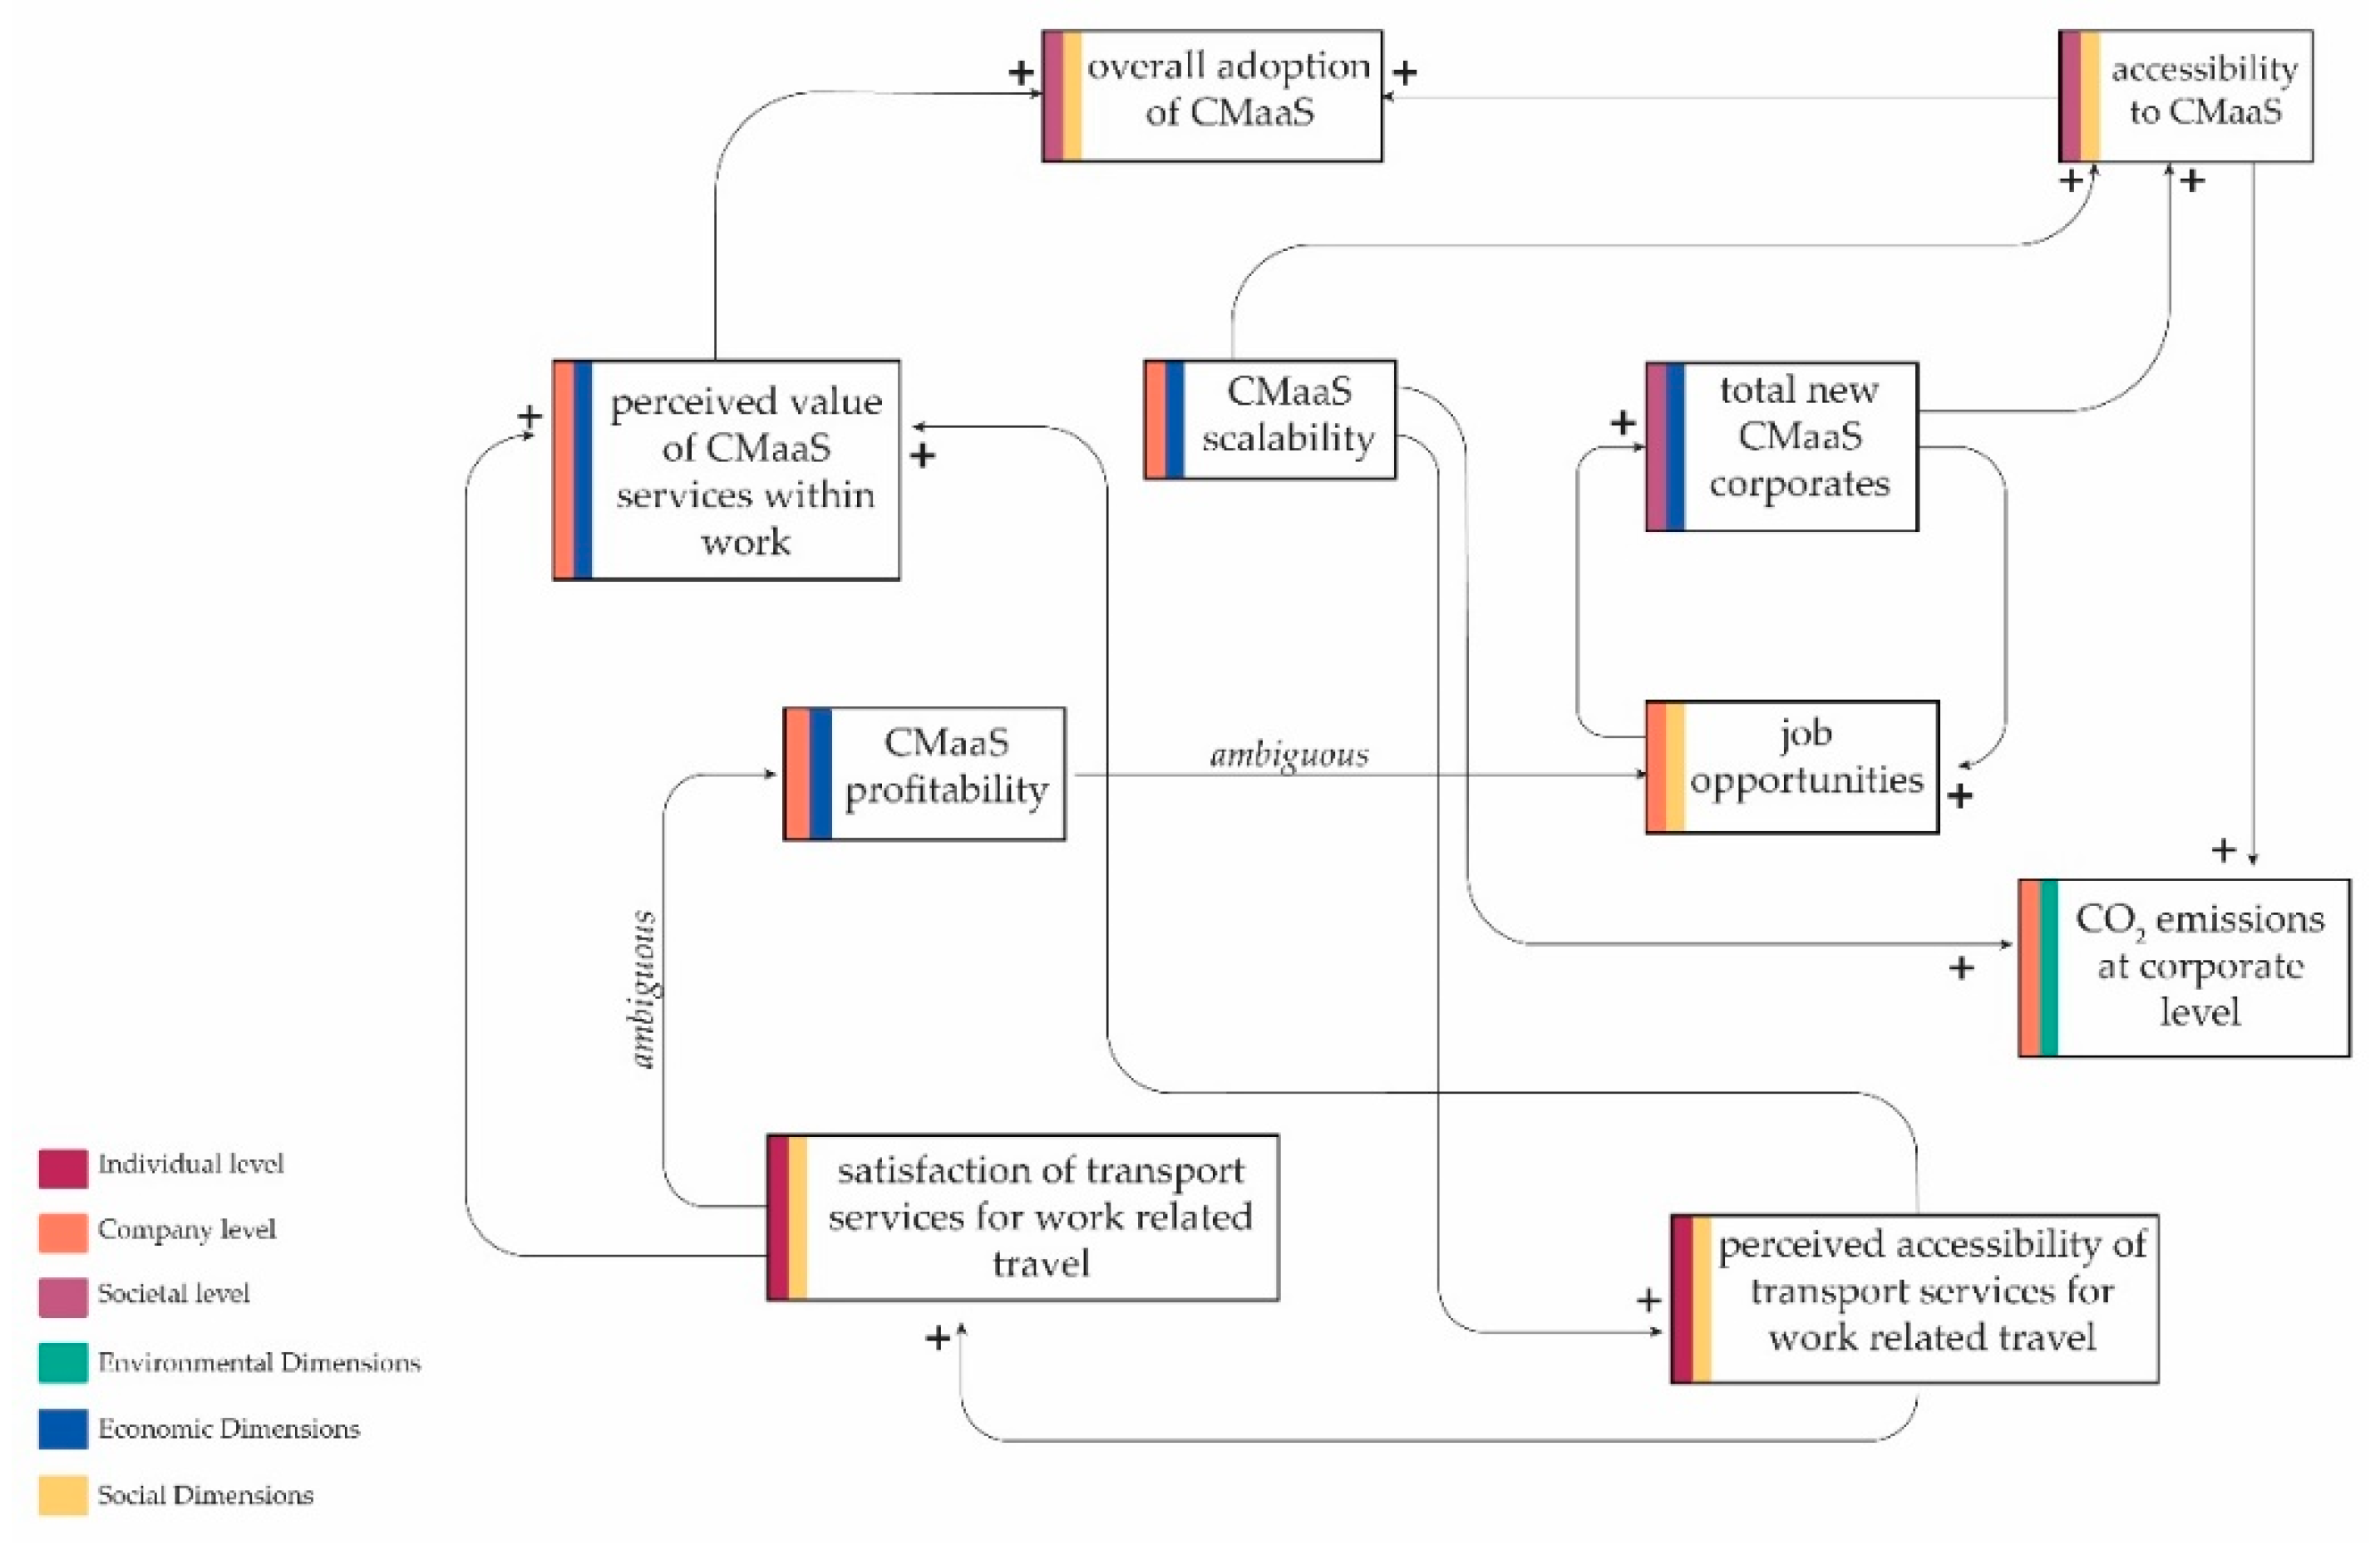
3.2.4. Framework at the System Level

The system level in this paper is an integration of the individual level (employee), the company level, and the societal level (local city). To evaluate the impacts of CMaaS, it is crucial to address these three levels simultaneously, as they relate to each other in various ways. The relationships among these three levels depend upon various factors. Hence, it is necessary to reconsider these relationships and the outcome of these relationships at a system level. The focus on the system level is to examine the relationships among CMaaS scalability, profitability, CMaaS-related job opportunities, perceived accessibility, employees’ satisfaction, and overall adoption of CMaaS. Therefore, rewards and incentives stimulating employees for sustainable travel is a crucial part at the system level. Figure 5 illustrates the system level framework and captures how the impacts could relate to each other.
Employees’ satisfaction of the provided CMaaS services at the individual level will influence the CMaaS profitability at the company level. Simultaneously, the CMaaS scalability decided at the company level influence how the employees perceive the accessibility of the services. Given the central role as end users, how employees perceive the economic value that CMaaS could bring will lead to a change of their travel choices and further influence the overall adoption the CMaaS at the societal level. At the societal level, if the accessibility to CMaaS is well perceived by the individuals, they will increase the use of services for work-related travel. A mutual influence between the company level and the societal level is also captured, since if the job opportunities increase with the company due to CMaaS, the city would support for more CMaaS companies to increase economic growth and social welfare. The society’s sustainability objective and the company’s sustainability objectives closely influence the employees as the end users of CMaaS. Based on the interactions of the impacts, certain target decisions can be made to improve the implementation of CMaaS.

3.3. The MaaS Pilot

In order to demonstrate how the evaluation framework can be used, we applied the framework to a real CMaaS pilot that was launched by a company in May 2018 in Sweden. The company has 15,000 employees with 70 office complexes and facilities spread over the estate with buildings being at least 5km apart. The CMaaS service is provided and operated by the company with a large workspace covering around four-square kilometers. The company’s aim is to offer a sustainable transport solution to/from and within work, which is accessible, attractive, and effective for its employees, and to reduce the use of cars in order to free up space from parking lots and reduce fossil energy use. The CMaaS service is offered via a user-friendly travel app which allows planning and booking trips for the commuter buses, taxis, e-bikes, and shuttle buses with real time information. The CMaaS service provides 3 internal taxis, 14 small shuttle buses, 40 e-bikes, and a mobile application, as is shown in Figure 6 as illustrated by [8]. It also offers six commuter buses to and from the city. The e-bikes are spread among four bicycle stations and the shuttle buses are operated on three routes with 20 stops.
After one-year operation of the CMaaS service, a survey was designed to understand the change of the travel behavior for employees in experiencing the provided services. The survey consisted of questions on demographics, daily travel behavior including using the CMaaS, and attitudes towards the CMaaS services and the equipped app. The survey was distributed via email to 1995 employees through the company’s human resource department. It was conducted between July to September 2019, and 422 responses were received. Table 5 summarizes the basic findings from the survey.

4. Evaluation Results

We apply the framework on the system level in Figure 5 to the pilot mentioned above and calculate the values of the KPIs. The data used for the KPIs calculations are based on the employee survey and also the operational data provided by the department that operates the service.
The data from the user survey provided information for measuring travel behavior, accessibility and quality of travel on the individual level. It was found that the CMaaS services account up to 44% of trips within work per month with the satisfaction rate of 75% as is shown in Table 6.
Twenty-two percent of the respondents also felt that their accessibility to the transport services provided by CMaaS was good. If the company provides incentives for the users, it is possible to encourage 21% of the respondents to shift from private car use to the CMaaS services. The data from the operational department provided information for fossil energy use and emissions on the company level. With the current CMaaS operation, 14.4 kg CO2/vehicle/month of emissions are produced along with 5.47 L/vehicle/month fossil energy use. If the vehicles can be more environmentally friendly in the provided CMaaS, the emissions and fossil energy use of the company can be reduced. Although the CMaaS services provided by the company are largely utilized by its employees, 21% of employees still found their personal cars as a more reliable, flexible, and convenient option in comparison to the CMaaS services for daily commute.
In order to help users, shift from their personal vehicles to the CMaaS services, companies need to add information, and increase accessibility and reliability to the service so that the users can plan and fulfill their trips more efficiently. In the beginning of the services, it may be helpful to provide incentives to the employees to encourage the shift from private car use to share modes. In the long run, this can not only help the company fulfill the corporate sustainability goals but also help the society in building sustainable transport systems. In order to get the specific quantification of the influences, we need to make a list of assumptions, such as the adoption rate of the service. As for operational cost and profits of the services, it is challenging to gain access to data regarding costs and profits due to the General Data Protection Regulation. It is also noted that, although the framework is able to show how the KPIs interact with each other at different levels, it could be difficult to clearly show the positive or negative influences as these KPIs are dependent on multiple factors. For example, employees’ satisfaction of transport services for work-related travel influences the CMaaS profitability.
However, it is ambiguous in this case since the company is paying for all services and it is impossible to get access to the financial data due to confidentiality. The same ambiguity is identified between CMaaS profitability and job opportunities. If a company applies the evaluation framework itself with the KPI values using their own data, it is possible to clear the ambiguity and reveal the impacts. Based on these assumptions and the data gathered, the positive or negative influences among the KPIs in the system level are illustrated in Figure 7 It is found that if the employees are highly satisfied with the transport services provided in the CMaaS service, it has a positive influence on how the employees perceive the value of the services. This in turn has a positive influence on the overall adoption of CMaaS at a societal level.

5. Discussion and Conclusions

MaaS is considered to have the potential for enabling sustainable travel, although much empirical evidence is needed to show the real system impacts of MaaS. Some companies have started to adopt MaaS, in a service that is known as Corporate Mobility as a Service (CMaaS), as a solution to provide employees with more flexible and integrated transport services for travel to/from and within work. The cost of operating a CMaaS service usually relies on the company. The policy and decision-making that is needed for developing and implementing CMaaS is very sensitive to the company development and employees’ satisfaction. The impacts from CMaaS may influence a larger scale of the society as well. Therefore, it is crucial to evaluate the services and its impacts systematically.
The results of the constructed framework and applying the framework on the specific CMaaS pilot shows that the framework can help service providers and operators evaluate the impacts of the services. The complex interactions and influences within the system level can be captured and evaluated. This is important for decision making for the service implementation and adjustment, especially in the early phase of the services. The framework was able to capture the negative and positive influences among the KPIs at a system level. The system level evaluation takes key components within CMaaS as a whole and reveals the interactions among different levels (individual, company, and societal) and different dimensions (environmental, economic, and social). Apart from the influences, the framework can also show how the KPIs interact with each other and form a complex relationship within the system, as is shown in Figure 7.
CMaaS could have the potential to improve the commuting experience for employees to travel to/from and within work, and ultimately aid in the shift towards sustainable transport modes when combined with certain travel incentives. One crucial limitation was found that the output of the framework highly depends on the data input. A more detailed quantitative evaluation requires a higher level of data information. If there is lack of data, the impacts could not be evaluated, the framework could fail to show the impacts.
However, this does not limit the framework to be generalized and applied to other MaaS pilots. On one hand, this shows the common challenge in conducting evaluation in real scenarios due to data limitation. On the other hand, it highlights the importance of taking a systematic view from the beginning to enable the evaluation on a system level. If KPIs are measured with good data support, the system level impacts with all possible interactions can be evaluated, as is illustrated in Figure 7. The identified KPIs and the proposed framework can be modified and applied to various corporate settings and generalized to other MaaS evaluations. However, the level of complexity of the framework may vary due to the type of MaaS and the requirements of evaluation.
We conclude the paper with the following main takeaways:
(1)
The system level impacts of CMaaS evaluated by the framework could support the companies in making better decisions based on the positive and negative impacts for adopting and implementing the service system.
(2)
When combined with travel incentives provided by the company, CMaaS has the potential to improve the commuting experience for employees traveling to, from, and within work.
(3)
The identified KPIs and the system level framework can be modified and applied to various corporate settings and can be generalized to other MaaS impact evaluations.
(4)
With support of good data for the KPIs chosen, the framework could be used in various other corporate contexts as well as other type of MaaS impact evaluation in general.
For future work, based on data and information from other CMaaS pilots, additional KPIs could be identified and added to the framework that could help generate knowledge and guidance to support decision-making for MaaS development and implementation in general.

Author Contributions

B.V.: conceptualization, methodology, writing, visualization; X.Z.: original draft preparation, conceptualization, methodology, writing, data curation; Y.S.: writing—reviewing and editing; A.P.: writing—reviewing and editing, supervision. All authors have read and agreed to the published version of the manuscript.

Funding

This research was funded by the Swedish research funding agency Vinnova within its Strategic Innovation Program Drive Sweden under grant number 2017-01976. This research was supported out by Integrated Transport Research Lab (ITRL) at KTH Royal Institute of Technology. This work was also supported by Cost Action CA16222 (WISE-ACT), a European-wide network that explores the wider impacts of Autonomous and Connected Transport and Austrian FFG Endowed Professor DAVeMoS project.

Conflicts of Interest

The authors declare no conflict of interest.

References

  1. Lam, A. The Countries with the Longest and Shortest Commutes. Available online: https://daliaresearch.com/blog/the-countries-with-the-longest-and-shortest-commutes/ (accessed on 17 December 2019).
  2. van Doorn, L.; Arnold, A.; Rapoport, E. In the Age of Cities: The Impact of Urbanisation on House Prices and Affordability. Hot Prop. 2019, 3–13. [Google Scholar] [CrossRef] [Green Version]
  3. Abedin, N.; Kamau, J.; Hossain, M.I.; Maruf, R.I.; Fukuda, A.; Ahmed, A. A Case Study to Design a Mobility as a Service Model for Urban Female Corporates to Improve Their Work Performance. In Proceedings of the TENCON 2017-2017 IEEE Region 10 Conference, Penang, Malaysia, 5–8 November 2017; pp. 1445–1450. [Google Scholar] [CrossRef]
  4. Gilibert, M.; Ribas, I.; Rodriguez-Donaire, S. Study of On-Demand Shared Ride-Hailing Commuting Service: First Results from a Case Study in Barcelona. WIT Trans. Built Environ. 2019, 182, 121–128. [Google Scholar] [CrossRef] [Green Version]
  5. Ma, L.; Ye, R. Does Daily Commuting Behavior Matter to Employee Productivity? J. Transp. Geogr. 2019, 76, 130–141. [Google Scholar] [CrossRef]
  6. Olsson, L.E.; Gärling, T.; Ettema, D.; Friman, M.; Fujii, S. Happiness and Satisfaction with Work Commute. Soc. Indic. Res. 2013, 111, 255–263. [Google Scholar] [CrossRef] [PubMed] [Green Version]
  7. Laine, A.; Lampikoski, T.; Rautiainen, T.; Bröckl, M.; Bang, C.; Poulsen, N.S.; Kofoed-Wiuff, A. Mobility as a Service and Greener Transportation Systems in a Nordic Context; Nordic Council of Ministers: Copenhagen, Demark, 2018. [Google Scholar] [CrossRef] [Green Version]
  8. Hesselgren, M.; Sjöman, M.; Pernestål, A. Understanding User Practices in Mobility Service Systems: Results from Studying Large Scale Corporate MaaS in Practice. Travel Behav. Soc. 2019, 21, 318–327. [Google Scholar] [CrossRef]
  9. Jittrapirom, P.; González, A.; Caiati, V.; Feneri, A.; Ebrahimigharehbaghi, S.; Alonso, M.J. Mobility as a Service A Critical Review of Definitions, Assessments of Schemes, and Key Challenges. Urban Plan. 2017, 21, 13–25. [Google Scholar] [CrossRef] [Green Version]
  10. Heikkilä, S. Mobility as a Service—A Proposal for Action for the Public Administration Case Helsinki. 2014. Available online: https://aaltodoc.aalto.fi/handle/123456789/13133 (accessed on 17 December 2019).
  11. Hilgert, T.; Kagerbauer, M.; Schuster, T.; Becker, C. Optimization of Individual Travel Behavior through Customized Mobility Services and Their Effects on Travel Demand and Transportation Systems. Transp. Res. Procedia 2016, 19, 58–69. [Google Scholar] [CrossRef]
  12. Ho, C.Q.; Hensher, D.A.; Mulley, C.; Wong, Y.Z. Potential Uptake and Willingness-to-Pay for Mobility as a Service (MaaS): A Stated Choice Study. Transp. Res. Part A Policy Pract. 2018, 117, 302–318. [Google Scholar] [CrossRef]
  13. Johansson, M. Mobility as a Service: Exploring Young People’s Mobility Demands and Travel Behavior. 2017. Available online: https://www.diva-portal.org/smash/get/diva2:1148201/FULLTEXT01.pdf, (accessed on 17 December 2019).
  14. Karlsson, M.; Akram, A.; Fallahi, S.; Sarasini, S.; Zhao, X. A National Approach to Assessing the Impacts of Mobility-as-a-Service (MaaS). In Proceedings of the ICOMAAS. 2nd International Conference on Mobility as a Service, Tampere, Finland, 3–4 December 2019; pp. 357–365. [Google Scholar]
  15. Kerttu, J.; Rosqvist-Smidfelt, L.; Wendle, B. Konsekvenser Av Mobility as a Service; Trivector Services Inc.: Huntsville, AL, USA, 2016. [Google Scholar]
  16. Burrows, A.; Bradburn, J.; Cohen, T. Journeys of the Future- Introducing Mobility as a Service; Atkins: London, UK, 2015. [Google Scholar]
  17. Kamargianni, M.; Li, W.; Matyas, M.; Schäfer, A. A Critical Review of New Mobility Services for Urban Transport. In Transportation Research Procedia; Elsevier B.V.: Amsterdam, The Netherlands, 2016; Volume 14, pp. 3294–3303. [Google Scholar] [CrossRef] [Green Version]
  18. Li, Y.; Voege, T. Mobility as a Service ( MaaS ): Challenges of Implementation and Policy Required. J. Transp. Technol. 2017, 7, 95–106. [Google Scholar] [CrossRef] [Green Version]
  19. Wong, Y.Z.; Hensher, D.A.; Mulley, C. Emerging Transport Technologies and the Modal Efficiency Framework: A Case for Mobility as a Service (MaaS). In Proceedings of the 15th International Conference Series on Competition and Ownership in Land Passenger Transport (Thredbo 15), Stockholm, Sweden, 13–17 August 2017. [Google Scholar]
  20. Axelsson, J. FFI Strategic Initiative Systems-of-Systems for Smart Urban Mobility (SoSSUM); Trafikverket: Sweden, 2017; Available online: https://www.vinnova.se/globalassets/utlysningar/2018-00136/omgangar/ffi-sossum-program-description.pdf845879.pdf (accessed on 23 January 2020).
  21. Machado, C.A.; de Salles Hue, N.P.; Berssaneti, F.T.; Quintanilha, J.A. An Overview of Shared Mobility. Sustainability 2018, 10, 4342. [Google Scholar] [CrossRef] [Green Version]
  22. Utriainen, R.; Pöllänen, M. Review on Mobility as a Service in Scientific Publications. Res. Transp. Bus. Manag. 2018, 27, 15–23. [Google Scholar] [CrossRef]
  23. Söderberg, R.; Carlsson, P. Trötta på tågkaoset–nu sätter Ikea in egna bussar. Available online: https://www.svt.se/nyheter/lokalt/smaland/trottnade-pa-tagkaoset-nu-satter-de-in-egna-bussar (accessed on 23 January 2020).
  24. Helft, M. Google’s Buses Help Its Workers Beat the Rush. Available online: https://www.nytimes.com/2007/03/10/technology/10google.html (accessed on 23 January 2020).
  25. González, Á. Amazon to Launch Commuter Bus Service for Eastside Employees. Available online: https://www.seattletimes.com/business/amazon/amazon-to-launch-commuter-bus-service-for-eastside-employees/ (accessed on 10 December 2019).
  26. Hashim, R.; Haron, S.; Mohamad, S.; Hassan, F. Assessment of Campus Bus Service Efficacy: An Application towards Green Environment. Procedia-Soc. Behav. Sci. 2013, 105, 294–303. [Google Scholar] [CrossRef] [Green Version]
  27. BusinessWeek Research Services. The Impact of Commuting On Employees How Commuter Benefits Can Help; TransitCenter, Inc.: New York, NY, USA, 2008. [Google Scholar]
  28. Constellation. How Employee Commuter Benefits Attract and Retain Talent. Available online: https://blog.constellation.com/2019/06/25/commuter-benefits-energy-savings/ (accessed on 10 December 2019).
  29. Antcliff, K.R.; Moore, M.D.; Goodrich, K.H. Silicon Valley as an Early Adopter for On-Demand Civil VTOL Operations. In Proceedings of the 16th AIAA Aviation Technology, Integration, and Operations Conference, Washington, DC, USA, 13–17 June 2016. [Google Scholar] [CrossRef] [Green Version]
  30. Sochor, J.; Strömberg, H.; Karlsson, C.M. Implementing Mobility as a Service: Challenges in Integrating User, Commercial, and Societal Perspectives. Transp. Res. Rec. 2015, 2536, 1–9. [Google Scholar] [CrossRef]
  31. Varela, J.; Susilo, Y.; Jonsson, D. User Attitudes towards a Corporate Mobility as a Service. Transportation 2018, 1–27, Pre-print. [Google Scholar]
  32. Parker, J. Applying a System of Systems Approach for Improved Transportation. S.a.P.I.En.S 2010, 3, 2. [Google Scholar]
  33. Mukhtar-Landgren, D.; Karlsson, M.; Koglin, T.; Kronsell, A.; Lund, E.; Sarasini, S.; Sochor, J.; Wendle, B. Institutional Conditions for Integrated Mobility Services (IMS). Towards a Framework for Analysis. 2016. Available online: https://portal.research.lu.se/portal/files/28465662/Mukhtar_Landgren_et_al_2016_Institutional_conditions_for_integrated_mobility_services.pdf, (accessed on 23 January 2020).
  34. KOMPIS. KOMPIS-Kombinerad Mobilitet som tjänst i Sverige. Available online: https://kompis.me/ (accessed on 10 February 2020).
  35. Henning, T.; Essakali, M.D.; Oh, J.E. A Framework for Urban Transport Benchmarking; World Bank: Washington, DC, USA, 2011; Volume 78. [Google Scholar]
  36. Swan, W. An Introduction to Key Performance Indicators. Available online: https://constructingexcellence.org.uk/tools/frameworkingtoolkit/the-process/construction/key-performance-indicators/ (accessed on 20 June 2020).
  37. Djordjevic, B.; Krmac, E. Key Performance Indicators for Measuring the Impacts of ITS on Transport. In Proceedings of the ISEP 2016: 5th EAAP International Symposium on Energy and Protein Metabolism and Nutrition, Krakow, Poland, 12–15 September 2016. [Google Scholar]
  38. Tundys, B. Key Performance Indicators as Element of Assessment and towards the Development of Sustainable Mobility. In Proceedings of the 17th International Conference on Transport Science ICTS 2015, Portoroz, Slovenia, 21–22 May 2015; pp. 540–553. [Google Scholar]
  39. European Commission. White Paper European Transport Policy for 2010: Time to Decide. Comm. Eur. Communities 2001, 21, 1–179. [Google Scholar]
  40. European Commission Communication. A Sustainable Future for Transport: Towards an Integrated, Technology-Led and User-Friendly System; European Commission: Brussel, Belgium, 2009. [Google Scholar]
  41. European Communities-Commission. The Future Development of the Common Transport Policy. Eur. White Pap. 1992, 92, 454. [Google Scholar]
  42. Sveriges Riksdag. The Entire Journey All Year Round!–A Follow-up of the Accessibility of the Transport System for People with Functional Disabilities; Swedish Parliament: Stockholm, Sweden, 2013. [Google Scholar]
  43. Trafikverket. The Swedish Transport Administration Annual Report. 2017; pp. 1–104. Available online: https://trafikverket.ineko.se/Files/sv-SE/49148/Ineko.Product.RelatedFiles/2018_086_TRV_Annual%20Report_2017.pdf (accessed on 17 December 2019).
  44. Ringenson, T.; Arnfalk, P.; Kramers, A. Indicators for Promising Accessibility and Mobility Services. Sustainability 2018, 10, 2836. [Google Scholar] [CrossRef] [Green Version]
Figure 1. Specific KPIs chosen to measure system impacts of Corporate Mobility as a Service (CMaaS).
Sustainability 12 07051 g001
Figure 2. Interactions among environmental, economic, and social dimension on the individual level.
Sustainability 12 07051 g002
Figure 3. Interactions among environmental, economic, and social dimensions on the company level.
Sustainability 12 07051 g003
Figure 4. Interactions among environmental, economic, and social dimensions on the societal level.
Sustainability 12 07051 g004
Figure 5. Interactions among environmental, economic, and social dimensions on the system level.
Sustainability 12 07051 g005
Figure 6. The services provided in the CMaaS pilot by a company in Sweden (Source: [8]).
Sustainability 12 07051 g006
Figure 7. Results of the evaluation framework showing the system level impacts of the CMaaS pilot.
Sustainability 12 07051 g007
Table 1. Summary of most commonly used key performance indicators (KPIs) in the literature for measuring urban mobility, sustainable transportation, and Mobility as a Service (MaaS).
Category of IndicatorsDescriptionReferences
Quality of travelValue and experience of travel such as, comfort; reliability; flexibility; satisfaction
-
White Paper on transport: The future development of the common transport policy, 1992;
-
White Paper on transport: European transport policy for 2010: time to decide, 2001;
-
Green paper: towards a new culture for urban mobility, 2007;
-
Weisbrod & Weisbrod, 1997b;
-
Markovich & Lucas, 2011;
-
Kamargianni et al., 2015
-
Karlsson et al., 2017
Travel CostsIndividual or household costs of travel
-
European Commission Communication: Developing the citizens network, 1998;
-
Weisbrod & Weisbrod, 1997b;
-
European Commission Communication: Keep Europe moving – sustainable mobility for our Continent, 2006
-
Kamargianni et al., 2015;
-
Karlsson et al., 2017
AccessibilityAvailability, access and distribution of facilities and services
-
European Commission Communication: Developing the citizens network, 1998;
-
Geurs et al., 2009;
-
EU 2013;
-
Burrows et al., 2015;
-
White Paper on transport: European transport policy for 2010: time to decide, 2001
-
Kamargianni et al., 2015;
-
European Commission Communication: Keep Europe moving – sustainable mobility for our Continent, 2006
-
Green paper: towards a new culture for urban mobility, 2007;
-
Karlsson et al., 2017
-
European Commission Communication: A sustainable future for transport: Towards an integrated, technology-led and user-friendly system, 2009
Business ModelsEffective business model indicators referring to type of value creation, economic profits, value offered to the customer, service pricing and management.
-
Weisbrod & Weisbrod, 1997a;
-
Bocken, N.M.P. et al., 2014
-
Cascajo, 2005;
-
Karlsson et al., 2017
-
EU 2009;
-
Ringenson et al., 2018
EmploymentNew job opportunities are created due to the transport service.
-
Karlsson et al., 2017;
-
Weisbrod & Weisbrod, 1997a;
-
Kamargianni et al., 2015;
-
Cascajo, 2005;
-
Weisbrod & Weisbrod, 1997b;
Quality of lifeInfluence of travel on functions of life for society and its individuals such as health, time use, recreation etc.
-
Markovich & Lucas, 2011;
-
Karlsson et al., 2017;
-
Axhausen, 2008;
-
Kamargianni et al., 2015
-
Swedish Transport Administration, 2011
Infrastructure and Land useRequired area or costs for transport services such as bus stops, parking spaces, roads etc. and use of space
-
White Paper on transport: The future development of the common transport policy, 1992;
-
EU 2009;
-
Geurs et al., 2009;
-
Green paper: towards a new culture for urban mobility, 2007;
-
Rodrigue 2017
-
European Commission Communication: Developing the citizens network, 1998;
-
Karlsson et al., 2017
Travel behaviorIndividuals’ travel preferences and habits such as kms travelled, no. of trips, choice of transport modes etc.
-
Cascajo, 2005
-
Karlsson et al., 2017
-
Ringenson et al., 2018
Energy use & EmissionsConsumption of fossil fuels of transportation & Pollution due to use of private vehicles for example: CO2 emissions affecting air quality due to petrol and diesel vehicles
-
European Commission Communication: Developing the citizens network, 1998;
-
Weisbrod & Weisbrod, 1997b;
-
Action Plan on Urban Mobility, 2009;
-
Cascajo, 2005;
-
European Commission Communication: A sustainable future for transport: Towards an integrated, technology-led and user-friendly system, 2009
-
EU 2009;
-
A European vision for Passengers: Communication on Passenger Rights in all transport modes, 2011
-
EU 2013;
-
Rodrigue, 2017;
-
Burrows et al., 2015;
-
Karlsson et al., 2017
Table 2. KPIs identified on the individual level with descriptions of the measurement.
Category of IndicatorsKPI ValuesDescription
Travel Behaviortotal travel/individual/monthtotal number of trips that were made
% of multimodal total no. of trips/individual/ monthnumber of multimodal trips combining the following traffic modes within one travel: Public transport CMaaS Services, Personal Car, Walk
Travel Costs% travel costs/ monthly incomethe total monthly cost of individual / household daily travel including: Cost of public transport ticket (s), Cost of car incl. gasoline, parking, Cost of car rental, Cost of taxi ride
perceived value of services within workto what extent the user perceives that the options provided by the transport system are worth the cost in SEK.
Accessibilityperceived accessibility to transport services for work related travelto what extent the user’s needs for travel are fulfilled
Quality of travelsatisfaction of transport services for work related travelto what extent the user finds that the transport system is designed in a way that makes it easy to reach destinations
Table 3. KPIs identified on company level with descriptions of the measurement.
Category of IndicatorsKPI ValuesDescription
Energy use & EmissionsCO₂ emissionsamount of CO₂ emissions per kilometer driven
fossil energy useamount of fossil fuel per kilometer driven
Business Modelsbusiness opportunities for CMaaSto what extent the service leads to new business opportunities
CMaaS scalabilityassessing the ability of the company’s business model to cost-efficiently grow
CMaaS profitabilitynet profit margin, i.e. a ratio of total revenue minus costs divided by total revenue
Employmentjob opportunitiesto what extent the service can lead to new jobs
Table 4. KPIs identified on societal level with descriptions of the measurement.
Category of IndicatorsKPI ValuesDescription
Energy use & Emissionstotal CO₂ emissionstotal CO₂ emissions per kilometer driven
total fossil energy usetotal fossil energy use travel per year
Business Modelsprofits from CMaaStotal new employees are employed in companies / organizations related to CMaaS
Employmenttotal new CMaaS corporatestaxes from CMaaS operation
Infrastructure & Land Useinfrastructureland area or cost used for bus stops, roads, electric charging points, parking lots, etc.
Accessibilityaccessibility to CMaaSto what extent the service reaches different user segments and user groups
Quality of traveloverall adoption of CMaaSto what extent do users accept and adopt to the new CMaaS services
Table 5. Respondent Characteristics.
VariableCount (n = 422)
Age20–2969
30–39117
40–49112
50–59104
60–6920
GenderMale285
Female137
Household Size178
2123
371
4120
5 or more23
Access to driver’s licenseYes404
No18
Access to car in the householdYes346
No76
Days/week at workplace12
20
34
423
5384
Travel Behaviour
(transport alternatives normally used when commuting
to/from work)
Private car as a driver280
Private car as a passenger49
Commuter bus (offered by the company)59
Public Transport100
Own bike74
E-bike (offered by the company)4
Taxi (offered by the company)3
Shuttle bus (offered by the company)18
Walk38
Other10
Travel Behaviour
(transport alternatives normally
used when commuting
within work)
Private car as a driver179
Private car as a passenger47
Commuter bus (offered by the company)33
Public Transport13
Own bike31
E-bike (offered by the company)70
Taxi (offered by the company)53
Shuttle bus (offered by the company)262
Walk170
Other13
Table 6. Measured values of KPIs on the applied CMaaS pilot.
VariableKPIsKPI Values
Individualtotal work/related travel/individual/month26
% of work-related journeys with different transport modes/ monthPersonal car as a passenger21%
Taxi (offered by the company)6%
Shuttle bus (offered by the company)30%
Walk20%
Other15%
E-bike8%
Perceived accessibility to transport services for work related travel22% (overall)
Satisfaction of transport services for work related travelApp18% strongly satisfied
Taxi (offered by the company)19% strongly satisfied
Shuttle bus (offered by the company)34% strongly satisfied
E-bike22% strongly satisfied
OrganizationalCO2 emissions14.4 kgCO²/vehicle/month
Fossil energy use5.47 liters/vehicle/month
CMaaS scalabilityLevel 2
Job opportunities0.1%

