Abstract
The cultivation of vegetables in greenhouses requires seedlings produced in nurseries with high levels of practice specialisation. The nurseries are dedicated to the early stages of growth, from sowing to the first leaves. There, the seeding density and the hydro-climatic conditions favour diseases. Plant protection treatments are carried out with the use of low-cost machines, whose efficiencies and safety conditions depend on the workers’ ability. The irrigation system with a mechanised horizontal spray boom could be an alternative solution to the hand-held spray gun. This research aimed to investigate the use of a horizontal boom sprayer for the distribution of pesticides in different pressure conditions and forward speeds compared with a spray gun, in relation to tomato growth stages. The tests were carried out on tomato seedlings grown in polystyrene seeding boxes and arranged on hanging benches. Deposits on the seedlings (µL cm−2) and losses in the soil (µL cm−2) were assessed by means of standard colorimetric analysis. In order to reduce the environmental pollution and increase the sustainability of the treatments, the pressure at the horizontal spray boom should be reduced and the arrangement of the outermost nozzles may also be better set on the boom.
1. Introduction
The production of greenhouse vegetables plays an important role in the foreign trade balance of several national economies in Mediterranean climate areas, where countries have become increasingly competitive producers. However, the intensification of greenhouse crop production has significantly increased the need for pesticide applications, leading to a serious impact on the environment and human health [1].
Italian agriculture is characterised by a surface area covered by greenhouses of about 36,370 hectares (ha), which is used to produce about 1748 kt vegetables; it represents about 11% of the total surface area, both in open fields and in greenhouses, dedicated to vegetable production in this country [2]. These greenhouses are located primarily in southern Italy [3], and the production of vegetables in Sicily represents about 19% of the total of Italian greenhouse production [2]. As shown in a recent study, about 10% of the national vegetable nurseries are located in this region, with a coverage ratio (plant nursery/vegetable cultivation) equal to one nursery company for every 104 vegetable companies; that is, 1 ha of vegetable nursery for every 221 ha of vegetable cultivation [4].
The preparation of seedling trays used for replanting in the field is performed by nurseries that produce seedlings to be transplanted into cultivation greenhouses or open fields [5]. Due to the high planting density, high temperatures and humidity, the earliest growing phase of the seedlings is subject to pathogen attacks on very soft tissues, which cause seedling death.
In greenhouses, plant protection control is mostly carried out with chemical products, although in recent years, new examples of IPM (Integrated Pest Management) have been tested using suitable prototypes, which are less harmful to the environment and human health [6,7,8,9].
In order to reduce the use of chemical pesticides, and because legislative measures and standard requirements regarding the quality and safety of vegetables have become progressively stringent, IPM practices that could contribute to reaching these targets are quite urgent [10], although these practices are still few widespread.
A correct treatment should have a deposition near the threshold of pest or disease control, with a uniform distribution over the canopy to minimise losses to the soil or drift. In fact, it is generally accepted that the foliar application of a pesticide is an inefficient process, with only a fraction of the pesticide actually being retained on plants, and part of it being lost to the ground [11,12,13]. As has been widely demonstrated, in greenhouses, the uniformity of the distribution, the quantity of the pesticide retained by the canopy and the losses to the soil depend on many factors, such as the kind of equipment [14,15,16,17,18,19,20,21,22,23], the application volume, and the spray quality [12,17,24,25,26,27,28,29,30,31,32,33].
As has been directly observed in fields, nurseries perform several plant protection treatments in order to ensure the best health conditions for seedlings. Therefore, the distribution of pesticides in nurseries is a crucial practice, but it is also among those practices which are more impactful on the environment and more dangerous for employees working in confined spaces [13,15,20]. Braekman et al. [17] added that farmers have the perception that high application rates and spray pressures are indispensable for obtaining satisfactory coverage and sufficient crop penetration. Sanchez-Hermosilla et al. [19] stated that the lack of uniformity from hand-held gun sprayers is the combined result of the effect of insufficient penetration in the canopy, heavy losses to the soil from the leaf, and insufficient deposition on the abaxial side of the leaves. These results confirm that the use of a higher volume or pressure cannot ensure the best results. In fact, as a reaction to the insufficient control of pests, farmers usually spray more frequently using the same pesticide and a larger spraying volume, increasing environmental pollution, operator exposure risks and the risk of plant resistance development.
Alternative spraying techniques to hand-held sprayers have been developed and tested in the past few years. Several studies have already shown that the use of a vertical boom sprayers in greenhouses improves spray distribution [19,25] and reduces labour costs and operator exposure [13,15,22] compared to spray guns.
Breakman et al. [17] and Foquè et al. [29] showed that, in ornamental protected cultivation, the crop density affects spray deposition results, and the spray guns performed better with a low crop density, but their advantage disappeared in higher crop density conditions. The vertical or horizontal boom sprayer offered more uniform coverage, better deposition, reduced pesticide runoff to the environment and reduced risk of operator exposure to pesticides.
Usually, greenhouse farmers mainly use hand-held spray guns or lances, neglecting aspects related to the workload and the risk of exposure [13,15]. Such practices, whose distribution uniformity is strictly subject to the capacity, attention and fatigue of the operator, can be much less effective than mechanised solutions, such as the boom sprayer, which, in addition to allowing a more constant distribution, helps avoid operator exposure [31,32].
Sanchez-Hermosilla et al. [19] showed that the vertical boom sprayer improved the uniformity of the spray distribution in the canopy, as the droplets penetrated better into interior zones of the tomato crops, with less deposition on the ground. This allows for a reduction in the common disproportionate and inefficient use of inputs in the production of greenhouse tomatoes without a corresponding increase in yields [34].
As observed by a direct and preliminary investigation to this work, most nursery vegetable farms in south-eastern Sicily have horizontal boom sprayers for irrigation, and sometimes for seedling protection; however, these mechanized spray booms are almost never used for phytosanitary operations in Mediterranean areas [35]. This is because, in the same hanging benches, seedlings of different vegetative stages, varieties and crops—and thus with different needs—could be close to one another. The phytosanitary treatments are mostly carried out by means of hand-held spray gun; these have the nozzle connected to an electric or membrane pump, which takes the liquid from a tank. Such equipment can be placed on a trolley pushed by hand or on a tank car driven by a tractor positioned outside of the greenhouse, and only the worker goes inside the greenhouse to manage the treatments. During this practice, in most of the examined greenhouses, there were typically two workers—one to manage incidental operations related to the trolley or the displacement of the tube, and the other to perform the actual treatment with the spray gun. The practice is usually performed with a frequency that, in the summer, reaches up to two weekly treatments, distributing approximately 100–150 L of phytoiatric mixture on a 1000 m2 surface area.
The main objective of this work was to deepen the knowledge of the sprayer–vegetable seedling relationship, in order to improve the methods and regulation criteria of sprayer machines in nurseries. In particular, the research aimed to investigate the use of a horizontal boom sprayer for the distribution of pesticides versus the spray gun (reference equipment) in relation to the tomato growth stage. The effects of the forward speed and of the pressure on the canopy deposit and losses to the soil, comparing the spray gun distribution with that of the horizontal boom spray, were assessed.
The experimental tests were carried out in a greenhouse vegetable nursery placed in the territory of Comiso, in the Ragusa province of Sicily (South Italy), where tomato cultivation is particularly widespread. Tomato (Solanum lycopersicum L.) is one of the most cultivated horticultural crops worldwide, with an area of 4.8 million ha and a production of 182 million tonnes in 2017. Italy is the second-largest world producer of processing tomatoes (~5 million tonnes). In the Mediterranean area, Sicily guides the production of more than 34% of the Italian total. Nevertheless, in this context, one key agricultural issue remains: to limit the negative impact of agricultural practices in greenhouses and in open-fields, and thereby increase the sustainability of these crop productions [36,37].
2. Materials and Methods
2.1. The Seedlings
The sowing was carried out on the trays at two different times: (i) vegetative stage S1, 15 days before the experimental test (Figure 1); and (ii) vegetative stage S2, 25 days before the experimental test (Figure 2). In particular, at the time of the tests, the seedlings of S1 were in the vegetative stage of completely open cotyledons—BBCH (Biologische Bundesanstalt, Bundessortenamt und CHemische Industrie) Scale 10—and those of S2 had six fully opened true leaves—BBCH Scale 16 [38].
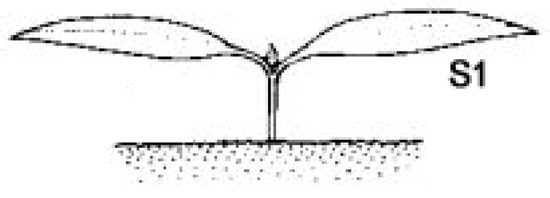
Figure 1.
First stage (S1)—leaf development (main shoot).
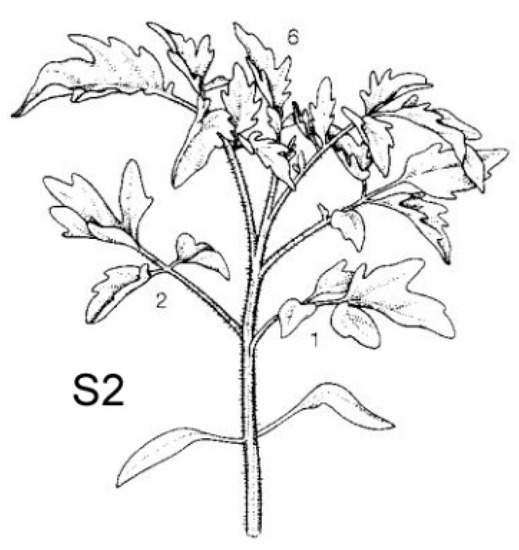
Figure 2.
Second stage (S2)—formation of side shoots/tillering.
The tests were performed on tomato seedlings (Solanum lycopersicum L. var. Hypeel) grown in polystyrene alveolar trays of 0.33 m × 0.55 m with 112 cells (8 × 14 rows), and placed on hanging benches inside a greenhouse during the spring cycle of production. The plants are suitable for cultivation on virgin or previously treated soil. They have a good rooting system and are ideal for short cultivation cycles.
2.2. The Boom Sprayer
The experiment was carried out using an 8.80 m long horizontal spray boom, which was mechanised and ran on tracks applied with brackets to the supporting frame of the greenhouse. The boom was connected, through a liquid supply pipe, to an electro-membrane pump positioned above a cart pushed by hand, which took phytoiatric mixtures from a tank placed on the same cart. The boom was equipped with two rows of 26 fan nozzles, one with larger diameter nozzles used for irrigation, and the other for possible plant treatments. A control panel allowed us to start and stop the bar, and adjust the pressure to the nozzles and the forward speed.
In particular, new fan type nozzles of the same model, 110-02 Teejet, normally used the nursery, were installed.
The distance between trays and nozzles was 0.59 m; the ground clearance was 1.47 m. The distance between the first two and the last two nozzles was about 0.15 m, while the distance between the intermediate nozzles was 0.36 m.
Given the test conditions (temperature and humidity inside the greenhouse) and the dimension of the seedlings, as well as their rapidly perishable nature, the assessment of the treatments was performed using colorimetric analysis, on the basis of the product gathered over the seedlings. Thus, a solution of 2% red food colouring E124 was used for each treatment.
2.3. Experimental Set-Up
Preliminary tests were carried out according to standardized methodology to assess the operating conditions of both the boom and the spray gun: the forward speed, pressure, flow rate at the boom, and volume per hectare. These preliminary tests allowed us to define the experimental layout and to fix the operating parameters for each Test, as reported in Table 1.

Table 1.
Test scheme.
In particular, Test 1 (T1) represents the reference test, since the pressure and forward speed parameters are those used in the nursery when the horizontal spray boom is used for plant protection. Test 2 (T2) was obtained with the same forward speed as T1 and by increasing the flow rate by 10%, from 10 to 12 L min−1. Test 3 (T3) was obtained with the same flow rate as T1 and by tripling the forward speed, from 0.14 to 0.43 m s−1. Test 4 (T4) was obtained with the same forward speed as T3 and by increasing the flow rate of T3 by 10%, from 10 to 12 L min−1. Test 5 (T5) was obtained with the parameters commonly used by experienced greenhouse growers during phytosanitary treatments with the hand-held spray gun.
Two repetitions were carried out according to the randomized block design for each test. The first four tests carried out with the horizontal boom (from T1 to T4) performed a single treatment on the benches by spraying with half the side of the boom (4.40 m length and 13 nozzles). Test 5 was carried out with the spray gun by the same worker routinely deputed to this practice according to the usual procedures adopted in manual treatments.
The trays with the seedlings were placed on a side of the hanging benches inside a greenhouse, in blocks of five tests for each vegetative stage.
Each block consisted of 66 trays—33 for vegetative stage S1 and 33 for stage S2, arranged in 6 rows of 11 trays, named A, B, C, D, E, F, G, H, I, L, M—for each test. There were 112 coeval tomato seedlings in each tray. Between each block, a free space of 5 m was left in order to reduce the effects of drift and to get the boom up to speed (Figure 3).
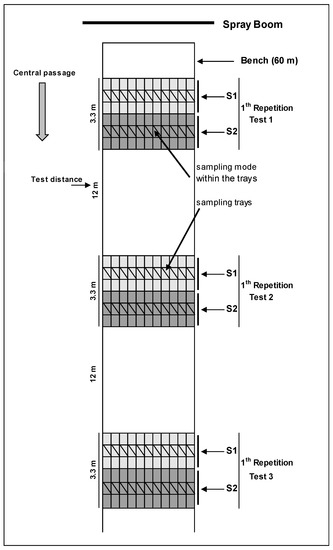
Figure 3.
The randomised block design.
To assess losses to the soil, 6 sheets (0.21 m × 0.30 m) of acetate material with a rough surface were placed below the hanging benches, at a distance of about 0.30 m from one other. Their position was identified through the assignment of numbers from 1 to 6—named Pos1, Pos2, Pos3, Pos4, Pos5 and Pos6—from the central passage to the edge of the nursery greenhouse.
During the treatments, environmental parameters were verified, such as temperature, air humidity and, since the greenhouse was without coverage, the wind speed, with a hotwire anemometer. The mean value of the temperature was 22 °C, the relative humidity was 58%, and the wind speed was 0.35 m s−1. They were measured before the first test repetition inside the greenhouse. The temperature was 26 °C, the relative humidity was 45%, and the wind speed was 0.47 m s−1 before the second test repetition.
2.4. Sampling and Analysis of Data
After each treatment, in order to calculate the surface area of the seedlings’ leaves and stems, a seedling for each tray was sampled, for a total of 220 seedlings (11 trays × 5 tests × 2 stages × 2 repetitions). The surface area was assessed by a dedicated image analysis system.
To avoid edge effects, sampling was made on the central row of the trays of each block, taking 8 seedlings within each tray both for S1 and S2.
In S1, the sampling was carried out randomly within each tray, while being managed, following the same direction as in S2 (Figure 4). This was due to the slight vegetative development of the seedlings in S1, which could not create different situations within the tray between the positions of seedlings. By contrast, the greater vegetative development could affect the amount of deposit in S2, especially for the seedlings arranged close to the edges.
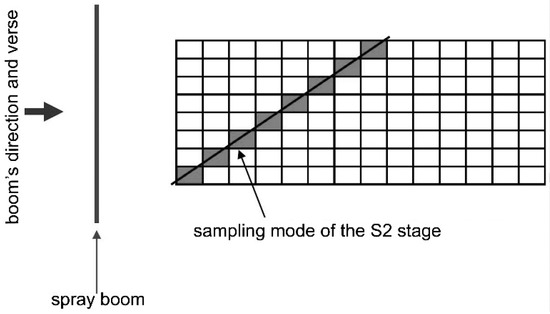
Figure 4.
Sampling mode of seedlings at S2 within the trays.
Overall, 8 seedlings × 11 trays × 5 tests × 2 repetitions × 2 stages were removed from trays, for a total of 1760 seedlings (352 for each test).
Each seedling was put into a single plastic bag and marked so as to be easily identified. All of the seedlings taken from a tray (8 in total) were then placed in another, larger plastic bag to facilitate the transport and the identification of the tray on the row. The seedlings were grouped for repetition, test and stage.
In the laboratory, the seedlings and the acetate sheets used to detect the losses to the soil were first washed with Vc = 20 mL distilled water for S1, Vc = 40 mL distilled water for S2, and Vc = 400 mL distilled water for the acetate sheets.
The wash water was decanted into test tubes for at least one week, so that the Ac spectrophotometricabsorbance and the Am absorbance of the spray solution used in the greenhouse could be read.
The deposit on each seedling, expressed per unit area in μL cm−2, was calculated according to ISO 22401, as follows:
where Vm is the spray deposit on a single seedling, expressed in μL cm−2; Ac is the absorbance value of the sample by subtracting the absorbance value of the blank; Vc is the volume of the dilution liquid (deionized water) used to extract the tracer deposit from the seedlings; Am is the absorbance value of the spray concentration applied during testing; and As is the surface area of the seedling in cm2.
Vm = (Ac × Vc) (Am × As)−1
The data were not normalised taking into account the volume applied [19], and were statistically analysed with the open source software R. The ANOVA was performed to test the main effects of the different tests. The statistically significant differences between mean values were estimated using a Tukey test [39].
3. Results and Discussion
3.1. Tomato Seedlings’ Surface Area
The mean surface area of the seedlings, which consists of leaves and stems, is shown in Table 2 for the first (S1) and the second (S2) growth stages, resulting from the image analysis processing. These areas were able to gather the coloured solution distributed during the tests.

Table 2.
Mean surface area of seedlings.
The surface area of the tomato seedlings of S1 was about 20 times lower than that of S2 because the latter were sown 12 days earlier. The difference between the growth stages of the tomato seedlings affected the test results, as shown in the following In the two test repetitions of each growth stage, the mean values of temperature and relative humidity did not affect the results of the tests, as shown by the statistical analysis—there were no statistical differences between the mean values of the two repetitions of the five tests.
3.2. Effect of the Spraying System
The results of the analysis of variance show that the effects of the stage, test (for p = 0.001) and tray (for p = 0.05) on the deposit were statistically significant (Table 3; Table 4; Figure 5, Figure 6 and Figure 7). Statistically significant differences were not recorded relating to the position of the seedlings within the trays. The latter result shows that there were no statistical differences between the deposits on tomato seedlings which were taken for sampling within the trays (Figure 4). Because the spray deposits were not significantly influenced by the position of the samples, this could mean that the sampling method was correct both for S1 and in S2. Moreover, this means that there was also a high uniformity inside each tray in terms of deposit.

Table 3.
Mean deposits (µL cm−2) at the two different growing stages.

Table 4.
Mean deposits (µL cm−2) in the five tests at the two different growth stages.
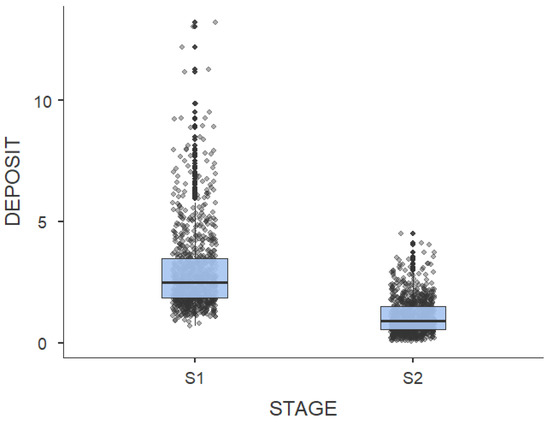
Figure 5.
Mean deposits (µl cm−2) at the two growth stages.
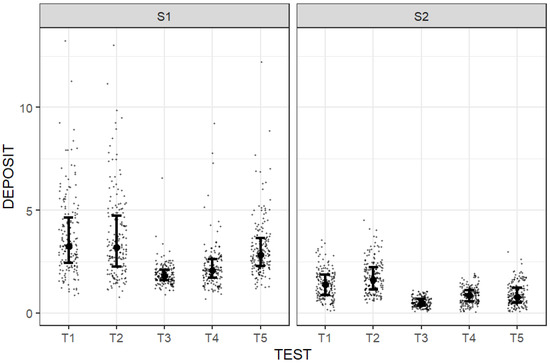
Figure 6.
Mean deposits (µL cm−2) in the different tests and the two growth stages.
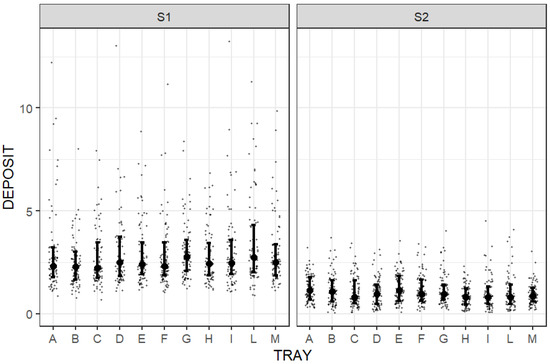
Figure 7.
Mean deposits (µL cm−2) in the two stages for the eleven different trays (A–M) on benches.
Moreover, the F-test shows that there were significant differences for p = 0.001 between stage × test, and test × tray and for p = 0.01 between stage × tray, while the other interactions were not significant. It can be pointed out that the deposit was influenced differently by the five tests in the two stages (Figure 6), and by the position of the trays on the greenhouse benches in the different tests (Figure 7).
As shown in Table 3 and Figure 5, the deposits on the seedlings in S1 were about double those in S2 because the same volumes were distributed in the two stages, and the first stage received the same product on a very small area. In fact, the collecting surface of the S1 seedlings was very limited compared to the distributed volume, thereby obtaining an increased deposit compared to that obtained with the seedlings in S2, where the surface areas were more than 20 times higher.
This result demonstrates that it is necessary to distribute the proper volume in relation to the growth stage of seedlings, and to separate trays with younger seedlings from trays with older seedlings by placing them on different greenhouse benches. However, regrettably, this is not always the case in greenhouse nurseries.
The mean values of the deposit were not far from the median values, and the standard errors were low in both growth stages. This indicates the low dispersion of deposit values.
In the greenhouse nursery under consideration, the type of spray system and the forward speed clearly influenced the deposition in both growth stages. Similar evaluations are reported by other authors [17,19,29].
By analysing the S1 data in Table 4, the low pressure difference of 1 × 10² kPa between T1 and T2, and between T3 and T4, did not produce statistically significant differences in the deposits at the same forward speed and similar volumes per hectare. Instead, the remarkably different pressure among the four tests carried out with the sprayer boom—at 3 and 4 × 10² kPa—and T5, carried out with the spray gun—at 30 × 102 kPa—show significant differences because the forward speed is also intermediate between the other two. This result demonstrates that the deposit on the seedlings is mainly due to the forward speeds used with the sprayer boom compared to that used with the spray gun. Foqué et al. [29] suggested that spray gun applications can be optimized by using a lower traveling speed (less than 0.28 m s−1). By contrast, the horizontal spray booms always resulted in a more uniform distribution, even when higher traveling speeds were used.The mean values of the deposit in T5 were smaller than those of T1 (−16%) and T2 (−14%), and higher than those of T3 (+68%) and T4 (+40%). Thus, the operating parameters of T1 used by the nurseries with the horizontal spray boom, as an alternative solution to the spray gun (T5), were demonstrated to be suitable to achieve very similar deposits. Sanchez-Hermosilla et al. [19] showed that the spray boom provides more uniform distribution over the canopy compared to the gun sprayer.
Therefore, in small plants, such as S1, by increasing of the distribution volumes, there is no increase in the deposit, due to the limited leaf area. In this case, it would seem that a lower volume favours a better deposition of the product on the young seedlings, limiting the run-off and, therefore, the losses of product into the environment.
As shown in Figure 6, the deposit was proportional to the volume distributed, even if a lower pressure could be suggested both in the tests at higher volume (T1 and T2) and lower volume (T3 and T4). Therefore, in the case of S1, the horizontal spray boom could be used at a lower pressure of 3 × 10² kPa (T1 and T3) to obtain the same deposit and, at the same time, to save product and energy. Other authors concluded that using a high spray pressure and volume often results in less favourable spray results, producing either no effect or even a negative effect on pest control [13,17,29].
As concerns the S2 data in Table 4, higher deposits on seedlings were related to a higher pressure of 4 × 10² kPa, and a higher volume per hectare (T2 and T4). This can occur because an increase in pressure is necessary at an advanced growth stage to reach all of the parts of the seedling, and to obtain a greater deposit on the canopy. It is known that crop density affects the spray deposition results [29].
Additionally, in S2, the deposit was proportional to the volume distributed, and there was a greater deposit for T2 at a higher volume (3300 L ha−1) and a lower forward speed (0.14 m s−1); this test was statically different in T1, while T3 was the lowest and most statistically different from T4. The mean values of T5 were smaller than those of T1 (−36%) and T2 (−49%), and higher than those of T3 (+75%) and T4 (+5%). Therefore, the volumes delivered with the spray gun may not be adequate to obtain comparable deposits with those obtained using the horizontal boom when seedlings are in S2.
Unlike S1, there were no statistically significant differences in S2 between the average deposition values of T4 at higher forward speeds, and those of the test with the spray gun (T5), because the volumes distributed were similar. The manual treatment with the spray gun seems, however, less effective in this second stage, as it is probably less suitable for already-developed seedlings.
These results are in line with those of Sanchez-Hermosilla et al. [19]. They showed that the deposits were greater using the vertical spray booms at lower application volumes. Moreover, there were no significant differences in the deposits found with the spray boom at 1000 L ha−1 and the reference treatment (gun at 1800 L ha−1). In our study, in spite of having reduced the volume by 21%, there were no statistical differences between mean deposits of T4 and T5.
The results in Figure 6 show a high spread, and indicate a significant variation in the measured deposit in the five tests, especially in the S1 growth stage, mainly due to the very small seedlings on which the product solution was deposited.
As regards the trays, the mean values of the deposit in the seedlings show that there are statistically significant differences between S1 and S2, as expected (Figure 7). However, there are statistically significant differences between the mean deposits of test × tray and test × stage (Figure 8).
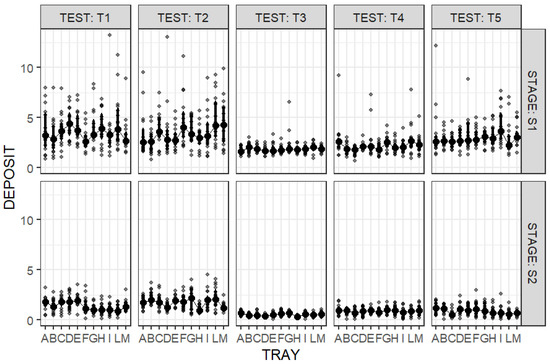
Figure 8.
Interaction between deposits (µL cm−2) of test × tray and test × stage.
On average, there are no statistical differences between the deposits in the eleven different trays; a maximum value of 2.66 µL cm−2 in the seventh tray (G) and a minimum mean value of 1.98 µL cm−2 in the tray in the second position (B) were recorded. These very small differences may be attributable to common measurement errors, and demonstrate a better uniformity of deposition with the spray boom. It is important to highlight that there are no statistically significant differences between the average values of the deposit in the seedlings of the more internal trays (A-B-C) and those more external (I-L-M) to the greenhouse, in spite of the nozzle disposition on the horizontal boom. Analysing the different tests in Figure 8, it is interesting to note that there is a less uniform deposit between the trays at high volume tests (T1 and T2), probably because the kind of nozzles used in the greenhouse nursery were not suitable for high volumes. By contrast, the most uniform deposits were recorded in the tests with higher forward speeds and lower volumes (T3 and T4).
The manual distribution with the spray gun was more uniform in S2, where the seedlings were more grown (Figure 8).
3.3. Losses to the Soil
The results of the analysis of variance show that the effects of the sheet position (p = 0.001) and test (p = 0.01) on losses were statistically significant (Figure 9; Figure 10). As expected, statistically significant differences were not recorded relating to the stage variable, because the same volumes were distributed in the two different growth stages (Table 5).
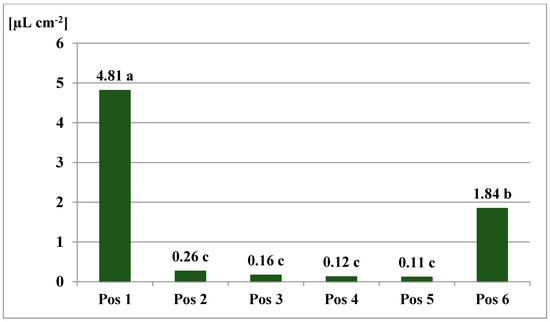
Figure 9.
Mean losses (µL cm−2) to the soil in the different positions (Pos 1–Pos 6) under the benches.
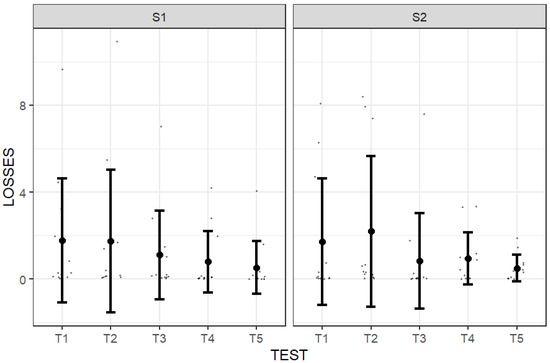
Figure 10.
Mean losses (µL cm−2) to the soil in the different tests at the two growth stages.

Table 5.
Mean losses (µL cm−2) to the soil at the two different growing stages.
In both stages, the mean ground losses seemed quite low (Table 5) because they were determined on a limited surface area of a sheet measuring 21 × 30 cm (0.063 m2). If we consider the entire length of the benches (50 m) and the width of the spray boom (4.4 m), the surface area is equal to 220 m2. By relating this surface area to the average value of the ground losses for S1 and S2, overall values of about 2.6 L and 2.7 L could be lost, respectively. There are two or more benches in each greenhouse nursery and, therefore, the value should be doubled and counted for each treatment. As is well known, in greenhouses, plant protection treatments are quite numerous throughout the year.
The mean values of the deposit were far from the median values, and the standard errors were quite high in both growth stages. This indicates a great dispersion of deposit values due to the enormous differences between the losses to the soil gathered on the different sheets (Figure 9).
With regard to the positions of the sheets under the benches, in both vegetative stages, there were significant differences between the sheets placed at the extremities (position 1) and those of the other positions (Figure 9). These results demonstrate that the outermost nozzles of the boom could not effectively address the trays, and this affects product losses. Indeed, the first two nozzles and the last two were closer (at 15 cm) compared to the others placed at a 36 cm distance.
The quantity of product collected on the sheet at position 1 (the corridor between two benches) was much higher than that found, on average, on the seedlings. This was verified for all of the tests. However, this result is not correspondent with the average values of the tray in the same position; i.e., the A or B position (see Figure 8).
It is important to highlight that, with spray gun treatments, the product losses did not prove to be greater than those recorded with the spray boom. Losses to the soil were always higher with the horizontal spray boom when comparing the effects of both forward speeds and pressures (Figure 10).
Sanchez-Hermosilla et al. [19] found similar results, in that the test performed with the spray gun at a lower volume reduced the losses to the ground, in comparison with the reference treatment (1800 L ha−1), because of reduced leaf run-off.
From the point of view of the environmental impact, the treatments with the spray gun (T5) allowed a reduction in the losses to the soil in S1. On the other hand, in the next stage, with bigger seedlings, the low volume treatments (T3) allowed a reduction in ground losses (Figure 10).
Moreover, the F-test shows that there were significant differences for p = 0.001 between test × position, while the other interactions were not significant (Figure 11). On average, these results confirm that the losses in the soil were generally lower with the treatments carried out with the spray gun, especially in the outermost position (Pos 1 and Pos 6) under the benches. Overall, the losses were proportional to the volume per hectare in the spray boom treatments.
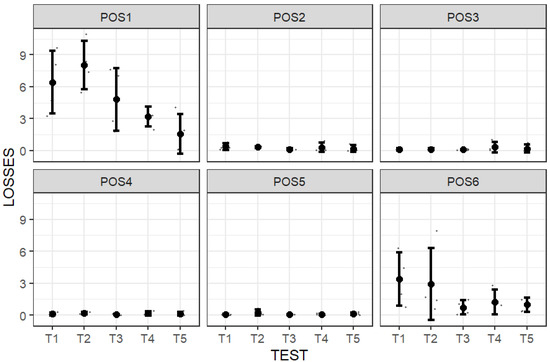
Figure 11.
Interaction between the deposits (µL cm−2) of test × position.
4. Conclusions
Experimental research was carried out in a greenhouse nursery in the South of Italy on tomato seedlings at two different growth stages, commonly treated with phytosanitary products by means of a spray gun, and sometimes by means of a horizontal spray boom. The results showed that there were differences in terms of foliar deposit and losses to the soil between the four tests carried out with the horizontal spray boom and those carried out manually with a spray gun.
The tests carried out with the spray boom at a lower pressure and forward speed, sometimes used in the nursery (T1), were the most favourable for a greater deposit in the early growth stage with smaller seedlings (S1). By comparing T1 with the test at a higher volume per hectare (T2), it might seem inappropriate to further increase the volumes, since the deposit would not increase proportionally. The test carried out with spray gun was obtained a similar deposit to T1, distributing half the volume and reducing the losses to the soil. By contrast, the spray boom has the potential to reduce the workload and increase the safety conditions for workers [29].
At a more advanced growth stage (S2) of the seedlings, the average deposit was lower with the test sometimes used by the greenhouse grower (T1), and also with the manual treatments carried out with the spray gun (T5). A greater deposit was recorded in the test with higher volumes (T2). Mostly, this could be useful to verify which is the optimal volume to obtain an effective treatment, since the literature demonstrates that higher volumes produce either no effect, or even a negative effect on pest control [29].
In spray gun treatments, product losses were not greater than those recorded with spray boom treatments. Both in S1 and S2, the losses to the soil were almost equal and, on the whole, equivalent to those found on average on the seedlings. On average, the losses were greater than 12 L on 1000 m2—the common dimensions of a greenhouse. These losses have a high environmental and economic impact, and constitute the most important factor for the adoption of a crop, as it ensures the farm’s long-term competitiveness [3].
Finally, on the one hand, the arrangement of the nozzles in the boom seems to be correct for a uniform deposit on the trays where the seedlings are placed; however, on the other hand, the losses of product under the benches were great, especially those associated with the last two nozzles of the boom. A better arrangement of the outermost nozzles would seem appropriate in order to limit the dispersion of polluting components in the environment.
The findings of these experimental tests could be a very important tool to direct growers to more appropriate spraying techniques in greenhouse nurseries for the different growth stages.
Author Contributions
Conceptualization, S.F. and E.R.; Data curation, S.F. and E.R.; Methodology, S.F. and E.R.; Writing—original draft preparation, S.F. and E.R.; Project administration, S.F. All authors have read and agreed to the published version of the manuscript.
Funding
Research project funded by the University of Catania “Mechanization in greenhouse nurseries”—2003.
Acknowledgments
The authors wish to acknowledge the Centro Seia’s nurseries in Ragusa province (Sicily, Italy) for giving hospitality to the experimental tests. The authors wish to thank Tornello G., Emma G. and Patanè L. for their helpfulness during the experimental tests and laboratory analyses.
Conflicts of Interest
The authors declare no conflict of interest.
References
- FAO. Good Agricultural Practices for Greenhouse Vegetable Crops. Principles for Mediterranean Climate Areas. 2013. Available online: http://www.fao.org/3/a-i3284e.pdf (accessed on 3 July 2020).
- ISTAT. 2019. Available online: https://www.istat.it/it/agricoltura?dati (accessed on 3 July 2020).
- Testa, R.; Trapani, A.M.; Sgroi, F.; Tudisca, S. Economic Sustainability of Italian Greenhouse Cherry Tomato. Sustainability 2014, 6, 7967–7981. [Google Scholar] [CrossRef]
- Timpanaro, G.; Urso, A.; Prato, C.; Foti, V.T. Evaluating the potential for development of vegetable nursery industry: Analysis in an important vegetable region in Italy. AJABS 2015, 10, 74–82. [Google Scholar] [CrossRef]
- Failla, S.; Tornello, G. Mechanization of vegetable sowing in nurseries. Acta Hortic. 2003, 614, 285–290. [Google Scholar] [CrossRef]
- Zappalà, L.; Manetto, G.; Tropea Garzia, G.; Emma, G.; Failla, S. Mechanical distribution of Phytoseiulus persimilis on chrysanthemum. Acta Hortic. 2012, 952, 793–800. [Google Scholar] [CrossRef]
- Pezzi, F.; Martelli, R.; Lanzoni, A.; Maini, S. Effects of mechanical distribution on survival and reproduction of Phytoseiulus persimilis and Amblyseius swirskii. Biosyst. Eng. 2015, 129, 11–19. [Google Scholar] [CrossRef]
- Lanzoni, A.; Martelli, R.; Pezzi, F. Mechanical release of Phytoseiulus persimilis and Amblyseius swirskii on protected crops. Bull Insectol. 2017, 70, 245–250. [Google Scholar]
- Martelli, R.; Lanzoni, A.; Maini, S.; Pezzi, F. Mechanical application of Orius laevigatus nymphs for the control of Frankliniella occidentalis in greenhouse crops. Bull Insectol. 2020, 73, 59–69. [Google Scholar]
- Papa, R.; Manetto, G.; Cerruto, E.; Failla, S. Mechanical distribution of beneficial arthropods in greenhouse and open field: A review. JAE 2018, 49, 81–91. [Google Scholar] [CrossRef]
- Balan, M.G.; Abi-Saab, O.J.G.; da Silva, C.G.; do Rio, A. Deposition of the spraying suspension for three spray nozzles under different meteorological conditions. Semin. Cienc. Agrar. 2008, 29, 293–298. [Google Scholar] [CrossRef][Green Version]
- Braekman, P.; Foque, D.; Messens, W.; Van Labeke, M.C.; Pieters, J.G.; Nuyttens, D. Effect of spray application technique on spray deposition in greenhouse strawberries and tomatoes. Pest Manag. Sci. 2009, 66, 203–212. [Google Scholar] [CrossRef]
- Nuyttens, D.; Braekman, P.; Windey, S.; Sonck, B. Potential dermal pesticide exposure affected by greenhouse spray application technique. Pest Manag. Sci. 2009, 65, 781–790. [Google Scholar] [CrossRef] [PubMed]
- van Zuydam, R.P.; van de Zande, J.C. Application technology, emission and safety in glasshouse spraying. Bull. OEPP 1996, 26, 95–101. [Google Scholar] [CrossRef]
- Nuyttens, D.; Windey, S.; Sonck, B. Optimisation of a vertical spray boom for greenhouse spray applications. Biosyst. Eng. 2004, 89, 417–423. [Google Scholar] [CrossRef]
- Balsari, P.; Oggero, G. Proposal of a Methodology for Functional Inspection of Sprayers Used in Greenhouse. Acta Hortic. 2008, 801, 601–608. [Google Scholar] [CrossRef]
- Braekman, P.; Foqùe, D.; van Labeke, M.C.; Pieters, J.G.; Nuyttens, D. Influence of spray application technique on spray deposition in Greenhouse Ivy pot plants grown on hanging shelves. HortScience 2009, 44, 1921–1927. [Google Scholar] [CrossRef]
- Derksen, R.C.; Engineer, A.; Krause, C.R. Comparison of Handgun and Boom Spray Delivery Systems for Greenhouses. In ASABE International Meeting; Reno, NV, USA, Paper Number: 097453; American Society of Agricultural and Biological Engineers: St. Joseph, MI, USA, 2009. [Google Scholar]
- Sánchez-Hermosilla, J.; Rincón, V.J.; Páez, F.; Agüera, F.; Carvajal, F. Field evaluation of a self-propelled sprayer and effects of the application rate on spray d eposition and losses to the ground in greenhouse tomato crops. Pest Manag. Sci. 2011, 67, 942–947. [Google Scholar] [CrossRef]
- Balsari, P.; Oggero, G.; Bozzer, C.; Marucco, P. An autonomous self-propelled sprayer for safer pesticide application in glasshouse. Asp. Appl. Biol. 2012, 114, 1–8. [Google Scholar]
- Sánchez-Hermosilla, J.; Rincón, V.J.; Páez, F.; Fernández, M. Comparative spray deposits by manually pulled trolley sprayer and a spray gun in greenhouse tomato crops. Crop Prot. 2012, 31, 119–124. [Google Scholar] [CrossRef]
- Rincón, V.J.; Paez, F.C.; Sanchez-Hermosilla, J. Potential dermal exposure to operators applying pesticide on greenhouse crops using low-cost equipment. Sci. Total Environ. 2018, 630, 1181–1187. [Google Scholar] [CrossRef]
- Rincón, V.J.; Grella, M.; Marucco, P.; Alcatrão, L.E.; Sanchez-Hermosilla, J.; Balsari, P. Spray performance assessment of a remote-controlled vehicle prototype for pesticide application in greenhouse tomato crops. Sci. Total Environ. 2020, 726, 138509. [Google Scholar] [CrossRef]
- Derksen, R.C.; Miller, S.A.; Ozkan, H.E.; Fox, R.D. Spray deposition characteristics on tomatoes and disease management as influenced by droplet size, spray volume, and air-assistance. In ASAE Annual International Meeting; Sacramento Convention Center, Sacramento, California, USA. Paper No: 01-1120; American Society of Agricultural and Biological Engineers: St. Joseph, MI, USA, 2001. [Google Scholar]
- Nuyttens, D.; Windey, S.; Sonck, B. Comparison of operator exposure for five different greenhouse spraying applications. J. Agric. Saf. Health 2004, 10, 187–195. [Google Scholar] [CrossRef] [PubMed]
- Medina, R.; Sanchez-Hermosilla, J.; Aguera, F.; Gazquez, J.C. Deposition analysis of several application volumes of pesticides adapted to the growth of a greenhouse tomato crop. Acta Hortic. 2005, 691, 179–186. [Google Scholar] [CrossRef]
- Derksen, R.C.; Frantz, J.; Ranger, C.M.; Locke, J.C.; Zhu, H.; Krause, C.R. Comparing greenhouse handgun delivery to poinsettias by spray volume and quality. Trans ASABE 2008, 51, 27–33. [Google Scholar] [CrossRef]
- Foqué, D.; Nuyttens, D. Effect of nozzle type and configuration on spray deposition in Ivy pot plants. Asp. Appl. Biol. 2010, 99, 41–47. [Google Scholar]
- Foqué, D.; Pieters, J.G.; Nuyttens, D. Spray deposition and distribution in a bay laurel crop as affected by nozzle type, air assistance and spray direction when using vertical spray booms. Crop Prot. 2012, 41, 77–87. [Google Scholar] [CrossRef]
- Sánchez-Hermosilla, J.; Paez, J.; Rincon, V.J.; Carvajal, F. Evaluation of the effect of spray pressure in hand-held sprayers in a greenhouse tomato crop. Crop Prot. 2013, 54, 121–125. [Google Scholar] [CrossRef]
- Llop, J.; Gil, E.; Llorens, J.; Gallart, M.; Balsari, P. Influence of air-assistance on spray application for tomato plants in greenhouses. Crop Prot. 2015, 78, 293–301. [Google Scholar] [CrossRef]
- Llop, J.; Gil, E.; Gallart, M.; Contador, F.; Ercilla, M. Spray distribution evaluation of different settings of a hand-held-trolley sprayer used in greenhouse tomato crops. Pest Manag. Sci. 2016, 72, 505–516. [Google Scholar] [CrossRef]
- Rincón, V.J.; Sanchez-Hermosilla, J.; Páez, F.; Pérez-Alonso, J.; Callejón, A.J. Assessment of the influence of working pressure and application rate on pesticide spray application with a hand-held spray gun on greenhouse pepper crops. Crop Prot. 2017, 96, 7–13. [Google Scholar] [CrossRef]
- Frangu, B.; Popp, J.S.; Thomsen, M.; Musliu, A. Evaluating Greenhouse Tomato and Pepper Input Efficiency Use in Kosovo. Sustainability 2018, 10, 2768. [Google Scholar] [CrossRef]
- Giuliani, M.M.; Nardella, E.; Gagliardi, A.; Gatta, G. Deficit Irrigation and Partial Root-Zone Drying Techniques in Processing Tomato Cultivated under Mediterranean Climate Conditions. Sustainability 2017, 9, 2197. [Google Scholar] [CrossRef]
- Ronga, D.; Parisi, M.; Pentangelo, A.; Mori, M.; Di Mola, I. Effects of Nitrogen Management on Biomass Production and Dry Matter Distribution of Processing Tomato Cropped in Southern Italy. Agronomy 2019, 9, 855. [Google Scholar] [CrossRef]
- Boccia, F.; Di Donato, P.; Covino, D.; Poli, A. Food waste and bio-economy: A scenario for the Italian tomato market. J. Clean. Prod. 2019, 227, 424–433. [Google Scholar] [CrossRef]
- Hack, H.; Bleiholder, H.; Buhr, L.; Meier, U.; Schnock-Fricke, U.; Weber, E.; Witzenberger, A. Einheitliche Codierung der phänologischen Entwicklungsstadien mono-und dikotyler Pflanzen—Erweiterte BBCH-Skala, Allgemein. Nachrichtenbl. Deut. Pflanzenschutzd 1992, 44, 265–270. [Google Scholar]
- R Development Core Team. R: A Language and Environment for Statistical Computing. R Foundation for Statistical Computing, Vienna, Austria. 2012. Available online: http://www.R-project.org (accessed on 5 May 2020).
© 2020 by the authors. Licensee MDPI, Basel, Switzerland. This article is an open access article distributed under the terms and conditions of the Creative Commons Attribution (CC BY) license (http://creativecommons.org/licenses/by/4.0/).