Strong Sustainability in Public Transport Policies: An e-Mobility Bus Fleet Application in Sorrento Peninsula (Italy)


Abstract
1. Introduction and Motivations
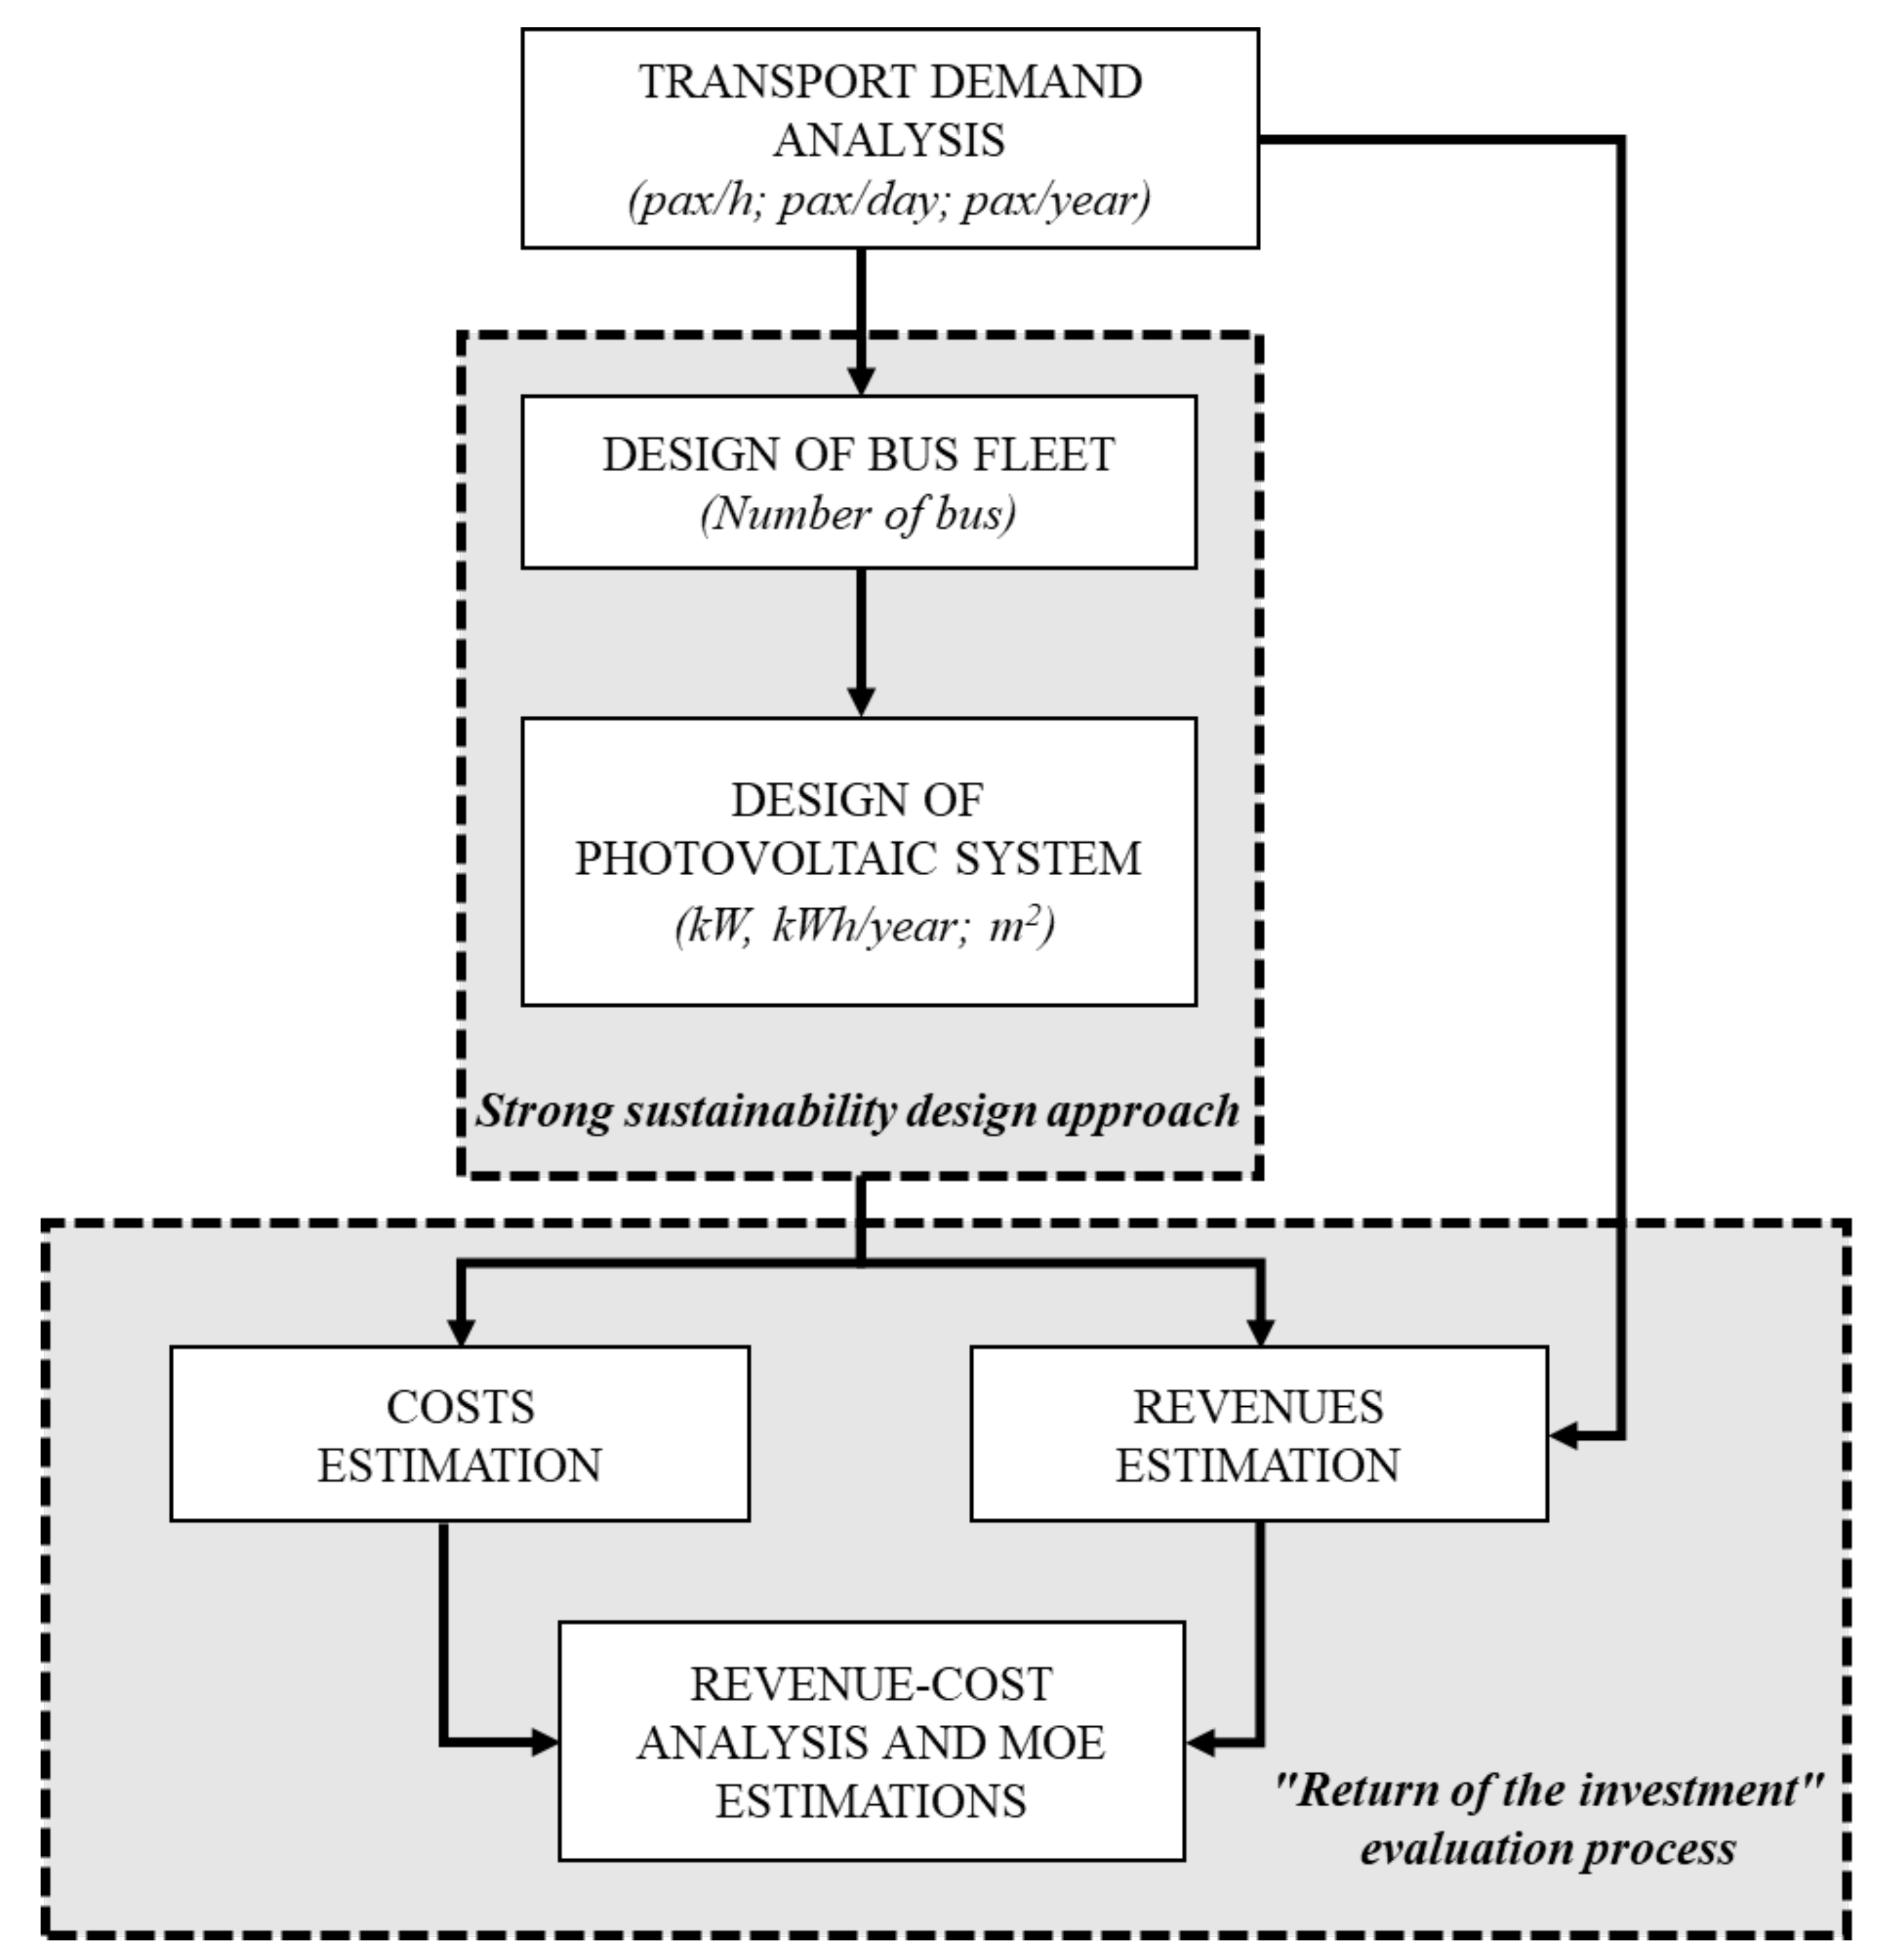
2. A “Strong Sustainability” Public Transport Design Methodology
- (a)
- transport demand analysis (estimation);
- (b)
- bus fleet design;
- (c)
- photovoltaic system design.
- -
- Cost Estimations is a variation between the design and the current scenario or the variation between two design scenarios. All costs supported during the overall time period have to be considered: investment costs, operative costs, ordinary and extraordinary maintenance costs. In plug-in hybrid buses implementation, the investment costs take into account the costs connected to the power system. This has some costs due to the Electrical Energy Storage (EES) used to store the surplus of energy due to Photovoltaic Panels [72]. As proposed by Lai et al. [72], these kinds of costs could be summarized into direct and indirect. The first one can be economically traced (e.g., investment costs due to battery, casing and electrolyte and replacement costs), the second one is represented by the “not visible” costs (e.g., operation and maintenance cost and the degradation of the battery). Furthermore, in a long-term analysis, the replacement cost due to battery packs degradation must be also considered in the estimation [75], leading to reductions in range and power output.
- -
- Revenues Estimations are two kind of revenues: those deriving from possible incentives (those deriving from possible incentives for the purchase and installation of a photovoltaic system, those based on power, energy or reliability [72] and those deriving from fuel savings) and those deriving from selling more tickets within the bus service;
- -
- MOE Indicators Estimations: Once all the impacts (revenues and costs) were quantified, the economic convenience of the project was evaluated through the estimation of some measure of effectiveness:
3. Application Discussion and Results Estimation
4. Conclusions
Author Contributions
Funding
Acknowledgments
Conflicts of Interest
References
- FAO. What Is Meant by the Term “Sustainability”? Available online: http://www.fao.org/3/ai388e/AI388E05.htm (accessed on 23 July 2020).
- World Commission on Environment and Development. Our Common Future; Oxford University Press: Oxford, UK, 1987. [Google Scholar]
- United Nations. Transforming Our World: The 2030 Agenda for Sustainable Development; Division for Sustainable Development Goals: New York, NY, USA, 2015. [Google Scholar]
- Henke, I.; Molitierno, C.; Errico, A. Decision-Making in the Transport Sector: A Sustainable Evaluation Method for Road Infrastructure. Sustainability 2020, 12, 764. [Google Scholar] [CrossRef]
- Henke, I.; Biggiero, L.; Pagliara, F. The Environmental Risks Related to Visitors’ Trips to Festivals: Transport Planning for Sustainability. In Proceedings of the 20th International Conference on Environment and Electrical Engeegnering, Madrid, Spain, 9–12 June 2020. [Google Scholar]
- Cascetta, E.; Carteni, A.; Henke, I. Stations Quality, Aesthetics and Attractiveness of Rail Transport: Empirical Evidence and Mathematical Models [Qualità Delle Stazioni, Estetica e Attrattività Del Trasporto Ferroviario: Evidenze Empiriche e Modelli Matematici]. Ing. Ferrov. 2014, 69, 307–324. [Google Scholar]
- Cascetta, E.; Carteni, A.; Henke, I. Acceptance and Equity in Advanced Path-Related Road Pricing Schemes. In Proceedings of the 2017 5th IEEE International Conference on Models and Technologies for Intelligent Transportation Systems [MT-ITS], Naples, Italy, 26–28 June 2017; pp. 492–496. [Google Scholar]
- Bagloee, S.A.; Asadi, M.; Bozic, C. A Sustainability Approach in Road Project Evaluation, Case-Study: Pollutant Emission and Accident Costs in Cost Benefit Analysis. In Sustainable Automotive Technologies 2012; Springer: Berlin/Heidelberg, Germany, 2012; pp. 295–303. [Google Scholar]
- Carteni, A.; Henke, I.; Molitierno, C.; Errico, A. Towards E-Mobility: Strengths and Weaknesses of Electric Vehicles. In Workshops of the International Conference on Advanced Information Networking and Applications; Springer: Cham, Switzerland, 2020; pp. 1383–1393. [Google Scholar]
- Westbrook, M.H.; Westbrook, M. The Electric Car: Development and Future of Battery, Hybrid and Fuel-Cell Cars; IET: London, UK, 2001. [Google Scholar]
- European Commission. A Growth Package for Integrated European Infrastructures: Communication from The Commission to The European Parliament, The Council, The European Court of Justice, The Court Of Auditors, The European Investment Bank, The European Economic and Social Committee and to the Committee of the Regions. 2011. Available online: https://eur-lex.europa.eu/legal-content/HR/TXT/?uri=CELEX:52011DC0676 (accessed on 19 May 2020).
- UNFCCC. Kyoto Protocol to the United Nations Framework Convention on Climate Change Adopted at COP3 in Kyoto, Japan, on 11 December 1997. Available online: https://www.eea.europa.eu/data-and-maps/indicators/primary-energy-consumption-by-fuel/unfccc-1997-kyoto-protocol-to (accessed on 19 May 2020).
- Maria, N.; Bjornavold, A. Electric Road Vehicles in the European Union; European Parliament: Brussels, Belgium, 2019. [Google Scholar]
- Ulrich, P.; Lehr, U. Economic Effects of an E-Mobility Scenario–Input Structure and Energy Consumption. Econ. Syst. Res. 2020, 32, 84–97. [Google Scholar] [CrossRef]
- Guarnieri, M. When Cars Went Electric, Part One [Historical]. IEEE Ind. Electron. Mag. 2011, 5, 61–62. [Google Scholar] [CrossRef]
- Yong, J.Y.; Ramachandaramurthy, V.K.; Tan, K.M.; Mithulananthan, N. A Review on the State-of-the-Art Technologies of Electric Vehicle, Its Impacts and Prospects. Renew. Sustain. Energy Rev. 2015, 49, 365–385. [Google Scholar] [CrossRef]
- Morimoto, M. Which Is the First Electric Vehicle? Electr. Eng. Jap. 2015, 192, 31–38. [Google Scholar] [CrossRef]
- Cowan, R.; Hultén, S. Escaping Lock-in: The Case of the Electric Vehicle. Technol. Forecast. Soc. Chang. 1996, 53, 61–79. [Google Scholar] [CrossRef]
- Høyer, K.G. The History of Alternative Fuels in Transportation: The Case of Electric and Hybrid Cars. Util. Policy 2008, 16, 63–71. [Google Scholar] [CrossRef]
- Walker, S.B.; Hipel, K.W.; Inohara, T. Strategic Analysis of the Kyoto Protocol. In Proceedings of the 2007 IEEE International Conference on Systems, Man and Cybernetics, Montreal, QC, Canada, 7–10 October 2007. [Google Scholar] [CrossRef]
- Longo, M.; Zaninelli, D.; Viola, F.; Romano, P.; Miceli, R. Eletric Vehicles Impact Using Renewable Energy. In Proceedings of the 2015 Tenth International Conference on Ecological Vehicles and Renewable Energies [EVER], Monte Carlo, Monaco, 31 March–2 April 2015; pp. 1–7. [Google Scholar]
- Dijk, M.; Iversen, E.; Klitkou, A.; Kemp, R.; Bolwig, S.; Borup, M.; Møllgaard, P. Forks in the Road to E-Mobility: An Evaluation of Instrument Interaction in National Policy Mixes in Northwest Europe. Energies 2020, 13, 475. [Google Scholar] [CrossRef]
- Cartenì, A.; De Guglielmo, M.L.; Henke, I. Design of Sustainable Urban Transport Infrastructures: A Real Case Application in Italy. Int. J. Civ. Eng. Technol. 2018, 9, 2131–2147. [Google Scholar]
- Cascetta, E.; Cartenì, A.; Pagliara, F.; Montanino, M. A New Look at Planning and Designing Transportation Systems: A Decision-Making Model Based on Cognitive Rationality, Stakeholder Engagement and Quantitative Methods. Transp. Policy 2015, 38, 27–39. [Google Scholar] [CrossRef]
- Carteni, A.; Henke, I. External Costs Estimation in a Cost-Benefit Analysis: The New Formia-Gaeta Tourist Railway Line in Italy. In Proceedings of the 2017 IEEE International Conference on Environment and Electrical Engineering and 2017 IEEE Industrial and Commercial Power Systems Europe [EEEIC/I&CPS Europe], Milan, Italy, 6–9 June 2017; pp. 1–6. [Google Scholar]
- Carteni, A. A Cost-Benefit Analysis Based on the Carbon Footprint Derived from Plug-in Hybrid Electric Buses for Urban Public Transport Services. WSEAS Trans. Environ. Dev. 2018, 14, 125–135. [Google Scholar]
- Carteni’, A. A Cost-Benefit Analysis of the Metro Line 1 in Naples, Italy. WSEAS Trans. Environ. Dev. 2018, 15, 529–538. [Google Scholar]
- Carteni, A.; Henke, I. The Evaluation of Public Investments According to the Cost-Benefit Analysis: An Application to the Historical Formia-Gaeta Railway Line [La Valutazione Degli Investimenti in Opere Pubbliche Attraverso l’analisi Costi-Benefici: Una Applicazione Alla Riqualificazione Della Linea Ferroviaria Formia-Gaeta]. Ing. Ferrov. 2019, 74, 651–681. [Google Scholar]
- Cartenì, A.; Henke, I.; Di Bartolomeo, M.I.; Regna, M. A Cost-Benefit Analysis of a Fully-Automated Driverless Metro Line in a High-Density Metropolitan Area in Italy. In Proceedings of the 2019 IEEE International Conference on Environment and Electrical Engineering and 2019 IEEE Industrial and Commercial Power Systems Europe [EEEIC/I&CPS Europe], Genova, Italy, 11–14 June 2019; pp. 1–6. [Google Scholar]
- Carteni, A.; Henke, I.; Mallozzi, F.; Molitierno, C. A Multi-Criteria Analysis as a Rational Evaluation Process for Building a New Highway in Italy. WIT Trans. Ecol. Environ. 2018, 217, 713–723. [Google Scholar]
- Tzeng, G.-H.; Lin, C.-W.; Opricovic, S. Multi-Criteria Analysis of Alternative-Fuel Buses for Public Transportation. Energy Policy 2005, 33, 1373–1383. [Google Scholar] [CrossRef]
- Vögele, S.; Ball, C.; Kuckshinrichs, W. Multi-Criteria Approaches to Ancillary Effects: The Example of e-Mobility. In Ancillary Benefits of Climate Policy; Springer: Cham, Switzerland, 2020; pp. 157–178. [Google Scholar]
- Wątróbski, J.; Malecki, K.; Kijewska, K.; Iwan, S.; Karczmarczyk, A.; Thompson, R.G. Multi-Criteria Analysis of Electric Vans for City Logistics. Sustainability 2017, 9, 1453. [Google Scholar] [CrossRef]
- Ernst, C.-S.; Hackbarth, A.; Madlener, R.; Lunz, B.; Sauer, D.U.; Eckstein, L. Battery Sizing for Serial Plug-in Hybrid Vehicles: A Model-Based Economic Analysis for Germany. Energy Policy 2011, 39, 5871–5882. [Google Scholar] [CrossRef]
- Van Vliet, O.; Brouwer, A.S.; Kuramochi, T.; van Den Broek, M.; Faaij, A. Energy Use, Cost and CO2 Emissions of Electric Cars. J. Power Sources 2011, 196, 2298–2310. [Google Scholar] [CrossRef]
- Plananska, J. Touchpoints for E-Mobility: Understanding the Vehicle Purchase Process to Promote EV Sales in Switzerland. In Proceedings of the TRA2020, the 8th Transport Research Arena, Helsinki, Finland, 27–30 April 2020. [Google Scholar]
- Pavić, I.; Pandžić, H.; Capuder, T. Electric Vehicle Based Smart E-Mobility System–Definition and Comparison to the Existing Concept. Appl. Energy 2020, 272, 115153. [Google Scholar] [CrossRef]
- Dang, S.; Odonde, A.; Mirza, T.; Dissanayake, C.; Burns, R. Sustainable Energy Management: An Analysis Report of the Impacts of Electric Vehicles. In Proceedings of the 2014 14th International Conference on Environment and Electrical Engineering, Krakow, Poland, 10–12 May 2014; pp. 318–322. [Google Scholar]
- Bigerna, S.; Micheli, S. Attitudes Toward Electric Vehicles: The Case of Perugia Using a Fuzzy Set Analysis. Sustainability 2018, 10, 3999. [Google Scholar] [CrossRef]
- Cartenì, A.; Cascetta, E.; de Luca, S. A Random Utility Model for Park & Carsharing Services and the Pure Preference for Electric Vehicles. Transp. Policy 2016, 48, 49–59. [Google Scholar]
- Shariff, A.; Bonnefon, J.-F.; Rahwan, I. Psychological Roadblocks to the Adoption of Self-Driving Vehicles. Nat. Hum. Behav. 2017, 1, 694–696. [Google Scholar] [CrossRef] [PubMed]
- Bonnefon, J.-F.; Shariff, A.; Rahwan, I. The Social Dilemma of Autonomous Vehicles. Science 2016, 352, 1573–1576. [Google Scholar] [CrossRef] [PubMed]
- Stasko, T.H.; Buck, A.B.; Gao, H.O. Carsharing in a University Setting: Impacts on Vehicle Ownership, Parking Demand, and Mobility in Ithaca, NY. Transp. Policy 2013, 30, 262–268. [Google Scholar] [CrossRef]
- Pinkse, J.; Dommisse, M. Overcoming Barriers to Sustainability: An Explanation of Residential Builders’ Reluctance to Adopt Clean Technologies. Bus. Strategy Environ. 2009, 18, 515–527. [Google Scholar] [CrossRef]
- Zapata, C.; Nieuwenhuis, P. Exploring Innovation in the Automotive Industry: New Technologies for Cleaner Cars. J. Clean. Prod. 2010, 18, 14–20. [Google Scholar] [CrossRef]
- Kim, D.; Ko, J.; Park, Y. Factors Affecting Electric Vehicle Sharing Program Participants’ Attitudes about Car Ownership and Program Participation. Transp. Res. Part D Transp. Environ. 2015, 36, 96–106. [Google Scholar] [CrossRef]
- Zhou, G.; Hu, W.; Huang, W. Are Consumers Willing to Pay More for Sustainable Products? A Study of Eco-Labeled Tuna Steak. Sustainability 2016, 8, 494. [Google Scholar] [CrossRef]
- Hietanen, S. Mobility as a Service: The New Transport Model; MaaS Alliance: Brussels, Belgium, 2014; pp. 2–4. [Google Scholar]
- Jittrapirom, P.; Caiati, V.; Feneri, A.-M.; Ebrahimigharehbaghi, S.; Alonso González, M.J.; Narayan, J. Mobility as a Service: A Critical Review of Definitions, Assessments of Schemes, and Key Challenges; MaaS Alliance: Brussels, Belgium, 2017. [Google Scholar]
- Mulley, C. Mobility as a Services [MaaS]—Does It Have Critical Mass? Taylor & Francis: Oxfordshire, UK, 2017. [Google Scholar]
- Goldman, T.; Gorham, R. Sustainable Urban Transport: Four Innovative Directions. Technol. Soc. 2006, 28, 261–273. [Google Scholar] [CrossRef]
- Cartenì, A. Processi Decisionali e Pianificazione Dei Trasporti; Lulu Press: Morrisville, NC, USA, 2017. [Google Scholar]
- ACEA. Vehicles in Use—Europe 2019; ACEA: Brussels, Belgium, 2019. [Google Scholar]
- ACI. Open Parco Veicoli. Available online: http://www.opv.aci.it/WEBDMCircolante/legenda.html (accessed on 14 March 2020).
- Carteni, A.; Calise, R. The Political-Administrative Genesis of Metro Line 1 in Naples [La Genesi Politico-Amministrativa Della Linea 1 Della Metropolitana Di Napoli]. Ing. Ferrov. 2019, 367, 5. [Google Scholar]
- Carteni, A. A Plug-in Hybrid Electric Bus Fleet as a Rational and Sustainable Urban Transport Policy: A Real Casa Application in Italy. Int. J. Transp. Syst. 2017, 2, 46–53. [Google Scholar]
- Kühne, R. Electric Buses–An Energy Efficient Urban Transportation Means. Energy 2010, 35, 4510–4513. [Google Scholar] [CrossRef]
- Quak, H.; Nesterova, N.; van Rooijen, T.; Dong, Y. Zero Emission City Logistics: Current Practices in Freight Electromobility and Feasibility in the near Future. Transp. Res. Procedia 2016, 14, 1506–1515. [Google Scholar] [CrossRef]
- Bakker, S.; Konings, R. The Transition to Zero-Emission Buses in Public Transport—The Need for Institutional Innovation. Transp. Res. Part D Transp.Environ. 2018, 64, 204–215. [Google Scholar] [CrossRef]
- Guida, U.; Leonard, S. ZeEUS: Zero Emission Urban Bus System. In Proceedings of the 2014 IEEE International Electric Vehicle Conference [IEVC], Florence, Italy, 17–19 December 2014; pp. 1–7. [Google Scholar]
- Erkkilä, K.; Nylund, N.-O.; Pellikka, A.-P.; Kallio, M.; Kallonen, S.; Kallio, M.; Ojamo, S.; Ruotsalainen, S.; Pietikäinen, O.; Lajunen, A. EBUS—Electric Bus Test Platform in Finland. In Proceedings of the 27th International Electric Vehicle Symposium & Exhibition (EVS27), Barcelona, Spain, 17–20 November 2013. [Google Scholar]
- Ekins, P.; Simon, S.; Deutsch, L.; Folke, C.; De Groot, R. A framework for the practical application of the concepts of critical natural capital and strong sustainability. Ecol. Econ. 2003, 44, 165–185. [Google Scholar] [CrossRef]
- Baumgärtner, S.; Quaas, M.F. Ecological-economic viability as a criterion of strong sustainability under uncertainty. Ecol. Econ. 2009, 68, 2008–2020. [Google Scholar] [CrossRef]
- Dietz, S.; Neumayer, E. Weak and strong sustainability in the SEEA: Concepts and measurement. Ecol. Econ. 2007, 61, 617–626. [Google Scholar] [CrossRef]
- Environmental Policy: 1st Edition [Hardback]—Routledge. Available online: https://www.routledge.com/Environmental-Policy-1st-Edition/Roberts/p/book/9780415362610 (accessed on 14 March 2020).
- Ghanbari-Ghajarloo, H.; Masih-Tehrani, M.; Kheybari, M. Design and Energy Optimisation of a Hybrid Flywheel Bus Rapid Transit. Int. J. Hydromechatron. 2020, 3, 88–106. [Google Scholar] [CrossRef]
- Shah, S.A.R.; Shahzad, M.; Ahmad, N.; Zamad, A.; Hussan, S.; Aslam, M.A.; Khan, A.R.; Asif, M.A.; Shahzadi, G.; Waseem, M. Performance Evaluation of Bus Rapid Transit System: A Comparative Analysis of Alternative Approaches for Energy Efficient Eco-Friendly Public Transport System. Energies 2020, 13, 1377. [Google Scholar] [CrossRef]
- Carteni, A.; Galante, G.; Henke, I. An Assessment of the Accuracy of Models in Predicting Railway Traffic Flows: A before and after Study in Naples. WIT Trans. Ecol. Environ. 2014, 191, 783–794. [Google Scholar]
- Cantarella, G.E.; Cartenì, A.; de Luca, S. Stochastic Equilibrium Assignment with Variable Demand: Theoretical and Implementation Issues. Eur. J. Oper. Res. 2015, 241, 330–347. [Google Scholar] [CrossRef]
- Carteni, A.; Pariota, L.; Henke, I. Gli Effetti Dell’alta Velocità Ferroviaria Sull’attrattività Turistica Delie Principali Città Italiane [The Effects of High Speed Rail on the Touristic Attractiveness of the Main Italian Cities]. Ing. Ferrov. 2016, 71, 229. [Google Scholar]
- Henke, I.; Cartenì, A.; Errico, A.; Cecere, M.; Francesco, L.D. Mobility Habits Surveys: A Real Case Application for University Students in Italy. Int. J. Adv. Res. Eng. Technol. 2020, 11, 321–332. [Google Scholar]
- Lai, C.S.; Locatelli, G.; Pimm, A.; Tao, Y.; Li, X.; Lai, L.L. A Financial Model for Lithium-Ion Storage in a Photovoltaic and Biogas Energy System. Appl. Energy 2019, 251, 113179. [Google Scholar] [CrossRef]
- Gordon, J.M. Optimal Sizing of Stand-Alone Photovoltaic Solar Power Systems. Sol. Cells 1987, 20, 295–313. [Google Scholar] [CrossRef]
- Tuovila, A. Financial Analysis Definition. Available online: https://www.investopedia.com/terms/f/financial-analysis.asp (accessed on 16 March 2020).
- Wang, D.; Coignard, J.; Zeng, T.; Zhang, C.; Saxena, S. Quantifying Electric Vehicle Battery Degradation from Driving vs. Vehicle-to-Grid Services. J. Power Sources 2016, 332, 193–203. [Google Scholar] [CrossRef]
- Popolazione Residente al 1° Gennaio: Campania. Available online: http://dati.istat.it/Index.aspx?QueryId=18563 (accessed on 30 June 2020).
- De Filippo, G.; Marano, V.; Sioshansi, R. Simulation of an Electric Transportation System at The Ohio State University. Appl. Energy 2014, 113, 1686–1691. [Google Scholar] [CrossRef]
- Bottazzi, A. La Gestione Della Manutenzione Delle Flotte Di Autobus Nella Forbice Tra Età Media E Politiche Di Investimento E Gestione Operativa Analisi E Possibili Soluzioni. In Proceedings of the 2014 1st Conference: Passengers Road Transport System, Sostenibilità Tecnica: Evoluzione Del Prodotto E Relativascelta Dei Contenuti Innovativi; Nuove Tecnologie Applicate Al Veicolo, Bologna, Italy, 30–31 January 2014. [Google Scholar]
- Bayindir, K.Ç.; Gözüküçük, M.A.; Teke, A. A Comprehensive Overview of Hybrid Electric Vehicle: Powertrain Configurations, Powertrain Control Techniques and Electronic Control Units. Energy Convers. Manag. 2011, 52, 1305–1313. [Google Scholar] [CrossRef]
- Pillai, R.; Brusstar, M.; Boehman, A.; Ludlam, S. Evaluating the Performance of a Conventional and Hybrid Bus Operating on Diesel and B20 Fuel for Emissions and Fuel Economy; SAE Technical Paper; SAE International: Warrendale, PA, USA, 2020. [Google Scholar]
- Hannan, M.A.; Azidin, F.A.; Mohamed, A. Hybrid Electric Vehicles and Their Challenges: A Review. Renew. Sustain. Energy Rev. 2014, 29, 135–150. [Google Scholar] [CrossRef]
- Mahmoud, M.; Garnett, R.; Ferguson, M.; Kanaroglou, P. Electric Buses: A Review of Alternative Powertrains. Renew. Sustain. Energy Rev. 2016, 62, 673–684. [Google Scholar] [CrossRef]
- Ranganathan, S. Hybrid Buses Costs and Benefits; Environmental and Energy Study Institute: Washington, DC, USA, 2012. [Google Scholar]
- Pannelli Fotovoltaici Prezzi. Available online: https://www.pannellifotovoltaiciprezzi.org/ (accessed on 17 March 2020).
- Regolamento delegato [UE] n. 480/2014 della Commissione, del 3 marzo 2014, che integra il regolamento [UE] n. 1303/2013 del Parlamento europeo e del Consiglio recante disposizioni comuni sul Fondo europeo di sviluppo regionale, sul Fondo sociale europeo, sul Fondo di coesione, sul Fondo europeo agricolo per lo sviluppo rurale e sul Fondo europeo per gli affari marittimi e la pesca e disposizioni generali sul Fondo europeo di sviluppo regionale, sul Fondo sociale europeo, sul Fondo di coesione e sul Fondo europeo per gli affari marittimi e la pesca. Gazzetta Ufficiale dell’Unione Europea 2014, 138, 5–44. [Google Scholar]
- Topal, O.; Nakir, İ. Total Cost of Ownership Based Economic Analysis of Diesel, CNG and Electric Bus Concepts for the Public Transport in Istanbul City. Energies 2018, 11, 2369. [Google Scholar] [CrossRef]
- Agaton, C.B.; Guno, C.S.; Villanueva, R.O.; Villanueva, R.O. Diesel or Electric Jeepney? A Case Study of Transport Investment in the Philippines Using the Real Options Approach. World Electr. Veh. J. 2019, 10, 51. [Google Scholar] [CrossRef]
- Moon, S.; Lee, D.-J. An Optimal Electric Vehicle Investment Model for Consumers Using Total Cost of Ownership: A Real Option Approach. Appl. Energy 2019, 253, 113494. [Google Scholar] [CrossRef]
- Carpenter, T.; Curtis, A.R.; Keshav, S. The Return on Investment for Taxi Companies Transitioning to Electric Vehicles. Transportation 2014, 41, 785–818. [Google Scholar] [CrossRef]
- Agaton, C.B.; Collera, A.A.; Guno, C.S. Socio-Economic and Environmental Analyses of Sustainable Public Transport in the Philippines. Sustainability 2020, 12, 4720. [Google Scholar] [CrossRef]
- Laizāns, A.; Graurs, I.; Rubenis, A.; Utehin, G. Economic Viability of Electric Public Busses: Regional Perspective. Procedia Eng. 2016, 134, 316–321. [Google Scholar] [CrossRef]


| Commercial Speed [km/h] | 22.0 | |
| C | Length of the line [km] | 12.8 |
| Number of stops | 5.0 | |
| Waiting time between two successive departures [min] | 30.0 | |
| Frequency [routes/h] | 2.0 | |
| Lap time [h] | 1.2 | |
| km | Km/day per bus | 171.0 |
| Number of bus [num] | 3 | |
| Average operation days per year [num] | 300 | |
| Energy of the bus battery [kWh] | 19 | |
| Recharge energy [kWh] | 17,100 | |
| Average annual energy produced by photovoltaic [kWh/kW] | 1500 | |
| Energy produced in one year by the photovoltaic system [kWh/year] | 17,100 | |
| Filling factor | 2 | |
| Surface occupied by 1 kWp [m2/kWp] | 7.2 |
| Hybrid-Diesel Bus Fleet Scenario vs. Traditional Scenario | TOE/year | Ton of CO2 eq./year |
|---|---|---|
| Δ variation | −36 | −33 |
| % variation | −58% | −23% |
| The MOE Indicators Estimated | |
|---|---|
| Revenue/Cost (€) | 1.33 |
| discount rate | 4.0% |
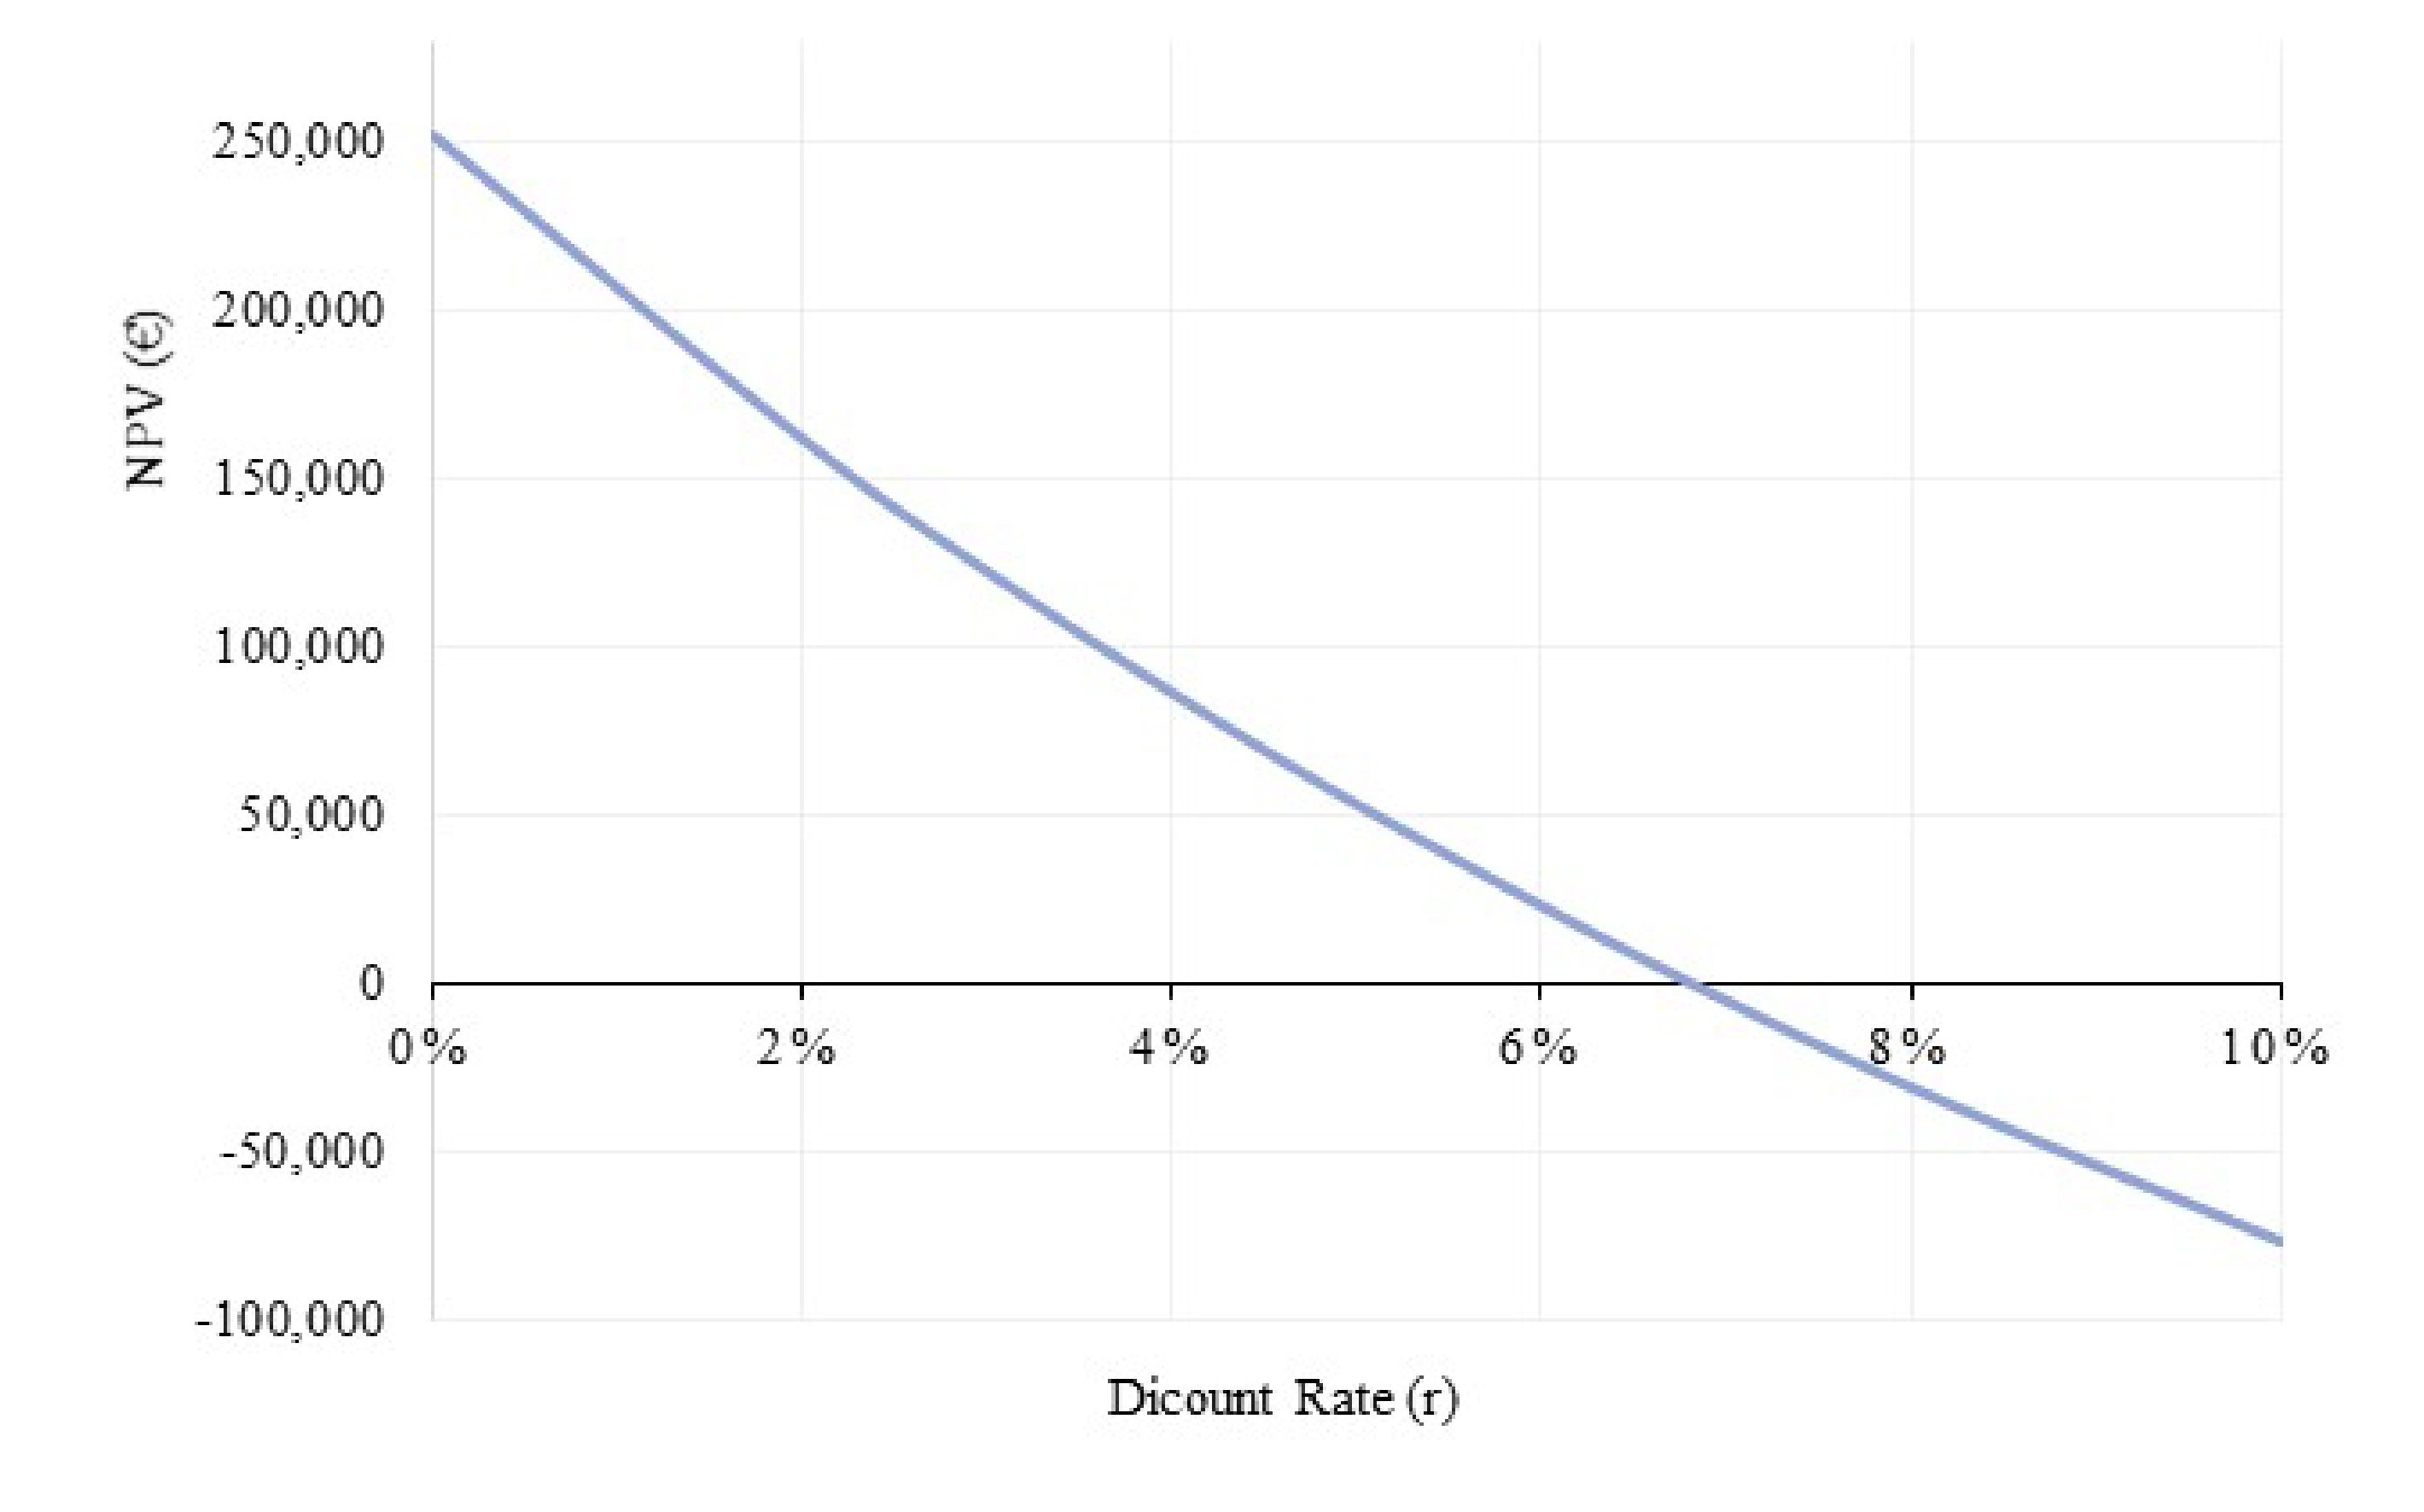
| NPV (€) (12 years) | 86,450 |
| IRR | 6.9% |
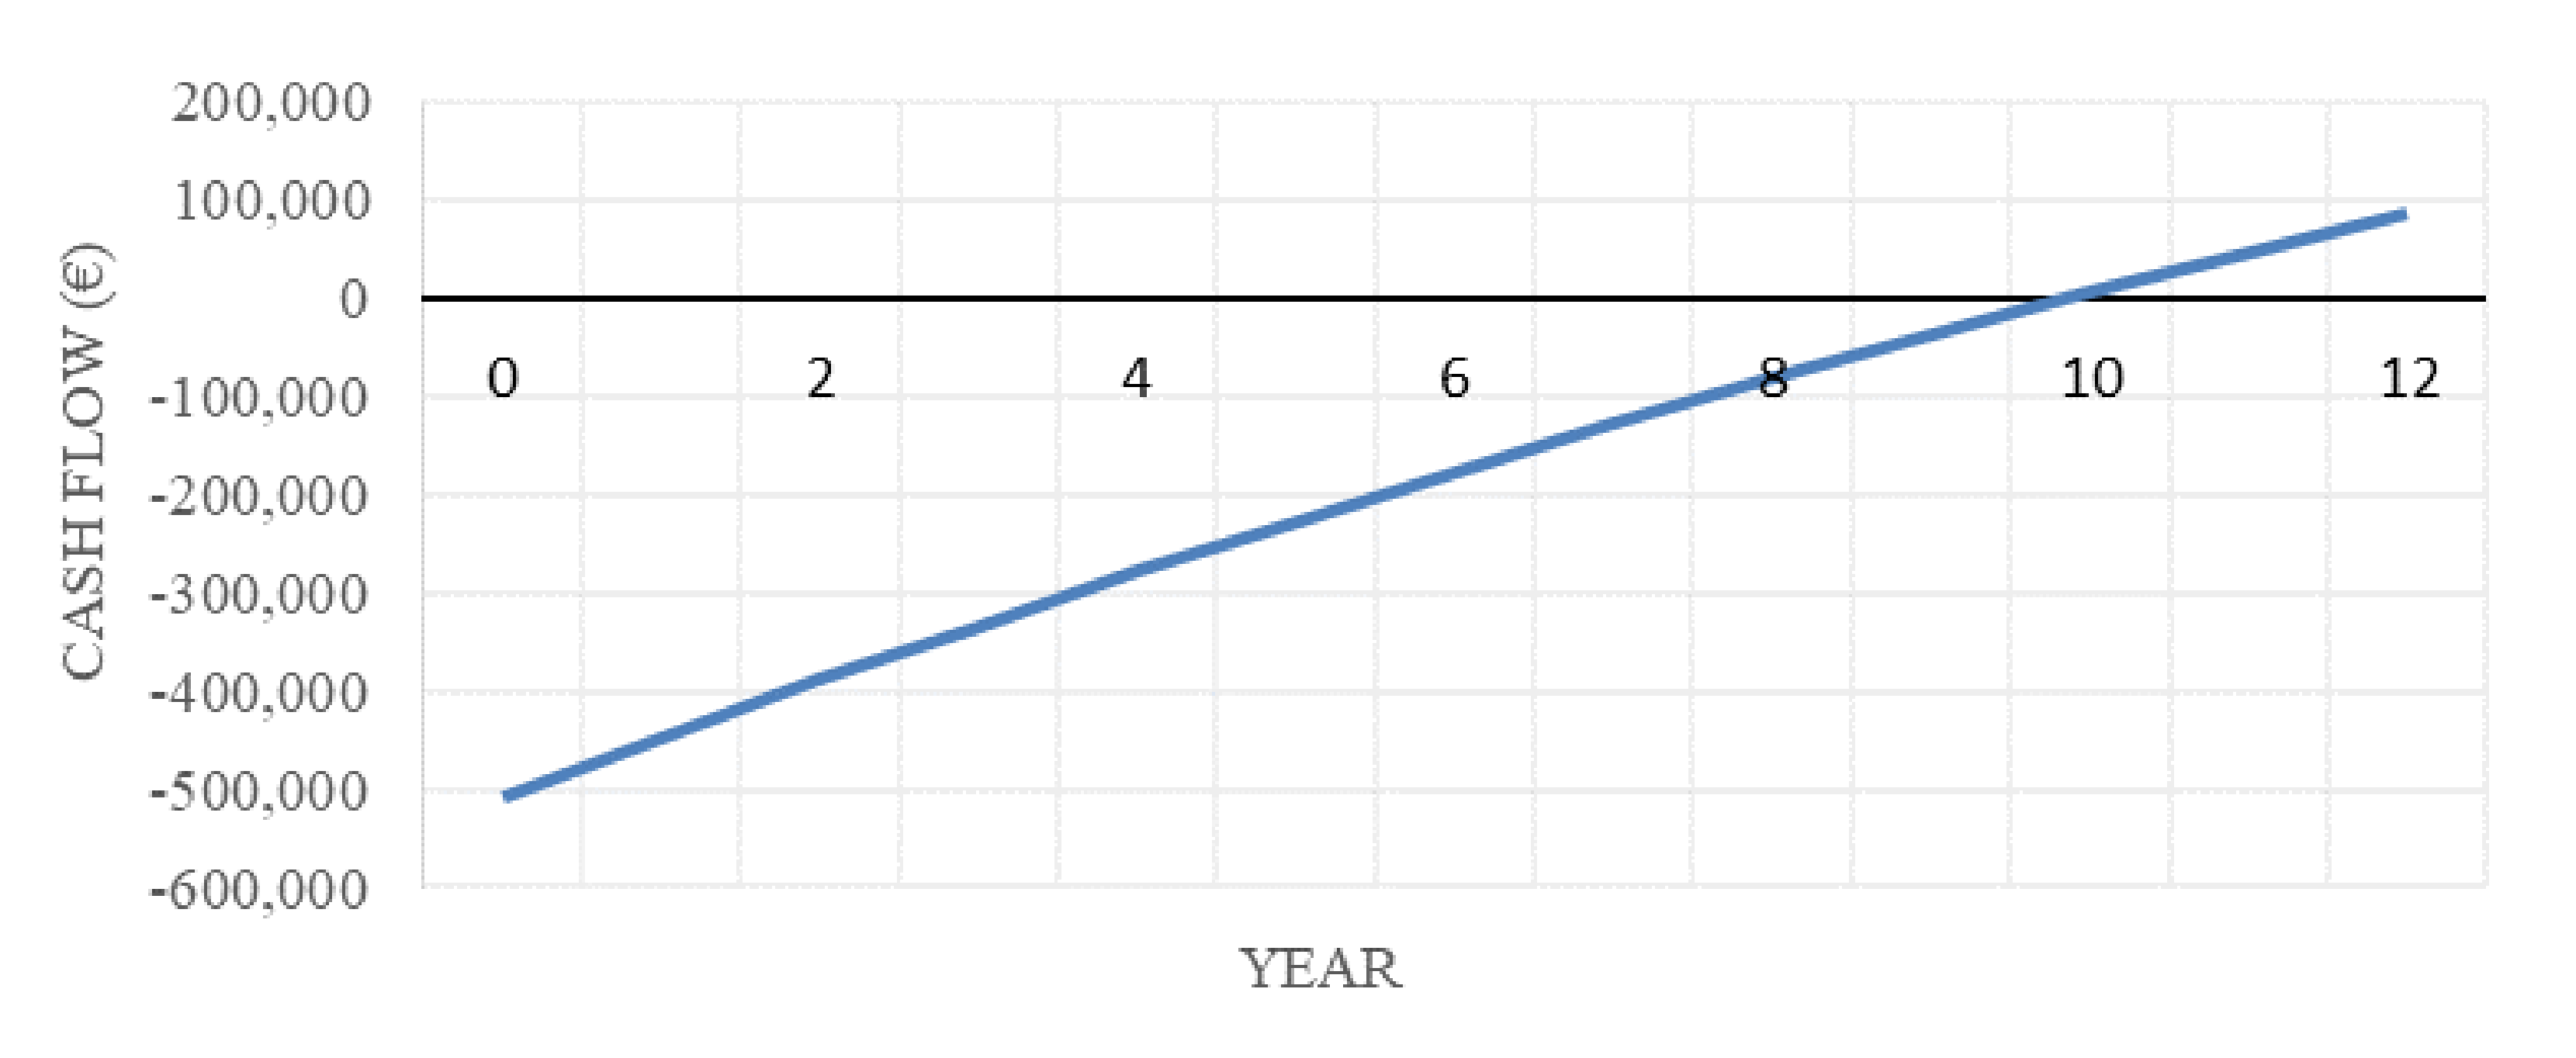
| Pay-back period (years) | 10 |
| NPV | Payback Period | IRR | ||
| Incentives Variation [%] | −50% | 76,683 | 11 | 6.9% |
| −30% | 80,590 | 10 | 6.6% | |
| −10% | 84,496 | 10 | 6.7% | |
| Costs Variation [%] | 15% | −8394 | 13 | 3.8% |
| 10% | 23,221 | 11 | 4.7% | |
| 5% | 54,835 | 11 | 5.7% |
© 2020 by the authors. Licensee MDPI, Basel, Switzerland. This article is an open access article distributed under the terms and conditions of the Creative Commons Attribution (CC BY) license (http://creativecommons.org/licenses/by/4.0/).
Share and Cite
Cartenì, A.; Henke, I.; Molitierno, C.; Di Francesco, L. Strong Sustainability in Public Transport Policies: An e-Mobility Bus Fleet Application in Sorrento Peninsula (Italy). Sustainability 2020, 12, 7033. https://doi.org/10.3390/su12177033
Cartenì A, Henke I, Molitierno C, Di Francesco L. Strong Sustainability in Public Transport Policies: An e-Mobility Bus Fleet Application in Sorrento Peninsula (Italy). Sustainability. 2020; 12(17):7033. https://doi.org/10.3390/su12177033
Chicago/Turabian StyleCartenì, Armando, Ilaria Henke, Clorinda Molitierno, and Luigi Di Francesco. 2020. "Strong Sustainability in Public Transport Policies: An e-Mobility Bus Fleet Application in Sorrento Peninsula (Italy)" Sustainability 12, no. 17: 7033. https://doi.org/10.3390/su12177033
APA StyleCartenì, A., Henke, I., Molitierno, C., & Di Francesco, L. (2020). Strong Sustainability in Public Transport Policies: An e-Mobility Bus Fleet Application in Sorrento Peninsula (Italy). Sustainability, 12(17), 7033. https://doi.org/10.3390/su12177033