Article

“SeoulHouse2Vec”: An Embedding-Based Collaborative Filtering Housing Recommender System for Analyzing Housing Preference

1
School of Architecture, Hanyang University, Seoul 04763, Korea
2
Garam Architects & Associates Research and Development Center, Seoul 06037, Korea
*
Author to whom correspondence should be addressed.
Sustainability 2020, 12(17), 6964; https://doi.org/10.3390/su12176964
Submission received: 29 June 2020 / Revised: 3 August 2020 / Accepted: 4 August 2020 / Published: 26 August 2020

Abstract

:
Housing preference is the subjective and relative preference of users toward housing alternatives and studies in the field have been conducted to analyze the housing preferences of groups with sharing the same socio-demographic attributes. However, previous studies may not suggest the preference of individuals. In this regard, this study proposes “SeoulHouse2Vec,” an embedding-based collaborative filtering housing recommendation system for analyzing atypical and nonlinear housing preference of individuals. The model maps users and items in each dense vector space which are called embedding layers. This model may reflect trade-offs between the alternatives and recommend unexpected housing items and thus improve rational housing decision-making. The model expanded the search scope of housing alternatives to the entire city of Seoul utilizing public big data and GIS data. The preferences derived from the results can be used by suppliers, individual investors, and policymakers. Especially for architects, the architectural planning and design process will reflect users’ perspective and preferences, and provide quantitative data in the housing decision-making process for urban planning and administrative units.

1. Introduction

Seoul is the capital of South Korea, with a population of approximately 9.7 million people [1]. Of the 605.24 square kilometers of land in Seoul, 53.8% is designated as residential areas. Furthermore, based on household—Korea’s unit of housing—about 2,866,000 houses have been supplied, a housing supply rate of 96.3% [2]. Housing affects occupants’ health, wealth, and lifestyle as it provides the necessary built indoor environment in which they live for an extended period. In addition, housing-related costs including the purchase and lease of housing account for a significant portion of household spending [3]. From a social viewpoint, housing helps form and maintain relationships with occupants’ families, friends, and communities, thus impacting their well-being [4,5,6,7].
Housing decision-making is a process in which users explore and evaluate housing choices by considering housing attributes including tenure, type, size, orientation, location, etc. [8,9]. Through this process, users form subjective preferences for certain housing alternatives [10,11,12]. Housing choice is expressed in actual behavior regarding the housing unit, and housing preference is the relative preference for housing alternatives [13,14]. Based on their economic and social contexts, users form housing expectations and preferences in the process of housing decision-making [15]. While housing choice is significantly affected by users’ housing preferences, it may differ from these because of real-world constraints such as the market price of housing and government regulations. The resulting choice, as revealed in actual behavior, is termed revealed preference, and the user’s original preference is the stated preference [10]. Even with the fact that the stated preference may be different from the revealed preferences, the studies have been conducted in a way to suggest factors that affect the preference and to provide rational basis in the process of housing choice. The studies were also meaningful in that from the perspective of architects, construction companies, and the government, who are the suppliers of housing, the decision-making process related to housing planning and design in architecture and urban scale can be carried out under more reasonable and less risky conditions. An increasing number of studies have been conducted alongside the increasing importance of reflecting users’ perspective in the planning and design phases [16,17,18,19,20,21].
In recent studies according to housing preference, Hoshino [22] dealt with 10 housing attributes with details of residences and location such as building age, building class, transportation, and land use; then, Mulliner (2018) addressed three categories of attributes which are extrinsic factors (quality, age of building, lot size, etc.), intrinsic factors (e.g., heating, ventilation, and air conditioning and insulation), and location and environment (neighborhood safety, cleanliness, etc.) [23]. Additionally, Jancz (2020) addressed eight housing attributes related to users’ lifestyle such as social factors, building type, environment, communication, neighbors [24], and Wang et al. [25] also addressed five categories of attributes including product, price, place, promotion, people using fuzzy analytic hierarchy process.
A recent study quantitatively derived variables that affect respondents’ housing preference. The study suggested the correlation between socio-demographic attributes of the respondents—age, income, values, etc.—and the housing preference variables using statistical techniques. This calculates the relative importance of housing preference variables for groups that share specific demographic attributes [22,26,27]. Furthermore, studies have derived housing preference variables, elicited and quantitatively measured them, and analyzed the process in which these preferences are formed for a particular group. However, these studies were limited in terms of analyzing the housing preferences of individual users, as the unit of analysis was groups that share particular socio-demographic attributes. Thus, they could not explain the preferences of users who belong to that group but have different preferences.
Therefore, a recommendation system that analyzes user data, such as purchase history, viewing records, and ratings to derive unstructured preferences and select and present items that users might prefer, is now gaining attention [28,29].
Among the methods of implementing the recommendation system, collaborative filtering technology has recently demonstrated high accuracy. It measures the similarity between items or users based on data on the user’s rating of the item. Based on the assumption that users with similar preferences for certain items would have similar affinity responses for other items, it presents users with items they might prefer [30]. The method of measuring similarity in the recommendation system uses machine learning-based methods such as K-nearest neighbors and naive Bayes classifiers, although studies have been conducted that utilize embedding technology. Embedding technology is a technique for mapping individual items to n-dimensional vector space, and the more similar the meaning or attributes of individual items in the mapping process, the closer the geometric distance between them [31]. In the recommendation system, item-to-item or user-to-user similarity can be expressed as numeric vector distances, which are called item embedding and user embedding [32]. In the recommendation process, if a particular user prefers a particular item, the recommendation will be made sequentially by presenting items located in a close distance. An earlier study contended that the embedding-based recommender had a higher accuracy and faster learning speed than other implementation methods, and other research showed that it could visually present similarities between items or users [33,34].
The purpose of this study was to build an embedding-based collaborative filtering recommender called “SeoulHouse2Vec.” The model works by mapping users and items to each low-dimensional dense vector space based on user-item rating information obtained through a survey. For this purpose, a housing preference survey was conducted, the results of which were used to build a dataset consisting of rating information on multiple housing profiles of individual respondents. Recommended housing alternatives are presented to users using geographic information system (GIS) and data visualization technology. While previous housing preference studies were conducted by calculating the relative importance of variables and variables affecting the housing preferences of groups with the same demographic and sociological attributes, the analysis unit of this study was the individual, which is a smaller unit. Through this, the study presents one way to support users’ search for housing alternatives and their housing decision-making process.

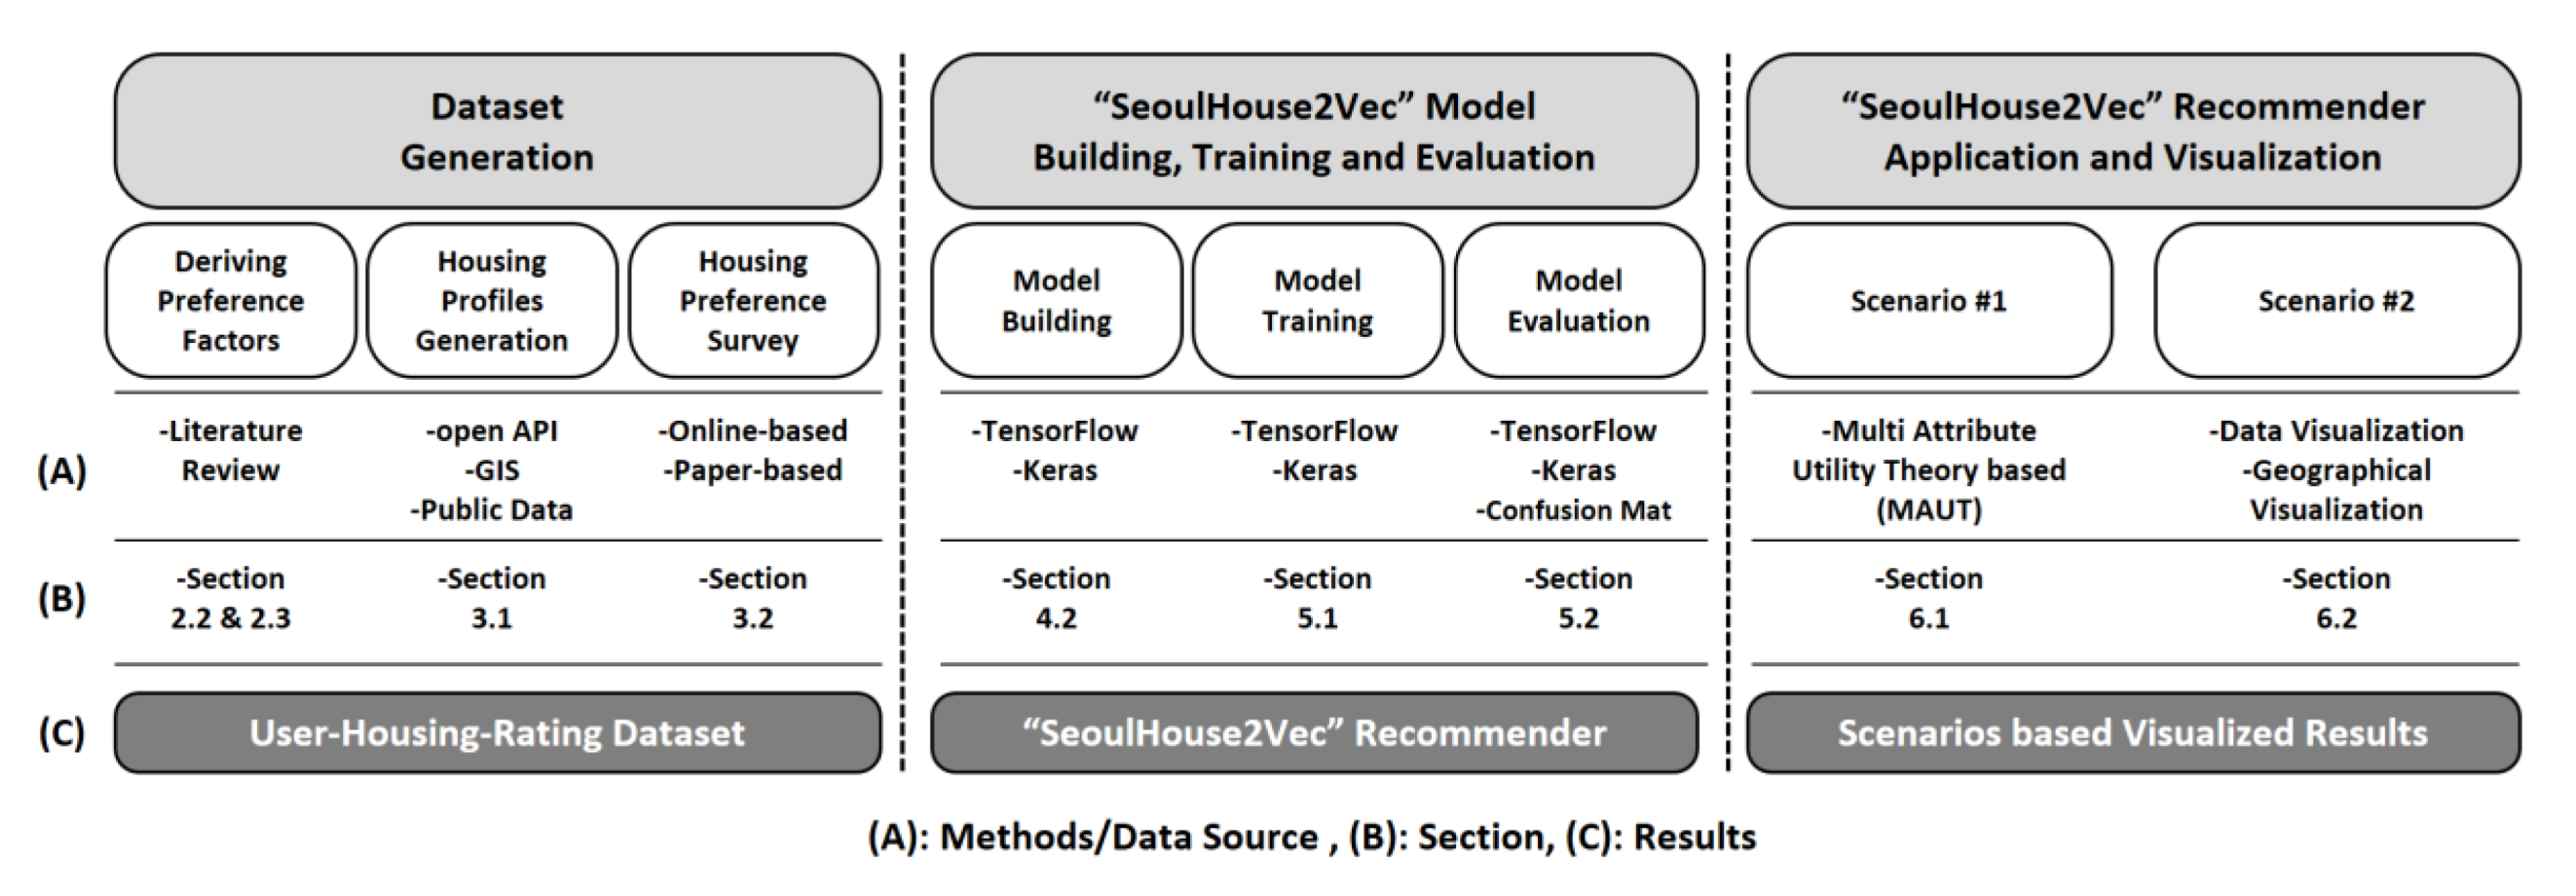
Research Materials, Methods, and Structure of the Paper

The paper is organized as follows: Section 2 highlights theoretical considerations regarding the housing preference and the embedding-based collaborative filtering recommendation system. As explained, housing preference variables that affect the housing decision-making process in Korea were derived from an analysis of existing research. In Section 3, public data based on the housing preference variables derived from the preceding step are used to create housing profiles subject to survey respondents’ preference. Respondents rated their preferences for the housing profiles in the survey. In the process of creating the profiles, “Seoul Metropolitan Government Housing Status (housing type, occupancy type, etc.) Statistics” [35], “Seoul Metropolitan Apartment Information” [36], and GIS location information data were used. Section 4 describes user-item rating datasets acquired through the survey and, using Google TensorFlow and Keras, builds the “SeoulHouse2Vec” recommendation system. In Section 5, the dataset acquired in the previous step is split into training, validation, and evaluation sets. The split datasets were used to the corresponding process, respectively. In the model training, a supervised-learning method was used. After that, the model validating in which the model parameters are tuned for better performance is conducted. The final performance is then measured using performance metrics, which are precision, recall, and f1_score. To measure the metrics, a confusion matrix, which is a commonly used method in the algorithm evaluation, is created. This study uses Python 3.6, Google TensorFlow, and the Keras library to build the model in Section 4. In Section 5, the built model is trained, validated, and evaluated. The development environment is set to JetBrains Pycharm Community Edition 2019.1.2. The hardware environment is “Intel i9-9900k” CPU, 16 GB RAM, and “NVIDIA GeForce RTX 2060,” with Windows 10. In Section 6, scenario-based demonstration of the built model is suggested in order to provide a possible application of the model in terms of analyzing housing preference and supporting housing decision-making.
Figure 1 presents the research overview, which comprises three parts: Dataset generation, “SeoulHouse2Vec” model building & training & evaluation, and model application & visualization.

2. Literature Review

2.1. Embedding-Based Collaborative Filtering Recommender System

The recommendation system filters preference information and supports their information search process. Its value has recently drawn interest because it can help users when considering increasing volumes and types of information [28,37]. Methods for running the recommendation system include the bestseller presentation method, which presents items with a large number of views over a specific period, and content-based process, which manually extracts and analyzes the attributes of an object. Recently, studies have confirmed the relatively high accuracy of a technology called collaborative filtering [38,39,40].
The premise of collaborative filtering is that groups of users with similar preferences for specific information will have similar responses to other details. Unlike the content-based method, where recommendations are based on the extracted internal attributes of items, the collaborative filtering method utilizes rating information, which is the preference information obtained from multiple users’ evaluation of multiple items. The significance of the collaborative filtering method is its “collaboration,” as it uses users’ ratings to recommend items to a specific user [28,41,42].
Among the various methods of implementing the collaborative filtering-based recommender, embedding-based methods have attracted attention for their accuracy and efficiency [33,34,43]. For Guo and Berkhahn [44], embedding is a technology that represents non-continuous data in the sparse vector format as continuous data in the dense vector format. Embedding technology derives the intrinsic properties of data by continuously providing the right representation thereof and supporting the learning process of machine learning and deep learning models. Guo and Berkhahn [44] showed that when input data are embedded in the right way, terming it “entity embedding,” the training speed of the artificial neural network model increases, and decreases overfitting. The data are finally placed in Euclidean space in a way that minimizes errors in the neural networks model [45].
Embedding technology has most recently been used in the field of natural language processing, a technology that allows computers to understand the natural language in a process called word embedding. In word embedding, natural language tokens (minimum unit of the data) are expressed in a dense vector consisting of floating-point values [46,47]. As the training iterations of word embedding and natural language processing model are repeated, the more similar the semantic meanings of the natural language input units, the closer those are mapped in the embedding space. The semantic relations of the natural language are thus expressed in a format the computer can execute, which is called distributed representations of words.
In the embedding-based collaborative filtering recommendation system, the natural language tokens, which are subject to similarity calculation in the word embedding technology, are cast as individual users and items [48]. Prior research on the embedding-based collaborative filtering recommender include studies [31] on building the embedded technology-based music recommendation system “ITEM2VEC”; a personalized e-mail advertising system called “prod2vec,” which is based on user purchase records [49]; “prefs2vec,” which is based on users’ item preference [43]; and a system based on users’ visit record (“the check-ins”), which recommends places users might like to visit [33].
Various studies suggested that an embedding-based recommender makes it easier for users to intuitively and visually identify similarity than other implementation methods. Furthermore, its simple model construction and higher learning efficiency are highlighted.
This study aims to build a recommendation system using embedding-based methods to provide the housing profiles users might prefer, and to visually suggest similarities between the users and the housing alternatives.

2.2. Housing Preference

Housing preference is the users’ subjective evaluation toward housing. It refers to the users’ requirements, expectations, and emphasis on the characteristics of various housing.
Studies related to housing preference analyze the housing preferences and design requirements of specific groups that share socio-demographic attributes including age, gender, income level, current values, etc. to provide one possibility to improve design quality and increase occupants’ satisfaction [24]. The studies have provided basis to guide future design decision-making for architects and enable a quantitative comparison and evaluation methods between housing alternatives when choosing housing for potential users and occupants.
Opoku and Abdul-Muhmin [26] analyzed the correlation between socio-demographic attributes—gender, marital status, income, family situation, etc.—in Saudi Arabia’s low-income class, and multiple kinds of housing factors including dwelling type and tenure options. Contending that the preference is heterogeneous, Hoshino [22] created housing profiles by deriving housing attributes and levels, and analyzed user preferences through a conjoint analysis method. Jansen et al. [10] studied a housing selection scenario for couples, presented multiple dwelling profiles on the basis of housing attribute levels (dwelling type, costs, size living room, number of rooms, backyard size, architectural style, and residential environment), and used the multi-attribute utility method to analyze housing preference and calculate the utility value, which can be used to recommend and analyze the choices. They also presented a unit consisting of the preferred factors of a group with specific socio-economic attributes.
Together, previous studies identified factors that affect housing preferences, designed questionnaires, and measured the correlations between respondents’ social, economic, and demographic attributes and other factors. However, these studies were limited in terms of analyzing individuals who share common demographic attributes but have different preferences, or conversely those with dissimilar demographic attributes but the alike preferences. While providing one possibility for quantitatively assessing the alternatives by weighting factors, they are limited in giving trade-off or unexpected alternatives for various attributes, despite that users’ preferences for the options are heterogeneous and nonlinear.
Thus, this study derived housing preference variables from prior studies and used them to quantitatively induce users’ preference for housing alternatives. The collaborative filtering-based recommendation system was then used to analyze the preferences. Through this process, a recommendation system was created that can present divergent housing alternatives users may prefer.

2.3. Important Housing Attributes for Housing Preference in South Korea

Although research on housing preferences is actively conducted in various countries, the scope of this analysis was limited to papers published between 2009 and 2020 in Korea because of differences in housing preference variables by region and age.
The studies by Jeong and Choi [6] and Kim and Seo [50] are considered significant. They studied the housing choices and preferences of the eco-generation and baby boomers, deriving variables specific to these generations. Jeong and Choi [6] identified the local status of housing demand/development potential, educational environment, location factors related to public institutions/facilities, and green areas and rest areas as essential factors the eco-generation considered when choosing homes. Kim and Seo [50] identified the variables of housing preferences as social, local, and personal factors affected by friendliness toward the elderly; physical factors including housing styles and size; and economic factors including housing prices, rent, and housing costs.
Lee and Kim [7] and Lee, et al. [51] studied, quantified, and determined the importance of residential environment preferences through a conjoint analysis. However, their studies were limited in that the survey was conducted as a hypothetical alternative that arbitrarily manipulated residential variables. Thus, they were not able to use actual residential options. As Table 1 shows, Lee and Kim [7] examined the impact of apartment environmental attributes on consumer preferences by employing the variables of apartment prices, house interior factors of scale, investment value of brand awareness, view, and park accessibility. Lee, et al. [51] employed the extant literature and criteria for calculating the initial sale rate of apartments provided by the Korea Housing & Urban Guarantee Corporation to identify the variables impacting housing preference, as shown in Table 1. The variables for housing preference were housing characteristics and price per 3.3 square meter including of the interior, characteristics of the complex, convenience of transportation, location in the city center, environmentally friendly location, location in a good school district, potential for regional development, and investment value.
To identify housing preference variables according to lifestyle, Son and Lee [52] delineated apartment complexes and indoor requirements by considering the actual living space and experience rather than location of housing from a macro perspective.
To analyze housing satisfaction and preference, Kim et al. [53] examined changes in preference according to the type of housing, type of occupancy, and size of housing in Gyeonggi Province; identified factors to consider in housing policies; and explained differences in housing demand by region. The variables were housing location factors including the convenience of public transportation, neighborhood facilities, cultural performance facilities, accessibility to major facilities, and children’s educational environment. The internal factors included size and management expenses, and environment factors included green areas and nearby parks as well as investment value.
Lee and Kim [7], Kim and Seo [50], and Lee, et al. [51] quantitatively measured preference by demonstrating the correlation between housing attributes and housing preference, as well as between respondents who share specific socio-demographic characteristics such as age (generation), gender, type of residence, type of housing tenure, and income. The outcome of these studies was models showing how much a particular group values a specific factor. However, they did not offer a real housing alternative or housing suggestions because they do not reflect atypical preferences.
Thus, the present study used a real housing profile to analyze accumulated housing preference data. Furthermore, it recommends unexpected housing alternatives that reflect atypical preferences by building an embedding-based collaborative filtering recommender to support users’ decision-making process. The preferences derived from the results can be used by suppliers, individual investors, and policymakers [54]. Table 1 summarizes the key aspects of the literature review.

3. Survey Design

3.1. Housing Attributes and Housing Profiles Composition

Based on the literature review on the housing preferences, discussions with certified architects and housing planning and design experts, and in-depth interviews with occupants of apartments, this study derived the following nine attributes: “time to metro,” “accessibility to market,” “number of schools,” “housing prices,” “housing area,” “number of rooms,” “number of bathrooms,” “distance to park,” and “investment value.”
The housing profiles are housing alternatives prepared based on the abovementioned nine housing preference variables. Those were presented to respondents through a survey. Respondents considered all nine variables and evaluated their preference for the profiles on a scale ranging from 1 (least preferred) and 5 (most preferred). Before creating the housing profiles, 30 pilot profiles were designed to modify the scope and definitions of some criteria. Below, the final nine variables are defined and the creation of the profiles are explained.
First, “time to metro” was measured by walking time (minute) to the nearest subway station. It refers to the accessibility to public transportation. There are two types of public transportation in Seoul: bus and subway. In designing the pilot profiles, the time taken to the nearest bus stop was about less than five minutes. As there was no significant difference between the apartments, the criterion was based on the time required to the nearest subway station on foot.
Second, “accessibility to market” is the distance to the nearest store from the specific profile which is related to proximity to the commercial districts. In preparing the pilot profiles, the distances from the specific apartments to the nearest convenience stores were not discriminating factor in Seoul. In this regard, the measurement used the “large market search” function provided by Naver Maps, which is commonly used in Korea. Due to the size and visiting characteristics of department stores, big-box stores, etc. most people use vehicles rather than walk to get there. The distance traveled in meter units was used to exclude the effects of travel time depending on traffic conditions.
Third, “number of schools” measured the number of elementary, middle, and high schools located within a 1-km radius from the apartment.
Fourth, “housing price” is the price of the apartment divided by “a unit pyeong(3.3 m2)”. The prices are referenced and created based on the “Multi-unit Housing Handbook” (2005.1.1–2019.6.1). The unit of this factor is 10,000 Korean Won (KRW). The price used in this research was hypothetical since there were gaps between actual market prices and official prices given by the government (“Gongsiji-ga”) for housing taxes. Moreover, since the market price may differ from time, district, market situation, government policies and cases, this study used hypothetical price referenced by the statics [54].
Fifth, “housing area” was also based on the “Multi-unit Housing Handbook” (2005.1.1–2019.6.1). The criteria for area were based on the “jeon-yongmyeonjeog (exclusive area)” of rooms, living rooms, bathrooms, and kitchens used only by the apartment unit. Thus, public areas in the apartments were excluded, such as stairwells, corridors, and community facilities [54].
Sixth, “number of rooms” reflects the number of rooms inside the unit excluding living rooms and kitchens.
Seventh, “number of bathrooms” reflects the number of bathrooms inside the unit.
Eighth, “distance to park” was measured on the map from the house to the nearest park to determine environmental factors. The unit is meter.
Finally, “investment value” was used to determine investment value. The investment value of apartments was assumed to be have for Samsung, Hyundai, Daelim, GS, Daewoo, POSCO, Hyundai ENG, Lotte, HDC Hyunsan, and Hoban Construction, the top 10 domestic construction companies in the “Construction Capability Assessment (2014–2019)” provided by the Ministry of Land, Infrastructure and Transport. For other cases, it was assumed there was no investment value [51,55].
The housing profiles were limited to the Seoul. Housing type was limited to apartment with five or more floors following “Article 3 clause 1 no. 1 of the Enforcement Decree of the Housing Act and Article 3–5 of the Enforcement Decree of the Building Act” [56,57]. According to the “Integrated Apartment Information Center,” there are 3368 apartment complexes in Seoul. Thus, to ensure a 90% confidence level, 722 housing profiles must be created. However, 679 profiles were created because of missing data and problems pertaining to overlapping. Table 2 summarizes the nine variables and units derived from the literature review and their criteria.
Figure 2 shows a Box and Whisker plot for the 679 housing profiles based on 6 of the 9 variables: time to metro, accessibility to market, number of schools, housing price, housing area, and distance to park.

3.2. Survey Design

In this study, respondents aged between 20 and 60 years were surveyed for 5 months between 1 October 2019 and 29 February 2020. The survey was conducted offline and online in a way that did not create differences between the two methods in content or presentation. In total, 100 copies of the questionnaire were distributed offline and 150 online, and 233 were retrieved: 98 offline and 135 online.
The questionnaire consisted of questions relating to respondents’ socio-demographic attributes including their age, monthly household income, and housing tenure type, and those measuring their ratings of the profiles. In total, 30 randomly extracted profiles were given to the respondents, and three profiles formed a combination. These were presented to users 10 times. This number was determined in advance through the pilot survey process to ensure the survey secured a reasonable amount of data but did not fatigue respondents.

4. “SeoulHouse2Vec” Model Building

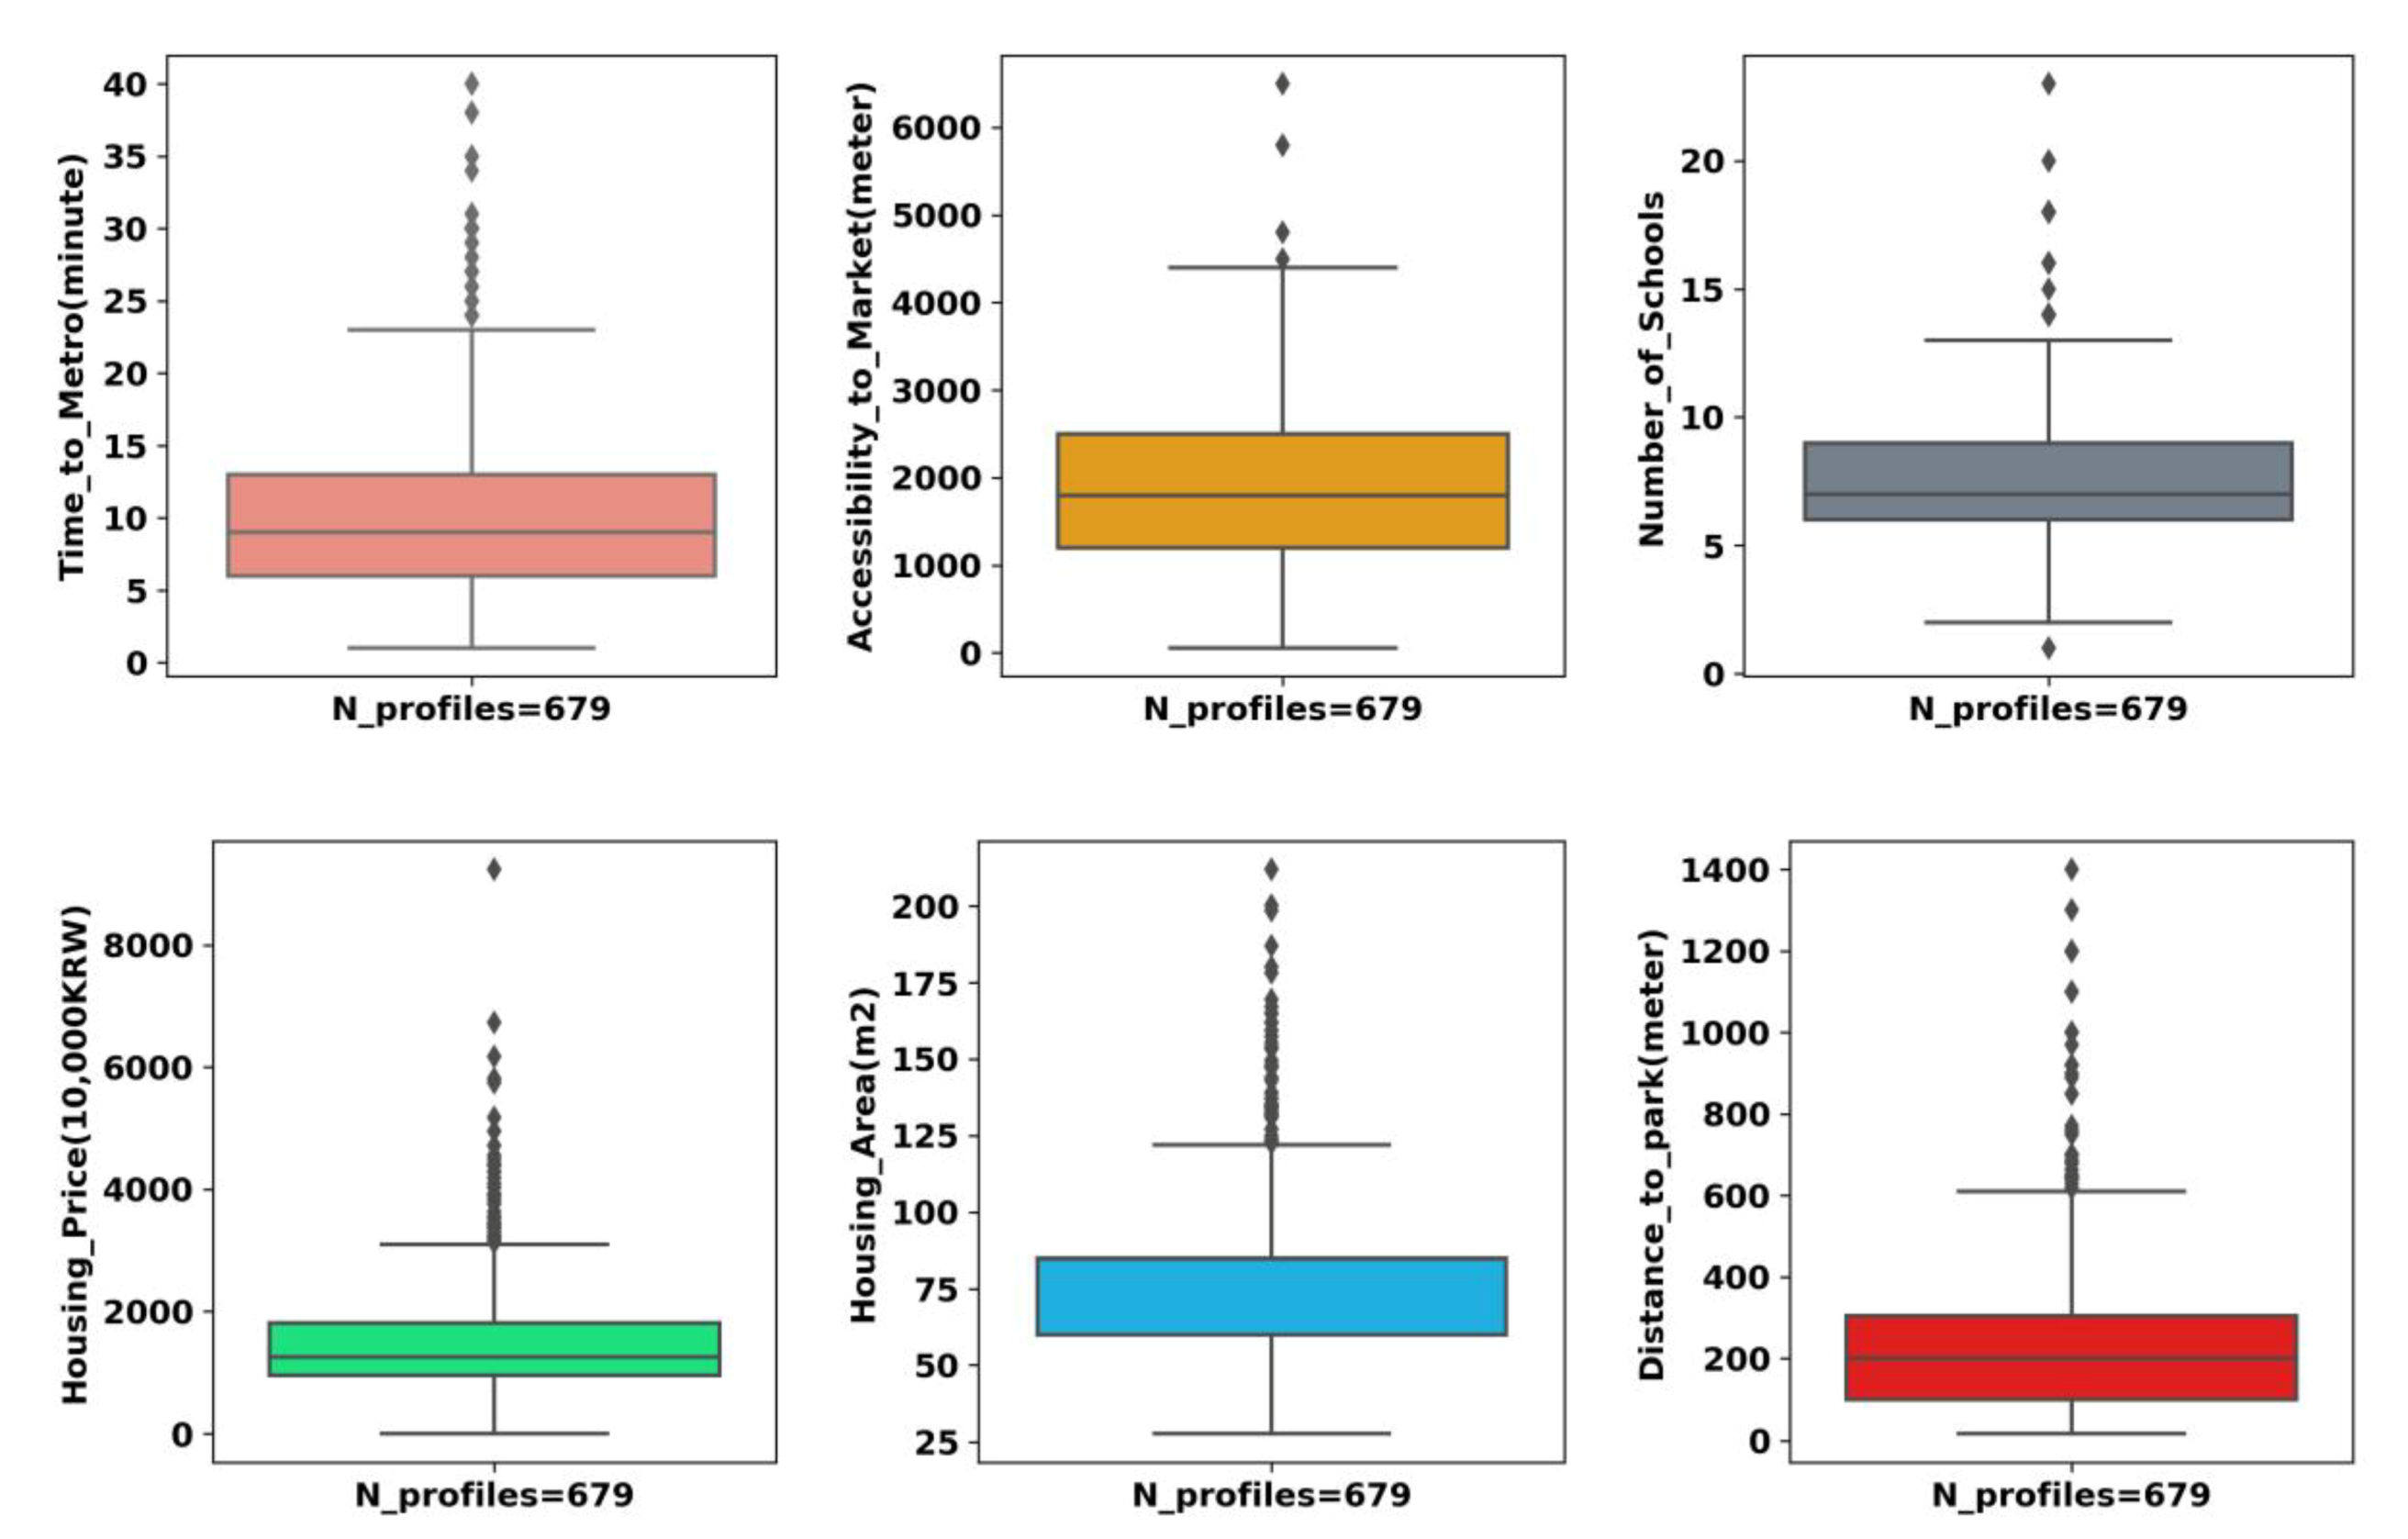
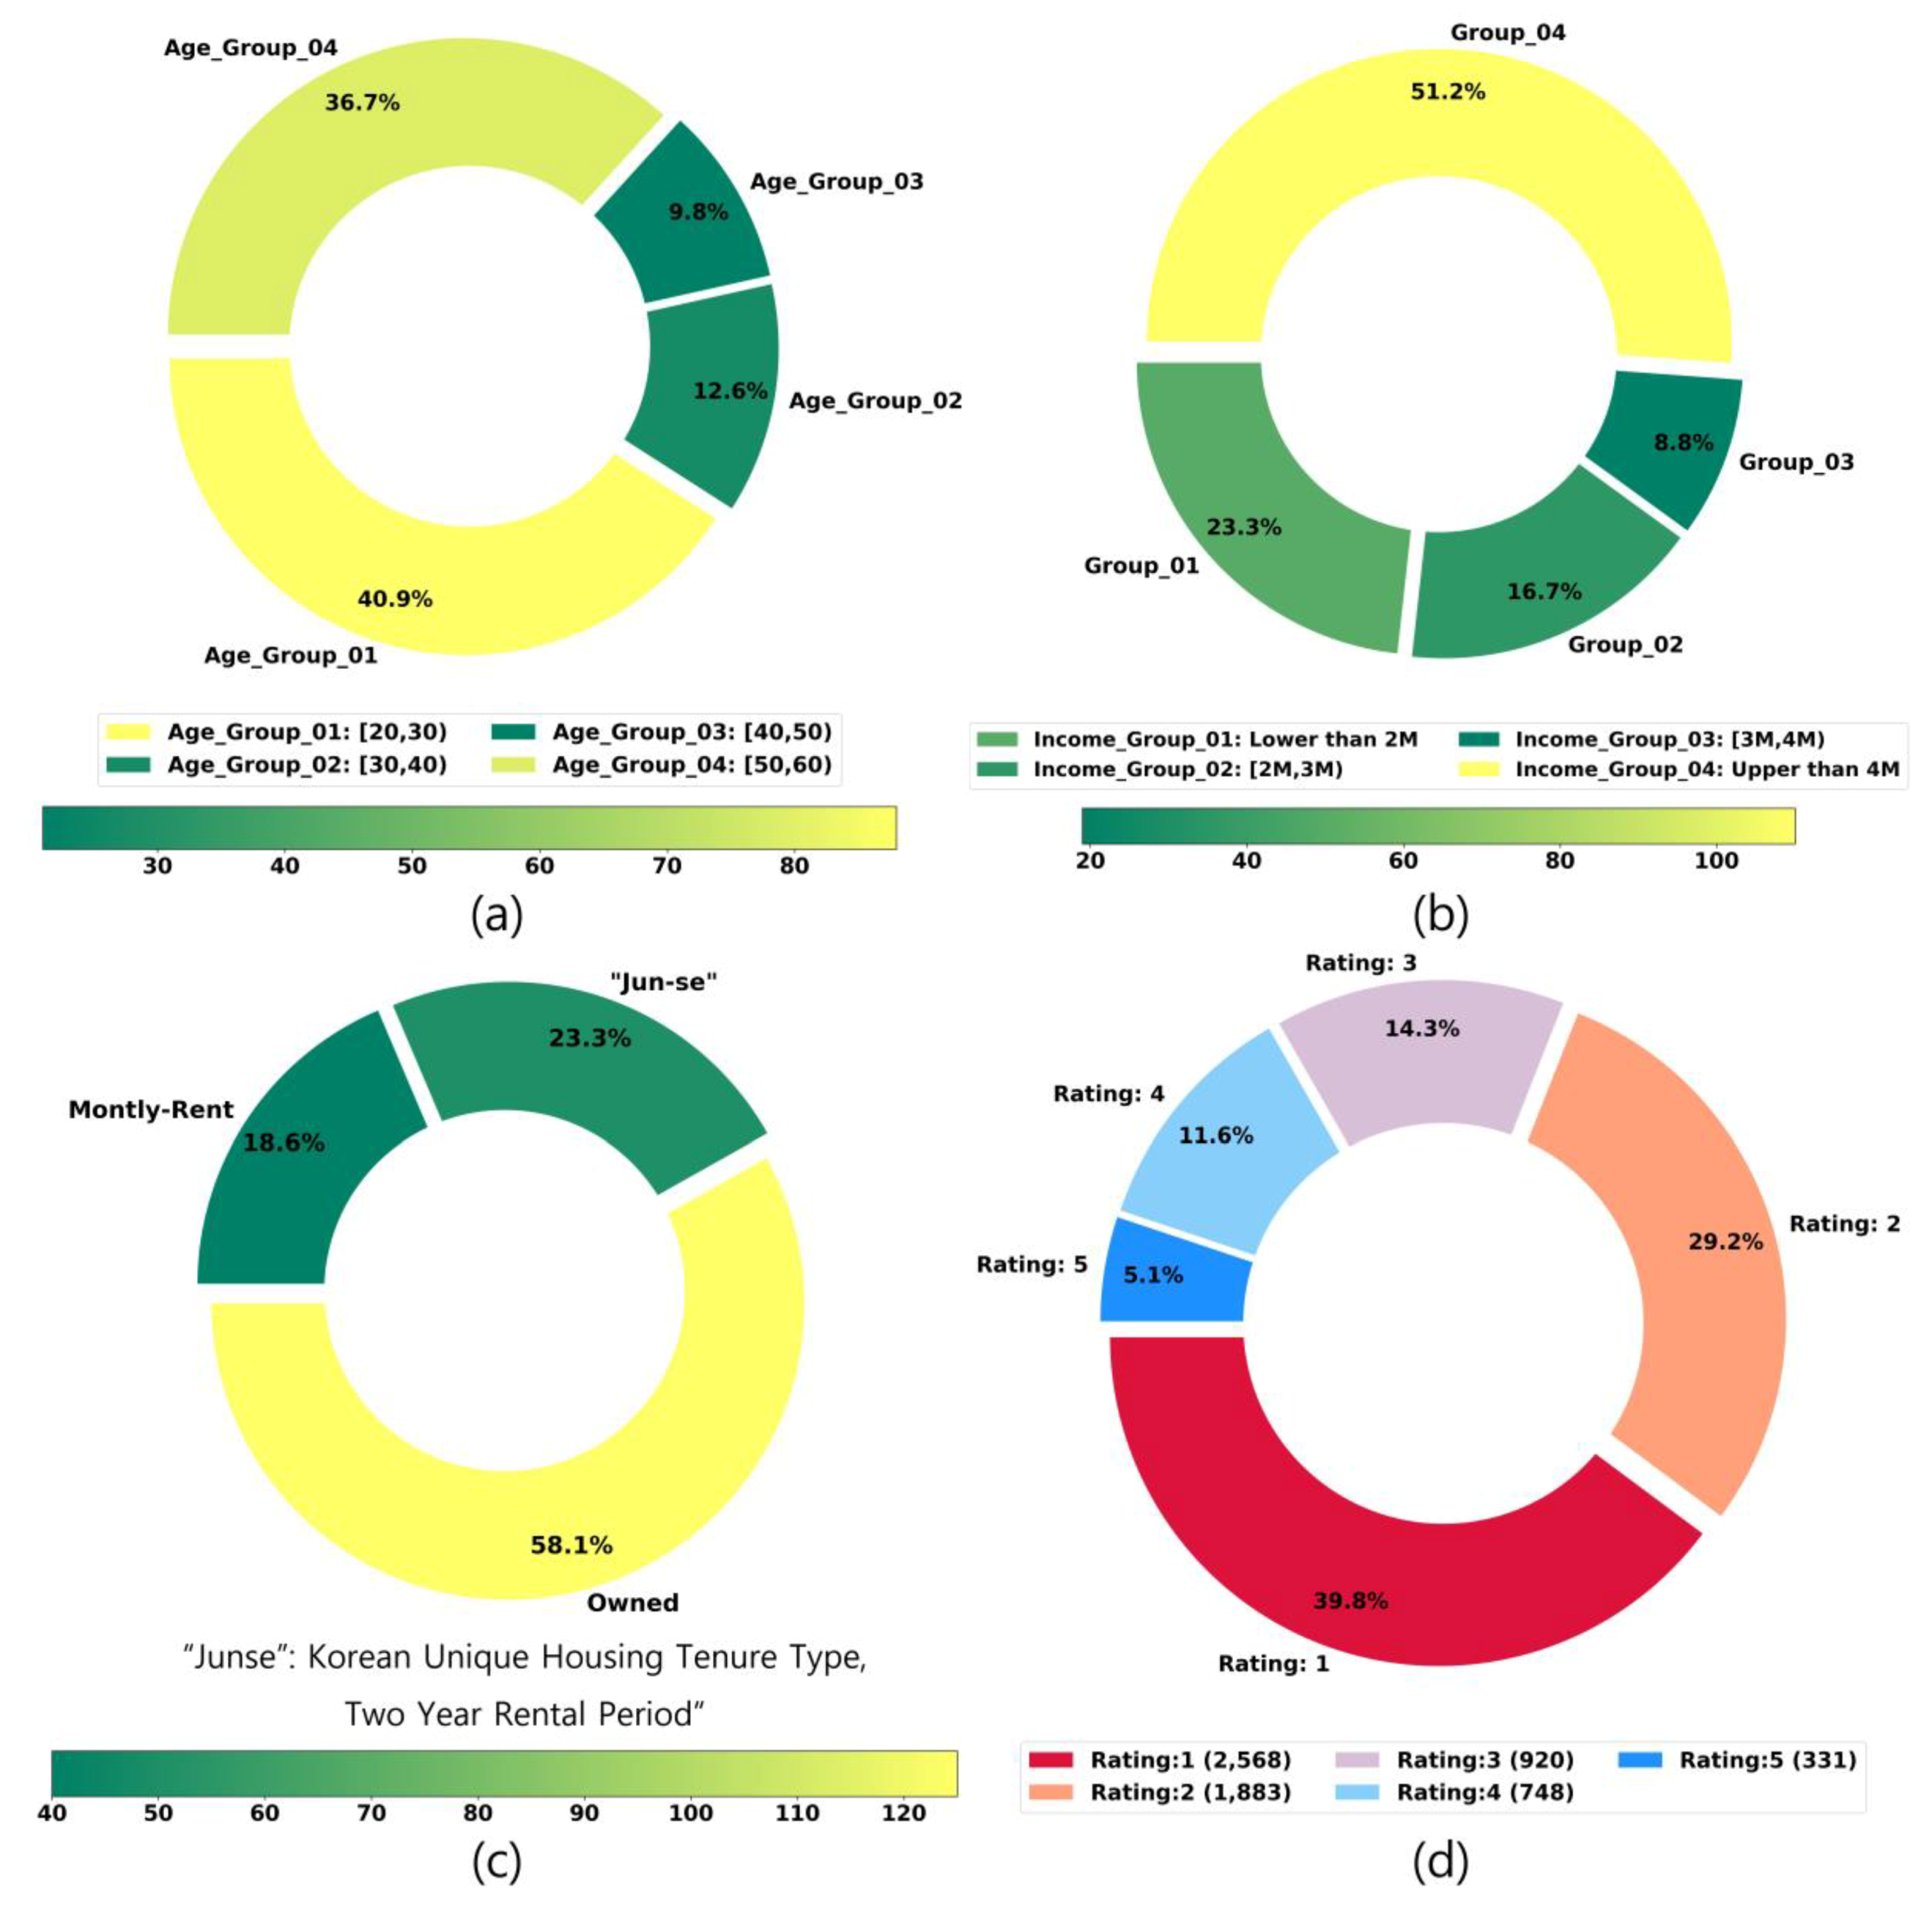
4.1. Dataset of Housing Prefernces Ratings Description

Of the 233 questionnaires retrieved, 18 respondents who gave incomplete responses or had missing information were excluded, resulting in 215 surveys. The dataset built through this consisted of 6450 (215*30) rows. The dataset consisted of the following: “UserId,” a unique six-place identification code (three alphabet letters + three digits) to ensure the anonymity of survey respondents; “HousingId,” which is subject to a preference evaluation; “Rating,” which is the rating the user gives for the housing profiles; and respondents’ socio-demographic attributes. The attributes were not used when training the embedding-based recommendation system model. Dataset consisted of rows and ratios of 2568 (39.8%), 1883 (29.2%), 920 (14.3%), 748 (11.6%), and 331 (5.1%), respectively, based on a rating of 1 to 5. Further research is needed on the fact that relatively unfavorable ratings (1–2) accounted for a large portion of the data. For the socio-demographic attributes, of the 215 people, 88, 27, 21, and 79 participated in the dataset for the age groups 20 to 30, 30 to 40, 40 to 50, and 50 to 60 years, respectively. Based on monthly household income, 50, 36, 19, and 110 people participated in the income groups of less than 2 million KRW, 2 to 3 million KRW, 3 to 4 million KRW, and 4 million KRW or more, respectively. Type of housing tenure was divided into three categories: self-owned, “Jun-se” (Korean unique lease type), and monthly rent, with 125, 50, and 40 respondents in each group, respectively. Figure 3 shows the distribution of respondents’ socio-demographic attributes and ratings based on age, monthly household income, type of housing tenure, and rating.

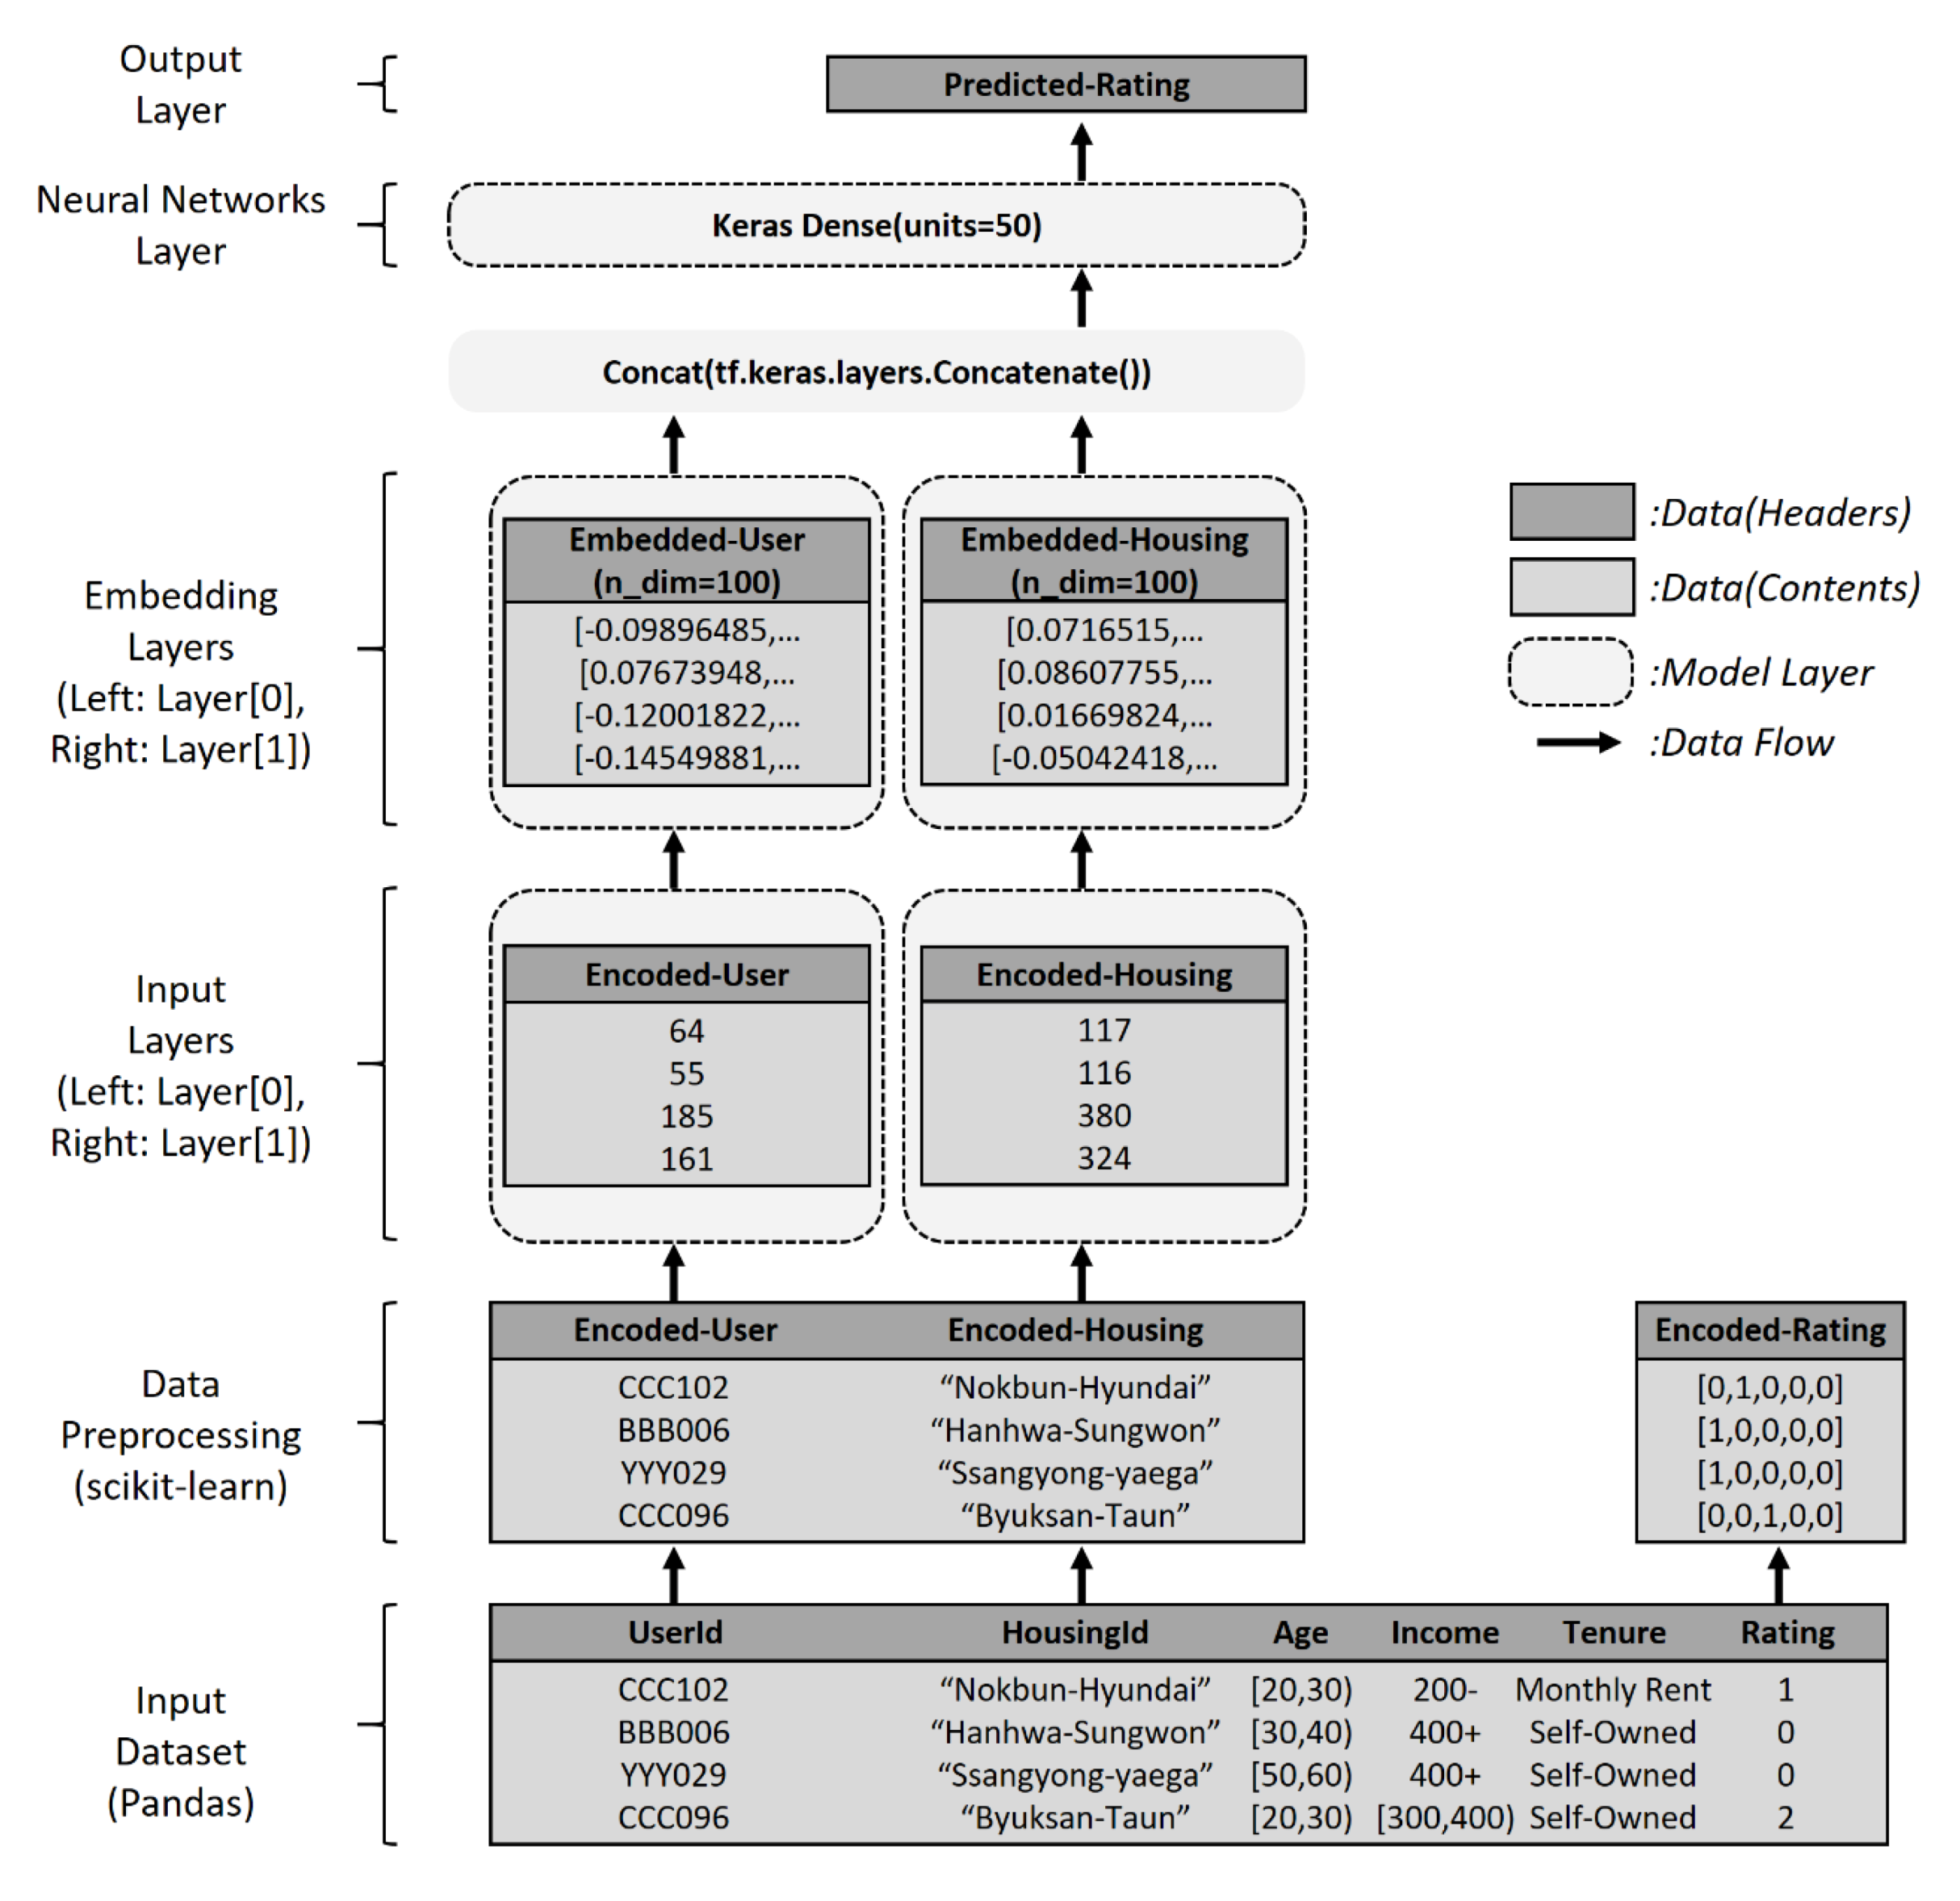
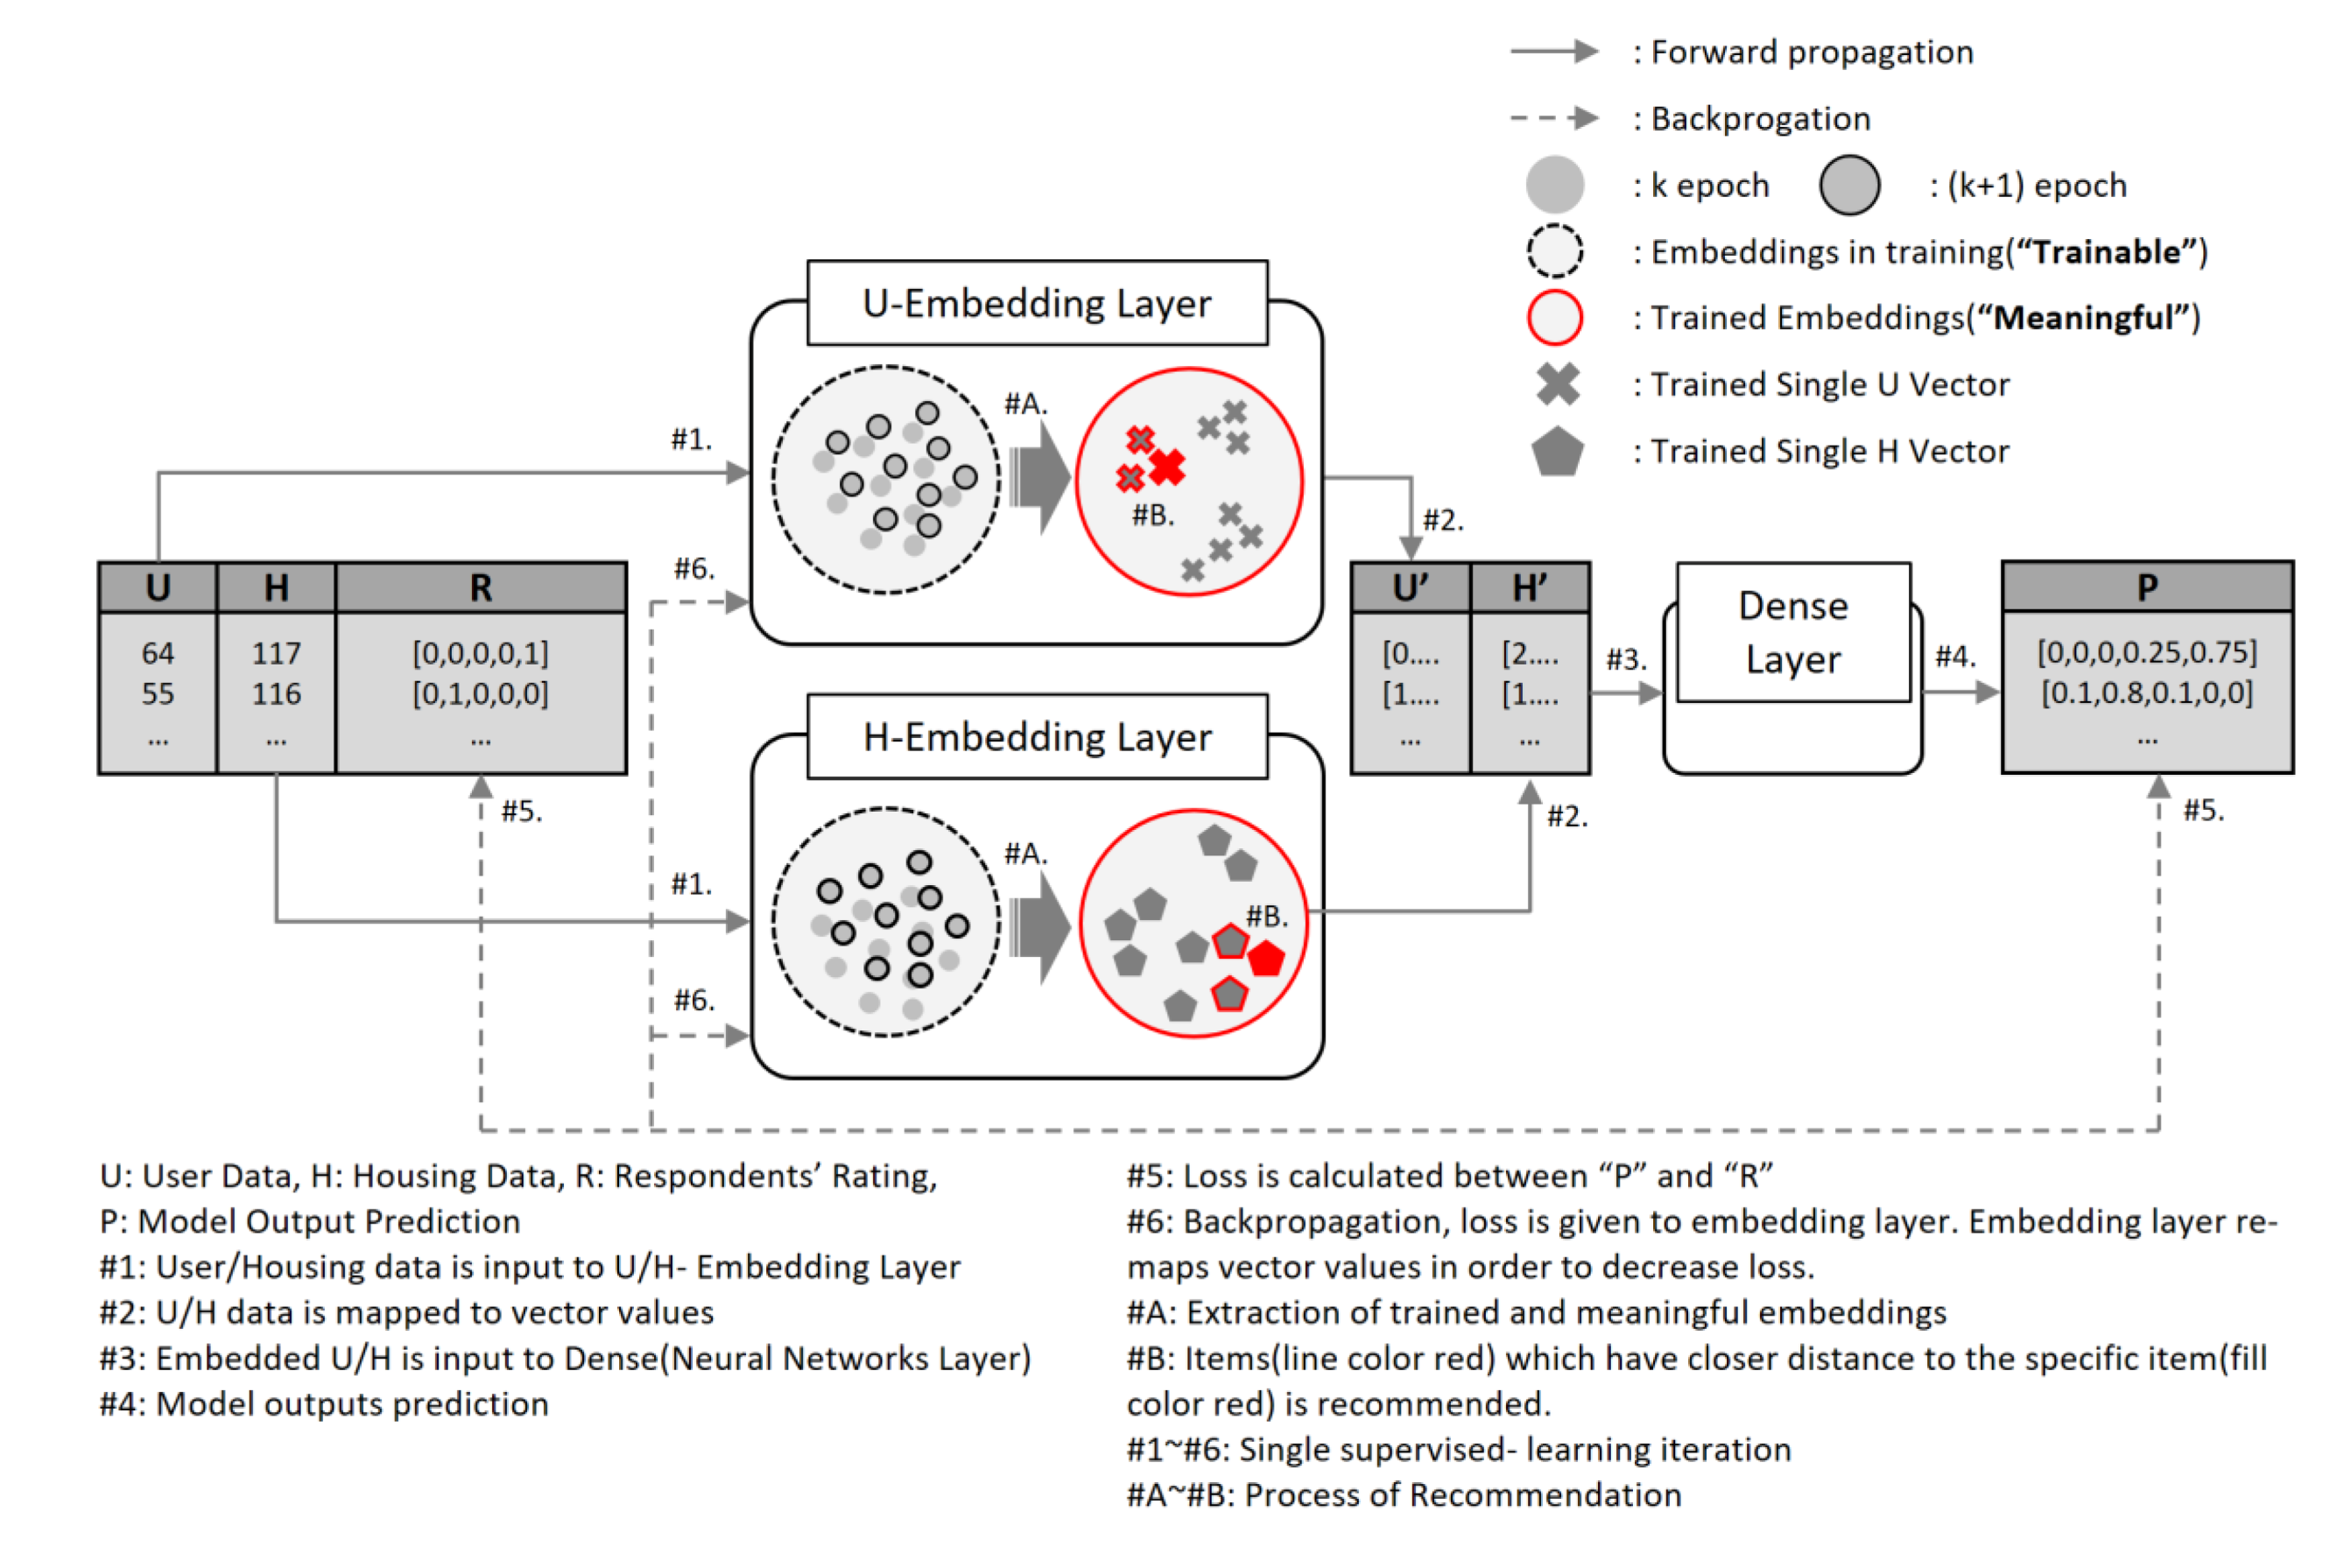
4.2. Model Structure

In the data pre-processing phase, label encoding was performed for UserId and HousingId. In total, 215 existed for UserId and 679 for HousingId; thus, they were expressed as unique index values ranging from 0 to 214 and 0 to 678, respectively. Label encoding used the “LabelEncoder” function provided by “scikit-learn” API. Through label encoding, string-type data are expressed in numeric format and entered into the model. For “Rating,” one-hot encoding was conducted, which represents N number of data as sparse vectors in N-dimensions. This process expressed 1, 2, 3, 4, and 5 as [1, 0, 0, 0, 0], [0, 1, 0, 0, 0], [0, 0, 1, 0, 0], [0, 0, 0, 1, 0], and [0, 0, 0, 0, 1], respectively. One-hot encoded rating values are frequently used in the process of expressing the class and prediction in the classification model.
This model has two input layers, which receive as input values UserId and HousingId to calculate the similarity between users and housing items at subsequent embedding stages.
Embedding layers are the core layers that make the recommendation system operational. They map the encoded UserId and HousingId data to n-dimensional dense vectors. The embedding dimension is the dimension of a dense vector, for which a larger number represents a higher dimension. The vector values present in n-dimensions place individual data in the space in a way that minimizes the errors that are the difference between the model’s prediction and the actual rating (Rating) as the training repeats. In this process, the users’ atypical preference for the profiles is expressed in the dense vector space in the form of computational data.
The dense layer is a fully connected neural networks. The weights, which represent the degree of connectivity between nodes, are adjusted to reduce the error as the training repeats.
The output layer receives the output value of the dense layer as an input value. “Softmax” was used for the output layer’s activation function. The function presents the probability that the data entered in the model belong to a particular class. It gives a probability distribution whose total sum of the probabilities of belonging to each class is 1. Figure 4 shows the overall structure of the model and flow of data.

5. “SeoulHouse2Vec” Model Training, Validating and Evaluation with Confusion Matrix

The recommendation system was trained and validated in supervised-learning method. In the initial phase of the training, embedding values are rather random and “trainable”. However, after training proceeds and error decreases, the embedding values of the users and the profiles are rather “meaningful,” which means their own vector values may reflect an atypical preference and intrinsic value of the given data. In this regard, if a specific user prefers a specific housing profile (item), the system recommends items that have close embedding distance to the user-liked item. From the user’s viewpoint, it can be assumed that if two different users have close embedding distances, then their preferences for a given specific housing alternative may be similar.
Figure 5 shows the process of how supervised-learning classification problem can be cast to recommendation via using the concept of embedding. In the initial phase of the training, items are mapped to embedding layer in random order. Training process consists of forward and back propagation. In the forward propagation step, the mapped values are input to the dense layer, and the dense layer predicts the probability of belonging to a specific class. This prediction value calculates the difference with the label, which is the error. This error value is passed back to the embedding layer, and the model changes the mapping values of individual items in a way to reduce this error. This is referred to as backpropagation. After some iterations of this process, items are mapped in a way to reflect intrinsic, atypical, and abstract characteristics of the data in numeric values.

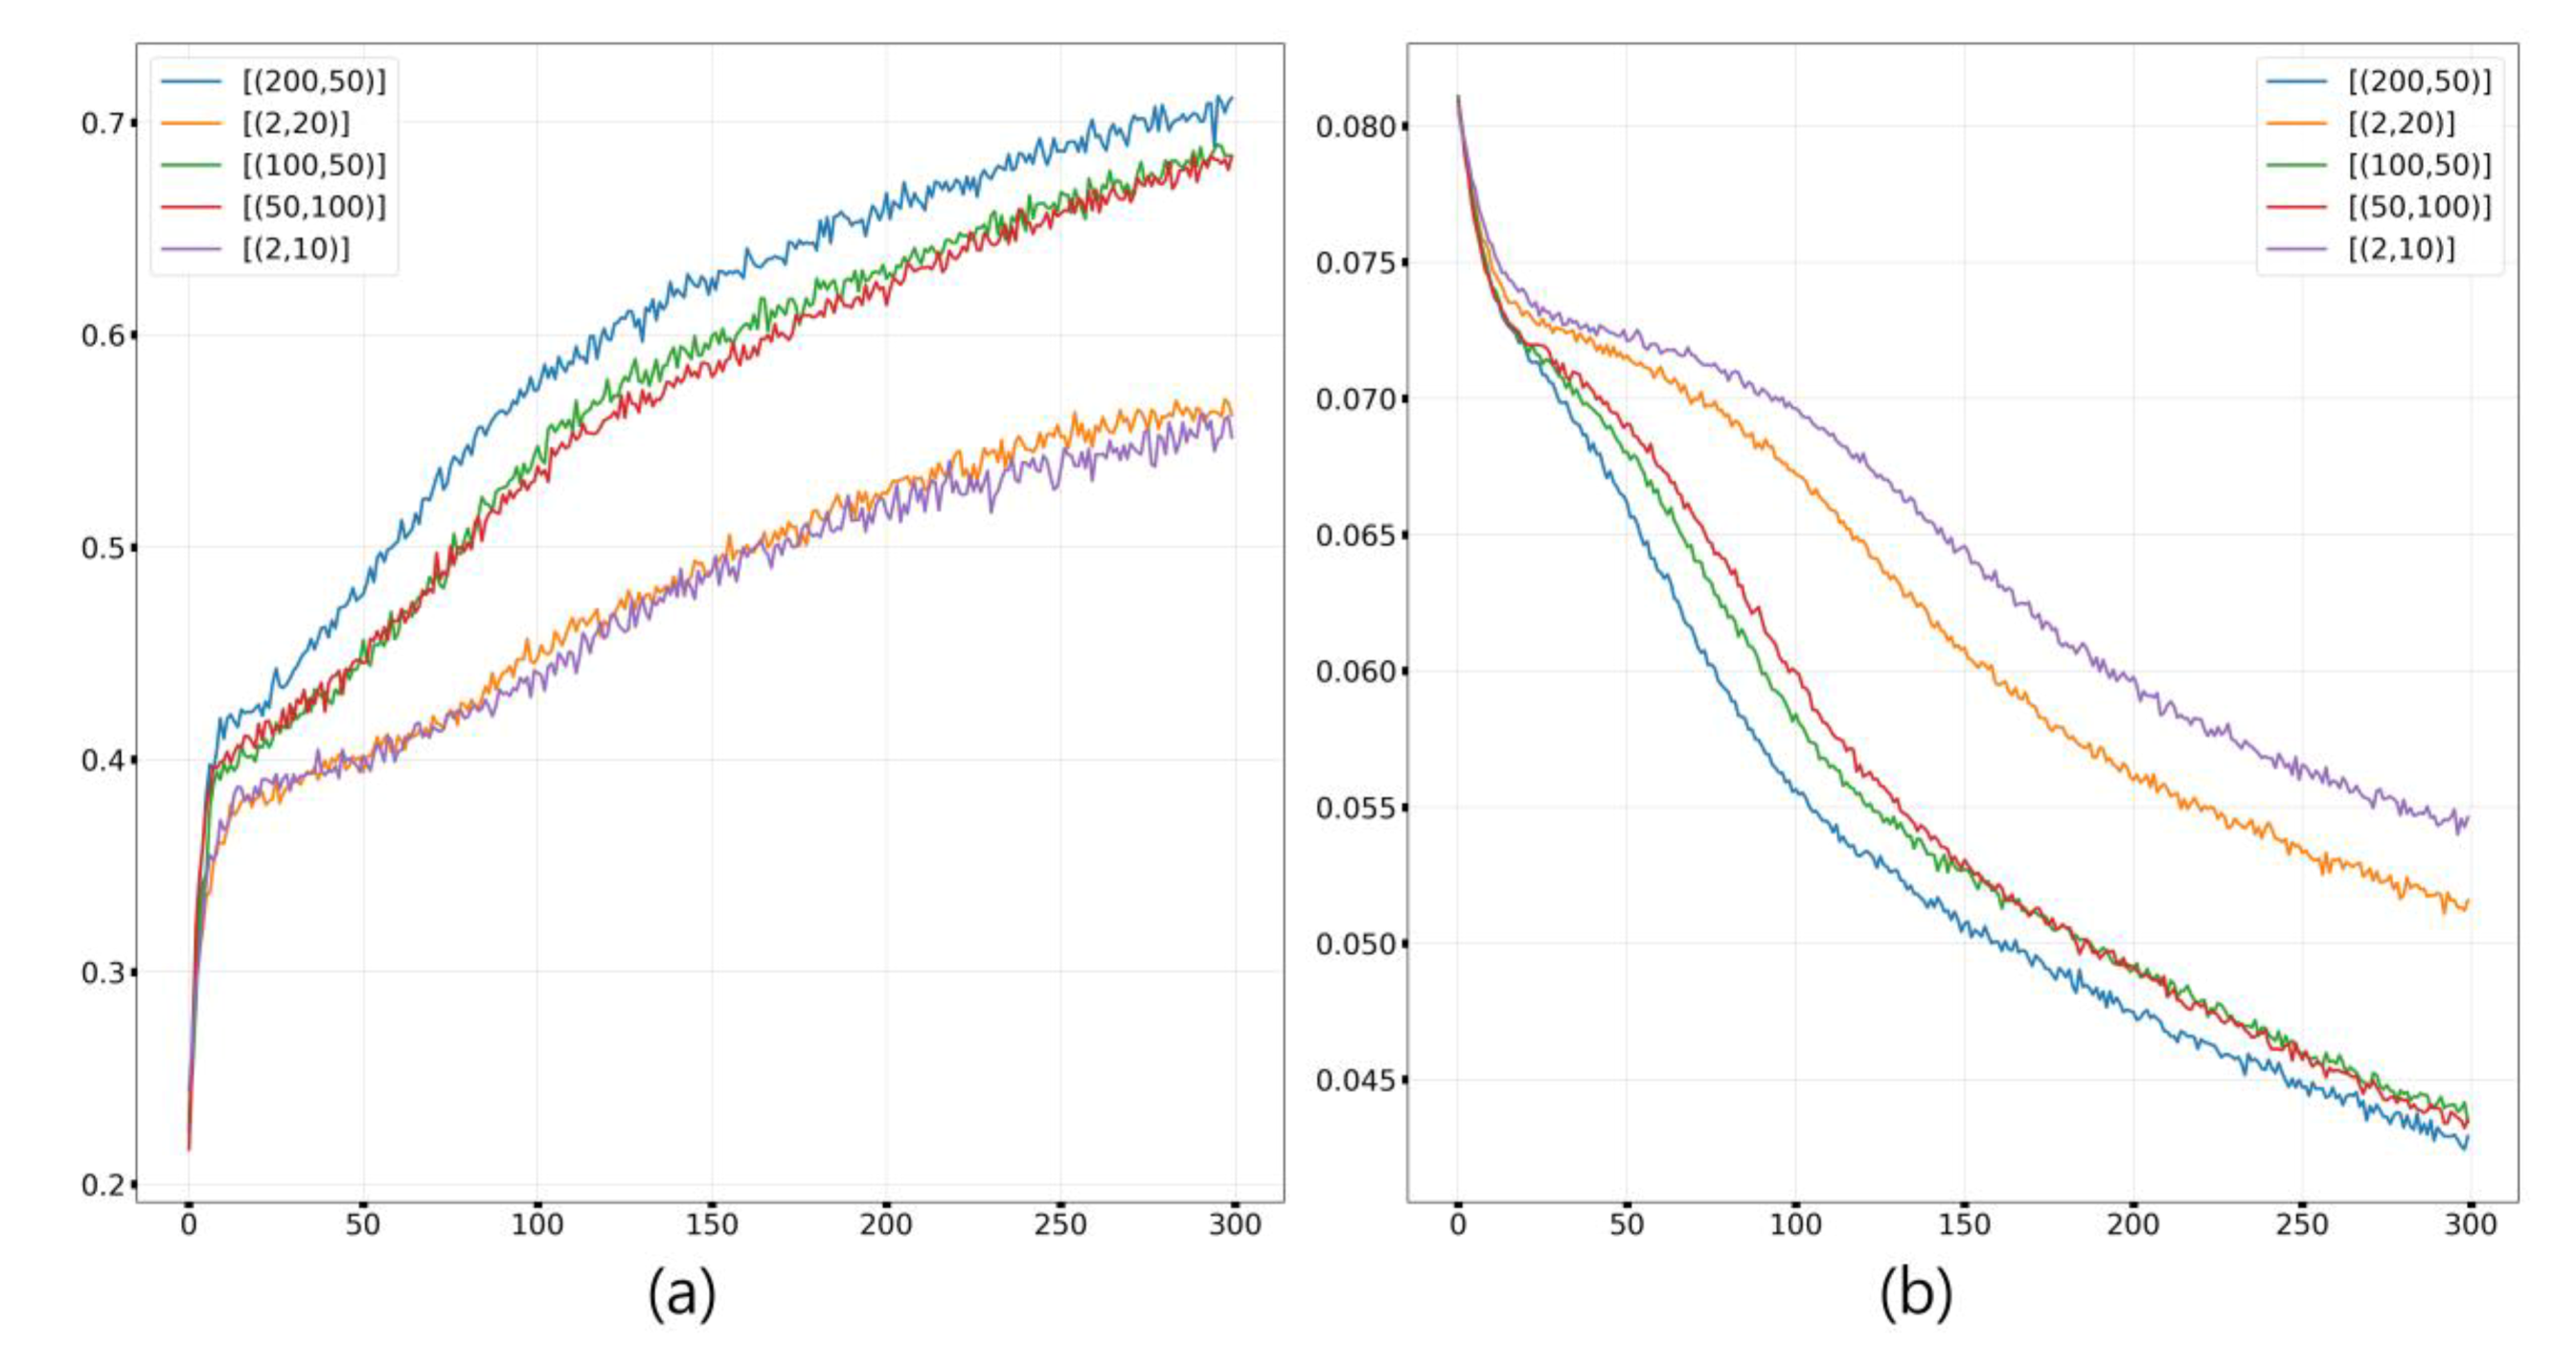
5.1. Model Training and Validating for Tuning Model Hyperparameters

In this section, the model training and validating was conducted to set the embedding dimension and the unit of the dense layer.
In total, 6450 (215*30) data units were used in the process, namely the Rating values explicitly expressed by 215 respondents for 30 profiles. Using the “train_test_split” function in the scikit-learn API, from the entire data, 1293 were split as the evaluation data.
The embedding dimension consisted of a range from 2D to 200D, and the dense layer units from 5D to 300D. The model training and validating was conducted with a range of different combinations of the two hyperparameters. If both hyperparameters were set to values greater than the value of the range, overfitting occurred in which only training data were learned, limiting that range. The training iterations were set to 300. Among the various hyperparameters combinations, the highest accuracy was indicated when the embedding dimension and dense layer unit were (200, 50), respectively, and the second highest accuracy was (100, 50). Furthermore, (2, 10) had the lowest accuracy. This is shown in Figure 6a. The more the training was repeated, the errors decrease, as shown in Figure 6b.
Figure 7 visualizes in two dimensions the changes in coordinates of individual items in the Housing Embedding Layer and User Embedding Layer as the number of training iterations was repeated. The “SeoulHouse2Vec” model is difficult to visualize because the individual users and housings are each mapped to the vector space. Therefore, the t-distributed stochastic neighbor embedding (t-SNE) method was used. The approach enables visualization by converting high-dimensional vectors that are difficult for users to intuitively understand into low-dimensional vectors while maintaining relative similarity and data characteristics between the individual items.
20 of the 679 and 215 items were randomly extracted, respectively. In (a), the 20 arbitrarily extracted housing profiles represented in relatively small circles are coordinate values when the training was repeated 100 times. The relatively large X-shaped housing profiles are coordinate values when the training was repeated 300 times. Based on housing profiles #88 and #625, the distance was closer when the training was repeated. In (b), the user represented in a relatively small circle is the coordinate value when the training was repeated 100 times, while the user represented in a relatively large pentagon is the coordinate value when the training was repeated 300 times.

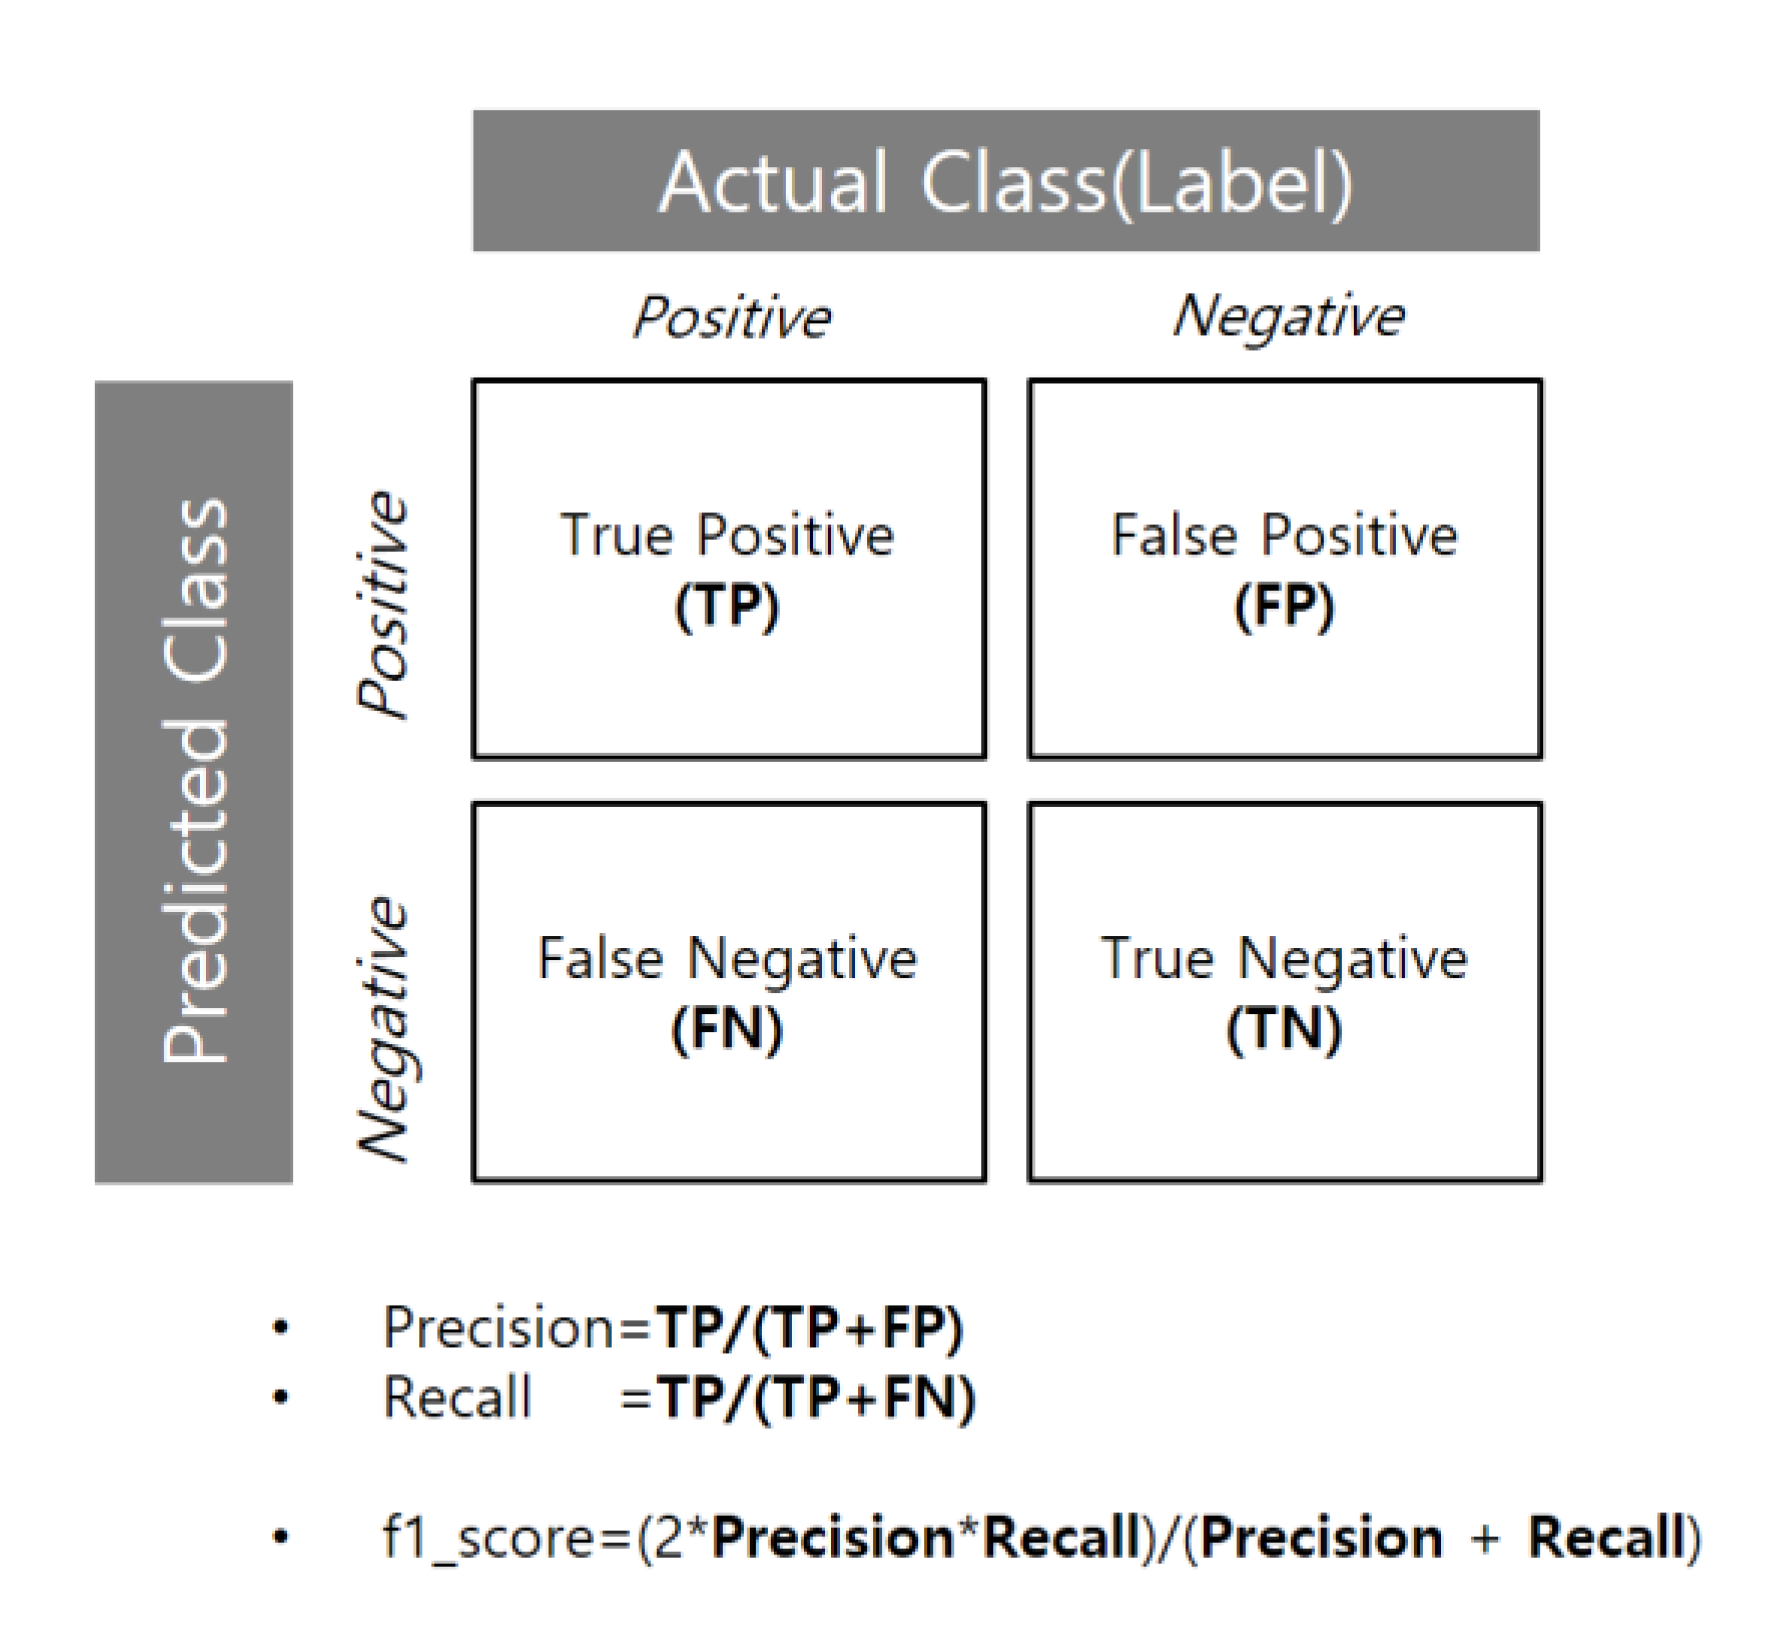
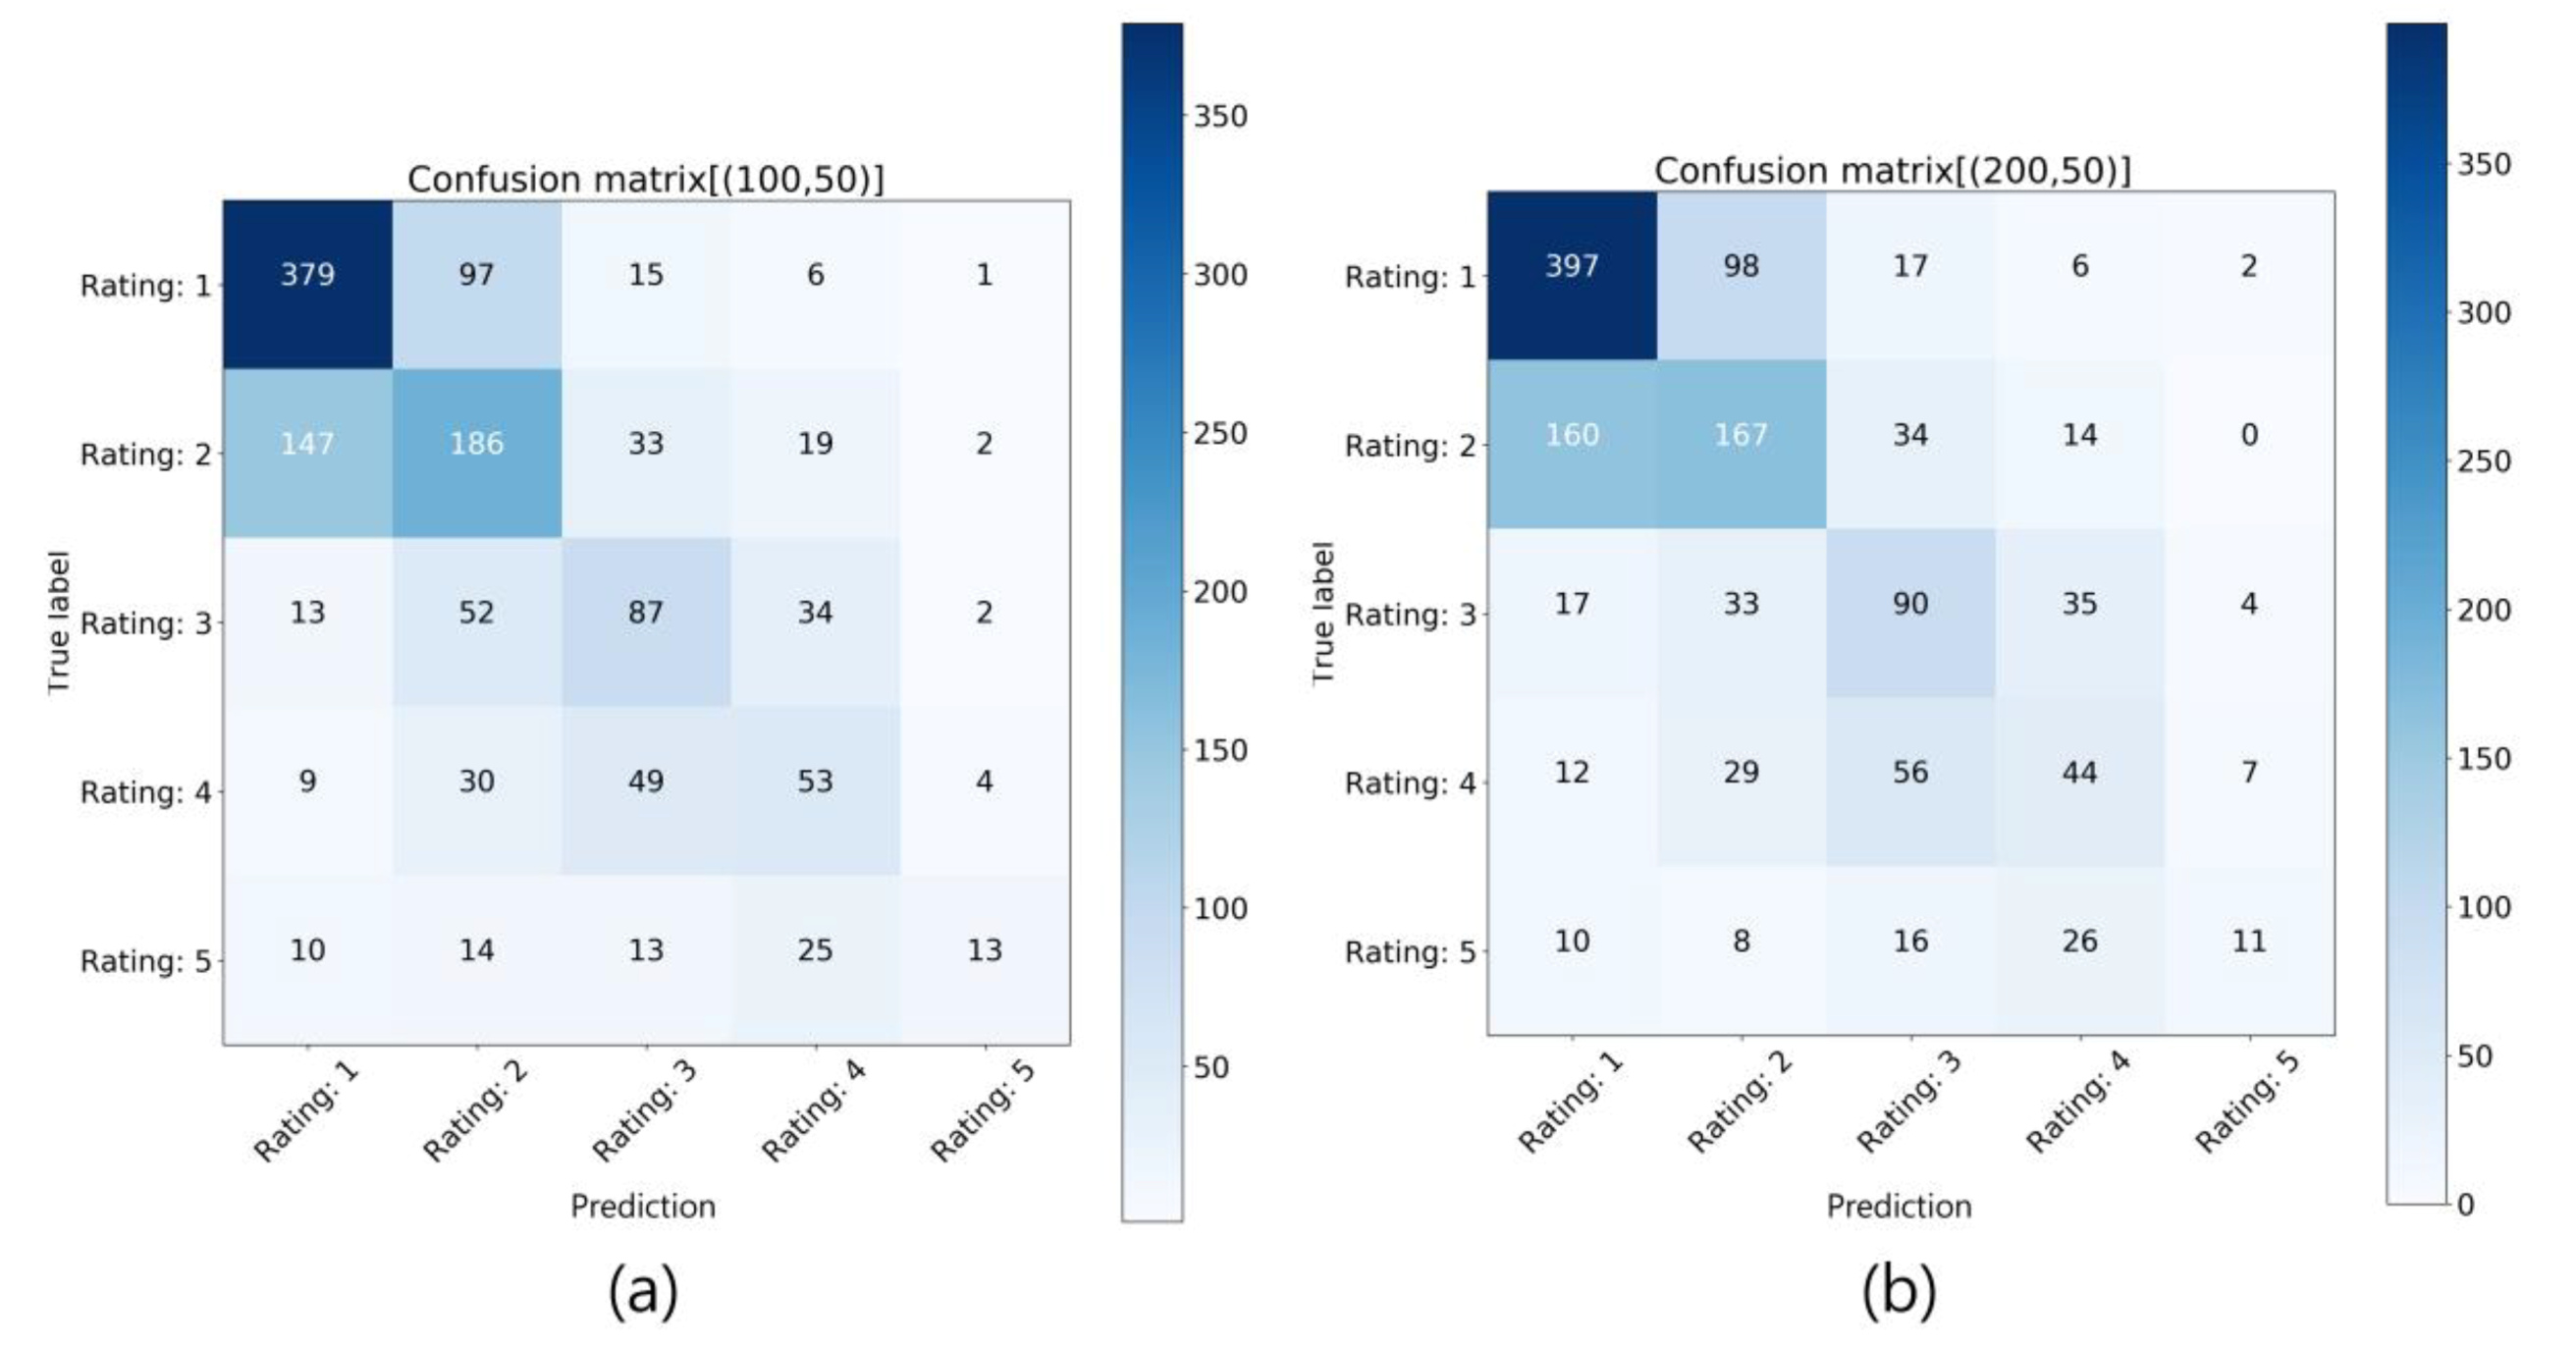
5.2. Evaluation with Confusion Matrix for Estimating Final Performance of the Model.

The model was evaluated using three metrics: Precision, Recall, and f1_score for models (200, 50) and (100, 50), which demonstrated the highest accuracy during the previous model training and validating phase. For this, a confusion matrix was created. The confusion matrix, which is also referred to as the error matrix, is a common technique for evaluating and visualizing algorithm performance in machine and deep learning classification problems. Figure 8 shows a concept of the confusion matrix that can be created in a binary-classification problem. Precision is the ratio that the label, which is the actual classification of the data, is TRUE, from among the cases where the model’s prediction for the input data is TRUE. Recall is the ratio the model’s prediction is to TRUE from among the cases where the actual data classification is TRUE. The f1_score is the harmonic mean of precision and recall.
The trained model is a multi-classification model with five label values. The metrics can be measured based on a specific label class; here, the metrics were calculated based on the case of “Rating = 1” (least preferred), which comprised the largest share among the five classes. From the perspective of housing preference, the model maps the survey respondents and housing profiles to embedding vectors through the previous training process. In the evaluation process, arbitrary respondents and housing profiles are received as input values, and “Rating = 1” scores are not given to the model. If the model predicted that the respondent’s score for the housing profile is “Rating = 1” and the respondent’s actual score for the profile is “Rating = 1,” then this is considered a “True Positive.”
For model (100, 50), precision and recall were measured at 0.679 and 0.761, respectively, based on Rating = 1. The f1_score was measured at 0.718.
For model (200, 50), the precision and recall values were measured at 0.666 and 0.763, respectively, based on Rating = 1. The f1_score or harmonic mean was measured at 0.711.
Based on the three metrics, the (100, 50) model demonstrated slightly better performance in terms of confusion matrix. Figure 9 shows the confusion matrix of the two models: (a) (100, 50) and (b) (200, 50).

6. Scenario-Based Demonstration of “SeoulHouse2Vec” Model

This section provides one possible usage and application of the built model in terms of analyzing housing preference and supporting housing decision-making via recommendation of the profiles. Two research scenarios were suggested, respectively. In the previous survey step, since the demographic characteristics of the survey respondents were not evenly distributed and the size of the dataset is limited, the scope of interpretation and application of the research scenarios apply to only the 215 respondents and the 679 housing profiles. Future studies must investigate a broader scope of model application and results analysis. This study created two research scenarios, which are housing preference analysis and housing decision-making. In the scenario presentation step, a brief theoretical review was conducted to create the scenarios. In the model application step, acquired dataset and the built model was utilized. In the results interpretation step, the application results of the model were interpreted and visualized.

6.1. SeoulHouse2Vec Model Demonstration Scenario 1

6.1.1. Scenario: Multi-Attribute Utility Theory

A common method to quantitatively measure users’ residential preferences is the multi-attribute utility theory (MAUT), which is a compositional model. After giving weights based on a scale of 0 (least important) to 100 (most important) to each attribute’s level, the utility and preference between the alternatives were quantitatively evaluated by adding the value of each attribute and the product of the weighted value of each attribute value as assessed by the user. This technique has the possibility of identifying the relative importance between multiple attributes of a housing from the user’s viewpoint and quantitatively measuring the preference [58,59,60,61,62,63,64,65].
Studies on residential preference using MAUT usually analyze the correlation between respondents’ socio-demographic attributes and the weights of multiple residential attributes. They present housing alternatives that a group sharing particular socio-demographic attributes might prefer and quantitatively measure these preferences. However, these studies are limited in that they were unable to analyze individual units belonging to the group but showing different preferences.
Therefore, this study performed a survey using MAUT, which can identify the relative importance between multiple attributes, and sought to interpret the individual preference differences that show different preferences within the same group by analyzing the importance according to the housing variable of each individual unit.
To identify different preferences within the same group, a group was selected in which respondents shared specific socio-demographic attributes. The embedding distance between respondents was then measured to indicate the similarity of residential preferences within the group. Figure 10 shows the ranking of the embedding distances between eight individuals in a group with the same socio-demographic attributes: they were aged 50–60 years (age), earned KRW 4 million or more (monthly household income), and had “Jun-se” (housing tenure type). With the eight users in the group, 27 (48%) of the 56 rankings indicated different preferences with a ranking below 120. This indicated the need for a more personalized approach, since some cases belonged to a group that shared the same attributes but indicated different preferences for individuals.
Thus, the study aimed to conduct the analysis using the SeoulHouse2Vec model, in which the minimum unit of analysis is the individual’s preference. Based on users who share socio-demographic attributes but show different preferences, or users who do not share any socio-demographic attributes but have the same preferences, the study aimed to present and implement a scenario for analyzing residential preferences with the MAUT method.

6.1.2. SeoulHouse2Vec Application with MAUT

Randomly selected respondents were asked about the relative weight of the residential preference variables in the MAUT survey. The six housing preference variables presented to respondents were accessibility to the subway, accessibility to the supermarket, accessibility to educational facilities, residential facilities, accessibility to parks, and investment value. For each housing preference variable, the respondent answered on a scale ranging from 0 (least important) to 100 (most important). The interior factors of the dwelling are the area of the unit, price per pyeong, number of rooms, and number of bathrooms, which may not show a linear preference. They were grouped as house interior factors and their importance was indicated. Each of the four items was divided into three levels. Area of house was delineated as small (80 m2 or less), medium (80–109 m2), and large (109 m2). Price per pyeong was divided into KRW 10 million or below, KRW 10 to 15 million, and KRW 15 million or more. Number of rooms was delineated as two or less, three, and four or more, and number of bathrooms as one and two or more. The score for each was then assessed. The house interior factors were combined in the assessment because individuals’ nonlinear preference was evident. For example, in the case of the importance score for time to metro, which showed a linear preference, less time means higher utility. However, for area of housing, which has a nonlinear preference, a larger size does not mean higher utility. The preferred size of homes may vary by respondent because they may prefer smaller houses considering the maintenance costs or larger houses because of the size of the family.
Of the survey respondents, randomly selected “USER_A001” was aged 50 to 60 years (age), earned KRW 4 million or more (monthly household income), and was leasing (housing tenure type). In addition, the importance values (weights) of the user’s residential preference variables were as follows: accessibility to the subway (80), accessibility to the supermarket (50), accessibility to educational facilities (20), house interior factors (80), accessibility to parks (60), and investment value (20).
First, of the users who share all the socio-demographic attributes of USER_A001, “USER_Y031” is the 152nd furthest away from USER_A001. Comparing the importance of the residential preference variable of the reference respondent and USER_Y031, accessibility to the subway is similar: 80 for the reference respondent and 90 for the comparison respondent, below the difference range of 10. However, the weights for the other five categories assigned by the comparison respondent were accessibility to the supermarket (30), accessibility to educational facilities (60), house interior factors (20), accessibility to parks (40), and investment value (20). Being above the margin of error of 10 or more, the two respondents’ preferences for most categories were non-similar. Therefore, even in groups with matching demographic characteristics, residential preferences may vary depending on the difference in importance each respondent assigns to each variable. These different preferences were expressed over relatively distant embedding distances. This is shown in Figure 11.

6.2. SeoulHouse2Vec Model Demonstration Scenario 2

6.2.1. Scenario Presentation

According to the Population and Housing Survey conducted by Statistics Korea in 2017, 19% of Korea’s total population resides in Seoul, which counts about 9,700,000 ([1, 2]). Based on the population movement in Seoul in 2019, of the about 1,400,000 people that moved in. In addition, of the 1,400,000 people that moved out [66]. This shows that population movement and housing market in Seoul are relatively active. This study presents and implements a scenario in which a family searches for the housing throughout Seoul, with a high preference for the apartment “HanhwaGgumAeGreen” located in Jayang-dong, Gwangjin-gu, a district of Seoul. By doing so, the study visually presents specific utilization measures of the model and its results.

6.2.2. Model Application

Through the model’s training process, the profiles were mapped to the embedding layer. The distances of the mapped profiles were calculated based on the preferred profile(target). If a particular user prefers the profile, the recommendation system will work in a way that sequentially presents some profiles close to the profile.
The dataset for the demonstration consisted of the embedding distances from the target apartment to the other apartments, names of the apartments, latitude, and longitude. This dataset was visually represented on the map of Seoul using Tableau, a data visualization program. Individual profiles are represented in a marker style circle with a black border on the map. A closer embedding distance from the preferred apartment was represented in red, and a farther distance in green. “HanhwaGgumAeGreen”, the reference for the calculation, was expressed in blue “X” characters on the map. This is presented in Figure 12: (a) shows a geographical range based on the entire Seoul area, and (b) is based on the Gwangjin-gu area where the apartment is located.

6.2.3. Data Analysis

Table 3 shows the values of the nine attributes for the entire profiles and the preferred apartment: time to metro (ATTR#1), accessibility to market (ATTR#2), number of schools (ATTR#3), housing area (ATTR#5), number of rooms (ATTR#6), number of bathrooms (ATTR#7), distance to park (ATTR#8) and investment value (ATTR#9).
The table also shows the average value corresponding to the attributes of the top 50, top 25, top 10, and top 5 apartments with a close embedding distance from the preferred apartment. First, for ATTR#1, time to metro, a smaller value means better accessibility. The average of the 679 profiles is about 11.23 minutes and 7 minutes for the reference. We see that a closer embedding distance starting from the Top 50 to the Top 25, 10, and 5 apartments means better accessibility to the subway station. For ATTR#2, a higher value indicates less accessibility. Interesting is that a higher value here means lower worth. Closer distance from the preferred profile shows an increasing value. Both ATTR#1 and ATTR#2 are related to accessibility. While a closer embedding distance improves the accessibility of ATTR#1, that for ATTR#2 decreases. This suggests that if this apartment is preferred, access to the subway station rather than to the supermarket will play a more important role in forming the preference. This may be interpreted as a trade-off between the two attributes.
For ATTR#5, housing area, the reference apartment has an area value higher (larger area) than the average of the overall profile. The top 50 has a higher value than the top 25 and top 10; thus, it is not possible to identify trends. However, the top 5 housing profiles with the nearest embedded distance have a relatively high value of 96.96. For ATTR#7, the number of bathrooms, the top 50, 25, 10, and 5 all have values higher than the average of the entire Seoul area, but no change in attribute values were found based on the difference in the distance.
Regarding ATTR#3, the reference apartment was preferred, despite its value of 6 for the number of elementary, middle, and high schools within 1 km, which is less than the average 7.79 of the entire profiles. This suggests that ATTR#3 had a relatively low weight in survey respondents’ preferences. For ATTR#6, the number of rooms, the top 5 had a higher value than the overall average in Seoul, but no difference was confirmed based on the embedding distance. ATTR#8 is the distance to the nearest park. The reference apartment had a lower value (closer to the parks) than the entire Seoul area, but no relationship was found between changes in the embedding distance and the value.
Table 4 shows top 5 housing profiles which have close embedding distance to the reference.
In sum, in the demonstration, the preference for the reference apartment may be linked to other apartments that are close to the subway station, have a large area, have a large number of bathrooms, and are worth investing in.

7. Conclusions

To build SeoulHouse2Vec, an embedding-based recommendation system, a demonstration was conducted by creating housing profiles, conducting preference surveys, constructing, validating and evaluating a model, and presenting two scenarios. The significance and contributions of the study are highlighted below.
  • Sustainability in architecture, previous research focused on the use of energy-efficient materials, designing high performance building envelop and optimizing HVAC operation, etc. Unlike previous research, this study is meaningful in that it investigates the rational use of limited housing-related goods. Given that the consumption and supply of housing utilizes limited land and spatial resources, both consumption and supply are closely related to sustainability, which has long-term personal, social, and environmental impacts. Moreover, it may not be possible to revise or reverse the decision. This study suggested the feasibility of using a recommender system to support rational decision making in both housing consumption and supply.
  • Even with the fact that housing supply ratio in Seoul is about 95%, housing prices are rapidly increasing as of late. To address this in terms of massive housing supply, policymakers are discussing the lifting of the greenbelt zones where development has been restricted over the years. While there are various causes of steep rises in the prices, the model proposed in this study has one potential technique to solve problems known to prevent the housing market from functioning rationally, including imbalanced information between housing consumers and suppliers, rather hasty housing decision based on consumers’ biased information, and the limited exploration of the alternatives.
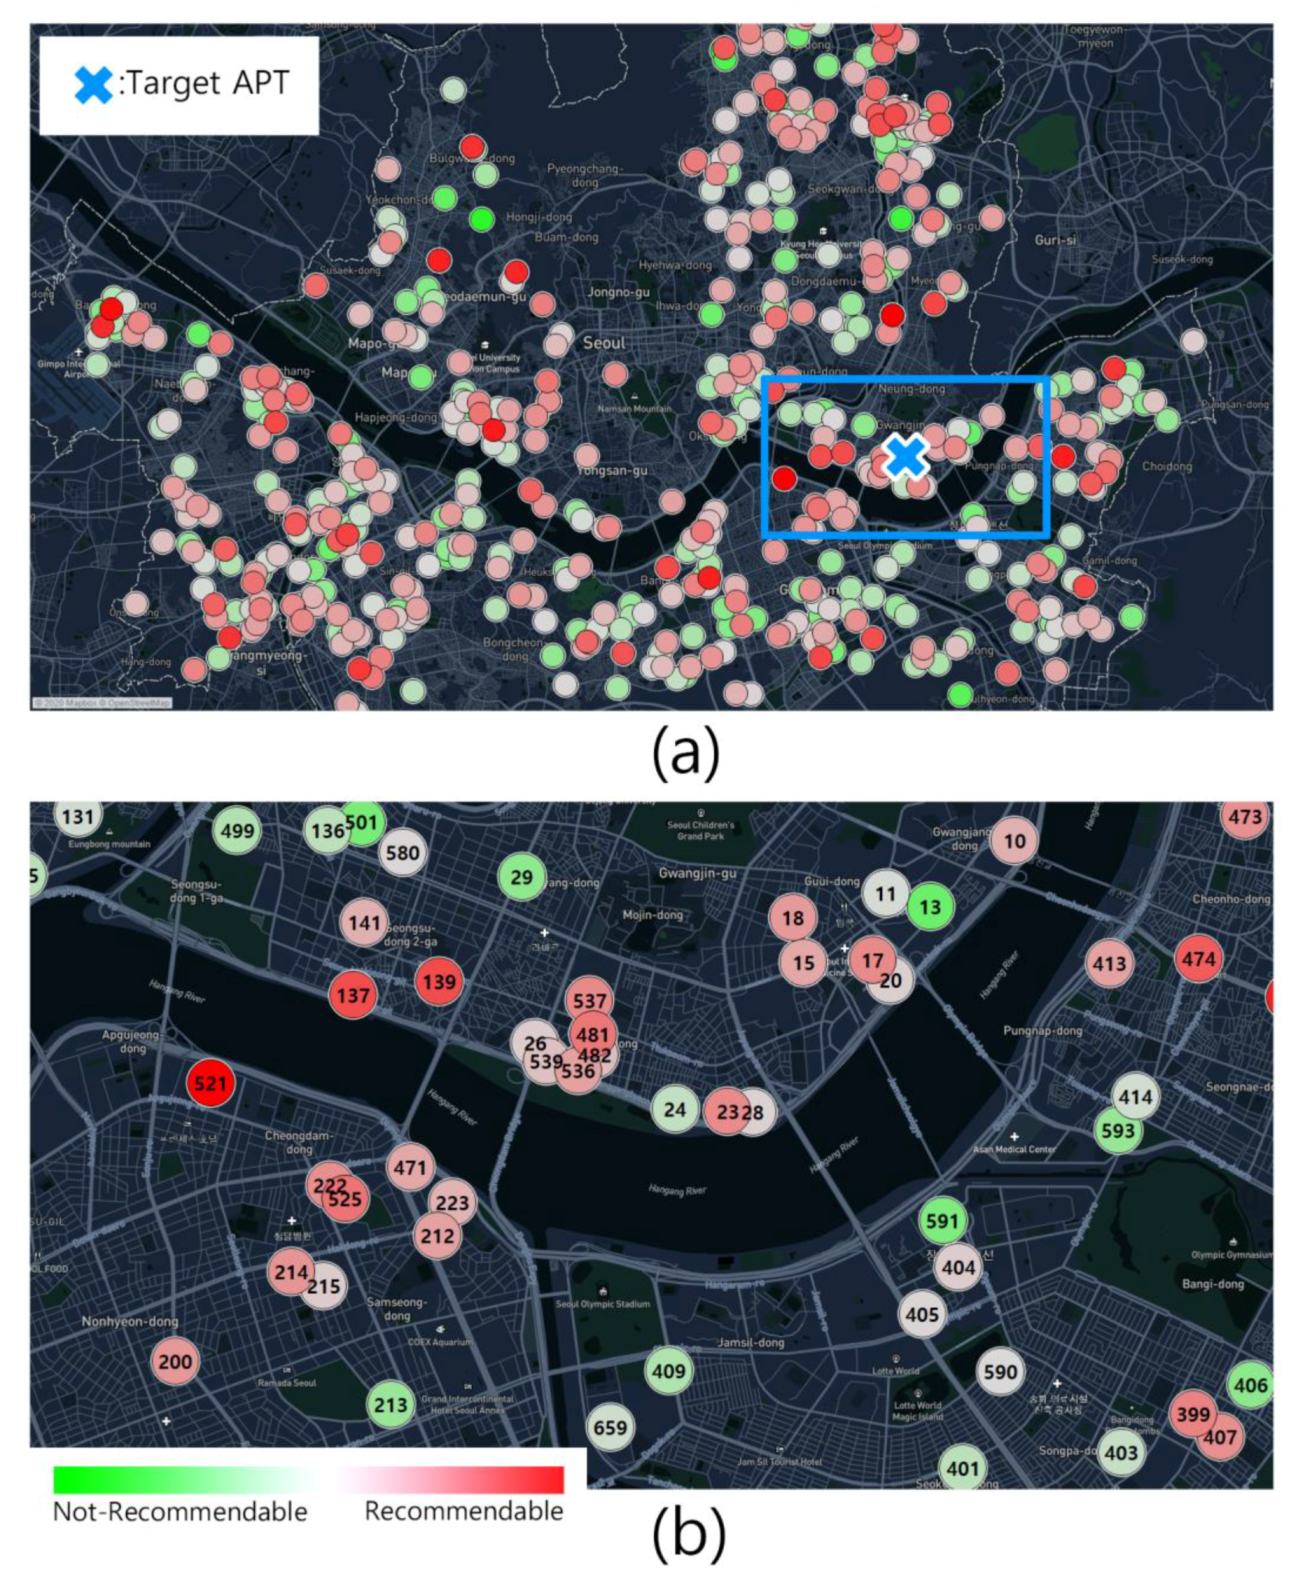
  • From the user’s viewpoint, the scope of existing housing alternative searches was limited to the local scope of dong or gu (district). However, the SeoulHouse2Vec model proposed in this study is significant in that it extends the search scope for housing alternatives from the previous dong to the entire Seoul area by utilizing public big data and GIS data.
  • If Seoul’s regional scope is expanded through data mining and web crawler technology to collect alternatives throughout Gyeonggi-do and South Korea, it will be possible to apply a further expanded model.
  • The SeoulHouse2Vec model provides one possibility of assessing the outcome of past housing decision-making. If the level of housing satisfaction is higher than the current one, certain alternative with the attributes similar to the current one can be presented. Conversely, if the current housing satisfaction level is low, an alternative with the opposite attributes, one whose embedding distance is far, may be prioritized. This will help support the current housing decision-making process by quantitatively analyzing and reflecting the past decision-making process. This may be particularly useful for users who have little experience and knowledge in searching for housing alternatives.
  • SeoulHouse2Vec has the potential to track the user’s decision-making process, analyze preferences, and support the architect’s planning and initial design stage. It is now becoming increasingly important to reflect users’ perspective in architectural planning and design. This is an important factor not only in design quality, but also in determining the market price of buildings. Currently, the architectural planning phase involves analyzing the requirements of prospective users and contractors, and relying on the architect’s knowledge, experience, and intuition to generate the information necessary to proceed with the design process. The model proposed here includes user information on age, income, and housing tenure type; housing profile information related to housing attributes; and preference information, which is the relationship between the user and the alternatives. The dataset may provide a quantitative basis in the architectural decision-making process.
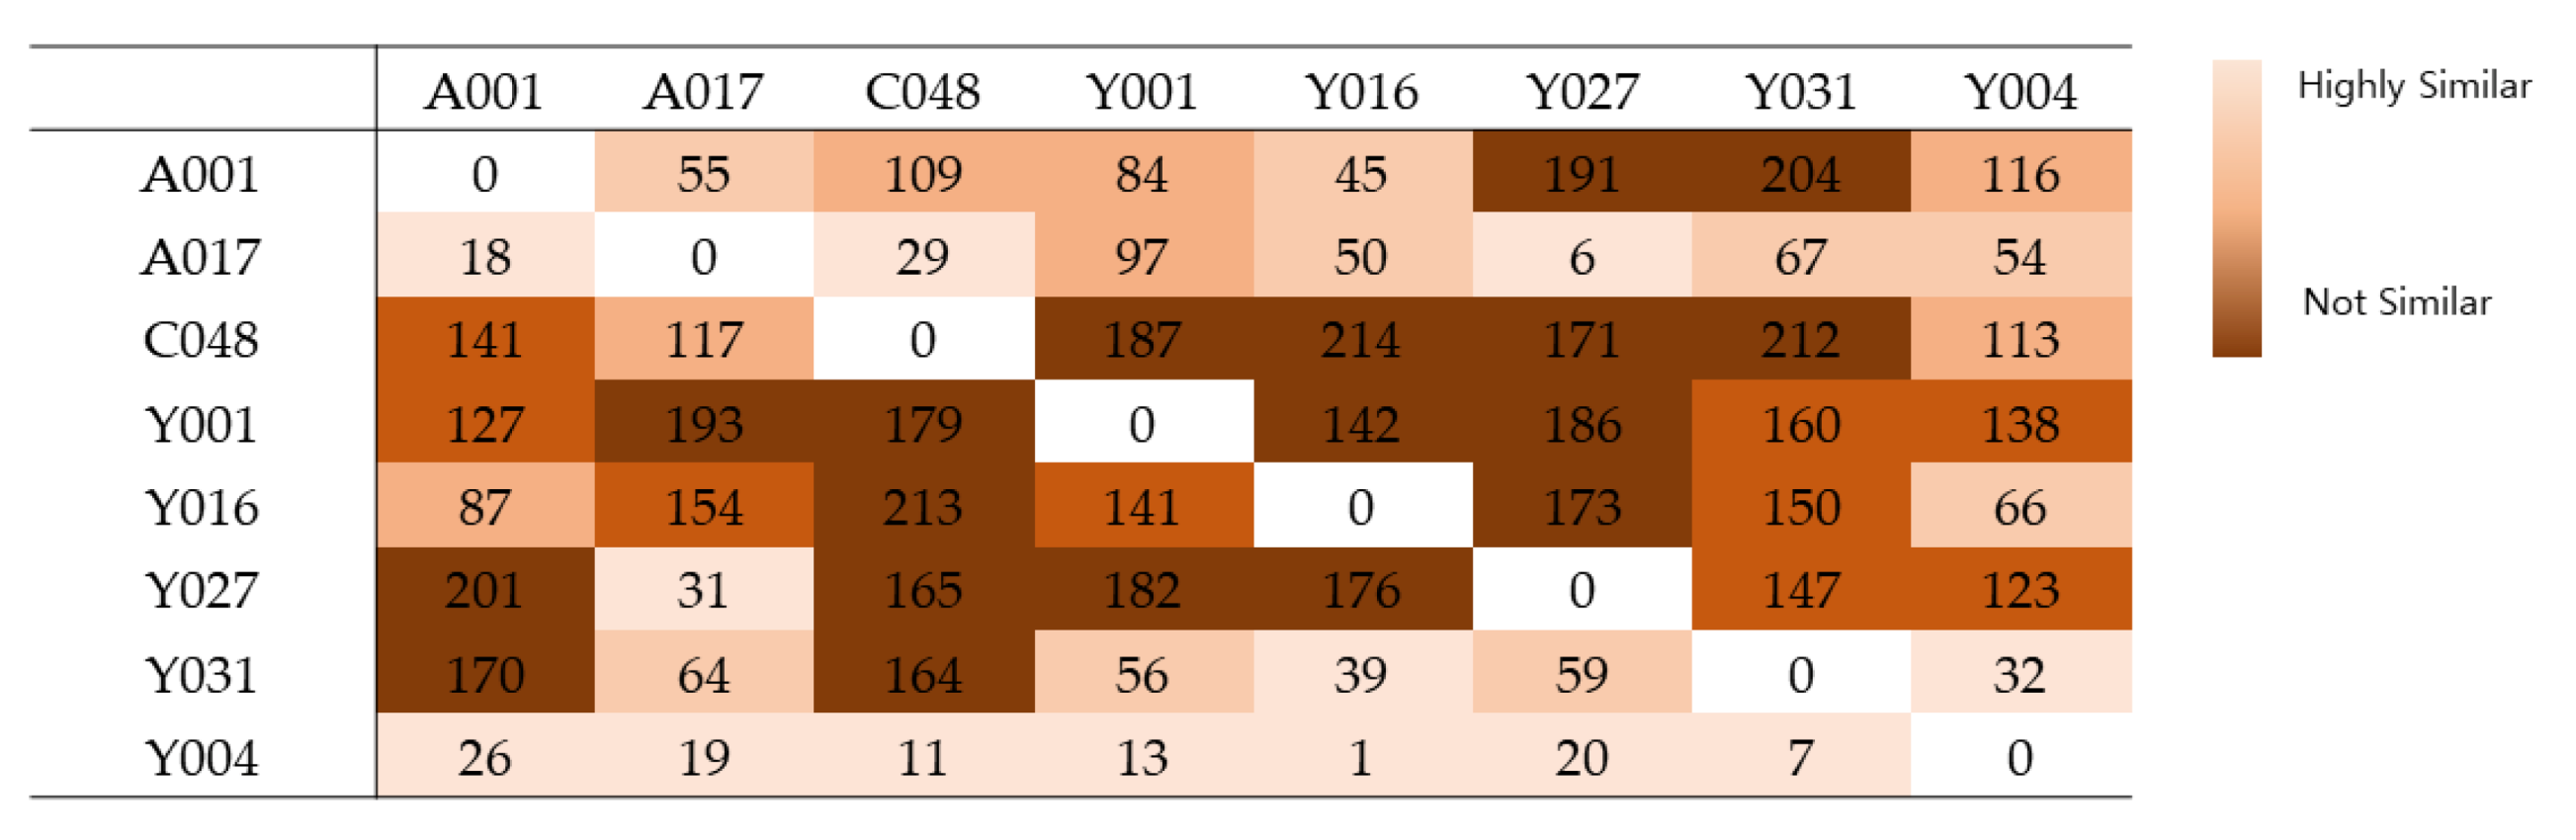
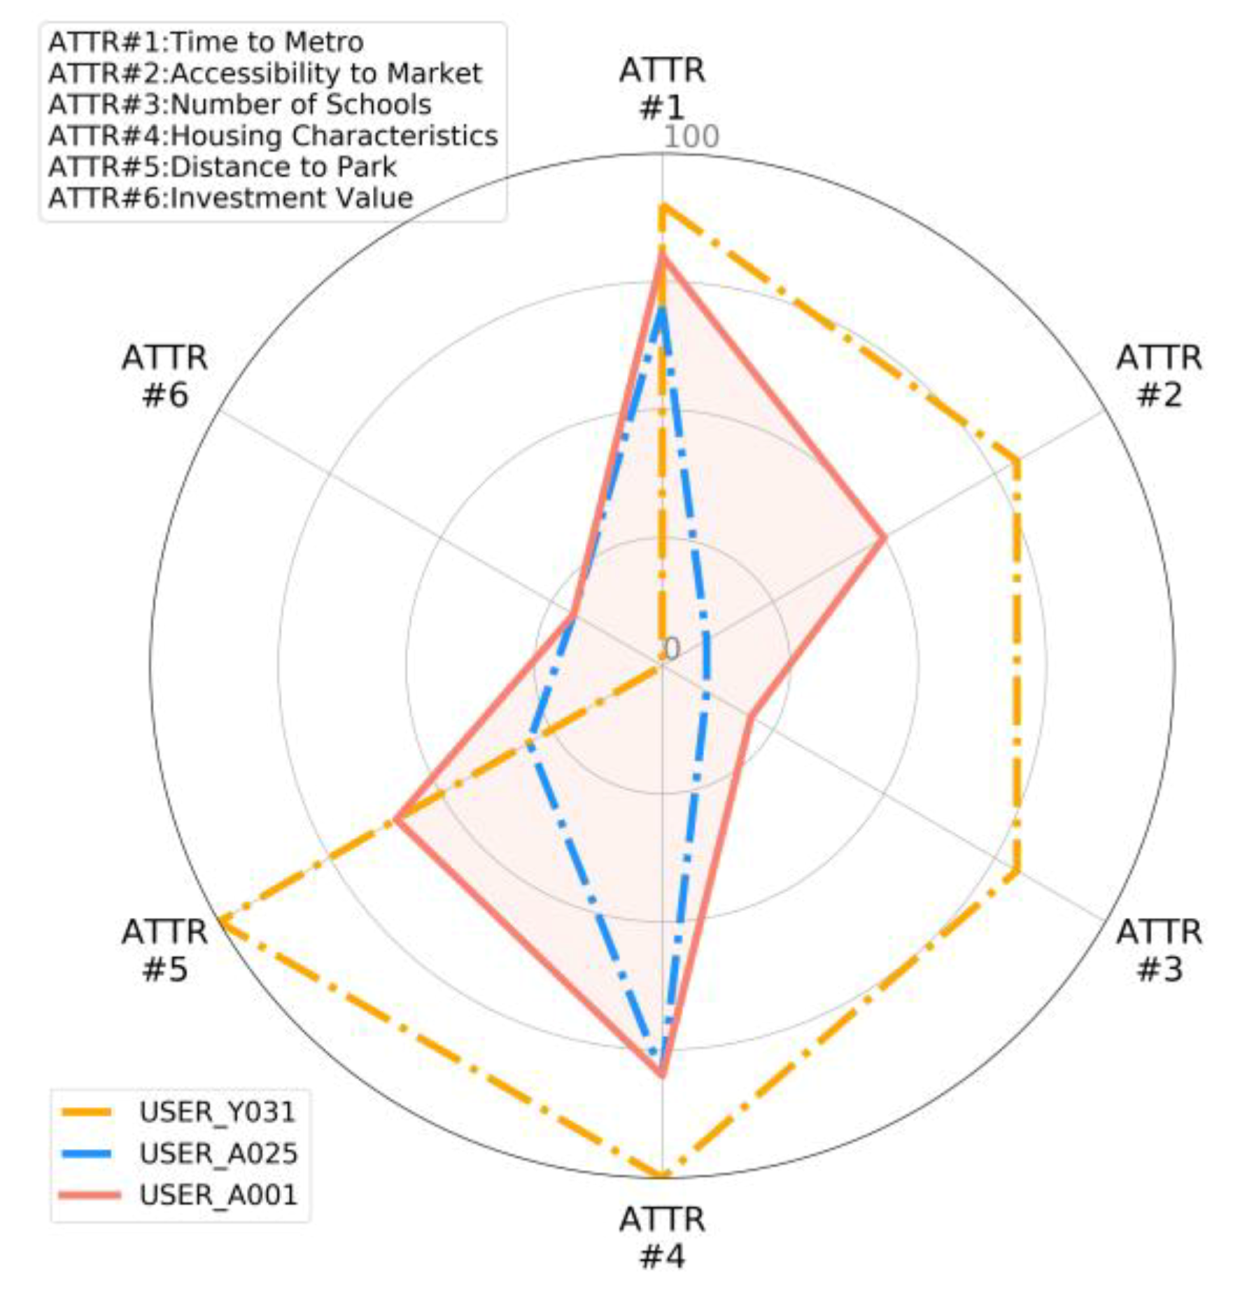
  • The SeoulHouse2Vec model not only measures users’ housing preferences based on demographic attributes, but users with divergent demographic characteristics may also have highly similar housing preferences depending on the importance of each preference variable. Even in groups with matching demographic characteristics, housing choice may vary depending on how significant respondents consider each variable. This preference tendency can be reflected through the embedding method.

Author Contributions

Conceptualization, H.J.J., D.Y.R. and S.W.C.; methodology, S.W.C.; software: J.H.K. and S.W.C.; validation, J.H.K. and D.Y.R., formal analysis, H.J.J., J.H.K. and S.W.C.; investigation, J.H.K.; resources, J.H.K.; data curation, Jaejee Kim and S.W.C., writing original draft preparation, H.J.J., J.H.K., D.Y.R. and S.W.C.; review and editing, H.J.J. and J.H.K.; visualization, H.J.J., J.H.K. and S.W.C.; Supervision, S.W.C.; project administration, H.J.J. and S.W.C.; funding acquisition, H.J.J. All authors have read and agreed to the published version of the manuscript.

Funding

This research was supported by a grant (20AUDP-B127891-04) from the Architecture & Urban Development Research Program funded by the Ministry of Land, Infrastructure and Transport of the Korean government.

Acknowledgments

We would like to express our sincere gratitude to Jingyu Maeng (Hanyang University, School of Architecture, ADCC) for survey data acquisition and arrangements.

Conflicts of Interest

The authors declare no conflict of interest.

References

  1. Korean Statistical Information Service. Population. Available online: https://kosis.kr/visual/populationKorea/PopulationByNumber/PopulationByNumberMain.do?mb=N (accessed on 3 July 2020).
  2. Seoul Metropolitan Government. Seoul Statistics Publication, Statistics Annual Report, 2018 Major Administrative Statics. Available online: https://data.seoul.go.kr/together/statbook/statbookList.do#submenu47 (accessed on 3 June 2020).
  3. Clapham, D. Housing theory, housing research and housing policy. Hous. Theory Soc. 2018, 35. [Google Scholar] [CrossRef] [Green Version]
  4. Sixsmith, A.; Sixsmith, J. Ageing in place in the United Kingdom. Ageing Int. 2008, 32, 219–235. [Google Scholar] [CrossRef]
  5. Mattews, T.; Stephens, C. Constructing housing decisions in later life: A discursive analysis of older adults’ discussions about their housing decisions in New Zealand. Hous. Theory Soc. 2017, 34. [Google Scholar] [CrossRef]
  6. Jeong, S.; Choi, M. A study on the characteristics of eco-generation housing choice. Resid. Environ. 2017, 15, 113–133. [Google Scholar]
  7. Kim, J.H.; Lee, J.S. The effect of apartment environment properties on consumer preference: Conjoint analysis of view quality and park accessibility. Mark. Manag. Res. 2014, 19, 91–109. [Google Scholar]
  8. Van Ham, M. Housing Behaviour, Handbook of Housing Studies; SAGE: Thousand Oaks, CA, USA, 2012. [Google Scholar]
  9. Steglich, W.G. Housing, Family, and Society; Wiley: New York, NY, USA, 1978. [Google Scholar]
  10. Jansen, S.; Coolen, H.; Goetgeluk, R. The Measurement and Analysis of Housing Preference and Choice; Springer: Berlin, Germany, 2011. [Google Scholar]
  11. Earnhard, D. Combining revealed and stated data to examine housing decisions using discrete choice analysis. J. Urban Econ. 2002, 51, 143–169. [Google Scholar] [CrossRef]
  12. Wang, D.; Li, S. Housing preferences in a transitional housing system: The case of Beijing, China. Environ. Plan. A Econ. Space 2004, 36, 69–87. [Google Scholar] [CrossRef]
  13. Seo, D.; Kwon, Y. In-migration and housing choice in Ho Chi Minh City: Toward sustainable housing development in Vietnam. Sustainability 2017, 1738. [Google Scholar] [CrossRef] [Green Version]
  14. Ge, J.; Hokao, K. Research on residential lifestyles in Japanese cities from the viewpoints of residential preference, residential choice and residential satisfaction. J. Landsc. Urban Plan. 2006, 78, 165–178. [Google Scholar] [CrossRef]
  15. Marsh, A.; Gibb, K. Uncertainty, expectations and behavioural aspects of housing market choices. Hous. Theory Soc. 2011, 28. [Google Scholar] [CrossRef]
  16. Molin, E.; Oppewal, H.; Timmermans, H. Predicting consumer response to new housing: A stated choice experiment. J. Hous. Built Environ. 1996, 11, 297–311. [Google Scholar] [CrossRef] [Green Version]
  17. Liao, F.; Farber, S.; Ewing, R. Compact development and preference heterogeneity in residential location choice behaviour: A latent class analysis. Urban Stud. 2015, 52, 314–337. [Google Scholar] [CrossRef]
  18. Park, M.; Hagishima, A.; Tanimoto, J.; Chun, C. Willingness to pay for improvements in environmental performance of residential buildings. Build. Environ. 2013, 60, 225–233. [Google Scholar] [CrossRef]
  19. Cheung, H.; Chung, T. A study on subjective preference to daylit residential indoor environment using conjoint analysis. Build. Environ. 2008, 43, 2101–2111. [Google Scholar] [CrossRef]
  20. Hille, S.; Curtius, H.; Wüstenhagen, R. Red is the new blue—The role of color, building integration and country-of-origin in homeowners’ preferences for residential photovoltaics. Energy Build. 2018, 162, 21–31. [Google Scholar] [CrossRef]
  21. Mansour, O.; Radford, S. Rethinking the environmental and experiential categories of sustainable building design: A conjoint analysis. Build. Environ. 2016, 98, 47–54. [Google Scholar] [CrossRef]
  22. Hoshino, T. Estimation and analysis of preference heterogeneity in residential choice behaviour. Urban Stud. 2010, 48, 362–382. [Google Scholar] [CrossRef]
  23. Mulliner, E.; Algrnas, M. Preferences for housing attributes in Saudi Arabia: A comparison between consumers’ and property practitioners’ views. Cities 2018, 83, 152–164. [Google Scholar] [CrossRef]
  24. Jancz, A.; Trojanek, R. Housing preferences of seniors and pre-senior citizens in Poland—A case study. Sustainability 2020, 12, 4599. [Google Scholar] [CrossRef]
  25. Wang, C.; Lincoln, C.; Liang, H. Housing preference for modern urban designers using fuzzy-AHP. Open House Int. 2018, 43, 33–42. [Google Scholar]
  26. Opoku, R.; Abdul-Muhmin, A. Housing preferences and attribute importance among low-income consumers in Saudi Arabia. Habitat Int. 2010, 34. [Google Scholar] [CrossRef]
  27. Jiang, H.; Chen, S. Dwelling unit choice in a condominium complex: Analysis of willingness to pay and preference heterogeneity. Urban Stud. 2016, 53, 2273–2292. [Google Scholar] [CrossRef]
  28. Goldberg, D.; Nichols, D.; Oki, B.; Terry, D. Using collaborative filtering to weave an information tapestry. Commun. ACM Spec. Issue Inf. Filter. 1992, 35, 61–70. [Google Scholar] [CrossRef]
  29. Su, X.; Khoshgoftaar, T. A survey of collaborative filtering techniques. Adv. Artif. Intell. 2009, 12. [Google Scholar] [CrossRef]
  30. Herlocker, J.; Konstan, J.; Reidl, J. Explaining collaborative filtering recommendations. In Proceedings of the ACM Conference on Computer Supported Cooperative Work, Philadelphia, PA, USA, 2–6 December 2000. [Google Scholar]
  31. Barkan, O.; Koenigstein, N. ITEM2VEC: Neural item embedding for collaborative filtering. In Proceedings of the 2016 IEEE 26th International Workshop on Machine Learning for Signal Processing (MLSP), Salerno, Italy, 13–16 September 2016. [Google Scholar]
  32. Zarzour, H.; Al-Sharif, Z.; Jararweh, Y. RecDNNing: A recommender system using deep neural network with user and item embeddings. In Proceedings of the 10th International Conference on Information and Communication Systems (ICICS), Irbid, Jordan, 11–13 June 2019; pp. 99–103. [Google Scholar]
  33. Ozsoy, M. From word embeddings to item recommendation. arXiv 2016, arXiv:1601.01356. [Google Scholar]
  34. Yang, Z.; He, J.; He, S.A. Collaborative filtering method based on forgetting theory and neural item embedding. In Proceedings of the 2019 IEEE 8th Joint International Information Technology and Artificial Intelligence Conference (ITAIC), Chongqing, China, 24–26 May 2019; pp. 1606–1610. [Google Scholar]
  35. Seoul Metropolitan Government. Seoul Metropolitan Government Housing Status (Housing Type, Occupancy Type, etc.). Available online: https://opengov.seoul.go.kr/data/10565468 (accessed on 3 August 2020).
  36. Seoul Metropolitan Government. Seoul Metropolitan Apartment Information. Available online: https://data.seoul.go.kr/dataList/OA-15818/S/1/datasetView.do (accessed on 3 August 2020).
  37. Resnick, P.; Varian, H. Recommender systems. Commun. ACM 1997, 40, 56–58. [Google Scholar] [CrossRef]
  38. Schafer, B.; Konstan, J.; Riedl, J. E-commerce recommendation applications. Data Min. Knowl. Discov. 2000, 5, 115–153. [Google Scholar] [CrossRef]
  39. Smith, B.; Linden, G. Two decades of recommender systems at Amazon.com. IEEE Internet Comput. 2017, 21, 12–18. [Google Scholar] [CrossRef]
  40. Schafer, J.; Frankowski, D.; Herlocker, J.; Sen, S. Collaborative filtering recommender systems. Adapt. Web 2007, 4321, 291–324. [Google Scholar]
  41. Sarwar, B.; Karypis, G.; Konstan, J.; Riedl, J. Item-based collaborative filtering recommendation algorithms. In Proceedings of the 10th International Conference on World Wide Web 2011, Hong Kong, China, 1–5 May 2001; pp. 285–295. [Google Scholar]
  42. Resnick, P.; Iacovou, N.; Suchak, M.; Bergstrom, P.; Riedl, J. GroupLens: An open architecture for collaborative filtering of netnews. In Proceedings of the 1994 ACM Conference on Computer Supported Cooperative Work, Chapel Hill, NC, USA, 22–26 October 1994; pp. 175–186. [Google Scholar]
  43. Valcarce, D.; Landin, A.; Parapar, J.; Barreiro, A. Collaborative filtering embeddings for memory-based recommender systems. Eng. Appl. Artif. Intell. 2019, 85, 347–356. [Google Scholar] [CrossRef]
  44. Guo, C.; Berkhahn, F. Entity embeddings of categorical variables. arXiv 2016, arXiv:1604.06737. [Google Scholar]
  45. Keras Embedding Layer. Available online: https://keras.io/api/layers/core_layers/embedding/:03 (accessed on 3 August 2020).
  46. Mikolov, T.; Sutskever, I.; Chen, K.; Corrado, G.; Dean, J. Distributed Representations of Words and Phrases and Their Compositionality. Available online: https://papers.nips.cc/paper/5021-distributed-representations-of-words-and-phrases-and-their-compositionality.pdf (accessed on 3 August 2020).
  47. TensorFlow. Available online: https://www.tensorflow.org/ (accessed on 3 August 2020).
  48. Zhang, S.; Yao, L.; Sun, A.; Tay, Y. Deep learning based recommender system: A survey and new perspectives. arXiv. 2019. Available online: https://arxiv.org/pdf/1707.07435.pdf (accessed on 3 August 2020).
  49. Grbovic, M.; Radosavljevic, V.; Djuric, N.; Bhamidipati, N.; Savla, J.; Bhagwan, V.; Sharp, D. E-commerce in your inbox: Product recommendations at scale. In Proceedings of the 21th ACM SIGKDD International Conference on Knowledge Discovery and Data Mining 2015, Sydney, NSW, Australia, 10–13 August 2015; pp. 1809–1818. [Google Scholar]
  50. Kim, Y.; Seo, J. Analysis of residential preference characteristics according to the aging of the baby boomers. Resid. Environ. 2013, 11, 37–49. [Google Scholar] [CrossRef]
  51. Lee, H.; Park, H.; Go, S. A study on the preference of residential environment when purchasing apartments through conjoint analysis. J. Korean Hous. Assoc. 2009, 20, 27–35. [Google Scholar]
  52. Son, J.; Lee, B. A study on the characteristics of apartment housing preference according to lifestyle. Resid. Environ. 2017, 15, 151–161. [Google Scholar]
  53. Kim, T.; Kwon, K.; Choi, E.; Hong, S. A study on changes in housing demand by region through analysis of Gyeonggi-do’s housing satisfaction and preference. Gyeonggi Inst. Basic Res. 2013, 1–113. [Google Scholar]
  54. Ministry of Land, Infrastructure and Transport. Apartment Price. Available online: http://www.realtyprice.kr/notice/main/mainBody.htm (accessed on 3 August 2020).
  55. Ministry of Land, Infrastructure and Transport. Available online: http://www.molit.go.kr/USR/NEWS/m_71/dtl.jsp?id=95082611 (accessed on 3 August 2020).
  56. Ministry of Land, Infrastructure and Transport. Article 3 (1) 1 of the Enforcement Decree of the Korean Housing Act; Ministry of Land, Infrastructure and Transport: Seoul, Korea, 2019.
  57. Ministry of Land, Infrastructure and Transport. Article 3–5 of the Enforcement Decree of the Building Act; Ministry of Land, Infrastructure and Transport: Seoul, Korea, 2000.
  58. Paul, E.; Green, A.; Krieger, M. Conjoint analysis with product-positioning applications. In Handbooks in Operations Research and Management Science: Marketing; Eliashberg, J., Lilien, G.L., Eds.; Elsevier: Amsterdam, The Netherlands, 1993; Volume 5, pp. 467–515. [Google Scholar]
  59. Dyer, J.S.; Fishburn, P.C.; Steuer, R.E.; Wallenius, J.; Zionts, S. Multiple criteria decision making, multiattribute utility theory: The next ten years. Manag. Sci. 1992, 38, 645–654. [Google Scholar] [CrossRef] [Green Version]
  60. Churchman, C.W.; Ackoff, R.L. An approximate measure of value. Oper. Res. 1954, 2, 172–187. [Google Scholar] [CrossRef]
  61. Debreu, G. Topological methods in cardinal utility theory. In Mathematical Methods in the Social Sciences; Arrow, K.J., Karlin, S., Suppes, P., Eds.; Stanford University Press: Stanford, CA, USA, 1960. [Google Scholar]
  62. Dyer, J.S.; Sarin, R.K. Measurable multiattribute value functions. Oper. Res. 1979, 27, 810–822. [Google Scholar] [CrossRef]
  63. Keeney, R.L.; Raiffa, H. Decisions with multiple objectives: Preferences and value tradeoffs; Wiley: New York, NY, USA, 1976. [Google Scholar]
  64. Keeney, R.L. Quasi-separable utility functions. Nav. Res. Logist. Q. 1968, 15, 551–565. [Google Scholar] [CrossRef]
  65. Ahn, J.; Bang, Y.; Pil, S. Consumer preference survey using multi-attribute utility theory. Manag. Inform. Res. 2008, 18, 1–20. [Google Scholar]
  66. Statistics Korea, Population and Household. Available online: https://kostat.go.kr/portal/korea/kor_nw/1/2/4/index.board?bmode=read&bSeq=&aSeq=380351&pageNo=1&rowNum=10&navCount=10&currPg=&searchInfo=srch&sTarget=title&sTxt=2019 (accessed on 3 August 2020).
Figure 1. Research overview.
Sustainability 12 06964 g001
Figure 2. Data description of the acquired 679 housing profiles based on the six attributes.
Sustainability 12 06964 g002
Figure 3. Acquired questionnaire data description (a) by age, (b) monthly household income, (c) housing tenure type, and (d) rating.
Sustainability 12 06964 g003
Figure 4. Model structure and the data flow.
Sustainability 12 06964 g004
Figure 5. Relationship between the supervised-learning and embedding-based recommendation process.
Sustainability 12 06964 g005
Figure 6. Model training: Accuracy and loss change over 300 epochs—(a) accuracy and (b) loss.
Sustainability 12 06964 g006
Figure 7. Change of vector values over the training epoch—(a) housing and (b) users.
Sustainability 12 06964 g007
Figure 8. Concept of confusion matrix, precision, recall, and f1_score.
Sustainability 12 06964 g008
Figure 9. Model evaluation: Confusion matrix of models (a) (100, 50) and (b) (200, 50).
Sustainability 12 06964 g009
Figure 10. Embedding ranking of users with identical socio-demographic attributes.
Sustainability 12 06964 g010
Figure 11. Spider diagram for comparing relative importance of the housing attributes among the users.
Sustainability 12 06964 g011
Figure 12. Geographic visualization of the housing profiles based on the embedding distance: (a) geographical range: Seoul, (b) geographical range: Gwangjin-gu.
Sustainability 12 06964 g012
Table 1. Literature review of the housing attributes for the housing preference in South Korea.
Reference Research PurposeResearch MethodHousing Preference Variables
[6]Explores important factors of newly married eco boomers’ house selectionMultiple linear regression analysisHousing location, housing facilities, eco-friendliness, educational environment, living convenience, residential safety, residential status, economic power, family
[53]Investigates lifestyle demographic characteristics and analyzes the effects on characteristic factors of apartment housing preferencePearson correlation, regressionLocation of educational facilities, location of commercial districts, apartment exterior, apartment functions, community within the complex, interior design, interior, indoor function, privacy, storage space
[51]Studies the influence of view quality and park accessibility on consumers’ apartment preference to determine implications for revitalizing apartment marketingConjoint analysisView, size, park accessibility, apartment prices, brand awareness
[42]Identifies factors to consider in future housing policies and explains differences in housing demand by regionBinary/multiple logistics regressionHousing size, housing facility level, noise, odor, management status, green area facility, convenient facility within complex, air and water quality, surrounding facilities, cultural performance facilities, public transportation convenience, security, access to major facilities, neighborhood parks, children’s educational conditions, management costs, relationship with local residents, housing investment value
[50]Establishing future housing policies and marketing strategies based on the housing preferences of baby boomersTechnical statistics and cluster analysisSocial factors (leisure activities, relationships with friends and neighbors, composition and community level of neighbors), location factors (ease of use of elderly services, safety, cleanliness of surrounding area), personal factors (physical function, distance from children), physical factors (housing style, housing size), economic factors (housing price/rent, housing costs)
[51]Providing predictive data to meet the diverse needs of consumers and improve their residential valueConjoint analysisPrice per 3.3 square meters, housing characteristics, complex characteristics, location, investment value
Table 2. Nine housing attributes used to create the housing profiles.
No.ItemCriterion (unit)
ATTR#1Time to MetroWalking distance to the nearest subway station (minute)
ATTR#2Accessibility to MarketDistance to the nearest supermarket (meter)
ATTR#3Number of SchoolsNumber of educational facilities within 1 km
ATTR#4Housing PricePrices of the created profiles (10,000 KRW)
ATTR#5Housing AreaHousing area (m2)
ATTR#6Number of RoomsNumber of rooms excluding living rooms and kitchens
ATTR#7Number of BathroomsNumber of bathrooms
ATTR#8Distance to ParkDistance to the nearest park (meter)
ATTR#9Investment valueRanked in top 10 construction capacity (yes/no)
Table 3. Comparison of the housing attributes based on the embedding distance to the reference: Top 50, top 25, top 10, and top 5 closest.
ATTR#1ATTR#2ATTR#3ATTR#5ATTR#6ATTR#7ATTR#8ATTR#9
Total11.231870.407.7983.873.091.71233.280.42
Reference716006138.85421000
Top 5012.721876.067.687.783.181.8262.780.48
Top 2512.121949.326.6884.873.081.84256.280.44
Top 1011.502137.87.185.2431.8254.90.7
Top 55.426808.696.963.21.8258.20.6
ATTR#1: time to metro, ATTR#2: accessibility to market, ATTR#3 number of schools, ATTR#4: housing price, ATTR#5: housing area, ATTR#6: number of rooms, ATTR#7: number of bathrooms, ATTR#8: distance to park, ATTR#9: investment value.
Table 4. Top 5 recommendable housing profiles.
Distance(Closest)Profile (Gu, Dong, and Apartment Name)
1stDongdaemun-gu, Jangan-dong, Raemian Jangan 2-Cha
2ndGangnam-gu, Apgujeong-dong, Hanyang 3
3rdGangseo-gu, Banghwa-dong, Banghwa 3-Danji
4thMapo-gu, Yonggang-dong, Mapo Yongang Samsung Raemian
5thGangdong-gu, Cheonho-dong, Raemian Gangdong Palace

