Article

Does Adoption of Soil and Water Conservation Practice Enhance Productivity and Reduce Risk Exposure? Empirical Evidence from Semi-Arid Tropics (SAT), India

1
Indian Council of Agricultural Research, Indian Agriculture Research Institute, New Delhi 110012, India
2
Indian Council of Agricultural Research, National Institute of Agricultural Economics and Policy Research, New Delhi 110012, India
*
Author to whom correspondence should be addressed.
Sustainability 2020, 12(17), 6965; https://doi.org/10.3390/su12176965
Submission received: 15 June 2020 / Revised: 13 July 2020 / Accepted: 21 July 2020 / Published: 27 August 2020
(This article belongs to the Section Sustainable Agriculture)

Abstract

:
This paper assessed the impact of soil and water conservation practices on farm productivity and risk exposure using data from 1204 plots in the semiarid tropics of India. A probit model was used to assess the determinants of adoption of soil bunds. We employed a moment-based approach for estimating crop revenue, its variability and downside risk exposure, i.e., crop failure. Furthermore, we also used a doubly robust method for assessing the impact of soil bunds on crop revenue, its variability and downside risk. Matching and propensity-based methods were also used to check robustness. The results show that training, access to credit and extension services are key determinants of adoption of soil bunds. Furthermore, the results also suggest that soil bunds not only improve the crop revenue but also reduce its variability. Most interestingly, we show that soil bunds also reduce the chances of downside risk, i.e., crop failure. Therefore, in view of increasing climate change and variability in the semiarid tropics, it can be suggested that soil bunds could be an important adaptation strategy for improving productivity and reducing risk exposure. This paper supports the investment in soil and water conservation technologies for sustaining the livelihood of resource-poor farmers of ecologically fragile regions such as the semiarid tropics.

1. Introduction

The negative impacts of climate variability and change on agriculture are being witnessed all over the world, particularly in the countries like India, which is highly vulnerable because of its high dependence on agriculture and excessive pressure on natural resources [1,2]. Rainfed agriculture, which accounts for 67% of the net sown area, contributing 44% of food grains and supporting 40% of the population, is highly vulnerable to climate variability and change. Its high vulnerability can be attributed to fact that rainfed agriculture suffers numerous climatic (low and erratic rainfall, extreme rainfall variability, occurrence of unpredictable droughts, high temperatures), biophysical (land degradation, poor soil fertility) and socioeconomic constraints (inadequate infrastructure, high population pressure, high levels of poverty, low levels of input use and technology adoption, resource-poor farmers and inadequate credit availability, etc.) adversely affecting the productivity of the farming system [3,4]. Moreover, it is projected that the frequency of extreme weather, particularly droughts, is increasing [2,5]. However, sustaining crop production in rainfed areas is of critical importance to maintain India’s food security [6] since even after achieving full irrigation potential, nearly 50% of the net cultivated area will remain dependent on rainfall [7]. In the SAT (semiarid tropics) region, variability of rainfall is a principal source of production risk [8]. Production risk in the form of crop failures is a major barrier to making rainfed agriculture sustainable. Moreover, the incidence of crop failure is on the rise as the frequency of droughts over the years has been on the rise in the semiarid areas. Production risks influence agricultural production decisions, particularly a farmer’s technology adoption decisions [9,10], and can worsen the sustainability of crop production systems through their downside (crop failure) effects [9,11]. Farmers understand the risks and uncertainties of production risk and try to manage it by taking up appropriate practices, including soil and water conservation measures. In this regard, empirical evidence shows that farmers are risk-averse [12], suggesting that suitable technologies can help in reducing farmers’ exposure to production risk. Furthermore, there is evidence that most of the farmers exhibit decreasing absolute risk-aversion [13]. This implies that farmers are averse to “downside risk” [14], implying that farmers are especially averse to being exposed to unexpectedly low crop yields or returns.
To improve the productivity, stabilize the yields and to reduce the chances of crop failures, soil and water conservation (SWC) practices are considered one of the key strategies. Moreover, in the rainfed areas, SWC practices are crucial to sustain crop production in view of growing water shortages, deteriorating soil health and increasing incidence of drought and desertification, and also to moderate the negative effects of climate change and variability [15]. The common in situ moisture conservation practices for the region are broad beds and furrows, contour bunding, graded bunding, compartment bunding, ridges and furrows, tied ridging, contour cultivation, set-furrow cultivation, etc. [16,17,18]. Among these measures, contour bunding is the most widely practiced soil conservation measure in the semiarid tropics in India having medium- to low-rainfall areas (<700 mm) and on permeable soils with <6% slope [16,19]. Bunding helps in reducing the soil loss and runoff and improving the soil moisture, which in turn leads to higher productivity [20,21]. Keeping this in view, soil bunds or bunding was chosen for detailed investigation in this paper. This is an earthen embankment constructed on a contour to intercept runoff and hold the rainwater for conserving soil moisture.
A substantial literature has examined the impact of SWC practices on productivity, but very few studies attempted to examine the impact of SWC practice adoption on crop yield variability and downside risk exposure, i.e., crop failure. Most importantly, the influence of SWC practices on downside risk exposure (on the probability of crop failure) remains poorly explored in the rainfed areas [13]. To fill this research gap, this paper investigates how adoption of soil and water conservation practices, i.e., soil bunds, can contribute to improving farm productivity and how it affects the variability of crop production/yields and the risk of crop failure. In addition, the paper also identifies the key determinants of adoption of soil bunds. The paper employed the probit model for explaining the factors affecting the adoption behavior of soil bunds. For assessing the impact of soil bunds on the crop revenue, variance and skewness, inverse-propensity-weighting regression adjustment (IPWRA) is used as a main method. Furthermore, IPW (inverse propensity weighting) and propensity score matching (PSM) approaches (coarsened exact matching, optimal and nearest-neighbor matching) were used to confirm the robustness of the results. We followed the moment-based approach for estimating the mean-variance and skewness of crop revenue using the plot-level data. This paper will provide useful insights for policy makers for improving the adoption of SWC practices and also provide empirical evidence of how SWC not only sustains crop production in drought-prone semiarid areas and in degraded lands, but also it could be instrumental in reducing the risk exposure, which is expected to be increasing in view of increasing climate variability and droughts.

2. Materials and Methods

2.1. Data and Sampling Procedure

We collected data from 530 households and 1204 plots, of which 44.4% and 55.8% of farmers were adopters and nonadopters, respectively. Karnataka is a state in the southwestern part of India, which is one of the most drought-prone areas of the country. Around 77% of the area of the state is arid and semiarid, facing severe climatic and resource constraints. The occurrence of drought is common [22], and rainfall is less than 750 mm per annum, which is also erratic and uncertain, with higher spatial and temporal variability. In the region, most of the farmers are resource-poor, having limited capacity to invest in soil and water conservation. Consequently, the region is in the grip of a vicious circle of land degradation, hunger, and poverty. The region having drought-prone districts of the Karnataka state was purposively selected. Then, from the drought-prone districts, four districts (Tumkur, Bidar, Koppal and Gadag) were randomly selected; then, from each selected district, two subwatersheds were again randomly selected. From each selected subwatershed, adopters, and from the adjacent area, nonadopters were chosen for detailed survey. With the help of a pretested and well-structured questionnaire, plot-level data on soil and water conservation practices, socioeconomic and physical characteristics and institutional aspects were collected.

2.2. Analytical Tools

Econometric Model of Adoption of Soil Bunds

The plot having soil bunds was assumed as an adopter or a nonadopter otherwise. For each plot, i th , the latent variable y * was assumed to be a linear function of the vector of observable household, plot and institutional characteristics as follows:
y i * = β Z i + ε i
where β is the coefficient vector, ε i is a random error term and Z i is the set of explanatory variables. The linkage between y i * and y i is as follows:
y i = { 1 ,   i f   y i * > 0 0 ,   i f   y i * < 0
Then, the probability of adoption of soil bunds is given by
P r o b [ y i * = 1 ] = P r o b [ y i * > 0 ]
= P r o b [ β Z i + ε i > 0 ]
= 1 P r o b [ ε i   β Z i ]
= F ( β Z i )
where F ( . ) is the cumulative distribution function (CDF) of the error term ε i . We assume that ε i follows the standard normal distribution, and the above equation was estimated by probit regression.

2.3. Choice of Explanatory Variables Used in Probit Model

Drawing upon the literature on technology adoption and particularly on the adoption of SWC measures [23,24,25,26,27], the required variables for the paper were chosen. Adoption of SWC practices is determined by synergic and interactive effects of numerous socioeconomic factors, availability and access to financial and capital resources, physical features of the land/plot and institutional support. Accordingly, factors determining adoption of SWC practices can be categorized into groups: (a) household-specific characteristics, (b) economic and institutional factors and (c) biophysical/plot-level feature characteristics. Following this, we also collected the plot-level information on variables relating to household-specific characteristics, viz., age, education, family size, farm assets, livestock, size of landholding and off-farm income. In view of results from previous studies, we hypothesized that older farmers would have a higher likelihood of taking up SWC practices [26,28,29]. The level of education was measured in terms of the number of schooling years, and we expected a positive effect on the adoption of SWC practices. This is due to the fact that better education helps in developing a better understanding relating to detrimental consequences of soil erosion and land degradation, and it also facilitates and improves access to information and technologies. Most importantly, it brings about a desirable change in attitude and behavior about conserving natural resources [30,31,32]. Soil and water conservation measures are highly capital-intensive; therefore, adoption of these practices is inadequate in scale and intensity (rate of adoption and its intensity) due to financial hardships and liquidity constraints, which are common in the SAT region, as a majority of farmers are resource-poor. Therefore, we also included variables such as access to credit and off-farm income. Taking indications from earlier studies [33], we supposed that access to credit will have a positive impact on adoption by overcoming financial constraints. Furthermore, we believed that having a source of off-farm income will also affect positively the adoption of SWC practices. Size of landholding is often used a proxy for farm income and wealth, indicating relatively higher capacity to invest in SWC measures. It was reported to have a positive effect on the adoption of conservation measures [28,29,34]. Another set of explanatory variables is pertaining to physical features of the plot/land, viz., slope, soil erosion and fertility levels. It was reported that the higher the slope of the plot, the higher the probability of adoption since steeper slopes are more prone to soil erosion [35,36]. Furthermore, it was noticed that higher soil erosion also had a positive association with the taking up of SWC measures [23,37]. This can be attributed to the fact that soil erosion is greater on the plots having higher slopes, and soil erosion removes the top layers of soils [36], leading to a decline in the productive capacity of the soil [24,38]. Extension service is measured in terms of the number of visits of farmers to local extension agencies such as KVKs and RSKs (KVK and RSK stand for the Krishi Vigan Kendra (Farmer Science Centre) and Raita Sampark Kendra (Farmer Contact Centre), which are involved in agricultural extension services). We believed that if farmers are in contact with extension service centers, then they have more access to information and advisories about soil and water conservation and their expected benefits [29,39]. Use of such services also helps in developing a better understanding of potential consequences of soil erosion [40]. A positive impact of extension services was reported by many researchers [24,28,29,31]. Lack of technical support negatively affects the adoption of conservation measures [28,41]. We supposed that training of farmers has a positive influence on the adoption. If farmers participate in training on SWC measures, then they are expected to have more technical knowledge about the use and implementation, leading to a higher probability of adoption. Social capital is critical as far as adoption of agricultural innovations is concerned [42]. It encourages cooperative behavior, reduces transaction costs, and facilitates information sharing [43,44]. We tried to measure the social capital in the form of interaction and its perceived usefulness and supposed a positive effect on adoption.

2.3.1. Econometric Model of Mean Yield, Risk and Downside Risk

Following Antle (1983), we used a moment-based approach that allows a flexible representation of the production risk [11]. This approach has been widely used in agricultural economics to model production risk [13,45]. A moment-based approach (the mean-variance-skewness analysis) was used in a number of studies pertaining to production risk [45]. We wanted to estimate the impact of soil and water conservation practices, i.e., soil bunds, on crop revenue as well as on risk exposure. Since data was from different crops, to see the impact of soil and water conservation practices on farm performance, we used crop revenue as an indicator of farm performance instead of crop yield. Risk was measured by the second central moment (variance) and third central moment (skewness) of the error distribution of crop revenues after controlling for differences in inputs, household and plot-level features. The flexible moment-based production function divides the variation in revenue into two parts. First, differences in inputs and other observable characteristics explain part of the variation in revenue, which is the mean effect of the explanatory variables on revenue. Second, the unexplained variation of revenue (the error distribution) is modeled as an economic structure reflecting the riskiness of agricultural production [11,46]. The distribution error of the revenue function provides relevant information for analyzing farmers’ risk exposure. Skewness measures the extent of farmers’ downside risk exposure (i.e., crop failure) by distinguishing unexpected bad and good events, which cannot be done by variance [45]. However, we used both variance and skewness as measures of risk exposure. An increase in skewness implies a reduction in downside risk exposure, which implies, for example, a reduction in the probability of crop failure. We preferred the moment-based approach because it imposes relatively fewer restrictions than the conventional production function specifications [11]. Since we had different crops (maize, sorghum, ragi and redgram), we estimated the net revenue function. Here, net revenue is gross income over the variable cost. Thus, net revenue is defined as follows:
Net revenue = Gross income (yield × price) − variable cost (cost of inputs).
Furthermore, the net revenue function is defined as
R = f 1 ( X β , Z α , D γ ) + μ 1
where R is net revenue, measured in INR (Indian National Rupee) per ha, X is input expenditure (INR per ha), Z includes socioeconomic and plot-level features and D is a dummy variable indicating adoption of soil bunds. β , α and γ are parameters to be estimated.
ε 1 ^ = R f 1 ( X β ^ , Z α ^ , D γ ^ )
where ε 1 ^ is the residual estimated from Equation (7).
Then, estimated residuals are used to estimate higher-order moments of production:
( ε 1 ^ ) j = E [ R f 1 ( X β ^ , Z α ^ , D γ ^ ) ] j + v j ; j = 2 , 3
For the estimation of the mean net revenue equation, different alternative functional specifications, viz., linear-log, quadratic, Cobb–Douglas and translog-log, were estimated. Then, the econometric performance of each specification was evaluated using Akaike’s information criterion (AIC) and the Bayesian information criterion (BIC). Accordingly, among these, the best model was used for analysis. Following Judge et al.’s (1988) procedure [47], in the first step, we estimated the mean function using ordinary least squares (OLS); in the second step, we predicted the residuals and then constructed squared residuals; and in the third step, we used the squared residual as the dependent variable for the variance function estimation using OLS. If the coefficient in the variance function is positive, it implies risk-increasing effects, and conversely, a negative coefficient implies a risk-decreasing effect of the input on outcomes. Similarly, the skewness equation was estimated by taking the cube of the residuals. In the skewness equation, a positive coefficient indicates that the distribution is positively skewed. In other words, it indicates a reduction in the downside risk, i.e., crop failure.

2.3.2. Impact Estimation Technique

Assuming the axiom of rationality, given resource constraints, a farmer will adopt soil bunds in the plot if it leads to higher revenue than cost. Therefore, it is assumed that a profit-maximizing farmer will adopt a technology/practice if expected net utility from adopting ( U i A ) is higher than that from nonadoption ( U i N A ). In other words, a farmer adopts if the expected net utility is greater than zero ( U i = U i A U i N A > 0 ) . In order to estimate the impact of soil bund technology adoption on a farmer’s outcome, we estimate it as
Y i = β 0 + γ D i + β X i + α Z i + μ i
where Y i denotes the different dependent variables (net revenue, variance and skewness); D i is the binary variable taking the value 1 if a plot has soil bunds and 0 otherwise; Z is a vector of farm-level socioeconomic and plot-level characteristics and institutional variables, which are expected to influence the outcomes; X is input variables; and μ i captures the error terms. The results of OLS estimation of the above equation will be inconsistent and biased, as adoption of soil bunds is endogenous. Furthermore, when we use nonexperimental data, wherein individuals choose their adoption rather than being randomly assigned, this introduces self-selection bias. This is due to the fact that adoption of soil bunds may be strongly correlated with observable farm, plot and institutional features. Therefore, self-selection must be accounted for while estimating the impact of adoption of soil bunds. Additionally, there is a problem of missing data since the counterfactual outcomes cannot be observed. Furthermore, unobservable characteristics of the farmers, such as managerial skills, may influence households’ decisions to adopt the technology as well as their outcomes, resulting in inconsistent and biased estimates.
In a regression approach (RA), the average treatment effect on the treated (ATT) is estimated as
A T T = E [ Y i ( 1 ) Y i ( 0 ) | D i = 1 ]
where Y i ( 1 ) is the unit of outcome when the i t h individual has adopted ( D i = 1 ) the SWC practice and Y i ( 0 ) is the unit of outcome when the i t h individual has not adopted ( D i = 0 ) the SWC practice. This represents the calculated effect of taking into consideration only the units that received treatment. In regression adjustment (RA), two separate regression analyses ( μ 0 ( x ) when D i = 0 and μ 1 ( x ) when D i = 1 ) were employed, each for treatment level, and then averages of predicted outcomes were used for estimating the ATT. Wooldridge (2010) suggested that a combination of the RA with the propensity score, that is, IPWRA. The IPWRA estimator has a “double robust” property because it combines the regression adjustment (RA) and the inverse probability weighting (IPW) estimators [48]. The IPWRA estimator simultaneously estimates treatment and outcome equations to account for selection bias. It uses weighted regression coefficients to compute treatment effects, and the weights used are inverse probabilities of treatment [48]. The IPWRA estimator estimates the impact of adoption of SWC practices in the following three steps:
(1) Let us say the outcome model for SWC practice adoption is specified as a linear regression function of the form Y i = α i + β i X i + ε i ; i = { 0 , 1 } and the propensity scores estimated using probit regression P ( X , Y ^ ) .
(2) In the second step, linear regression is employed to estimate the parameters ( α 0 , β 0 ) and ( α 1 , β 1 ) using inverse-probability-weighted least squares as follows:
min α 0 , β 0 [ i N ( Y i α 0 β 0 X i ) P ( X , Y ^ ) ]   if   D i = 0 .
min α 1 , β 1 [ i N ( Y i α 1 β 1 X i ) P ( X , Y ^ ) ]   if   D i = 1
(3) The third step involves calculating the average treatment effect on the treated (ATT) by
min α 1 , β 1 [ i N ( Y i α 1 β 1 X i ) P ( X , Y ^ ) ]   if   D i = 1
The IPWRA approach, being doubly robust, was treated as the main estimation approach; additionally, other approaches, namely, matching approaches and IPW, were also used to assess the impact of SWC practices to check the robustness of findings. For analysis, the packages, namely, PSweight [49], WeightIt [50], Matching [51] and MatchIt [52] were used in R-3.6.3.

3. Results and Discussion

3.1. Descriptive Summary of the Variables

The average age of the sample famers was 51 years; when segregated, it was 49 and 52 years for the adopters and nonadopters, respectively (Table 1).
For variables, viz., education, family size, livestock, and size of landholding, statistically, there was no difference between the adopters and nonadopters. However, adopters were significantly different from nonadopters in terms of access to credit, off-farm income, and farm assets. More specifically, around 57% of the adopter farmers had a source of off-farm income, whereas this was only 38% for the nonadopters. Similarly, about 74% and 62% of adopter and nonadopter plots, respectively, had availed credit facilities in the study areas. Furthermore, in case of the plot-level features, nearly 69% and 63% of plots were being cultivated by farmers themselves, respectively, for adopters and nonadopters. Overall, about one-third of farmers perceived a higher level of soil erosion at their plots. After segregating, around 39% and 23% of the adopter and nonadopter farmers, respectively, stated that their plots were suffering the problems of relatively higher levels of soil erosion. The adopters opined that soil and water conservation were relatively more beneficial in terms of reducing soil erosion and runoff and improving soil fertility. This is evident from the relatively better benefit perception index (BPI) scores (3.58) of adopters in comparison to nonadopters (3.27). Finally, in terms of input usages, adopters, in comparison to nonadopters, were incurring more expenditure on human labor, bullock labor and fertilizers, whereas expenses were lesser on seeds. A two-sample t-test (t = 6.55, p-value < 0.001) showed that net revenue from adopters (INR 32.46 thousand per ha) was statistically higher than that of nonadopters (INR 23.55 thousand per ha). Further, a two-sample Kolmogorov–Smirnov test showed that cumulative distribution functions (CDF) of adopters and nonadopters were different from each other, i.e., the CDF of adopters lay below that of nonadopters. From the summary of the explanatory variables, it can be stated that the adopters were systematically different from nonadopter farmers. Therefore, the influence of these explanatory variables on outcomes needs to be controlled while assessing the impact.

3.2. Determinant of the Adoption of Soil Bunds

The probit model was statistically significant at the significance of level of 1%, as indicated by the p-value of the likelihood ratio chi-square (Table 2). The age of the decision maker influenced the adoption of soil bunds negatively, and it was statistically significant at 5% level of significance. This implies that younger farmers are more willing to adopt soil bunds. This result is in line with that of other studies [24,53]. Higher probability of adoption of younger farmers can be attributed to the fact that, generally, benefits of soil and water conservation cannot be realized within a short time period; therefore, older farmers do not have much incentive for investing in conservation efforts [31]. In the study area, we noticed that younger farmers were more educated, had more access to the required information and technologies and also had a better understanding of negative consequences of soil erosion and land degradation, resulting in a higher probability of adoption. Furthermore, we also observed that younger farmers wanted to pursue market-oriented farming and were also aware about the importance of sustaining natural resources. Contrary to our expectation, education had a negative albeit statistically insignificant influence, and similar findings were also reported by many researchers [54]. For this, it was argued that better education might offer opportunities for alternative livelihood options, making for less interest in farming and thereby reducing the chances of investment in soil and water conservation. As per prior expectations, family size and farm size had a positive influence on the adoption, but it was statistically insignificant. As anticipated, CREDIT had a positive effect on adoption of SWC practices. In the study areas, most of the farmers were resource-poor, having a limited capacity for investing in conservation efforts. Therefore, having a source of off-farm income helps with overcoming the liquidity constraints. The result is in agreement with previous studies showing a positive effect of access to credit on the decision to take up soil and water conservation measures [33].
Now, turning to plot level features, TENURE, as expected, had a positive influence on the adoption of SWC practices, although it was insignificant. This is due to the fact that ownership confirms the future use of the same land and, therefore, provides incentives for investment in conservation efforts [25] for harnessing its long-term benefits. Many studies reported a positive effect of tenure security on the adoption of soil conservation practices [24,42,55]. As anticipated, both the slope of the plot as well as the level of soil erosion were associated with a higher probability of adoption of SWC practices. These results are in conformity with earlier studies, in which it was reported that the likelihood of adoption was higher if a cultivator was able to recognize the negative effects of soil degradation on crop yields [23,24,37,38,54]. Furthermore, as a matter of fact, expected benefits of technologies are critical for increasing the adoption rates [24,31,38]. Similarly, we also found that farmers having higher perceived benefits of SWC practices were taking up and using conservation measures. In line with our prior anticipations, we noticed that social networks (frequency of interaction) had a favorable bearing on the decision to use SWC practices. This facilitates the exchange of views and experiences and also facilitates sharing of resources, which is essential for community-based soil and water conservation efforts/programs. A positive role of social capital on the adoption of agricultural technologies was reported [42,43,44]. Training also had a positive effect on adoption, and this finding is in line with earlier studies [56,57]. Lastly, EXTENSION had a positive effect, as anticipated, on decision to adopt SWC practices. Similar findings were also reported by many researchers [24,28,29,31]. These studies suggested that access to an effective extension service helps not only realize the detrimental effects of land degradation but also sensitize about the availability of suitable technologies.

3.3. Impact of Soil Bunds on Net Revenue, Variance and Down-Side Risk

The AIC criterion was 2684.9, 2688.8, 9583.8 and 2693.6 for linear-log, Cobb–Douglas, quadratic and translog-log specifications, respectively. The corresponding BIC criterion was 2837.7, 2843.3, 9767.2 and 2877.0, respectively. Therefore, the linear-log specification was the chosen model for the mean function. To manage the heteroscedasticity in the model, the robust standard error (Huber–White estimator) was used. In the chosen model, multiclonality was not a serious issue, as is evident from VIF (variance inflation factor) values for all the explanatory variables, which were ranging between 1.02 and 3.5. Firstly, the ordinary least square (OLS) was used to determine the effect of soil bund adoption on mean return, variance and skewness. OLS is the simplest approach to investigate the effect of adoption that includes a dummy variable equal to 1 if the farm household adopted it and 0 otherwise. Results from OLS suggest that soil bund adoption had a positive, statistically significant effect on returns and skewness and negative effects on the variance (Table 3). These results indicate that soil bund adoption increased the crop revenue by INR 9.26 thousand per ha, and it was significant at a significance level of 1%. Furthermore, adoption of soil bunds reduced the variability in crop revenue indicated by the negative coefficient (−49.37) of BUND in the variance equation (p-value < 0.05), which also amounts to saying that it reduced variability in crop yields, as prices are assumed to be given. This has an important implication in rainfed areas, which suffer from the higher variability of the crop yields. Moreover, the coefficient of BUND in the skewness model was positive, showing that adoption of soil bunds reduced the downside risk, i.e., crop failure. As the region frequently faces moderate to severe droughts, consequently, crop failure is also common. Therefore, it can be stated that adoption of soil bunds not only enhanced returns but most importantly served as insurance for farmers by reducing the variability and minimizing the risk of crop failure. However, OLS results are not reliable, being biased and inconsistent estimates. This is due to the fact that OLS assumes that soil bund adoption is exogenously determined, although it is a potentially endogenous variable. To surmount the challenges of sample selection bias and missing data, we used IPWRA, PSM and IPW.
Before discussing the results, first, there is a need to examine the quality of balancing of covariates. It can be seen from Figure 1 and Figure 2 that after matching, there was a good overlap and common support in propensity scores.
Similarly, after weighting, the standardized mean differences (for continuous variables) and differences in proportion (for binary variables) were less than 0.05 for all the covariates, indicating that all the covariates achieved a good balance.
ATT results in IPWRA indicate that soil bunds helped in increasing the revenue by INR 8.05 thousand per ha. From the results of different approaches, it can be stated that an increase in net revenue could be between INR 7.31 and 9.25 thousand per ha (Table 4).
The significant effect of soil bund technology on productivity is in accordance with other studies [58,59,60], which showed that soil and water conservation had a positive impact on productivity. Furthermore, the coefficient of variance was negative and statistically significant, which implies that adoption of the soil bunds reduces the variability of the crop revenue. Soil bunds reduced the variance between 30% and 50% points. This finding confirms earlier findings by [15] that soil bunds improved productivity and reduced the risk particularly in the low-rainfall areas. Moreover, adoption of soil bunds was positively and strongly related to the skewness, indicating that adoption of soil bunds hedged against the risk of crop failure. To check the robustness of the results, other approaches, viz., matching and IPW, also confirmed the findings of the IPWRA. Soil bund adoption was associated with significant positive skewness, increased crop revenue and reduced production risk, contributing to an improvement in sustaining crop production in the semiarid drought-prone areas, which are also facing the challenges of increasing climate variability. Therefore, this has important policy implications for encouraging the adoption of soil bunds in particular and soil and water conservation practices in general as an important risk-mitigation option.

4. Conclusions

This paper illustrates an impact of soil and water conservation practices, i.e., soil bunds, on net revenue, its variability and downside risk, i.e., crop failure. We used primary data from 1204 plots of the semiarid tropics of India, which is facing environmental challenges of frequent droughts, soil erosion, land degradation and climate change and variability. We used the probit model for identifying the key determinants of adoption of soil bunds. The results show that for achieving a widespread adoption of soil bunds in the semiarid tropics, the younger famers are to be targeted for training programs on soil and water conservation. Furthermore, there is a need to expand the extension services and training facilities, particularly focusing on the benefits of the conservation efforts to encourage farmers to take up soil and water conservation measures. As a majority of the farmers in the study area are resource-poor, for improving their financial capacity, there is a need for expanding credit facilities. Moreover, soil and water conservation programs should emphasize strengthening social networks for successful conservation outcomes. We also used the moment-based approach for estimating the crop revenue, its variability and downside risk exposure. Furthermore, we used a doubly robust method (IPWRA) for assessing the impact of soil bunds on crop revenue, its variability and downside risk. We found that soil bunds not only improved the crop revenue but also reduced its variability, leading to more stability in yields. This has an important implication for the semiarid tropics (SAT) witnessing erratic rainfall and frequent droughts. Most interestingly, we have also observed that soil bunds also reduced the chances of downside risk, i.e., crop failure. Therefore, in view of increasing climate change and variability in the semiarid tropics, it can be suggested that soil bunds could be an important adaptation strategy for sustaining crop production. To sum up, this paper supports the investment in soil and water conservation technologies for sustaining the livelihood of resource-poor farmers dwelling in the ecologically fragile regions such as the semiarid tropics.

Author Contributions

Conceptualization, S.K. and D.R.S.; formal analysis, S.K. and G.K.J.; investigation, D.R.S.; methodology, S.K., D.R.S., A.S., N.P.S. and G.K.J.; project administration, S.K.; resources, A.S.; software, S.K. and G.K.J.; supervision, D.R.S., A.K. and N.P.S.; visualization, N.P.S.; writing—original draft, S.K.; writing—review and editing, S.K., A.S. and N.P.S. All authors have read and agreed to the published version of the manuscript.

Funding

This research was funded by NAHEP, Indian Council of Agricultural Research (ICAR), New Delhi, grant No. NAHEP/CAAST/2018-19/07.

Acknowledgments

This paper is drawn from the first author’s PhD Research work entitled “Economics of Soil and Water Conservation: A Case Study of Drought Prone Areas of Karnataka” conducted at Division of Agricultural Economics, ICAR—Indian Agriculture Research Institute, New Delhi, India.

Conflicts of Interest

The authors declare no conflict of interest.

References

  1. Khan, S.A.; Kumar, S.; Hussain, M.Z.; Kalra, N. Climate Change, Climate Variability and Indian Agriculture: Impacts Vulnerability and Adaptation Strategies. In Climate Change and Crops; Springer: Berlin/Heidelberg, Germany, 2009; pp. 19–38. [Google Scholar]
  2. Venkateswarlu, B.; Singh, A.K. Climate Change Adaptation and Mitigation Strategies in Rainfed Agriculture. In Climate Change Modelling, Planning and Policy for Agriculture; Singh, A.K., Dagar, J.C., Arunachalam, A.R.G., Shelat, K.N., Eds.; Springer: New Delhi, India, 2015; pp. 1–11. [Google Scholar] [CrossRef]
  3. Dar, W.D.; Bantilan, M.C.S.; Anupama, G.V.; Deepthi, H.; Padmaja, R. Dryland Agriculture in Asia: Ideas, Paradigms and Policies. In Reasserting the Rural Development Agenda: Lessons Learned and Emerging Challenges in Asia; Institute of Southeast Asian Studies: Singapore, 2007; pp. 191–226. [Google Scholar]
  4. Singh, N.P.; Bantilan, M.C.S.; Byjesh, K.; Murty, M.V.R. Adapting to Climate Change in Agriculture: Building Resiliency with an Effective Policy Frame in SAT India. Available online: http://oar.icrisat.org/5936/ (accessed on 14 June 2020).
  5. Chauhan, B.S.; Mahajan, G.; Randhawa, R.K.; Singh, H.; Kang, M.S. Chapter Two—Global Warming and Its Possible Impact on Agriculture in India. In Advances in Agronomy; Sparks, D.L., Ed.; Academic Press: Cambridge, MA, USA, 2014; Volume 123, pp. 65–121. [Google Scholar] [CrossRef]
  6. Srinivasa Rao, C.; Lal, R.; Prasad, J.V.N.S.; Gopinath, K.A.; Singh, R.; Jakkula, V.S.; Sahrawat, K.L.; Venkateswarlu, B.; Sikka, A.K.; Virmani, S.M. Chapter Four—Potential and Challenges of Rainfed Farming in India. In Advances in Agronomy; Sparks, D.L., Ed.; Academic Press: Cambridge, MA, USA, 2015; Volume 133, pp. 113–181. [Google Scholar] [CrossRef] [Green Version]
  7. Sharma, K.D. Rain-Fed Agriculture Could Meet the Challenges of Food Security in India. Curr. Sci. 2011, 100, 1615–1616. [Google Scholar]
  8. Aggarwal, P.K.; Baethegan, W.E.; Cooper, P.; Gommes, R.; Lee, B.; Meinke, H.; Rathore, L.S.; Sivakumar, M.V.K. Managing Climatic Risks to Combat Land Degradation and Enhance Food Security: Key Information Needs. Procedia Environ. Sci. 2010, 1, 305–312. [Google Scholar] [CrossRef] [Green Version]
  9. Kassie, M.; Yesuf, M.; Köhlin, G. The Role of Production Risk in Sustainable Land-Management Technology Adoption in the Ethiopian Highlands. Rapp. Nr Work. Pap. Econ. 2009, 1–29. [Google Scholar]
  10. Lamb, R.L. Fertilizer Use, Risk, and off-Farm Labor Markets in the Semi-Arid Tropics of India. Am. J. Agric. Econ. 2003, 85, 359–371. [Google Scholar] [CrossRef] [Green Version]
  11. Antle, J.M. Testing the Stochastic Structure of Production: A Flexible Moment-Based Approach. J. Bus. Econ. Stat. 1983, 1, 192–201. [Google Scholar]
  12. Binswanger, H.P. Attitudes toward Risk: Theoretical Implications of an Experiment in Rural India. Econ. J. 1981, 91, 867–890. [Google Scholar] [CrossRef]
  13. Kim, K.; Chavas, J.-P. Technological Change and Risk Management: An Application to the Economics of Corn Production. Agric. Econ. 2003, 29, 125–142. [Google Scholar] [CrossRef]
  14. Menezes, C.; Geiss, C.; Tressler, J. Increasing Downside Risk. Am. Econ. Rev. 1980, 70, 921–932. [Google Scholar]
  15. Kato, E.; Ringler, C.; Yesuf, M.; Bryan, E. Soil and Water Conservation Technologies: A Buffer against Production Risk in the Face of Climate Change? Insights from the Nile Basin in Ethiopia. Agric. Econ. 2011, 42, 593–604. [Google Scholar] [CrossRef] [Green Version]
  16. Pathak, P.; Laryea, K.B.; Singh, S. A Modified Contour Bunding System for Alfisols of the Semi-Arid Tropics. Agric. Water Manag. 1989, 16, 187–199. [Google Scholar] [CrossRef]
  17. Vittal, K.P.R.; Sinha, P.K.; Chary, G.R.; Sankar, G.M.; Srijaya, T.; Ramakrishna, Y.S.; Samra, J.S.; Singh, G. Districtwise Promising Technologies for Rainfed Rice Based Production System in India. All India Co-Ordinated Res. Proj. Dryland Agric. Cent. Res. Inst. Dryland Agric. Indian Counc. Agric. Res. Hyderabad 2004, 500, 059. [Google Scholar]
  18. Mishra, P.K.; Singh, M.; Kumar, G. Water Management and Conservation Innovations for Doubling Farmers’ Income. Soil Water Manag. Innov. Doubling Farmers Income 2018, 32, 23–47. [Google Scholar]
  19. Bhattacharyya, R.; Ghosh, B.N.; Mishra, P.K.; Mandal, B.; Rao, C.S.; Sarkar, D.; Das, K.; Anil, K.S.; Lalitha, M.; Hati, K.M. Soil Degradation in India: Challenges and Potential Solutions. Sustainability 2015, 7, 3528–3570. [Google Scholar] [CrossRef] [Green Version]
  20. Kerr, J.M.; Sanghi, N.K. Indigenous Soil and Water Conservation in India’s Semi-Arid Tropics; IIED International Institute for Environment and Development, Sustainable Agriculture Programme: London, UK, 1992. [Google Scholar]
  21. Gebrernichael, D.; Nyssen, J.; Poesen, J.; Deckers, J.; Haile, M.; Govers, G.; Moeyersons, J. Effectiveness of Stone Bunds in Controlling Soil Erosion on Cropland in the Tigray Highlands, Northern Ethiopia. Soil Use Manag. 2005, 21, 287–297. [Google Scholar] [CrossRef]
  22. Srinivasareddy, G.S.; Shivakumarnaiklal, H.S.; Keerthy, N.G.; Garag, P.; Jothi, E.P.; Challa, O. Drought Vulnerability Assessment in Karnataka: Through Composite Climatic Index. MAUSAM 2019, 70, 159–170. [Google Scholar]
  23. Ervin, C.A.; Ervin, D.E. Factors Affecting the Use of Soil Conservation Practices: Hypotheses, Evidence, and Policy Implications. Land Econ. 1982, 58, 277–292. [Google Scholar] [CrossRef]
  24. Shiferaw, B.; Holden, S.T. Policy Instruments for Sustainable Land Management: The Case of Highland Smallholders in Ethiopia. Agric. Econ. 2000, 22, 217–232. [Google Scholar] [CrossRef]
  25. Gebremedhin, B.; Swinton, S.M. Investment in Soil Conservation in Northern Ethiopia: The Role of Land Tenure Security and Public Programs. Agric. Econ. 2003, 29, 69–84. [Google Scholar] [CrossRef]
  26. Amsalu, A.; De Graaff, J. Determinants of Adoption and Continued Use of Stone Terraces for Soil and Water Conservation in an Ethiopian Highland Watershed. Ecol. Econ. 2007, 61, 294–302. [Google Scholar] [CrossRef]
  27. Adimassu, Z.; Kessler, A.; Hengsdijk, H. Exploring Determinants of Farmers’ Investments in Land Management in the Central Rift Valley of Ethiopia. Appl. Geogr. 2012, 35, 191–198. [Google Scholar] [CrossRef]
  28. Bekele, W.; Drake, L. Soil and Water Conservation Decision Behavior of Subsistence Farmers in the Eastern Highlands of Ethiopia: A Case Study of the Hunde-Lafto Area. Ecol. Econ. 2003, 46, 437–451. [Google Scholar] [CrossRef]
  29. Mango, N.; Makate, C.; Tamene, L.; Mponela, P.; Ndengu, G. Awareness and Adoption of Land, Soil and Water Conservation Practices in the Chinyanja Triangle, Southern Africa. Int. Soil Water Conserv. Res. 2017, 5, 122–129. [Google Scholar] [CrossRef]
  30. Pender, J.L.; Kerr, J.M. Determinants of Farmers’ Indigenous Soil and Water Conservation Investments in Semi-Arid India. Agric. Econ. 1998, 19, 113–125. [Google Scholar]
  31. Mbaga-Semgalawe, Z.; Folmer, H. Household Adoption Behaviour of Improved Soil Conservation: The Case of the North Pare and West Usambara Mountains of Tanzania. Land Use Policy 2000, 17, 321–336. [Google Scholar] [CrossRef]
  32. Pender, J.; Gebremedhin, B. Determinants of Agricultural and Land Management Practices and Impacts on Crop Production and Household Income in the Highlands of Tigray, Ethiopia. J. Afr. Econ. 2008, 17, 395–450. [Google Scholar] [CrossRef]
  33. Pattanayak, S.K.; Mercer, D.E.; Sills, E.; Yang, J.-C. Taking Stock of Agroforestry Adoption Studies. Agrofor. Syst. 2003, 57, 173–186. [Google Scholar] [CrossRef]
  34. Tenge, A.J.; De Graaff, J.; Hella, J.P. Social and Economic Factors Affecting the Adoption of Soil and Water Conservation in West Usambara Highlands, Tanzania. Land Degrad. Dev. 2004, 15, 99–114. [Google Scholar] [CrossRef]
  35. Atnafe, A.D.; Ahmed, H.M.; Adane, D.M. Determinants of Adopting Techniques of Soil and Water Conservation in Goromti Watershed, Western Ethiopia. J. Soil Sci. Environ. Manag. 2015, 6, 168–177. [Google Scholar]
  36. Belachew, A.; Mekuria, W.; Nachimuthu, K. Factors Influencing Adoption of Soil and Water Conservation Practices in the Northwest Ethiopian Highlands. Int. Soil Water Conserv. Res. 2020, 8, 80–89. [Google Scholar] [CrossRef]
  37. Willy, D.K.; Holm-Müller, K. Social Influence and Collective Action Effects on Farm Level Soil Conservation Effort in Rural Kenya. Ecol. Econ. 2013, 90, 94–103. [Google Scholar] [CrossRef]
  38. Baidu-Forson, J. Factors Influencing Adoption of Land-Enhancing Technology in the Sahel: Lessons from a Case Study in Niger. Agric. Econ. 1999, 20, 231–239. [Google Scholar]
  39. Teklewold, H.; Köhlin, G. Risk Preferences as Determinants of Soil Conservation Decisions in Ethiopia. J. Soil Water Conserv. 2011, 66, 87–96. [Google Scholar] [CrossRef] [Green Version]
  40. Mugonola, B.; Deckers, J.; Poesen, J.; Isabirye, M.; Mathijs, E. Adoption of Soil and Water Conservation Technologies in the Rwizi Catchment of South Western Uganda. Int. J. Agric. Sustain. 2013, 11, 264–281. [Google Scholar] [CrossRef]
  41. Dessie, Y.; Wurzinger, M.; Hauser, M. The Role of Social Learning for Soil Conservation: The Case of Amba Zuria Land Management, Ethiopia. Int. J. Sustain. Dev. World Ecol. 2012, 19, 258–267. [Google Scholar] [CrossRef]
  42. Nyangena, W. Social Determinants of Soil and Water Conservation in Rural Kenya. Environ. Dev. Sustain. 2008, 10, 745–767. [Google Scholar] [CrossRef]
  43. Krishna, A. Moving from the Stock of Social Capital to the Flow of Benefits: The Role of Agency. World Dev. 2001, 29, 925–943. [Google Scholar] [CrossRef]
  44. Grootaert, C.; Narayan, D.; Jones, V.N.; Woolcock, M. Measuring Social Capital: An Integrated Questionnaire; The World Bank: Washington, DC, USA, 2004. [Google Scholar]
  45. Di Falco, S.; Chavas, J.-P. On Crop Biodiversity, Risk Exposure, and Food Security in the Highlands of Ethiopia. Am. J. Agric. Econ. 2009, 91, 599–611. [Google Scholar] [CrossRef] [Green Version]
  46. Abro, Z.A. Technology Adoption, Productivity, Efficiency, and Risk Exposure in the Ethiopian Small Farm Sector. Ph.D. Thesis, Georg-August-Universität Göttingen, Göttingen, Germany, 2018. [Google Scholar]
  47. Judge, G.G.; Hill, R.C.; Griffiths, W.E.; Lütkepohl, H.; Lee, T.-C. Introduction to the Theory and Practice of Econometrics; J. Wiley: New York, NY, USA, 1988. [Google Scholar]
  48. Wooldridge, J.M. Econometric Analysis of Cross Section and Panel Data; MIT Press: Cambridge, MA, USA, 2010. [Google Scholar]
  49. Zhou, T. PSweight: Package for Propensity Score Weighting. 2020. Available online: https://cran.r-project.org/web/packages/PSweight/PSweight.pdf (accessed on 15 May 2020).
  50. Greifer, N. WeightIt: Weighting for Covariate Balance in Observational Studies (R Package Version 0.5. 0). 2018. Available online: https://mran.microsoft.com/snapshot/2018-02-01/web/packages/WeightIt/index.html (accessed on 21 July 2020).
  51. Sekhon, J.S. Multivariate and Propensity Score Matching Software with Automated Balance Optimization: The Matching Package for R. J. Stat. Softw. Forthcom. 2008, 42, 7. [Google Scholar]
  52. Ho, D.; Imai, K.; King, G.; Stuart, E.; Whitworth, A. Package ‘MatchIt’. Version 3.0.2. 2018. Available online: https://cran.r-project.org/web/packages/MatchIt/MatchIt.pdf (accessed on 15 May 2020).
  53. Ersado, L.; Amacher, G.; Alwang, J. Productivity and Land Enhancing Technologies in Northern Ethiopia: Health, Public Investments, and Sequential Adoption. Am. J. Agric. Econ. 2004, 86, 321–331. [Google Scholar] [CrossRef]
  54. Hopkins, J.; Southgate, D.; Gonzalez-Vega, C. Rural Poverty and Land Degradation in El Salvador. In Abstract in American Journal Agricultural Economics, Proceedings of the Agricultural and Applied Economics Associations Annual Meeting, Nashville, Tennessee, 8–11 August 1999; University of Wisconsin Madison: Madison, WI, USA, 1999; Volume 81. [Google Scholar]
  55. Teshome, A.; Rolker, D.; de Graaff, J. Financial Viability of Soil and Water Conservation Technologies in Northwestern Ethiopian Highlands. Appl. Geogr. 2013, 37, 139–149. [Google Scholar] [CrossRef]
  56. Anley, Y.; Bogale, A.; Haile-Gabriel, A. Adoption Decision and Use Intensity of Soil and Water Conservation Measures by Smallholder Subsistence Farmers in Dedo District, Western Ethiopia. Land Degrad. Dev. 2007, 18, 289–302. [Google Scholar] [CrossRef]
  57. Chesterman, N.S.; Entwistle, J.; Chambers, M.C.; Liu, H.-C.; Agrawal, A.; Brown, D.G. The Effects of Trainings in Soil and Water Conservation on Farming Practices, Livelihoods, and Land-Use Intensity in the Ethiopian Highlands. Land Use Policy 2019, 87, 104051. [Google Scholar] [CrossRef]
  58. Kassie, M.; Pender, J.; Yesuf, M.; Kohlin, G.; Bluffstone, R.; Mulugeta, E. Estimating Returns to Soil Conservation Adoption in the Northern Ethiopian Highlands. Agric. Econ. 2008, 38, 213–232. [Google Scholar] [CrossRef]
  59. Abdulai, A.; Huffman, W. The Adoption and Impact of Soil and Water Conservation Technology: An Endogenous Switching Regression Application. Land Econ. 2014, 90, 26–43. [Google Scholar] [CrossRef]
  60. Nkegbe, P.K. Soil and Water Conservation Practices and Smallholder Farmer Multi-Activity Technical Efficiency in Northern Ghana. Ghana J. Dev. Stud. 2018, 15, 55–91. [Google Scholar] [CrossRef]
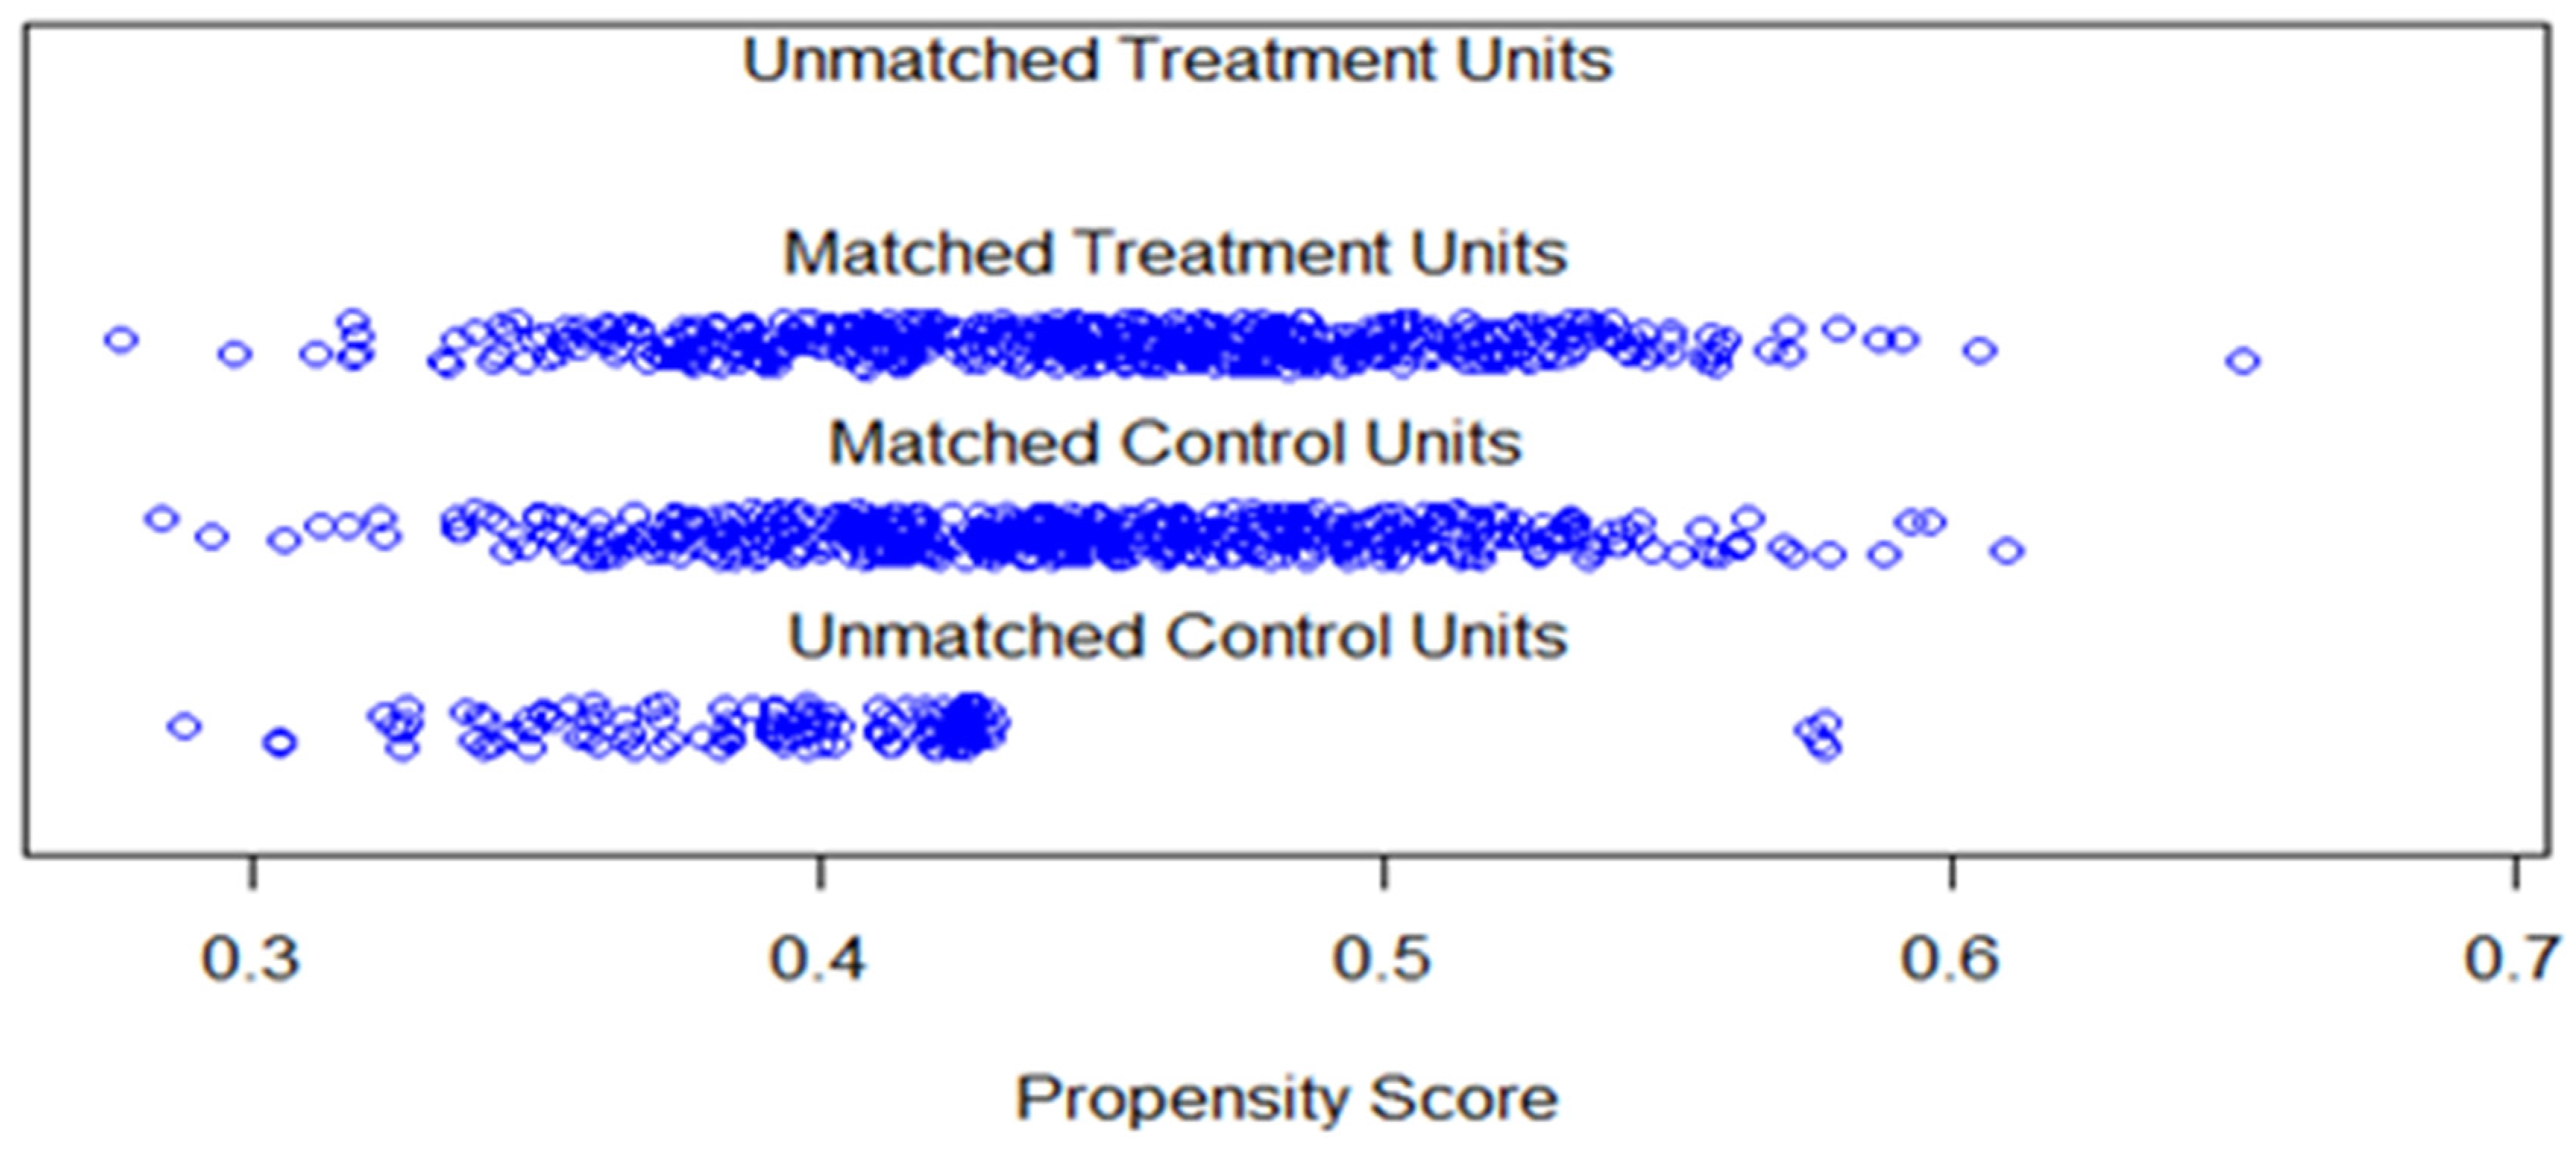
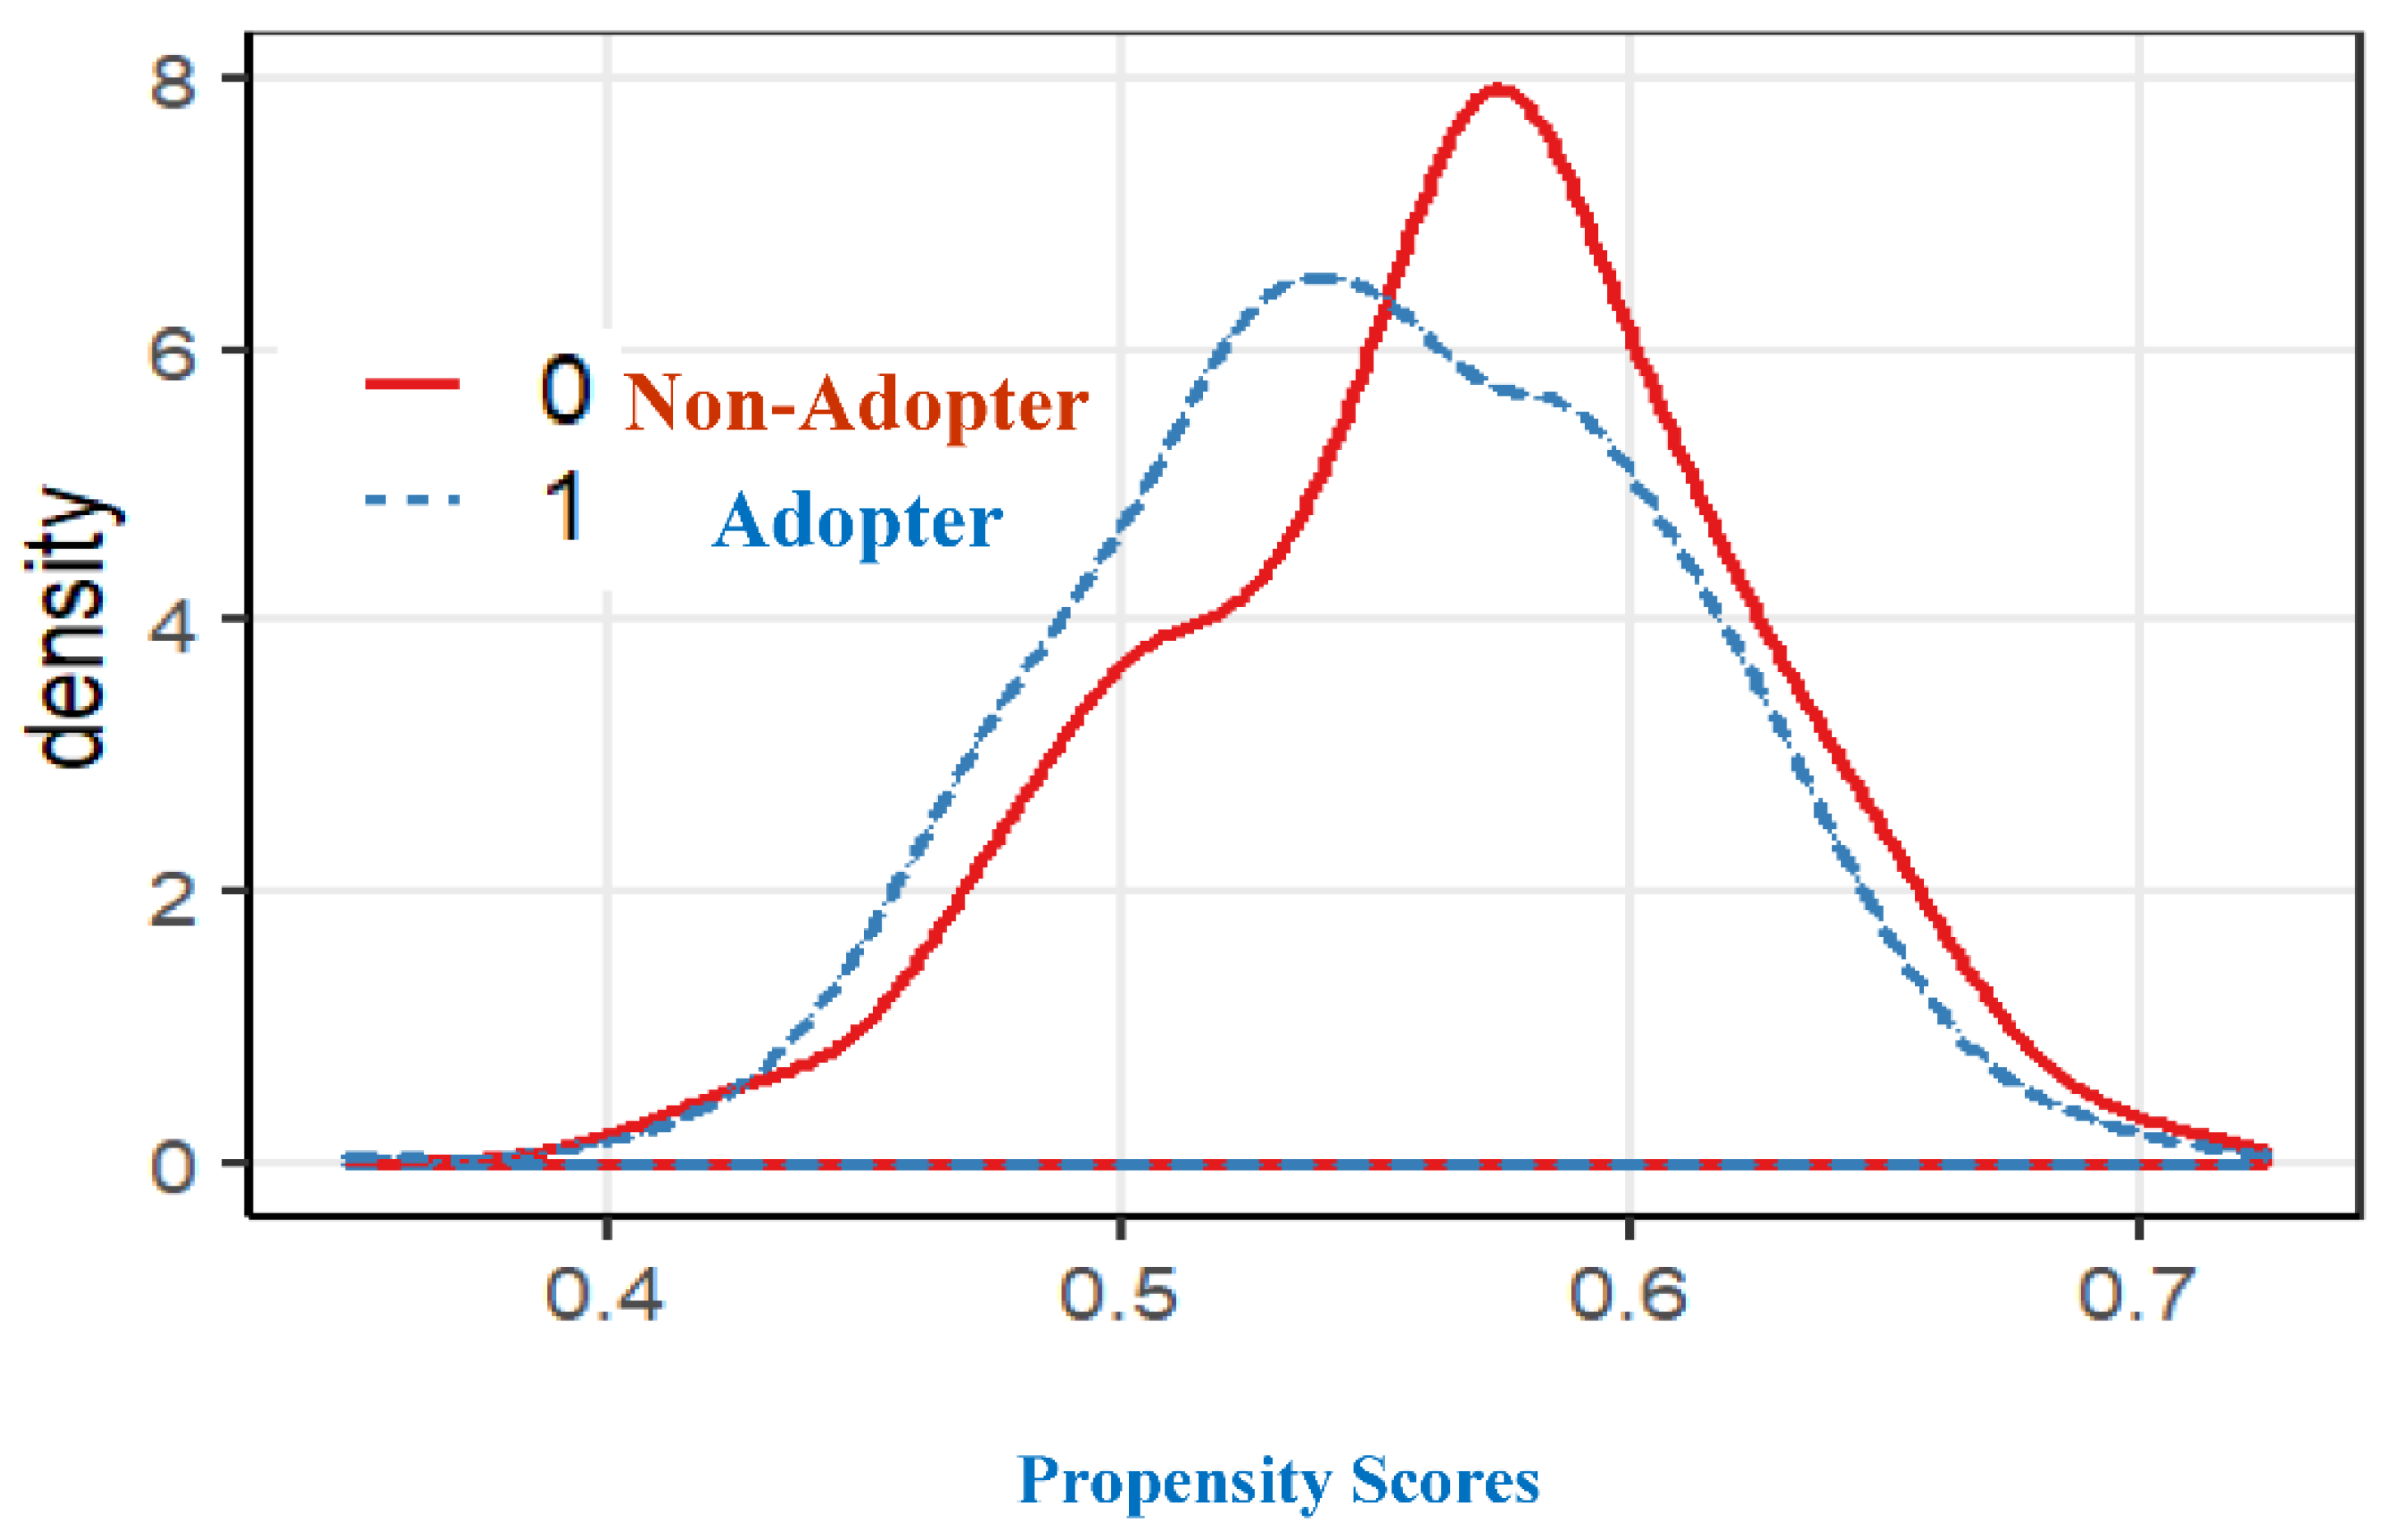
Figure 1. Distribution of propensity scores of treated (adopters) and controls (nonadopters).
Sustainability 12 06965 g001
Figure 2. Distribution of propensity scores of treated (adopters) and controls (nonadopters) showing the common support.
Sustainability 12 06965 g002
Table 1. Descriptive statistics of the sampled farm households in the study area.
VariablesDefinitionFull SampleAdoptersNonadopters
BUND Soil bunds (1 if adopted; otherwise 0)1204532 (44.2)672 (55.8)
AGEAge (years)51 (13.51)49 * (12.87)52 (13.93)
EDUEducation (number of schooling years)4.91 (4.78)5.06 (4.82)4.8 (4.74)
OFFFARMOff-farm income (1 if yes; otherwise 0)561 (46.6)303 *** (57.0)258 (38.4)
FAMILYFamily size (numbers)5.0 (2.3)5.0 (2.3)5.0 (2.3)
LIVESTOCKLivestock (numbers)3.35 (2.2)3.29 (2.08)3.4 (2.29)
LANDHOLDINGSize of landholding (ha)2.59 (2.11)2.64 (2.21)2.55 (2.03)
CREDITAccess to credit (1 if yes; otherwise 0)811 (67.4)394 ** (74.1)417 (62.1)
FAIFarm asset index (index scores)0.11 (0.16)0.14 * (0.19)0.09 (0.13)
TENURETenure (1 if owned; otherwise 0)795 (66.0)369 ** (69.4)426 (63.4)
SLOPESlope of plot (1 if slope; otherwise 0)693 (57.6)362 *** (68.0)331 (49.3)
EROSIONHIGHSoil erosion (1 if high; otherwise 0)362 (30.1)208 ** (39.1)154 (22.9)
EROSIONHIGHMEDSoil erosion (1 if medium; otherwise 0)358 (29.7)109 ** (20.5)249 (37.1)
FERTIHIGHFertility (1 if high; otherwise 0)399 (33.1)221 *** (41.5)0.27 (0.44)
FERTIMEDIUMFertility (1 if medium; otherwise 0)570 (47.3)196 *** (36.8))374 (55.7))
BPI#Benefit perception index3.41 (0.78)3.58 ** (0.73)3.27 (0.79)
EXTENSIONExtension services (number of visits)2.7 (1.4)2.9 * (1.6)2.4 (1.2)
TRAINTraining (1 if yes; otherwise 0)577 (47.9)305 *** (57.3)272 (40.5)
TALKInteraction with others (1 = no interaction, 2 = often and 3 = frequently)1.77 (0.81)1.96 * (0.84)1.63 (0.75)
USEFULPerceived usefulness of interaction (1 = not useful, 2 = useful, 3 = very useful) 2.41 (0.59)2.4 (0.58)2.43 (0.6)
EXPHLExpenditure on human labor (INR/ha)12,185 (4347)12,482 ** (4579)11,950 (4142)
EXPBLExpenditure on bullock labor (INR/ha)3758 (2722)4050 *** (2927)3528 (2527)
EXPSEEDSExpenditure on seeds (INR/ha)1130 (993)1083 * (1030)1181 (962)
EXPMACHINEExpenditure on farm machinery (INR/ha)3171 (2150)3179 (2097)3165 (2193)
EXPFERTIExpenditure on fertilizers (INR/ha)3041 (2788)3253 ** (2825)2873 (2748)
NETRETURNNet return (000′INR/ha)27.5 (23.4)32.4 ***(24.6)23.6 (21.6)
TUMKURTumkur21180131
BIDARBidar326151175
GADAGGadag316152164
Note: ***, ** and * represent significance levels at 1%, 5% and 10%, respectively. For continuous and binary variables, figures in parentheses are standard deviation and percentage to total, respectively. For the continuous and binary variables, the difference between the adopters and nonadopters was tested using the t-test and chi-square test, respectively. BPI# is the benefit perception index, which indicates perceived benefits of soil and water conservation measures of farmers in terms of effects of soil and water conservation on improving the soil fertility, moisture, groundwater and reducing soil loss and runoff.
Table 2. Determinants of soil bunds in the study area.
VariablesEstimateStd. ErrorMarginal EffectsStd. Error
Intercept−3.817 ***0.438
AGE−0.008 **0.003−0.003 **0.001
EDU−0.0130.010−0.0050.004
FAMILY0.0060.0200.0020.008
LANDHOLDING0.0020.0230.0010.009
FAI1.199 ***0.3090.464 ***0.120
LIVESTOCK−0.0140.021−0.0050.008
CREDIT0.295 ***0.1040.112 ***0.039
OFFFARM 1.564 ***0.1040.527 ***0.027
TENURE0.0140.0980.0050.038
SLOPE0.398 **0.0950.152 **0.036
EROSIONHIGH0.312 **0.1120.122 **0.044
EROSIONHIGHMED−0.405 ***0.112−0.152 ***0.040
FERTIHIGH−0.0870.130−0.0340.050
FERTIMEDIUM−0.376 **0.123−0.144 **0.047
BPI0.377 ***0.0630.146 ***0.024
TALK0.468 ***0.0610.181 ***0.024
USEFUL−0.0240.077−0.0090.030
TRAIN0.518 *0.0330.1990.035
EXTENSION0.168 **0.0320.065 **0.013
TUMKUR−0.234 *0.139−0.089 *0.052
BIDAR−0.0410.120−0.0160.047
GADAG0.1240.1250.0480.048
Note: ***, ** and * represent significance levels at 1%, 5% and 10%, respectively, likelihood ratio test: −632.07 ***, (p < 0.001).
Table 3. Ordinary least square (OLS) estimation of mean, variance, and skewness equations.
Variable Mean EquationVariance EquationSkewness Equation
EstimateRobust Std. ErrorEstimateRobust Std. ErrorEstimateRobust Std. Error
Intercept100.314 ***13.260406.016411.1160.2822.909
BUND9.26 ***0.730−49.37 **20.530.255 **0.162
AGE0.0010.0280.7990.8580.0000.006
EDU−0.0230.080−1.2502.478−0.0030.018
FAMLIY−0.0900.167−6.1545.169−0.062 *0.037
LANDHOLDING0.795 ***0.1877.5715.8110.0230.041
CREDIT5.749 ***0.84443.173 *26.1730.2260.185
FAI1.6212.340−83.43372.564−0.6340.513
LIVESTOCK−0.350 **0.168−7.2885.194−0.068 *0.037
TENURE2.309 ***0.78239.82724.2610.2300.172
Slope1.714 **0.79033.37024.4920.0230.173
EROISONHIGH1.1010.90242.337 *27.9560.312 *0.198
EROISONMED−5.241 ***0.906−19.79328.100−0.0610.199
FERTIHIGH5.242 ***1.06844.47133.121−0.0760.234
FERTIMEDIUM−2.225 **1.003−30.79731.101−0.353 *0.220
TRANI0.3500.74517.42723.0850.0790.163
BPI1.527 ***0.4953.48415.353−0.0610.109
EXTENSION1.227 ***0.256−0.9977.951−0.0260.056
Log EXPHL−1.6491.126−3.25634.907−0.0520.247
Log EXPBL2.304 ***0.56055.225 ***17.3650.390 ***0.123
Log EXPMACHINE−1.394 **0.560−21.59317.365−0.0370.123
Log EXPSEEDS−5.647 ***0.711−4.66122.043−0.0090.156
Log EXPFERTI −1.667 **0.514−21.59615.949−0.1110.113
TUMKUR−1.6331.153−18.51635.736−0.2870.253
BIDAR1.5501.49020.29046.1930.1990.327
GADAG3.731 **1.41141.01443.7470.2580.310
F-statistic103.6 *** 8.201 *** 2.334 ***
Note: ***, ** and * represent significance levels at 1%, 5% and 10%, respectively. Skewness was rescaled by dividing by 100,000.
Table 4. Impact of soil bunds on mean crop revenue, variance and skewness.
MethodsTreatment EffectsMeanVarianceSkewness
EstimateRobust SEEstimateRobust SEEstimateRobust SE
Matching (CEM#)ATE8.88 ***1.52−29.1627.720.27 *0.15
ATT8.40 ***1.69−32.0528.550.27 *0.15
Matching (OPT#)ATE7.12 ***1.44−45.33 *24.650.25 *0.14
ATT7.31 ***1.31−47.65 **22.880.27 *0.15
Matching (NNM#)ATE8.73 ***1.29−45.56 *24.820.34 **0.15
ATT9.25 ***1.41−51.07 **23.020.31 **0.14
IPWATE8.14 ***1.40−47.15 **22.150.29 **0.14
ATT7.93 ***1.34−43.29 *24.170.32 **0.15
IPWRAATE7.97 ***1.22−46.82 **21.750.30 **0.14
ATT8.05 ***1.26−44.32 *23.410.32 **0.15
Note: ***, ** and * represent significance levels at 1%, 5% and 10%, respectively. CEM#, OPT# and NNM# stand for coarsened exact matching, optimal and nearest-neighbor matching, respectively. IPW and IPWRA stand for inverse propensity weighting and inverse-propensity-weighting regression adjustment, respectively.

