Article

Investigation of Input and Output Energy for Wheat Production: A Comprehensive Study for Tehsil Mailsi (Pakistan)

1
Department of Agricultural Engineering, Bahauddin Zakariya University, Multan 60800, Pakistan
2
Department of Biosystems Engineering, Faculty of Agricultural Sciences, University of Guilan, Rasht 4199613776, Iran
3
Institute for Water Resources and Water Supply, Hamburg University of Technology, Am Schwarzenberg-Campus 3, 20173 Hamburg, Germany
4
Department of Biochemistry, College of Science, King Saud University, P.O. Box 2455, Riyadh 11451, Saudi Arabia
5
Faculty of Agriculture and Environmental Sciences, University of Rostock, 18059 Rostock, Germany
6
Department of Environmental Science and Engineering, College of Chemistry and Environmental Engineering, Shenzhen University, Shenzhen 518060, China
*
Authors to whom correspondence should be addressed.
These authors contributed equally for this work.
Sustainability 2020, 12(17), 6884; https://doi.org/10.3390/su12176884
Submission received: 14 July 2020 / Revised: 21 August 2020 / Accepted: 22 August 2020 / Published: 24 August 2020
(This article belongs to the Special Issue Environmental and Economic Performance of Farming and Food Systems)

Abstract

:
The global increasing food demand can be met by efficient energy utilization in mechanized agricultural productions. In this study, input–output energy flow along with CO2 emissions for different wheat production cases (C-I to C-V) were investigated to identify the one that is most energy-efficient and environment-friendly case. Data and information about input and output sources were collected from farmers through questionnaires and face-to-face interviews. Input and output sources were converted into energy units by energy equivalents while CO2 emissions were calculated by emission equivalents. Data envelopment analysis (DEA) was conducted to compare technical efficiencies of the developed cases for optimization of inputs in inefficient cases. Results revealed that case C-Ⅴ (higher inputs, larger fields, the tendency of higher fertilizer application and tillage operations) has the highest energy inputs and outputs than the rest of the cases. Moreover, it possesses the lowest energy use efficiency and energy productivity. The highest CO2 emissions (1548 kg-CO2/ha) referred to C-Ⅴ while lowest emissions per ton of grain yield were determined in C-Ⅳ (higher electricity water pumping, moderate energy input). The grain yield increases directly with input energy in most of the cases, but it does not guarantee the highest values for energy indices. C-Ⅲ (moderate irrigations, educated farmers, various fertilizer applications) was found as an optimum case because of higher energy indices like energy use efficiency of 4.4 and energy productivity of 153.94 kg/GJ. Optimum input and better management practices may enhance energy proficiency and limit the traditionally uncontrolled CO2 emissions from wheat production. Therefore, the agricultural practices performed in C-Ⅲ are recommended for efficient cultivation of wheat in the studied area.

Graphical Abstract

1. Introduction

Wheat (Triticum aestivum) is a main cereal crop which provides staple food to 35% of the world and 60% of Pakistan’s population [1,2]. It covers about 25% of world cultivable area devoted to cereal crops to produce 771.7 million tons per annum [3,4]. The rise in global wheat demand is forecasted to be about 60% by 2050 [5]. Thus, annual wheat production must increase by 1.6% [5]. Pakistan has a share of 3.5% in global wheat production [6]. Agriculture is the largest economic sector of the country contributing 24% to GDP [7]. There will be demand of 31 million tons of wheat until 2025 [8] against current production of 24.3 million tons [6]. This necessitates a crucial increase in annual wheat production. On the other hand, lack of storage facilities further aggravates the risk of food shortage [9,10,11,12,13,14]. However, intensive energy input is required to increase wheat production which highlights the importance of efficient energy use in agricultural production.
Energy plays a pivotal role in wheat cultivation. Wheat production mainly depends upon the input energy. Input energy is the energy provided in the form of different sources (i.e., fertilizer, water, machinery, labor, electricity, fuel, seed and pesticides) during various operations in wheat cultivation. It is categorized as direct and indirect input energies. Direct energy is the energy used directly on farm in the form of labor, electricity, water and fuel. Indirect energy is the off-farm energy used in manufacturing processes, in the form of seed, fertilizer, pesticides and machinery [15]. Furthermore, input energy can also be classified as renewable and non-renewable energies. Renewable energy comprises of energy input from human labor and machine operations while non-renewable energy covers fertilizers, irrigation water, pesticides and fuel. Input energy in agriculture depends on arable land, population engaged in agriculture, farmers’ education, irrigation systems, tillage practices, local weather climate, crop and soil types [16,17,18]. It is evident that there is a need to increase the energy efficiency in agriculture to stabilize the relationship between energy input and crop production. Agronomic modifications and conservative agriculture systems can play an important role to enhance energy use efficiency in agriculture [19]. Agricultural productivity, energy use and Greenhouse Gas (GHG) emissions have a strong interrelationship. Fertilizers, machinery, electricity and fossil fuels are the primary energy sources for agricultural productions [20]. The production processes of these industrial sources indirectly contribute to GHG emissions. GHG emissions have increased exponentially in recent decades to 36.81 Gt. CO2 eq. in 2019 [21]. Agriculture, forestry and other land uses constitute 24% of global GHG emissions [22]. This increasing trend of GHG emissions leads to global warming [23]. United Nations Framework Convention on Climate Change proposed a target of limiting global warming to two degrees Celsius in this century. Current decarbonization rates of 1.6% per year needs to be increase up to 6.4% per year to achieve this target. Otherwise, the present trajectory will lead to four degrees Celsius increment in global temperature in the current century [24]. Increasing energy use efficiency is a key factor to reduce global environmental risks [25]. Pakistan is one of the minor contributor to the global GHG emissions with only a share of 0.72% [26]. The energy and agriculture sectors of the country are the major constituents of total GHG emissions comprising 46% and 41%, respectively [26]. These emissions have increased from 178 Mt. CO2 eq. to 367 Mt. CO2 eq. from 1994 to 2012 with an average increment of 4.1% per year [27]. Furthermore, Pakistan is ranked among the top ten countries affected by climate change over the past two decades [28], though per capita emissions are among the lowest in the world.
Many studies have quantified the energy use and GHG emissions in agriculture and specifically, in wheat production, e.g., energy use and efficiency evaluation in wheat production in China [20], energy auditing in different cropping systems in India [3,15,29,30,31,32,33,34,35,36], energy analyses and GHG emissions from different crops in Iran [37,38,39,40,41,42,43,44,45,46,47,48,49,50,51,52,53], assessment of on-farm energy use and GHG emissions from wheat in New Zealand [1,18,54,55], analyses of agricultural energy in Bangladesh [56], energy input–output analysis in Turkey for production of cotton, vegetables, grapes, sugar beet and dry apricot [17,57,58,59,60,61,62,63], effect of fertilizer management on GHG emissions in agriculture [64], energy and economic analyses for different vegetables in Indonesia [65] and estimation of energy use and CO2 emissions in Thailand [66]. To the best of authors’ knowledge, no study of such type was found for Pakistan in the literature.
The aim of this study was to compare energy inflow and outflow among different wheat production cases to indicate the best practices for future energy efficient cultivation in the study area. The input and output energy flow for wheat cultivation was ascertained in Tehsil Mailsi (Pakistan). The data were collected using questionnaires and face-to-face interviews. The system boundaries for energy evaluation of wheat production in the present study are defined in Figure 1. The energy indices like energy use efficiency, energy productivity and net energy were calculated for different production cases. The grain yield was predicted by multiple regression technique and further compared with actual values. Moreover, CO2 emissions for all the production cases were also estimated. Finally, the optimum production case was identified for wheat cultivation.

2. Research Methodology

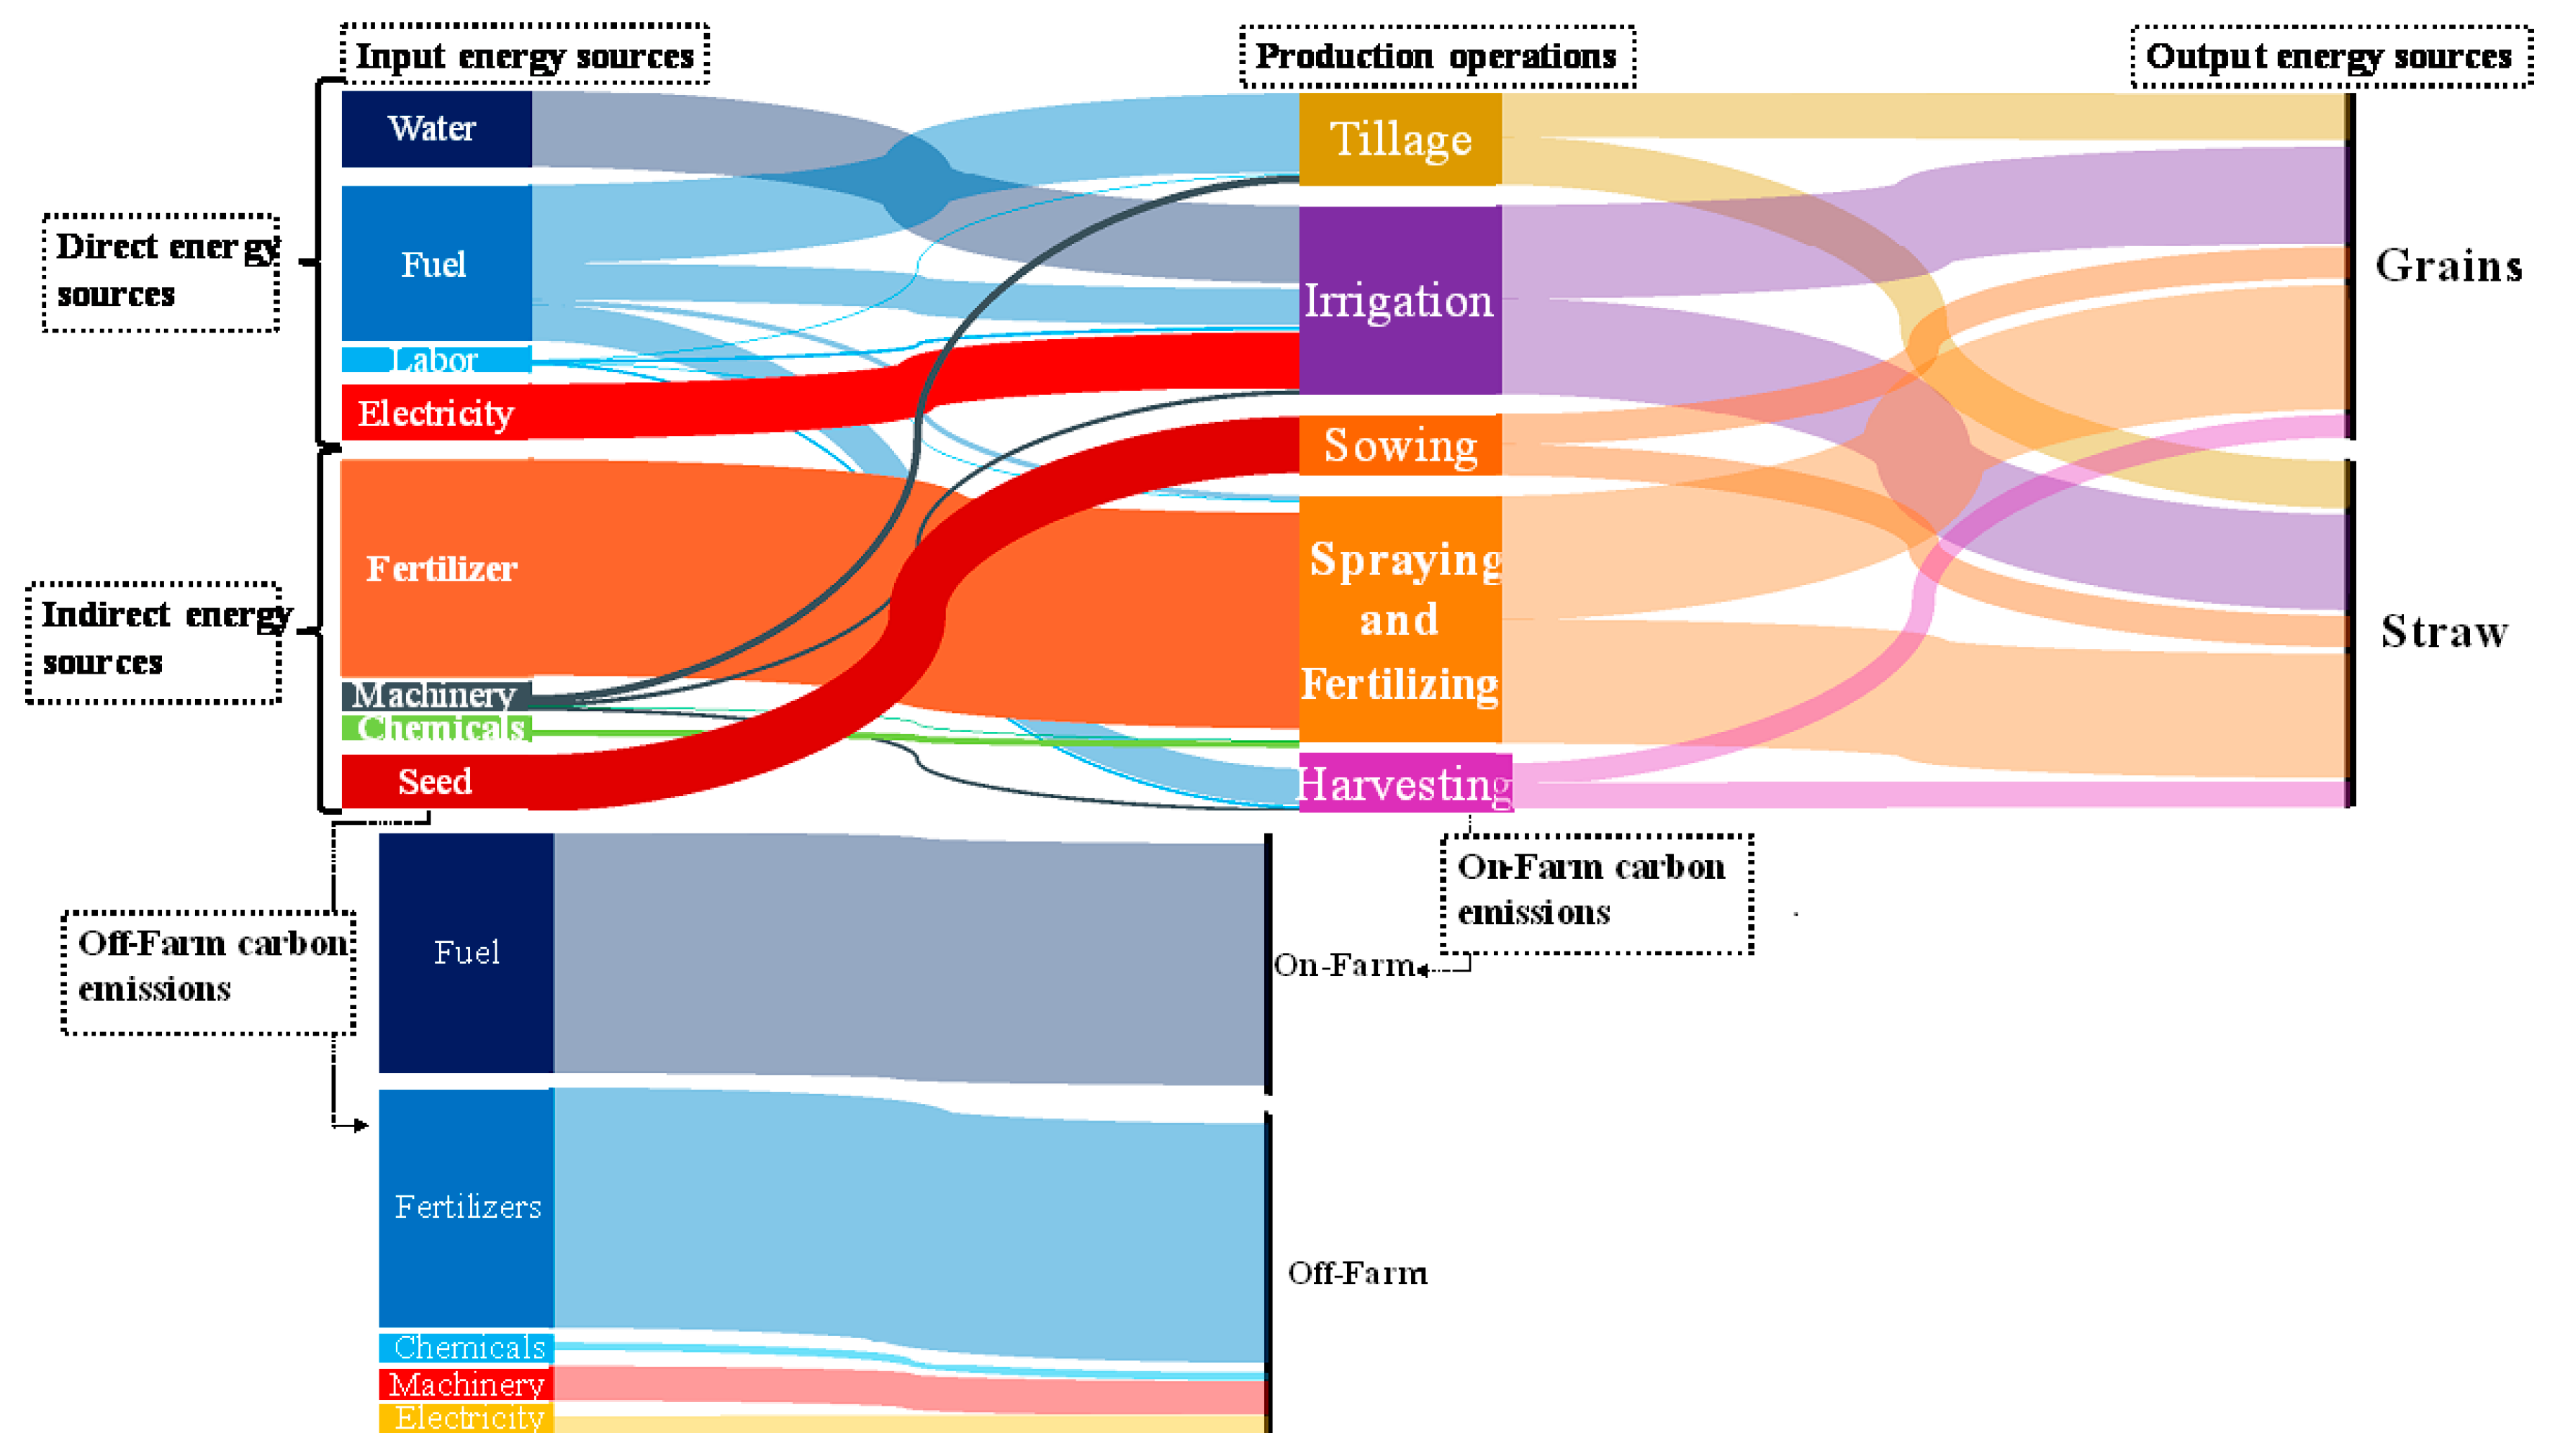
2.1. Input–Output Energy Analysis

The study was conducted in Tehsil Mailsi of District Vehari (30°2′ N, 72°21′ E), Pakistan. Annual maximum and minimum mean temperatures of the study area are 33.35 °C and 18.77 °C, respectively. The study area is comprised of loamy and clayey soil with an average annual rainfall of 246.7 mm. Wheat is grown as a cash crop in the study area covering most of the arable land. Moreover, it lies among the top ten wheat producing districts of the country covering 4% of the total wheat cultivable area in Punjab [67]. The sample size was calculated by Cochran formula [50]. After preliminary evaluation from wheat growers/farmers of the area, twenty fields were selected, and the data were collected using face-to-face questionnaires in the 2019 work season as shown in Figure 2. The data on inputs for wheat production included the utilization of water, fuel, labor, electricity, fertilizer, machinery, chemicals and seeds while output data derives from production of wheat grain and straw.
The data collection process revealed that variations existed in socioeconomic characteristics of the studied farms. These discrepancies in collected data were sorted out by developing five cases (C-I to C-V) in consultation with farmers and local agricultural experts. The details of each case are presented as follows:
  • C-Ⅰ (Case 1) Lower energy input, smaller fields, poor management practices;
  • C-Ⅱ (Case 2) Conventional management practices, which represent 60–70% of farmers in the study area;
  • C-Ⅲ (Case 3) Moderate irrigation, educated farmer, variable fertilizer applications;
  • C-Ⅳ (Case 4) Higher electric water pumping, moderate energy inputs;
  • C-Ⅴ (Case 5) Higher energy input, tendency of higher fertilizer applications & tillage operations.
The developed five cases (C-Ⅰ to C-Ⅴ) were organized in ascending order of their energy use, i.e., lower to higher energy inputs. Furthermore, farm management practices of the studied farms also differentiate the developed cases. The variations in inputs among all the production cases is mainly due to socio-economic characteristics such as farmer’s education and age, farm size, cultivated wheat area and farm labor (etc.) as shown in Table 1. The highest and lowest farmer’s education was fourteen (C-Ⅲ) and five (C-Ⅰ) years of schooling, respectively. It reflects the higher technical knowledge of the farmers in C-Ⅲ. Maximum farm size was 141.7 hectares (C-Ⅲ) with 85% cultivated wheat area, while minimum farm size was 3.64 hectares (C-Ⅰ) with 3.24 hectares under wheat cultivation. However, the maximum number of farmers (60–70%) and hence, wheat cultivated area belong to C-Ⅱ with conventional management practices. The greater planting area makes C-Ⅱ more important for potential improvements in inputs and management operations. These farms have lesser economic resources and machinery availability. The number of farm tractors and laborers also varied correspondingly with farm size. Thus, the largest farm size (C-Ⅲ) holds four (04) farm tractors and thirty (30) laborers. Irrigation source (canal/tube well) is one of the main energy consumers in agricultural production. Water pumping by electric motors/diesel engines (tube well) is higher energy consuming operation than canal irrigation. The primary source of irrigation was canal water in all the cases except in C-Ⅳ, where the electric tube well was solely used for irrigation. The use of tube well irrigation in C-Ⅳ was primarily due the geographic location of these farms which do not have access to canal water supply. Tube well was also used as a secondary/supplementary irrigation source in C-Ⅰ, C-Ⅱ and C-V.
The data about input and output sources obtained from the farmers were converted into energy units using appropriate equivalents. These equivalents were taken from literature and presented in Table 2 [20,34,48,57,68,69]. The variations in equivalents for input and output energy sources (Table 2) is due to climatic, environmental and socioeconomic factors of the studied areas. Most of the equivalents used in this study were selected from the literature [20,34,57,69] based on approximately similar input conditions as presented in bold in Table 2. However, the energy equivalent (Ee) for tractor and farm implements in MJ/h is determined using Equation (1) [69] given below:
E e = C   W L
η e = E o E i
η p = G a E i
ω = E o E i
where, C is the constant (MJ/Kg), W is the implement or tractor weight (kg), and L is the economic life (h) of implements or tractor. The values of C for tractor and farm implements were taken from [69]. The corresponding values of W and L are given in literature [70,71]. There were no significant differences in the type of farm implement or tractor in all the cases. Whereas η e is energy use efficiency, η p is energy productivity (kg/GJ), ω is net energy (GJ/ha). E i and E o represent total input and output energy in (GJ/ha), respectively. G a is actual grain yield (kg/ha). Energy efficiency or proficiency is the term used in this study to denote the measure of energy indices (i.e., η e , η p and ω ). It reflects the total performance of a specific case. The grain yield as a function of input energy is also predicted by multiple regression technique (Equation (5)). This equation is developed using yield as response, whereas machinery, water and fertilizer energies as continuous predictors. These energy input sources were chosen because of strong correlation between said response and predictors.
G p = 1060.025 ( W ) + 148.589 ( F ) 1295.87 ( M ) 518.282
where, G p represents predicted grain yield (kg/ha). W , F and M represent water, fertilizer and, machine energy (GJ/ha), respectively.
Data envelopment analysis (DEA) based CCR (Charnes–Cooper–Rhodes) model [72] was used to calculate technical efficiencies (TE) of different cases. DEA is a benchmarking technique used to rank decision making units (DMUs) based on their comparative performance [73]. DMUs are the distinct units that must be compared while five different cases (C-Ⅰ to C-Ⅴ) were considered as DMUs in the present study. Technical efficiency (TE) is the ratio from weighted output to weighted inputs of a specific DMU. It depends on the ability of a distinct DMU to convert inputs into outputs. Three major inputs, i.e., fertilizer, water and fuel were considered as controlled inputs while yield as an output in the CCR model. Moreover, technically efficient and inefficient cases were distinguished from each other to analyze the potential improvements in inefficient cases. In this regard, an input oriented CCR model was used to optimize inputs level in inefficient DMUs while efficient DMUs were considered as the best possible production cases in the study area. The input oriented CCR model is a model in which inputs are minimized to obtain the same level of outputs. The Frontier Analyst 4 software was used to perform data envelopment analysis. However, TE can be written mathematically as follows [74]:
T E j = r = 1 n u r y r j s = 1 m v s x s j
Equation (6) can be solved by linear programming as follows [73]
Maximize   TE   =   r = 1 n u r y r j
Subject   to   r = 1 n u r y r j s = 1 m v s x s j 0
Df   s = 1 m v s x s j = 1 ,   u r 0 ,   v s 0 ,   j = 1 ,   2 ,   3 , k
where, TEj refers to technical efficiency of jth DMU, u r is the weight assigned to output n, y r is the quantity of output n, r is the number of outputs (r = 1, 2, 3, ……n), v s refers to weight assigned to input m, x s is the quantity of input m, s is the number of inputs (s = 1, 2, 3,……m) and j refers to jth of DMUs (j = 1, 2, 3……k).

2.2. CO2 Emissions and Carbon Footprint

In this study, CO2 emissions from production sources were also calculated using emission equivalents. The effects of N2O and CH4 were not considered because of lesser contribution (kilograms per hectare) towards GHG emissions as compared to CO2. In this regard, CO2, N2O and CH4 emissions are reported as 2668.35, 22.92 and 3.49 kg/ha, respectively [48]. The CO2 emissions (kg-CO2/ha) from production sources like fertilizers, pesticides, electricity, fuel and machinery were determined using CO2 equivalents. These equivalents (kg CO2/MJ) are given Table 3 [68,75]. Moreover, kg-CO2 emissions per ton of grain yield were also calculated to compare yield response with respect to emissions. Total electricity generation in Pakistan comprises of 64% from thermal power plants and 36% from hydro power plants [76]. Therefore, only 64% of total input electricity energy in wheat production was converted into GHG equivalents.

3. Results and Discussion

3.1. Input–Output Energy Consumption

Input energy is analyzed and discussed separately based on various energy sources (Table 4) and production operations (Table 5). The direct and indirect input energies consumed by all the sources in each predefined case (C-I to CV) are shown in Figure 3. It is evident from the figure that indirect energy remains dominated in all cases except for C-Ⅳ. Fertilizer remained the top input energy source among all other sources and in all the cases. In this regard, it is ascertained that fertilizer constitutes about 31%, 40% and 39% of total input energy in C-Ⅲ, C-Ⅳ and C-Ⅴ, respectively which are higher energy consuming cases. The highest fertilizer energy input belongs to C-Ⅴ which is almost twice the fertilizer energy consumed in C-Ⅰ (the lowest energy consuming case). Therefore, fertilizer represented the highest energy input with mean value of 9.94 GJ/ha in all wheat production cases (Figure 3), in accordance with the literature [3,20,35,45,54,55,77]. Singh et al. [3] investigated energy use pattern for wheat cultivation in India and found a similar trend in fertilizer energy use in Punjab province. The present study was also conducted in Punjab occupied by Pakistan. Therefore, there are no significant differences in the farm characteristics of these two studies. Moreover, Mani et al. [35] studied energy consumption in wheat and maize production and found similar trends for wheat cultivations. Soltani et al. [45], Yuan et al. [20] and Safa et al. [55] also found similar energy use pattern in their studies. However, Erdemir and Zeki [58] conducted a study on organic farming and reported fuel as the highest energy input source. The contradiction in the results of present study to their study was due to difference in management practices by the farmers. Thus, input energy can be optimized by prudent fertilizer application, e.g., use of potassium fertilizer along with urea and diammonium phosphate (DAP) makes C-Ⅲ unique from others. This combination of fertilizers enhanced the energy efficiency of this case. Furthermore, the total indirect energy can be minimized by controlling single source applications (i.e., fertilizer).
Fuel is the second highest energy input source after fertilizer in all the cases except C-Ⅳ where electricity was the second highest energy input source. The higher electricity consumption in C-Ⅳ was due to higher electrical water pumping for irrigation. The highest fuel consumption belongs to C-Ⅴ comprising 31% of total input energy while the lowest corresponds to C-Ⅰ. Fuel consumption is the measure of machining practices in different production operations. Furthermore, higher fuel consumption results from extensive tillage practices and vice versa. Therefore, judicious fuel energy use is important to optimize direct energy usage in wheat production.
Water was the third highest energy input source in all the cases except C-Ⅳ. Highest water consumption was observed in C-Ⅲ and C-Ⅴ accounting for 14.7% and 12%, respectively of total input energies in these cases. On the other hand, the lowest water energy input was noted in C-Ⅰ due to lesser availability of costly tractor operated tube well for economically poor farmers in this class. Therefore, socioeconomic status of farmers also effects the farming practices for wheat cultivation. Electricity is also a major energy input for some cases like C-Ⅳ, but not very important for other cases. The reason for this difference is the use of alternatives, e.g., use of diesel engines/tractors instead of electric powered motors for water pumping. There are no significant differences among other input sources (labor, seed, herbicides and machinery) in all the cases. These sources are considered as minor energy input sources for wheat cultivation due to their lesser input values as depicted in Figure 3. Finally, C-Ⅴ utilized the highest energy inputs in the form of fertilizers, fuel and machinery among all the cases (Table 4) due to extensive tillage and fertilization. However, the lowest amount of energy in fuel, machinery and fertilizer sources highlights the lesser machine operations due to poor economic status of farmers in C-Ⅰ. Thus, socioeconomic characteristics of farms and farmers play an important role in energy use and energy proficiency. It is difficult for economically poor farmers (C-Ⅰ) to improve management practices for energy efficient wheat cultivation. However, another low input case C-Ⅱ has potential to improve its inputs and hence, energy efficiency by increasing energy inputs up to optimum level.
Energy from pre-described input sources is utilized in different production operations i.e., irrigation, tillage, sowing, spraying & fertilizing and harvesting & threshing. Labor, fuel and machinery are main energy sources employed in every operation. The operational energy with respect to these sources was calculated and presented in Table 5. Irrigation is the energy consuming operation in which water is pumped and delivered to the field through a watercourse. The energy consumed in this operation is known as irrigation energy. On an average of all the cases, it was the highest energy consuming operation comprising 42.8% of average total operational energy, which is in accordance with previous literature Safa et al. [55]. However, irrigation energy was ranked second after tillage energy in some cases i.e., C-Ⅲ and C-Ⅴ, where low energy irrigation water was available. Safa et al. [55] investigated input and output energy flow for dry and irrigated lands. Results of the present study match with their results for irrigated lands which have similar farm properties to studied farms in the present study area. However, their results for dry lands differ due to lesser availability of irrigation water and complete dependence on rainfall in the studied area. The maximum (7.44 GJ/ha) and minimum (1.92 GJ/ha) irrigation energies were calculated in C-Ⅳ and C-Ⅰ, respectively. Irrigation was performed by different sources (i.e., canal, electric/diesel tube well) in the studied area. In this regard, the source of irrigation is a key driver to control input energy. Canal water and diesel engine operated tube wells water pumping consume less energy than electrical motors driven pumps. It is due to higher electrical energy (kWh) expenditure than diesel (liter) expenditure for pumping equal amounts of water as exhibited in Table 4. Therefore, electricity consumption is an important energy input source in irrigation constituting 57% of average total irrigation energy among all the cases. However, fuel is more important in some cases like C-Ⅲ and C-Ⅴ, where fuel driven engines/tractors were used for water pumping. Moreover, low irrigation-energy usage (C-Ⅰ) reflects the poor economic status of farmers leading to a fewer number of irrigations.
Tillage energy is the energy consumed in soil pulverization and land preparation for wheat sowing. It was the second highest energy consuming operation when considering average of all the cases. However, tillage is the top energy consuming operation in much of the cases as described earlier. It constitutes an average of 37% of mean total operational energy in all the cases. The maximum and minimum tillage energy consumption were 6.76 GJ/ha and 2.55 GJ/ha in C-Ⅴ and C-Ⅰ/C-Ⅱ, respectively. Higher tillage energy consumption represented the higher availability of farm implements in C-Ⅴ. Fuel energy is crucial in tillage operation comprising an average of 91.5% of mean total energy consumed in this operation.
Harvesting and threshing is carried out by combine harvester in C-Ⅲ and C-Ⅴ. A tractor mounted/operated reaper and thresher is used by C-Ⅳ and C-Ⅱ. However, harvesting is done by hand-held sickle in C-Ⅰ, while threshing was conducted with same machinery as of C-Ⅳ and C-Ⅱ. The maximum harvesting and threshing energy was 2.48 GJ/ha in C-Ⅳ and C-Ⅱ, while the minimum was 1.08 GJ/ha in C-Ⅲ and C-Ⅴ. The average harvesting and threshing energy expenditure represent 18.42% (1.86 GJ/ha) of the total operational energy. Fertilizing and spraying of the crop were performed by broadcasting (manual) and sprayer, respectively. Pesticides are sprayed by boom and knapsack sprayers in C-Ⅲ, C-Ⅳ, C-Ⅴ and C-Ⅰ, C-Ⅱ, respectively. The higher pesticides application in C-Ⅱ results in consumption of 6.4% (0.64 GJ/ha) of total operational energy. The average fertilizing and spraying energy were about 0.25 GJ/ha (i.e., 2.5% of total energy consumption). On the other hand, broadcasting was used for sowing in all cases. Thus, lowest labor energy (Table 5) is used in sowing among all the operations and cases (C-I to CV)—amounting to 0.012% of the total energy consumption. Finally, the total average operational energy is determined as 10.19 GJ/ha in consistence with results of [55]. Overall, ANOVA test in the last row of Table 5, shows that operational energy in C-Ⅰ and C-Ⅱ was the lowest among all cases. Furthermore, the highest operational energy is observed for C-Ⅳ and C-Ⅴ.
The total energy use by input and output sources is illustrated in Figure 4. The input energy use in C-I. C-II, C-III, C-IV and C-V was 20.18 GJ/ha, 23.8 GJ/ha, 28.25 GJ/ha, 28.53 GJ/ha and 34.54 GJ/ha, respectively. The corresponding output energy use in all cases was 83.58 GJ/ha, 97.52 GJ/ha, 117.02 GJ/ha, 111.45 GJ/ha and 125.38 GJ/ha, respectively. The highest input energy is consumed in C-Ⅴ which leads to highest output energy as shown in Figure 4. However, lowest input and output energy is found in C-Ⅰ due to poor management practices. Thus, average input and output energy consumed in wheat production is determined as 27.06 GJ/ha and 108.1 GJ/ha, respectively. These energy consumptions are found in agreement with results from references [45,55]. Soltani et al. [45] conducted their study in a similar way by developing six different classes of farms on the basis of energy use pattern and found similar results.
The η e is considered one of best indicators for efficient energy usage [20]. The highest energy use efficiency was found in C-Ⅲ while the lowest corresponds to C-Ⅴ as shown in Figure 4. The figure shows a trend in energy use efficiency with respect to energy inputs. Energy use efficiency increases with the increase in input energy up to a moderate energy input (C-Ⅲ) and then decreases with further increases in energy input (C-Ⅳ & C-Ⅴ). It necessitates the use of optimum energy input to ensure highest energy use efficiency. Energy productivity and net energy ( ω ) for each case are shown in Figure 5. The figure shows the highest energy productivity and net energy in C-Ⅲ while the lowest energy productivity in C-Ⅴ and net energy in C-Ⅰ. The lower energy input cases (C-Ⅰ and C-Ⅱ) have comparatively good energy proficiency as compared to higher energy input cases (C-Ⅳ and C-Ⅴ). Thus, C-Ⅲ is an optimum case because of higher energy indices such as η e = 4.4, η p = 153.94 kg/GJ and ω = 91.13 GJ/ha when compared to the other cases (Figure 4 and Figure 5). Therefore, the agricultural practices performed in C-Ⅲ are recommended for efficient cultivation of wheat in the studied area. An equation (Equation (5)) was developed, based on all cases (C-I to C-V), using multiple regression to predict grain yield. Now, only the data of three input sources (i.e., machinery, water and fertilizers) was used to predict yield rather than all other inputs as presented in Table 4 and Table 5. The negative sign with machinery (Equation (5)) shows a decrease in yield with increase in machine operations. The reason behind such inverse relationship may be the effect of tillage on water retention capacity in the root zone. Higher tillage practices (which reflects higher machining operations) decrease the water retention time in the root zone and hence, there will be lesser water availability for the crop. This water shortage in the root zone leads to decreased crop yield. Thus, higher machine operations have adverse effects on grain yield as depicted in Equation (5). The actual and predicted grains yield is compared as shown in Figure 6. The yield was predicted well in C-Ⅰ, C-Ⅳ and C-Ⅴ but is overestimated in C-Ⅱ and C-Ⅲ. The reason behind such over estimation (C-II & C-Ⅲ) may be the higher difference between water and machinery energy inputs than in the other cases. The coefficient of determination between actual and predicted yields was acceptable, i.e., 0.92 (Figure 6). Therefore, grain yield in the study area can be predicted (Equation (5)) before cultivation by assuming three input sources (water, fertilizer, machinery). This equation may be helpful for farmers to optimize inputs for energy efficient cultivation of wheat in the study area.
Data envelopment analysis (DEA) was also conducted in this study and the results revealed that moderate energy input and slightly higher input cases i.e., C-Ⅲ and C-Ⅳ were technically efficient while low and high energy input cases i.e., C-Ⅰ, C-Ⅱ and C-Ⅲ were technically inefficient as shown in Figure 7. The 100% technical efficiency of C-Ⅳ and C-Ⅴ shows that these cases lie on the frontier line and are the best production cases in converting their input sources (i.e., fertilizer, water and fuel) into output sources (i.e., yield). On the other hand, technically inefficient cases (i.e., C-Ⅰ, C-Ⅱ and C-Ⅴ) lie in the envelopment region developed by the frontier line and their inputs can be optimized to get the same level of outputs. The optimization of energy input sources in these cases is shown in Figure 7. The figure shows highest improvement potential in the high energy input case i.e., C-Ⅴ with 25.2%, 41.6% and 8.6% reduction in fertilizer, fuel and water, respectively. There is also considerable amount of reduction potential in the two other inefficient cases to achieve the same level of output. Thus, such improvements in inputs can make these cases more efficient and should be adopted by the farmers in the study area. Furthermore, actual energy inputs and output (i.e., yield) for all the five cases was also compared by DEA and exhibited in Figure 8. Figure shows comparative energy use behavior of each farm class. Higher values of inputs and outputs tend to move the curve towards the origin while lower values away from the origin. The high energy inputs and output case, i.e., C-Ⅴ lies exactly in origin while other cases show the comparative behavior of energy use with respect to this case. In this figure, an important point to note is the energy use and output producing behavior on C-Ⅱ and Ⅳ. Both cases consumed the same amount of water and fertilizer energies while C-Ⅳ produced higher yield than C-Ⅱ. The reason behind this is the higher electrical energy input in C-Ⅳ that increased the total input energy and hence, enhanced outputs. Moreover, other reason may be the higher available nutrient contents in the soils of C-Ⅳ than C-Ⅱ before application of fertilizers. Thus, it is important to measure the available soil NPK before fertilizing the field in wheat cultivation. This highlights the potential value of precision agriculture for efficient cultivation of wheat crop in the study area.

3.2. CO2 Emissions

In this study, CO2 emissions (kg-CO2/ha) from the production sources including fertilizers, pesticides, electricity, fuel, and machinery was calculated using CO2 equivalents (Table 3). The total average CO2 emissions from the studied production sources was determined as 1120 kg-CO2/ha and 283.7 kg-CO2/ton, which was consistent with the results of Safa et al. [1]. The highest share of CO2 emissions comes from fertilizer and fuel energy in all cases as shown in Figure 9. On an average of all the cases, fertilizer and fuel comprises 44.7% and 45% of total CO2 emissions, respectively. Safa et al. [1] in a study with irrigated and rainfed wheat found fertilizer and fuel as the top contributor to carbon emissions. However, their study revealed fuel as the second highest contributor after fertilizer while fuel was the highest contributor in the present study, though the difference among both studies is not significant. Moreover, Soltani et al. [45] and Moghimi et al. [41] found a similar pattern for carbon emissions in wheat production. It necessitates the judicious use of these sources to minimize the CO2 emissions. Other energy input sources (i.e., machinery, chemicals and electricity) are minor contributors to carbon emissions. The highest CO2 emissions were found in the higher energy input case, i.e., C-Ⅴ as 1548 kg-CO2/ha while lowest emissions were calculated as 798.6 kg-CO2/ha in the low energy input case, i.e., C-Ⅰ. The data thus shows a relationship between energy use and CO2 emissions. Both CO2 emissions and grain yield increased by increasing the input energy as evident from Figure 10 for C-Ⅰ, C-Ⅱ and C-V. In contrast, C-Ⅳ consumed higher input energy than C-Ⅲ but produced lower grain yield and CO2 emissions. The greater energy input in relation to yield observed in C-Ⅳ occurred because electric water pumps in C-Ⅳ consume higher input energy, but emit less CO2 than the gasoline operated pumps and/or canal used water in C-Ⅲ. It is important to mention that higher grain yield does not guarantee a higher energy use efficiency due to corresponding input energy (Figure 4). However, it may result in greater emissions of greenhouse gases particularly CO2 as depicted in C-Ⅴ.

4. Conclusions

This study projected input–output energy analyses and estimations of CO2 emissions for wheat production in five different cases (C-I to C-V) in Pakistan. The study analyzed one high energy input case (C-Ⅴ), two low energy input cases (C-Ⅰ and C-Ⅱ) and two moderate energy input cases, i.e., C-Ⅲ. C-Ⅳ. However, C-Ⅳ was found to be the highest energy consumer in terms of operational energy due higher electrical water pumping for irrigation. It was concluded that high energy input tends to result in higher energy output and grain yield, but it did not confirm higher energy proficiency. In this regard, highest values of energy indices belonged to the moderate energy input case, i.e., C-Ⅲ. Moreover, the low energy input cases (C-Ⅰ and C-Ⅱ) were better in energy efficiency than high energy input cases, i.e., C-Ⅴ. Primary factors found by the study to affect energy efficiency include fertilizers type and combination, source of irrigation, farmer’s education and proper management practices. Therefore, it is important to use proper fertilizer combinations, educating farmers and use of high efficiency irrigation systems to achieve higher energy efficiencies. Most farmers follow the conventional management system; therefore, it is crucial to raise awareness about the latest techniques to increase energy use efficiency. In this regard, local government may play a role by conducting seminars and providing guidance for farmers.
This study found that the moderate energy input case (C-Ⅲ) showed the best production scenario in terms of energy efficiencies and CO2 emissions per ton of grain yield. The management practices in this case were found to be best in converting input sources into output energy and are recommended for future energy efficient and environment friendly wheat cultivation in the study area.

Author Contributions

Conceptualization, M.N.A.; data curation, M.N.A. and M.U.B.U.B.; formal analysis, M.N.A. and M.H.M.; funding acquisition, M.H.M., M.S., M.U. and S.M.I.; investigation, N.B., M.U.B.U.B. and A.S.; methodology, M.N.A.; project administration, M.H.M.; resources, M.S., M.W. and Z.M.K.; software, M.N.A. and M.U.B.U.B.; supervision, M.H.M. and M.S.; validation, M.H.M. and N.B.; visualization, M.S., N.B., M.U., S.M.I., M.W., I.A. and Z.M.K.; writing—original draft, M.N.A.; writing—review & editing, M.H.M., M.S., N.B., M.U., S.M.I., M.W., I.A., A.S. and Z.M.K. All authors have read and agreed to the published version of the manuscript.

Funding

This work was supported by Researchers Supporting Project number (RSP-2020/100), King Saud University, Riyadh, Saudi Arabia.

Acknowledgments

This research work was carried out in the Department of Agricultural Engineering, Bahauddin Zakariya University, Multan, Pakistan. The authors acknowledge the support from the Researchers Supporting Project number (RSP-2020/100), King Saud University, Riyadh, Saudi Arabia. We acknowledge support for the Open Access fees by Hamburg University of Technology (TUHH) in the funding program Open Access Publishing.

Conflicts of Interest

The authors declare no conflict of interest.

Nomenclature

GHGgreenhouse gas
CO2carbon dioxide
E e energy equivalent for machinery (MJ/h)
C energy constant for machinery (MJ/kg)
W weight of machinery (kg)
L economic life of machinery (h)
η e energy use efficiency
E o output energy (GJ/ha)
E i input energy (GJ/ha)
η p energy productivity (kg/GJ)
ω net energy gain (GJ/ha)
G a actual grain yield (kg/ha)
G p predicted grain yield (kg/ha)
W water energy input (GJ/ha)
F fertilizer energy input (GJ/ha)
M machinery energy input (GJ/ha)
DEAdata envelopment analysis
TEtechnical efficiency
DMUdecision-making unit

References

  1. Safa, M.; Samarasinghe, S. CO2 emissions from farm inputs “case study of wheat production in Canterbury, New Zealand”. Environ. Pollut. 2012, 171, 126–132. [Google Scholar] [CrossRef]
  2. PARC. Wheat in Pakistan; Pakistan Agricultural Research Council: Islamabad, Pakistan, 2014; pp. 8–12.
  3. Singh, H.; Singh, A.K.; Kushwaha, H.L.; Singh, A. Energy consumption pattern of wheat production in India. Energy 2007, 32, 1848–1854. [Google Scholar] [CrossRef]
  4. Knoema. Crops Production, Area, and Yield by Country. Available online: https://knoema.com/xgklped/crops-production-area-and-yield-by-country (accessed on 31 July 2019).
  5. Lucas, H. Wheat Initiative: An International Vision for Wheat Improvement. 2012. Available online: www.wheatinitiative.org (accessed on 31 December 2019).
  6. Knoema. Pakistan Wheat Production. 2014. Available online: https://knoema.com/atlas/Pakistan/topics/Agriculture/Crops-Production-Quantity-tonnes/Wheat-production?action=export&gadget=indicator-preview-host (accessed on 31 July 2019).
  7. PBS. Agriculture Statistics. Pakistan Bureau of Statistics. Available online: http://www.pbs.gov.pk/content/agriculture-statistics (accessed on 31 July 2019).
  8. Zulfiqar, F.; Hussain, A. Forecasting wheat production gaps to assess the state of future food security in Pakistan. J. Food Nutr. Disord. 2014, 3. [Google Scholar] [CrossRef]
  9. Mahmood, M.H.; Sultan, M.; Miyazaki, T.; Koyama, S. Desiccant Air-Conditioning System for Storage of Fruits and Vegetables. Evergreen 2016, 3, 12–17. [Google Scholar] [CrossRef] [Green Version]
  10. Mahmood, M.H.; Sultan, M.; Miyazaki, T. Solid desiccant dehumidification-based air-conditioning system for agricultural storage application: Theory and experiments. Proc. Inst. Mech. Eng. Part A J. Power Energy 2019, 234, 095765091986950. [Google Scholar] [CrossRef]
  11. Mahmood, M.H.; Sultan, M.; Miyazaki, T. Significance of temperature and humidity control for agricultural products storage: Overview of conventional and advanced options. Int. J. Food Eng. 2019, 15. [Google Scholar] [CrossRef]
  12. Sultan, M.; Miyazaki, T.; Mahmood, M.H.; Khan, Z.M. Solar assisted evaporative cooling based passive air-conditioning system for agricultural and livestock applications. J. Eng. Sci. Technol. 2018, 13, 693–703. [Google Scholar]
  13. Mahmood, M.H.; Sultan, M.; Miyazaki, T. Experimental evaluation of desiccant dehumidification and air-conditioning system for energy-efficient storage of dried fruits. Build. Serv. Eng. Res. Technol. 2019, 41, 454–465. [Google Scholar] [CrossRef]
  14. Sultan, M.; El-sharkawy, I.I.; Miyazaki, T.; Baran, B.; Koyama, S. An overview of solid desiccant dehumidification and air conditioning systems. Renew. Sustain. Energy Rev. 2015, 46, 16–29. [Google Scholar] [CrossRef]
  15. Singh, S.; Mittal, J.P.; Singh, M.P.; Bakhshi, R. Energy-use patterns under various farming systems in Punjab. Appl. Energy 1988, 30, 261–268. [Google Scholar] [CrossRef]
  16. Maraseni, T.; Chen, G.; Banhazi, T.; Bundschuh, J.; Yusaf, T. An Assessment of Direct on-Farm Energy Use for High Value Grain Crops Grown under Different Farming Practices in Australia. Energies 2015, 8, 13033–13046. [Google Scholar] [CrossRef] [Green Version]
  17. Ozkan, B.; Akcaoz, H.; Fert, C. Energy input-output analysis in Turkish agriculture. Renew. Energy 2004, 29, 39–51. [Google Scholar] [CrossRef]
  18. Safa, M.; Samarasinghe, S.; Mohssen, M. Determination of fuel consumption and indirect factors affecting it in wheat production in Canterbury, New Zealand. Energy 2010, 35, 5400–5405. [Google Scholar] [CrossRef]
  19. Arodudu, O.T.; Helming, K.; Voinov, A.; Wiggering, H. Integrating agronomic factors into energy efficiency assessment of agro-bioenergy production—A case study of ethanol and biogas production from maize feedstock. Appl. Energy 2017, 198, 426–439. [Google Scholar] [CrossRef] [Green Version]
  20. Yuan, S.; Peng, S.; Wang, D.; Man, J. Evaluation of the energy budget and energy use efficiency in wheat production under various crop management practices in China. Energy 2018, 160, 184–191. [Google Scholar] [CrossRef]
  21. Carbon Brief. Global Fossil-Fuel Emissions up 0.6% in 2019 due to China. Available online: https://www.carbonbrief.org/analysis-global-fossil-fuel-emissions-up-zero-point-six-per-cent-in-2019-due-to-china (accessed on 10 July 2020).
  22. Intergovernmental Panel on Climate Change. Foreword, Preface, Dedication and In Memoriam. In Climate Change 2014 Mitigation of Climate Change, Working Group III Contribution to the IPCC Fifth Assessment Report; Cambridge University Press: Cambridge, UK, 2014; p. 1454. [Google Scholar] [CrossRef] [Green Version]
  23. de Richter, R.K.; Ming, T.; Caillol, S.; Liu, W. Fighting global warming by GHG removal: Destroying CFCs and HCFCs in solar-wind power plant hybrids producing renewable energy with no-intermittency. Int. J. Greenh. Gas Control 2016, 49, 449–472. [Google Scholar] [CrossRef]
  24. Grant, J.; Low, L.P.; Unsworth, S.; Hornwall, C.; Davies, M. The Low Carbon Economy Index 2018—Time to Get on with It; PricewaterhouseCoopers: London, UK, 2018; p. 12. [Google Scholar]
  25. Khan, S.; Hanjra, M.A. Footprints of water and energy inputs in food production—Global perspectives. Food Policy 2009, 34, 130–140. [Google Scholar] [CrossRef]
  26. USAID. Greenhouse Gas Emissions in Pakistan. 2016. Available online: https://www.climatelinks.org/resources/greenhouse-gas-emissions-factsheet-pakistan (accessed on 10 July 2019).
  27. Mir, K.A.; Purohit, P.; Mehmood, S. Sectoral assessment of greenhouse gas emissions in Pakistan. Environ. Sci. Pollut. Res. 2017, 24, 27345–27355. [Google Scholar] [CrossRef]
  28. Eckstien, D.; Hutfils, M.-L.; Winges, M. Global Climate Risk Index 2019. Available online: https://germanwatch.org/en/16046 (accessed on 31 July 2019).
  29. Singh, H.; Mishra, D.; Nahar, N.M.; Ranjan, M. Energy use pattern in production agriculture of a typical village in arid zone, India: Part I. Energy Convers. Manag. 2002, 43, 2275–2286. [Google Scholar] [CrossRef]
  30. Singh, S.; Mittal, V.K.; Singh, M.P.; Bhangoo, B.S. Energy requirements for cultivation of maize-wheat crop rotation in selected agro-climatic zones of punjab. Energy Convers. Manag. 1992, 33, 913–917. [Google Scholar] [CrossRef]
  31. Chaudhary, V.P.; Gangwar, B.; Pandey, D.K.; Gangwar, K.S. Energy auditing of diversified rice-wheat cropping systems in Indo-gangetic plains. Energy 2009, 34, 1091–1096. [Google Scholar] [CrossRef]
  32. Devi, S.; Hooda, V.S.; Singh, J. Energy Input-Output Analysis for Production of Wheat under Different Planting Techniques and Herbicide Treatments. Int. J. Curr. Microbiol. Appl. Sci. 2018, 7, 749–760. [Google Scholar] [CrossRef]
  33. Singh, K.P.; Prakash, V.; Srinivas, K.; Srivastva, A.K. Effect of tillage management on energy-use efficiency and economics of soybean (Glycine max) based cropping systems under the rainfed conditions in North-West Himalayan Region. Soil Tillage Res. 2008, 100, 78–82. [Google Scholar] [CrossRef]
  34. Saad, A.A.; Das, T.K.; Rana, D.S.; Sharma, A.R.; Bhattacharyya, R.; Lal, K. Energy auditing of a maize–wheat–greengram cropping system under conventional and conservation agriculture in irrigated north-western Indo-Gangetic Plains. Energy 2016, 116, 293–305. [Google Scholar] [CrossRef]
  35. Mani, I.; Kumar, P.; Panwar, J.S.; Kant, K. Variation in energy consumption in production of wheat-maize with varying altitudes in hilly regions of Himachal Pradesh, India. Energy 2007, 32, 2336–2339. [Google Scholar] [CrossRef]
  36. Singh, H.; Mishra, D.; Nahar, N.M.; Ranjan, M. Energy use pattern in production agriculture of a typical village in arid zone India: Part II. Energy Convers. Manag. 2003, 44, 1053–1067. [Google Scholar] [CrossRef]
  37. Farahani, S.S.; Rajabipour, A.; Keyhani, A. Energy use and economic analysis of NPK-15:8:15 fertilizer granulation process in Iran. J. Saudi Soc. Agric. Sci. 2017, 16, 265–269. [Google Scholar] [CrossRef]
  38. Safa, M.; Mohtasebi, S.S.; Lar, M.B. Energy Use in Wheat Production (A Case Study for Saveh, Iran) Agricultural College, Islamic Azad University of Saveh, Iran. World J. Agri. Sci. 2010, 6, 98–104. [Google Scholar]
  39. Jadid, S.R.; Homayounifar, M.; Sabuni, M.S.; Mohammadi, A. Energy analysis and optimization of inputs for wheat production in Marand region. Indian J. Agric. Sci. 2012, 82, 21–24. [Google Scholar]
  40. Tabatabaeefar, A.; Emamzadeh, H.; Varnamkhasti, M.G.; Rahimizadeh, R.; Karimi, M. Comparison of energy of tillage systems in wheat production. Energy 2009, 34, 41–45. [Google Scholar] [CrossRef]
  41. Moghimi, M.R.; Pooya, M.; Mohammadi, A. Study on energy balance, energy forms and greenhouse gas emission for wheat production in Gorve city, Kordestan province of Iran. Eur. J. Exp. Biol. 2014, 4, 234–239. [Google Scholar]
  42. Ra, S.; Hashem, S.; Avval, M.; Mohammadi, A. Modeling and sensitivity analysis of energy inputs for apple production in Iran. Energy 2010, 35, 3301–3306. [Google Scholar] [CrossRef]
  43. Yousefi, M.; Khoramivafa, M.; Mahdavi, D.A.M.; Mohammadi, G.R.; Beheshti, A.A. Soil Tillage Systems Impact on Energy Use Pattern and Economic Profitability in Wheat Agroecosystems. Mod. Concepts Dev. Agron. 2015, 3, 1–7. [Google Scholar] [CrossRef]
  44. Mousavi-avval, S.H.; Ra, S.; Mohammadi, A. Optimization of energy consumption and input costs for apple production in Iran using data envelopment analysis. Energy 2011, 36. [Google Scholar] [CrossRef]
  45. Soltani, A.; Rajabi, M.H.; Zeinali, E.; Soltani, E. Energy inputs and greenhouse gases emissions in wheat production in Gorgan, Iran. Energy 2013, 50, 54–61. [Google Scholar] [CrossRef]
  46. Khoshroo, A.; Mulwa, R.; Emrouznejad, A.; Arabi, B. A non-parametric Data Envelopment Analysis approach for improving energy efficiency of grape production. Energy 2013, 63, 189–194. [Google Scholar] [CrossRef]
  47. Sefeedpari, P.; Rafiee, S.; Komleh, S.H.P.; Ghahderijani, M. A source-wise and operation-wise energy use analysis for corn silage production, a case study of Tehran province, Iran. Int. J. Sustain. Built Environ. 2012, 1, 158–166. [Google Scholar] [CrossRef] [Green Version]
  48. Yousefi, M.; Khoramivafa, M.; Mondani, F. Integrated evaluation of energy use, greenhouse gas emissions and global warming potential for sugar beet (Beta vulgaris) agroecosystems in Iran. Atmos. Environ. 2014, 92, 501–505. [Google Scholar] [CrossRef]
  49. Ziaei, S.M.; Mazloumzadeh, S.M.; Jabbary, M. A comparison of energy use and productivity of wheat and barley (case study). J. Saudi Soc. Agric. Sci. 2015, 14, 19–25. [Google Scholar] [CrossRef] [Green Version]
  50. Banaeian, N.; Omid, M.; Ahmadi, H. Energy and economic analysis of greenhouse strawberry production in Tehran province of Iran. Energy Convers. Manag. 2011, 52, 1020–1025. [Google Scholar] [CrossRef]
  51. Banaeian, N.; Zangeneh, M. Study on energy efficiency in corn production of Iran. Energy 2011, 36, 5394–5402. [Google Scholar] [CrossRef]
  52. Farajian, L.; Moghaddasi, R.; Hosseini, S. Agricultural energy demand modeling in Iran: Approaching to a more sustainable situation. Energy Rep. 2018, 4, 260–265. [Google Scholar] [CrossRef]
  53. Raeeni, A.A.G.; Hosseini, S.; Moghaddasi, R. How energy consumption is related to agricultural growth and export: An econometric analysis on Iranian data. Energy Rep. 2019, 5, 50–53. [Google Scholar] [CrossRef]
  54. Safa, M.; Samarasinghe, S. Determination and modelling of energy consumption in wheat production using neural networks: “A case study in Canterbury province, New Zealand”. Energy 2011, 36, 5140–5147. [Google Scholar] [CrossRef] [Green Version]
  55. Safa, M.; Samarasingh, S.; Mohssen, M. A field study of energy consumption in wheat production in Canterbury, New Zealand. Energy Convers. Manag. 2011, 52, 2526–2532. [Google Scholar] [CrossRef]
  56. Alam, M.S.; Alam, M.R.; Islam, K.K. Energy Flow in Agriculture: Bangladesh. Am. J. Environ. Sci. 2005, 1, 213–220. [Google Scholar] [CrossRef]
  57. Esengun, K.; Gündüz, O.; Erdal, G. Input-output energy analysis in dry apricot production of Turkey. Energy Convers. Manag. 2007, 48, 592–598. [Google Scholar] [CrossRef]
  58. Gündogmus, E.; Bayramoglu, Z. Energy input use on organic farming: A comparative analysis on organic versus conventional farms in Turkey. J. Agron. 2006, 5, 16–22. [Google Scholar] [CrossRef]
  59. Sayin, C.; Nisa Mencet, M.; Ozkan, B. Assessing of energy policies based on Turkish agriculture: Current status and some implications. Energy Policy 2005, 33, 2361–2373. [Google Scholar] [CrossRef]
  60. Ozkan, B.; Fert, C.; Karadeniz, C.F. Energy and cost analysis for greenhouse and open-field grape production. Energy 2007, 32, 1500–1504. [Google Scholar] [CrossRef]
  61. Canakci, M.; Topakci, M.; Akinci, I.; Ozmerzi, A. Energy use pattern of some field crops and vegetable production: Case study for Antalya Region, Turkey. Energy Convers. Manag. 2005, 46, 655–666. [Google Scholar] [CrossRef]
  62. Erdal, G.; Esengün, K.; Erdal, H.; Gündüz, O. Energy use and economical analysis of sugar beet production in Tokat province of Turkey. Energy 2007, 32, 35–41. [Google Scholar] [CrossRef]
  63. Yilmaz, I.; Akcaoz, H.; Ozkan, B. An analysis of energy use and input costs for cotton production in Turkey. Renew. Energy 2005, 30, 145–155. [Google Scholar] [CrossRef]
  64. Snyder, C.S.; Bruulsema, T.W.; Jensen, T.L.; Fixen, P.E. Review of greenhouse gas emissions from crop production systems and fertilizer management effects. Agric. Ecosyst. Environ. 2009, 133, 247–266. [Google Scholar] [CrossRef]
  65. Kuswardhani, N.; Soni, P.; Shivakoti, G.P. Comparative energy input-output and financial analyses of greenhouse and open field vegetables production in West Java, Indonesia. Energy 2013, 53, 83–92. [Google Scholar] [CrossRef]
  66. Soni, P.; Taewichit, C.; Salokhe, V.M. Energy consumption and CO2 emissions in rainfed agricultural production systems of Northeast Thailand. Agric. Syst. 2013, 116, 25–36. [Google Scholar] [CrossRef]
  67. Khan, S.B.; Khan, F.; Sadaf, S.; Kashif, R.H. Crops Area and Production (by Districts) (1981–82 to 2008–09); Government of Pakistan Statistics Division: Islamabad, Pakistan, 2009; p. 214.
  68. Saunders, C.; Barber, A. Comparative energy and greenhouse gas emissions of New Zealand’s and the UK’s dairy industry. In AERU Research Reports; Agribusiness & Economics Research Unit Lincoln University: Lincoln, UK, 2007; ISBN 0909042837. [Google Scholar]
  69. Kitani, O.; Jungbluth, T.; Peart, R.M.; Ramdani, A. CIGR Handbook of Agricultural Engineering (Energy and Biomass Engineering); American Society of Agricultural Engineers: St. Joseph, MI, USA, 1999; Volume 5, ISBN 9780992838713. [Google Scholar]
  70. ASAE. Agricultural Machinery Management Data; American Society of Agricultural and Biological Engineers: St. Joseph, MI, USA, 2011. [Google Scholar]
  71. Wells, C. Total energy indicators of agricultural sustainability: Dairy farming case study. In Technical Paper; Ministry of Agriculture and Forestry: Wellington, New Zealand, 2001; ISBN 0-478-07968-0/0478079680. [Google Scholar]
  72. Charnes, A.; Cooper, W.W.; Rhodes, E. Measuring the efficiency of decision making units. Eur. J. Oper. Res. 1978, 2, 429–444. [Google Scholar] [CrossRef]
  73. Singh, P.; Singh, G.; Sodhi, G.P.S. Applying DEA optimization approach for energy auditing in wheat cultivation under rice-wheat and cotton-wheat cropping systems in north-western India. Energy 2019, 181, 18–28. [Google Scholar] [CrossRef]
  74. Cooper, W.W.; Seiford, L.M.; Tone, K. Data Envelopment Analysis: A Comprehensive Text with Models, Applications, References and DEA-Solver Software, 2nd ed.; Springer: New York, NY, USA, 2007; ISBN 0387452818. [Google Scholar]
  75. Yodkhum, S.; Gheewala, S.H.; Sampattagul, S. Life cycle GHG evaluation of organic rice production in northern Thailand. J. Environ. Manag. 2017, 196, 217–223. [Google Scholar] [CrossRef]
  76. Ullah, K. Electricity Infrastructure in Pakistan: An Overview. Int. J. Energy Inf. Commun. 2013, 4, 11–26. [Google Scholar]
  77. Yadav, S.N. Dynamic Optimization of Nitrogen Use When Groundwater Contamination Is Internalized at the Standard in the Long Run. Am. J. Agric. Econ. 1997, 79, 931–945. [Google Scholar] [CrossRef]
Figure 1. Defining the system boundaries for investigation of input and output energy flow for wheat cultivation in the present study.
Sustainability 12 06884 g001
Figure 2. Map of studied wheat growers of the tehsil Mailsi, Punjab.
Sustainability 12 06884 g002
Figure 3. Distribution of the energy input (GJ/ha) from different sources for wheat production for the production cases of C-I to C-V. Fertilizer energy input is further classified based on type, i.e., N, P2O5 and K2O.
Sustainability 12 06884 g003
Figure 4. Observed energy inputs and outputs for wheat production in Mailsi (Pakistan) for five studied cases. Red diamond line indicates energy use efficiency referring to the secondary vertical axis.
Sustainability 12 06884 g004
Figure 5. Comparison of energy indices (i.e., energy productivity and net energy gain) for the studied five cases.
Sustainability 12 06884 g005
Figure 6. Graphic representation of the actual and estimated grain yields (±8% error bars). The best fit line depicts ideal behavior of predicted and actual values.
Sustainability 12 06884 g006
Figure 7. Data envelopment analysis (DEA)-based comparison of technical efficiencies among five studied cases and potential improvement pattern in energy inputs of inefficient cases.
Sustainability 12 06884 g007
Figure 8. DEA-based comparison of major energy inputs and yield among five studied cases with higher inputs the data point tends to move towards the origin while with lower values tend to move away from the origin. Input scale marked from 0.5 to 1 shows the comparative behavior of energy use.
Sustainability 12 06884 g008
Figure 9. Comparison of CO2 emissions from various sources for wheat production in Mailsi (Pakistan) for five studied cases. Blue columns refer to the secondary vertical axis depicting emissions per ton of grain yield.
Sustainability 12 06884 g009
Figure 10. Defining the relationship between CO2 emissions in kg-CO2 per hectare and actual grain yield in kg per hectare against the input energy employed for studied five cased of wheat production in Mailsi (Pakistan). Black diamonds refer to primary vertical axis while red triangles refer to the secondary vertical axis.
Sustainability 12 06884 g010
Table 1. Socioeconomic characteristics of studied farms and farmers.
PropertyWheat Production Cases
C-ⅠC-ⅡC-ⅢC-ⅣC-Ⅴ
Farmer education (yrs.)5814128
Farmer age (yrs.)3547454250
Farm size (ha)3.647.29141.760.7370.85
Wheat cultivated area (ha)3.246.07121.4620.2568.83
Farm labor (No.)1230810
Number of tractors00422
Source of IrrigationC+TC+TCTeC+T
Canal-to-tube-well ratio(2:1)(2:2)(4:0)(0:3)(2:3)
C, T and Te stands for Canal, Tube well and Electrical pumping, respectively.
Table 2. Details of the equivalents used for input–output energy analyses.
InputsEquivalent (MJ/Unit)
A. A. Saad (2016) India [34]Yousefi M. (2014) Iran [48]Yuan S. (2018) China [20]Esengun K. (2007) Turkey [57]Saunders C. (2007) NZ [68]Kitani O. (1999) USA [69]
Seed (kg)20.113
Diesel (L)56.3151.3356.3156.3143.647.8
Labor (hr.)1.961.961.961.96
Fertilizer (kg)
N60.666.1466.1466.146578.1
P2O511.112.4412.4412.441517.4
K2O6.711.1511.151013.7
Water (m3)1.020.631.020.63
Machinery (kg)
Tractor64.8138
Farm implements62.7
Plough180
Disc harrow149
Rotavator148
Combine harvester83.5116
Chemicals (mL)0.102
Insecticides (kg)101.2101.2315
Fungicides (kg)216216210
Herbicides (kg)238238310
Electricity (kWh)3.611.9311.968.14
Outputs
Grain (kg)15.714.4813
Straw (kg)12.59.25
Note: The bold values represent the equivalents used in this study for input-output energy analyses.
Table 3. CO2 equivalents used for the estimation of CO2 emissions [68].
Input Energy (MJ)Equivalent (kg CO2/MJ)
Fertilizers
N0.05
P2O50.06
K2O0.06
Herbicides0.06
Machinery0.1
Diesel0.0687
Electricity0.0192
Table 4. Description of the input and output energy sources used for the wheat cultivation.
InputsUnitsWheat Production Cases
C–ⅠC–ⅡC–ⅢC–ⅣC–Ⅴ
Direct
Laborh135.85107.44577.1875106.2177.5827
ElectricitykWh154.375154.3750617.5154.375
Waterm32540.653302.8464065.0413302.8464065.031
FuelL91.39111.15158.0898.8190.19
Indirect
Chemicals in kgmL12352470247024700
Chemicals in mLkg000.74100.247
Machineryh
Tractor7.4114.202521.61259.262523.2427
Plough1.2351.2351.85251.85252.47
Disc harrow00001.6302
Rotary hoe1.2351.2351.2351.2351.235
Combine harvester000.617500.6175
Stationary thresher4.944.9404.940
Seedkg123.5123.5123.5123.5148.2
Fertilizerkg
N101.27135.85158.08135.85203.775
P2O5113.6256.81113.6256.8187.685
K2O0061.7500
Outputs
Grainkg29643655.64149.639524446
Strawkg29643655.64149.639524446
Table 5. Operational energy consumption (GJ/ha) resulting from different field operations, divided into sources and shown by each case.
OperationSourceWheat Production Cases
C-ⅠC-ⅡC-ⅢC-ⅣC-Ⅴ
TillageLabor0.0050.0050.0160.0060.020
Machinery0.1810.1810.3870.2450.619
Fuel2.3642.3644.0333.0606.120
Total2.5512.5514.4363.3116.759
IrrigationLabor0.0730.0970.1210.0730.121
Machinery0.0010.1780.3550.0010.355
Fuel0.0011.6693.3380.0013.338
Electricity1.8401.8400.0007.3701.840
Total1.9153.7833.8147.4455.654
Sowing * 0.0010.0010.0010.0010.001
Spraying and fertilizingLabor0.0080.0080.0110.0060.007
Machinery0.0010.0010.0710.0180.018
Fuel0.0010.0010.5560.2780.278
Total0.0100.0100.6380.3020.303
Harvesting and fhreshingLabor0.2130.0980.0020.0980.002
Machinery0.1420.1600.1070.1600.107
Fuel1.8082.2250.9742.2250.974
Total2.1632.4831.0832.4831.083
Grand Total6.640 a8.829 ac9.973 bc13.542 b13.801 b
* Manual seed broadcasting sowing in all cases. a, b, ac, bc Letters indicate the significant differences by ANOVA test.

