Article

Resources Confirmation for Tourism Destinations Marketing Efforts Using PLS-MGA: The Moderating Impact of Semirural and Rural Tourism Destination

1
Faculty of Economics and Business, Universiti Malaysia Sarawak, Kota Samarahan 94300, Sarawak, Malaysia
2
Sarawak Multimedia Authority (SMA), Kuching 93000, Sarawak, Malaysia
3
School of Engineering, Monash University Malaysia, Subang Jaya 47500, Selangor, Malaysia
*
Author to whom correspondence should be addressed.
Sustainability 2020, 12(17), 6787; https://doi.org/10.3390/su12176787
Submission received: 18 July 2020 / Revised: 12 August 2020 / Accepted: 18 August 2020 / Published: 21 August 2020
(This article belongs to the Section Tourism, Culture, and Heritage)

Abstract

:
This study presents a framework to empirically validate the relationship between the tangible and intangible measures on tourism destination marketing efforts. Uniquely, a case study was developed involving two different nature of tourism destinations (semirural and rural) and is incorporated into the framework to assess its moderating effect on the relationships among the predictors and destination marketing efforts. Two hundred and ninety-three usable responses were collected using a questionnaire survey. Partial least squares structural equation modelling was utilized to perform latent variable and multi-group analyses (MGA). The findings revealed that destination appeal was found to be the biggest concern among tourists visiting semirural and rural tourism destinations in Sarawak. For intangible components, both service quality and destination image were found to be significantly related to destination marketing efforts at a semirural tourism destination. Interestingly, for MGA results, it was worthwhile to learn that the relationship between service quality and destination marketing efforts happened to have a stronger impact on semirural than rural tourism destination. Hence, the proposed framework and research findings from this case study have provided significant insights that help various tourism stakeholders to better strategize and position semirural and rural tourism, particularly in the scenario of Sarawak, Malaysia. Future studies can examine this framework and test at other tourism destinations in Malaysia or in some other countries.

1. Introduction

The emergence of a novel virus, the severe acute respiratory syndrome coronavirus 2 (SARS-CoV-2), has led to a coronavirus disease 2019 (COVID-19) pandemic. As a result, global business activities are now at a standstill and the tourism sector is not spared by the disease. In fact, tourism is one of the sectors most affected by COVID-19 whereby physical promotions and campaigns are no longer possible. Prior to the pandemic, the tourism sector was experiencing stellar performance and was considered one of the world’s fastest-growing industries, by contributing significantly to the economies of many countries [1,2]. Realizing the significant economic contribution of the tourism sector, many countries around the world have prepared and scheduled major tourism events and campaigns throughout 2020 in efforts to boost the performance of their respective tourism industry. The emergence of COVID-19 has resulted in almost all business sectors coming to an unprecedented standstill as governments of the world scrambled to contain the pandemic. The recent report by [3] estimated that COVID-19 is likely to generate a decline of 20% to 30% of international tourist arrivals in 2020 to the tourism industry. In fact, the potential economic losses and the adverse impact of COVID-19 towards tourism are still unknown, as its vaccine has not been found. Undoubtedly, the impact is far more critical as compared to crises in the past decades, such as Severe Acute Respiratory Syndrome (SARS) in 2003 and Middle East Respiratory Syndrome (MERS) in 2013.
In the case of Malaysia, against a backdrop of imposed travel restrictions by the government, Tourism Malaysia underscores the importance of digital marketing with industry players such as inbound agencies, homestay operators, and tour guides are encouraged to promote their products and services through online platforms such as social media or websites. From targeting both international and domestic tourists, the current focus of the tourism sector in Malaysia is narrowing solely on domestic tourists. Sarawak, a Malaysian state in Borneo that stretches along the island’s northwest coast, is rich with various natural heritage and unique cultural resources that provide advantages to the development of its rural tourism industry [4]. From the micro-level, Sarawak will be focusing only those tourists in the state during the transition period, as considering the fact that tourist’s (i.e., international or out-of-state) confidence to travel might not be built in the next 6 to 12 months.
Tourism is defined as the movement of people across places [5] who seek to travel for different authentic natural and cultural experiences [6]. Over the past decade, the tourism industry, specifically rural tourism, has long been recognized for its contribution to local economic development [7]. There is an increasing trend that more tourists are traveling to rural destinations due to the attractive natural and cultural components, as rural destinations enable tourists to unwind and taking a respite from their everyday busy routine [8]. The importance of information and communication technology (ICT) and digital technology can be fully utilized to transform tourism industry players, specifically to inbound agencies, homestay operators, and Technopreneurs on a sustainable basis during this crisis moment. Nevertheless, prior to promoting the products or services digitally, it is imperative for industry players to identify their ability to achieve competitive advantage. Experts in tourism are suggesting for tourism players to partake and prepare for post-COVID-19, such as promoting their products and services through online platforms. By publicizing their products digitally, it enables tourism players to create and develop brand awareness in preparation for post-COVID-19.
For post-COVID-19, tourism sector at the country level (i.e., Malaysia) or the state level (e.g., Sarawak) must focus on rural tourism or eco-tourism and avoid mass tourism. The term “rural tourism” is defined as tourism at rural destination setting, with the existence of natural, cultural, and human experiences equipped with rural character [9]. While most rural tourism destinations have similar local resources, it is believed that the way to attract and sustain tourist visits rests on the capabilities of these destinations to provide excellent hard and soft resources that will meet the expectations of these tourists. In consideration of this, it is therefore important for tourism stakeholders to possess comprehensive information about the actual preferences of tourists when visiting a tourism destination, particularly semirural or rural tourism destinations.
Realizing the needs for tourism destinations to prepare a whole new marketing campaign at post-COVID-19, the creation of travel brands for tourism destinations is essential to support better marketing campaigns. Therefore, to create a reputable travel brands, it is important for tourism destinations to take into consideration the availability of fundamental resources (i.e., hard and soft measures) at tourism destinations, as these resources support the development of better tourism destination marketing efforts. Hence, this study endeavors to investigate the development of rural tourism destination marketing efforts from the tourist’s point of view by dwelling into the hard (i.e., destination appeal and tourism infrastructure) and soft measures (i.e., service quality and destination image) that could potentially lead to the development of destination marketing efforts. In this aspect, perceptions of tourists are vital in the assessment of what the main factors for the development of marketing initiatives are for rural tourism destination competitiveness in Sarawak. The findings of this paper are expected to contribute significantly towards the tourism industry that would allow industry players to obtain tourists’ insights into their marketing efforts post-COVID-19. This study intends to fill the literature and theoretical gaps as no known study has been found in investigating both the hard and soft measures in a single framework, and in rural and semirural tourism destinations in the Asian context. This study is perhaps one of the first to employ a multi-group analysis technique, by comparing the significant insights from two different natures of tourism destinations; that is semirural and rural tourism destinations in Sarawak. Therefore, it is vital to infer tourists’ views on tourism destinations at different settings (i.e., rural and semirural).

2. Literature Review

2.1. Stakeholder Theory and Rural Tourism Destination Marketing Efforts

Stakeholder Theory was first introduced in the 19th century by [10] and applied to the business management context. Freeman described the stakeholder as any individual or group related to an organization (e.g., employer, employees, suppliers, customers, etc.) that possesses the ability or potential to influence the achievement of the organization’s objectives, either directly or indirectly [10]. Donaldson and Preston [11] provided a version of the definition for stakeholder as any identified individuals that should have a legitimate interest in the organization. Past studies on business management have repeatedly shown that Stakeholder Theory is the appropriate theory in explaining the relationship between stakeholder involvement in business management for organizational success [12,13]. Interestingly, studies in the past have revealed that Stakeholder Theory has been extensively used in tourism research [14,15].
In the hospitality and tourism context, stakeholders refer to any individual or group that are involved, interested, or affected by tourism activities [16] including host community members, tourists, industry players, or government [17]. Stakeholder Theory was widely used as the fundamental theory in underpinning investigations on tourism development from both the demand and supply perception or perspective [18,19]. Some studies in the area of tourism have propounded that it is crucial to involve all the tourism stakeholders, especially in rural tourism development, because their knowledge and experience in tourism development tends to enhance the efficiency of tourism management [20,21]. Moreover, it is important to note that tourism development should aligned with the tourist’s point of view because they are the sole representatives of the demand-side stakeholders [22] and their perspectives could be value-added knowledge to enhance the efficiency and effectiveness of promoting the tourism destination [23]. Thus, Stakeholder Theory governs this study in examining tourist’s perspective on both the hard measures (i.e., destination appeal and tourism infrastructure) and soft measures (i.e., service quality and destination image) that contribute to the development of rural tourism destination marketing efforts. The proposed predictors are deemed to be significant for the development of tourism destination marketing efforts for destination competitiveness.

2.2. Rural Tourism Destination Marketing Efforts

Prior to COVID-19 pandemic, tourism destination marketing is considered as one of the most powerful tools for the development of tourism destinations to achieve sustainable tourism development [24,25]. To enhance tourist’s travel experience, tourism destination marketing efforts is a much-needed component, as it is defined as a continuous process to identify the needs of the tourists, developing a marketing strategy to satisfy those needs [26]. Buhalis [27] propounded that the implementation of destination marketing efforts must lead to the sustainability of local resources and optimization of the positive impacts on tourism development. It is deliberated that tourists are from diverse backgrounds and cultures; thus, destination marketing was found to play a significant role in developing appropriate offerings to meet the needs of target tourists. Furthermore, destination marketing also plays a major role in promoting local resources, acting as an attractor that will influence the decision making of tourists when choosing a destination [28] as well as switching tourists’ behavior [29].
In addition to that, Xu et al. [30] posited that destination marketing functions as a brand builder [31] and subsequently leads to the development of the destination personality. The successful development of a destination personality is important because it ensures better success of the tourism destination as compared to other tourism destinations [32]. According to [33], destination marketing also helps to improve destination image. On the other hand, rural marketing is another way of expressing destination marketing. Rural marketing is defined as a series of activities that asserts, promotes, and reorganizes customers to purchase certain goods or services [34].
In sum, Blain [35] suggested that a tourism destination which creates differentiation and gains competitive advantage, as well as practices destination marketing efforts for tourism development, would be an added advantage [36]. Most importantly, rural tourism marketing should work along with the objective of achieving rural economic, social, and environmental advantage [24]. Hence, at the recovery phase of the tourism industry, particularly post-COVID-19, it is predicted that destination marketing efforts will be a much-needed tool for tourism branding and promotion as most of the tourism players are encouraged to venture into digital marketing platforms.

2.3. Hard and Soft Components of Rural Tourism

A tourism product can either be tangible or intangible [37] and previous studies have confirmed that both hard and soft measures significantly contribute to the development of tourism destinations [38,39]. A tourism product can either be tangible or intangible services [37]. It was demonstrated that the components of destination appeal and tourism infrastructure substantially influenced the development of rural tourism destination competitiveness [40,41]. Services, on the other hand, are defined as non-physical goods provided in exchange for money in a business environment [42]. On the other hand, service quality is identified as one of the contributors to the development of a destination’s marketing initiatives [43]. Destination image is also recognized as a crucial factor that plays a role in determining the competitiveness and marketing efforts of a tourism destination [44].
The concept of destination appeal has received a growing interest in the rural tourism industry as it could enhance the destination’s attractiveness and attract more tourist visits [45]. Kresic and Prebezac [46] advocated that destination appeals are referred to as the people, culture, climatic condition, landscape characteristics, tourists-related activities, food, and history of the destination. Based on the preceding definition, this study adopted the definition by [46] to examine the influence of natural resources, cultural heritage, and outdoor activities as the appealing factors to attract tourists’ visits to rural tourism destinations. A definition of rural tourism, as proposed by the Finnish theme group, highlighted that the natural and cultural resources are part of the components in the rural tourism context [47]. In consideration of this, it is therefore essential to examine natural and cultural components in assessing the rural tourism destination appeal. Past researchers have highlighted the importance of conserving and enhancing a destination’s natural and cultural tourism resources to improve the destinations’ unique set of assets [48,49]. Within the rural tourism context, natural resources or amenities have become the crucial input for rural tourism products [50]. Tourists are influenced by the quality of natural resources in making travel decisions, especially travelling to a rural tourism destination [51].
Tourism infrastructure has become one of the fundamental factors that influence tourists’ travel decisions to a tourism destination [52] and inevitably enhance its strength to compete with other tourists’ destinations [53]. The term tourism infrastructure is associated with factors such as accommodation facilities, gastronomy facilities, and transport at the destination [27,54]. Past studies on tourism research have repeatedly accentuated tourism infrastructure as one of the most important supporting factors in contributing to the successful development of tourism destination [55], as well as destination competitiveness [56]. In view of the importance of rural tourism in contributing to the local communities’ income, tourists’ arrival has become the main concern for all the tourism stakeholders. This is because the total number of tourist arrivals would have a direct effect on the income generation for the local communities or tourism industry players [57]. In this regard, tourism infrastructure has become one of the fundamental factors that influence tourists’ travel decision making when considering a tourism destination [58]. As stated by [59], tourism infrastructure is divided into two main groups, namely soft infrastructure and hard infrastructure. Soft infrastructure is related to providing training, whereas the hard infrastructure refers to the tangible elements such as transportation facilities, information facilities, and access methods for tourists.
Apart from tourism infrastructure, service quality has been a major concern among the service providers in today’s modern, globalized, and competitive environment [60]. There are various definitions of service quality, and one of the earliest is defined by [61], whereby it is expressed as the comparison between customers’ pre-purchase expectations towards goods and services and the post-purchase perception. Within the literature of rural tourism, the concept of service quality is frequently investigated by tourism researchers in the context of rural tourism or nature-based tourism [62,63]. Services are recognized as an intangible asset [64] and often times these intangible assets play a crucial role in the success of travel sectors [65]. Parasuraman and Zeithaml [66] proposed one of the earliest service quality models, namely the SERVQUAL model. The SERVQUAL model outlined a total of five dimensions, such as tangibles, reliability, responsibility, assurance, and empathy, with 22 measurement items to measure the service quality construct. However, Cronin and Taylor [67] introduced the SERVPERF model to replace SERVQUAL model’s scale because of its limited theoretical support and weak empirical evidence support. Service quality is important to both the urban and rural tourism industry, as the quality of services delivered tends to determine tourists’ satisfaction and subsequently influence visitors’ revisit intentions [58,68]. It is believed that the service quality of the homestay provider plays an essential role in the success and failure of the rural tourism industry [69]. Al-Ababneh [70] stated that the quality of services provided and experienced by tourists’ will determine their level of happiness, which is the better the quality, the happier the tourists. This is a critical aspect to consider in order to build tourists’ satisfaction.
Various studies have established that it is imperative for a tourism destination to possess wonderful destination image as it determines its popularity among visitors [71] while at the same time increases its attractiveness [72]. Ahmed et al. [73] defined destination image in the tourism context as tourists’ perceptions towards a destination that is equipped with a set of tourism services or resources that influence tourists’ consumption behaviour. Gartner [74] is of the opinion that destination image is developed based on the three components, namely cognitive, affective, and conative. Past researchers have provided definitions for these three components; the cognitive component is referred to as the belief or knowledge about a destination’s attributes evaluations [75], whereas the affective component is defined as the feelings aroused by a place, by people with different motives [73]. These are the two widely used components to measure destination image [76]. Simplified, the cognitive image is the rational element, whereas the affective image is associated with the emotional aspects [75]. On the other hand, the conative image outlines the consumer’s future desire or intention [77]. In the rural tourism context, tourists’ visitation and expenditure originate from the concept of consumer behavior [78], and hence, brand image or destination image plays a crucial part in shaping the tourists’ choice in making travel decisions [79]. Therefore, this study adopts destination appeals and tourism infrastructure as a tangible product or hard services as both constructs provide physical satisfaction to visitors. On the other hand, the service quality and destination image are referred to as intangible products or soft services. This study attempts to test the impacts of both hard and soft components of tourism destination marketing efforts in rural and semirural tourism destinations of Sarawak.

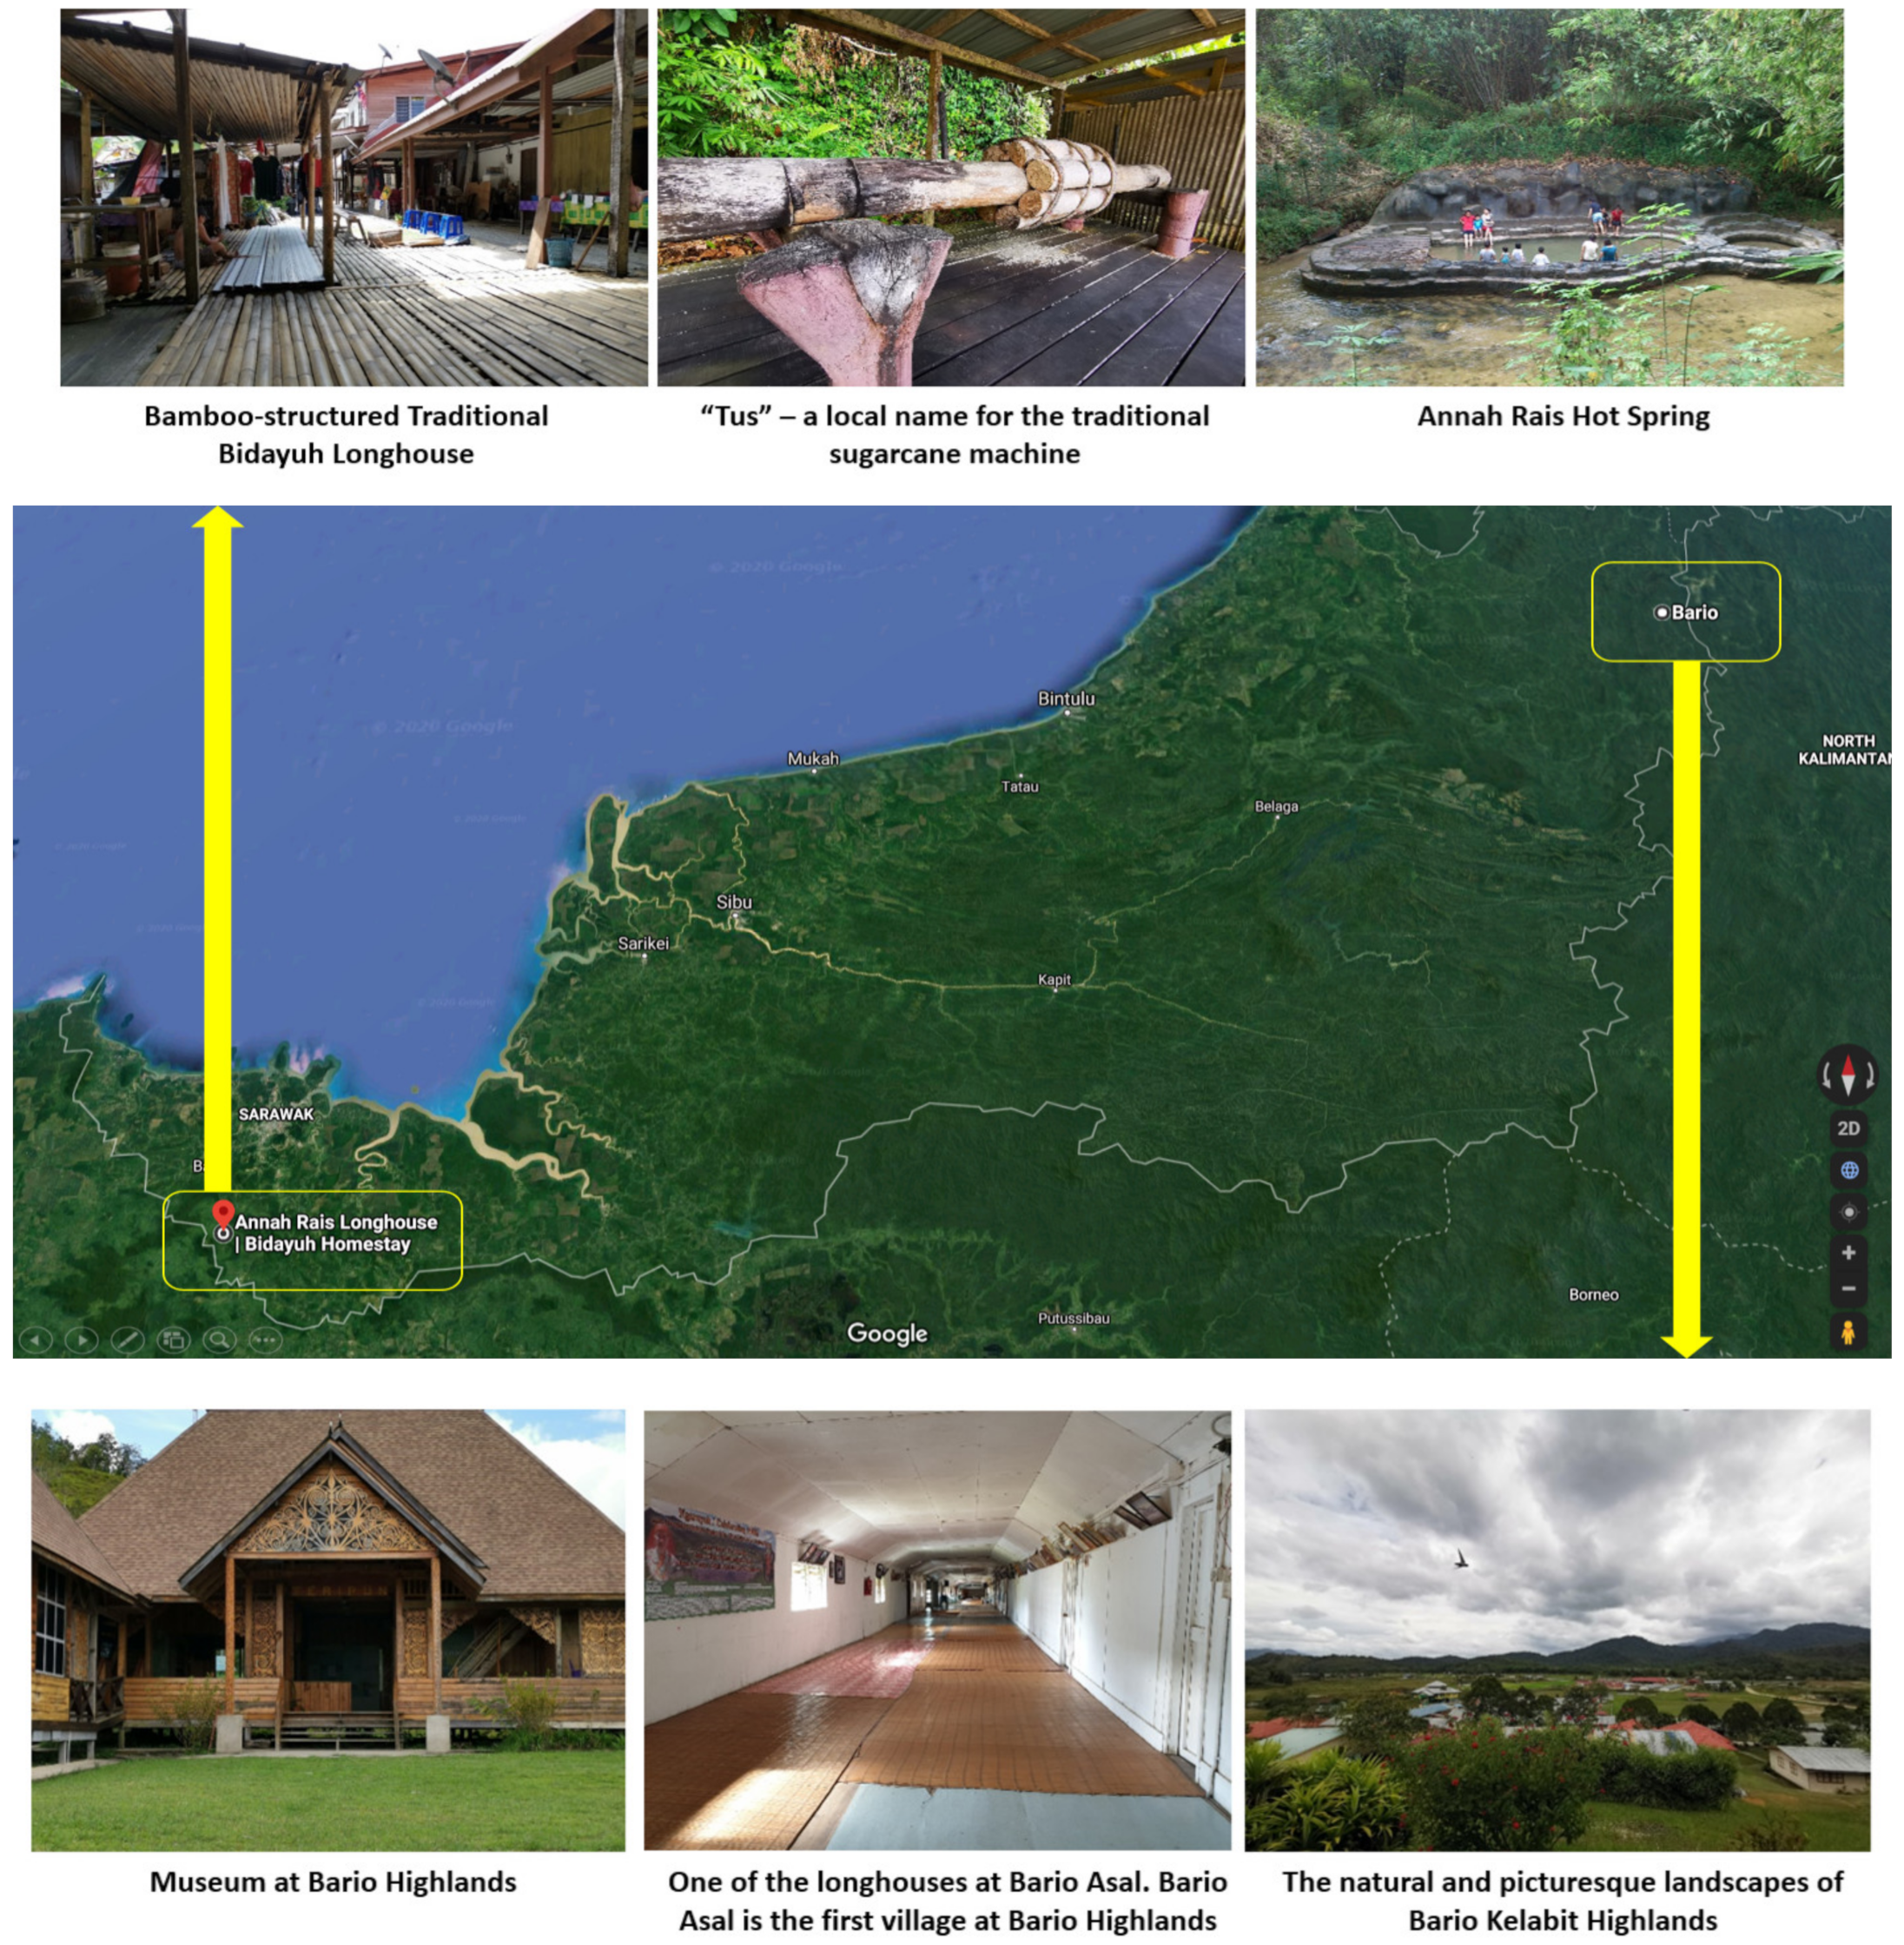
2.4. Semirural and Rural Tourism Destination

Within tourism literature, there has been a growing interest in the study of rural tourism due to its potential to contribute to the rural economy and help in increasing the standards of living among the local communities [80,81]. According to [82], rural tourism is defined as tourism activities that take place in rural areas, whereby all operations are handled by local communities, while offering a series of custom-made tourism activities with traditional characteristics to tourists with continued development over time to ensure sustainability. Okech [83] stated that some important characteristics of rural tourism include small settlements, low population, and traditional livelihood. Another recent definition of rural tourism by [9] defines it as tourism activities that take place at rural destinations with close proximity to the rural environment and have rural characteristics [84]. Paimin et al. [85] also propounded that the cultural uniqueness, flora, and fauna are the primary resources attracting tourists to visit a rural tourism destination. Moreover, it was found that rural tourism has successfully built an attractor that is said to be attractive to tourists based on their cultural, historic, ethnic, and geographical roots [86]. These are the important rural characteristics that bring tourists back to the very nature-based environment [87].
On the other hand, a semirural tourism destination shared most of the common rural destination characteristics. The differences between these are from the aspect of connectivity and better infrastructure for semirural tourism destination (i.e., better road access, distance from the main city, and better ICT infrastructure). However, all tourism activities provided to tourists by both sets of tourism destinations are to be aligned with the objectives of providing natural, cultural, and human experiences that are contrary to an urban context [88]. Past studies have envisaged that identifying tourists’ experiences and preferences are important as tourists’ experiences and preferences are useful for rural tourism development [89]. Thus, in this study, data were collected from two tourism destinations, namely Annah Rais Bidayuh Longhouse (semirural) and Bario Kelabit Highlands (rural) in the Sarawak. Annah Rais Bidayuh Longhouse is located about 56 km from the city center of Kuching, approximately an hour’s drive from the city center by using the paved roads. Bario Kelabit Highlands, on the other hand, is a rural tourism destination that takes more than 8 hours’ drive via logging road, or by a small 19-seater aircraft.

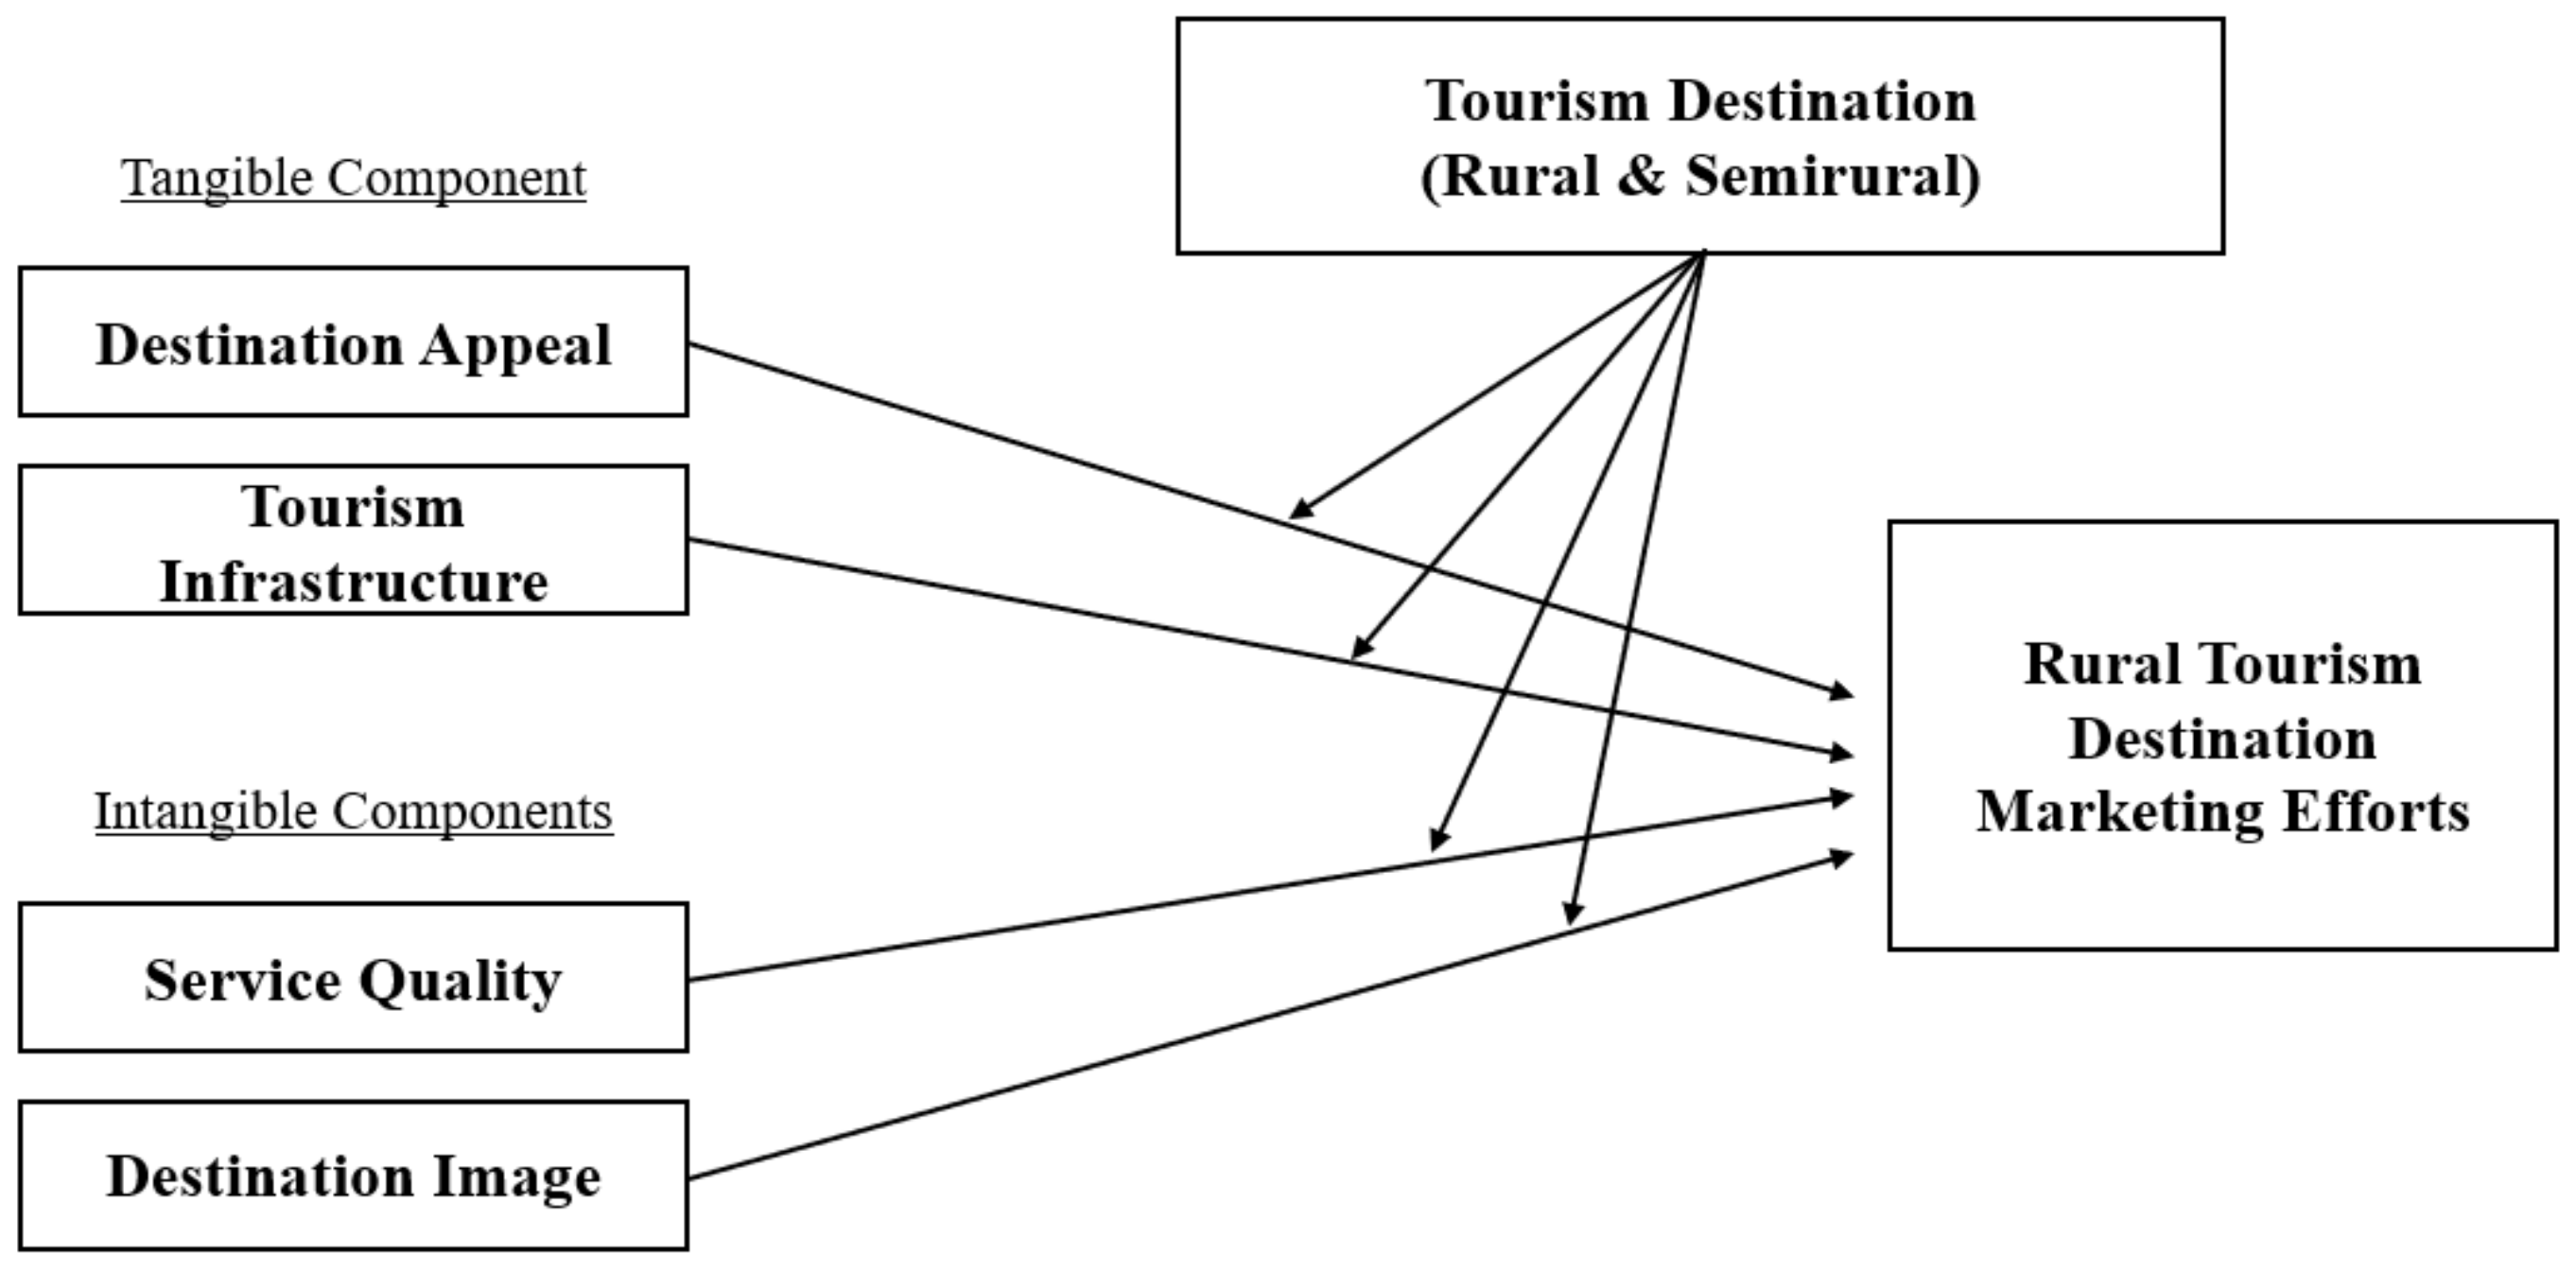
2.5. Hypotheses Development

2.5.1. Hard and Soft Components on Rural Tourism Destination Marketing Efforts

The fundamental attractiveness of a tourism destination is made up of various destination appeals, namely natural resources, cultural heritage, and social appeals [90]. The attractiveness functions as a pulling factor to draw tourists’ visitations [91]. As stated by [54], an appropriate marketing and management strategy could lead to the enhancement of tourism destination competitiveness [92]. Moreover, a study by [93] identified destination appeal resources (e.g., natural resources, heritage, cultural, festivals, and a range of available activities) as the crucial attributes in promoting destinations. On the other hand, Moric [94] pointed out that the efficiency of tourism infrastructure plays a pivotal role in attracting tourists to a destination, particularly rural tourism destinations [95]. Realizing the importance of tourism infrastructure in contributing to the tourists’ satisfaction [96] and tourism destinations’ sustainability and competitiveness [97], thus it is propounded that good tourism infrastructure would function as a key promotion tool in marketing the rural tourism destinations [34].
Fabricius [98] opined that “experience” is the product sold by tourism destinations rather than tangible or physical products and services. Fuchs and Weiermair [99] have highlighted the effectiveness of tourism facilities and services that would provide memorable destination experiences for tourists, and this would further lead to improved tourist satisfaction [100]. Past studies [101,102] continually found that tourist satisfaction has a direct and substantial impact on successful destination marketing. A number of recent studies [103,104] confirmed that service quality possesses a strong relationship with the destination marketing. This is highlighted by past research [105,106] that destination image plays a major role in tourism marketing, as the destination that is positioned as a good image is likely to result in successful destination marketing [107,108]. In a similar vein, destination image functions as one of the key aspects for successful destination marketing [109,110].
Based on the above discussion of the existing research, the following hypotheses were formulated:
Hypothesis 1 (H1).
Destination appeal is positively related to rural tourism destination marketing efforts.
Hypothesis 2 (H2).
Tourism infrastructure is positively related to rural tourism destination marketing efforts.
Hypothesis 3 (H3).
Service quality is positively related to rural tourism destination marketing efforts.
Hypothesis 4 (H4).
Destination image is positively related to rural tourism destination marketing efforts.

2.5.2. The Nature of Tourism Destination (Semirural and Rural)

The nature of tourism destination plays an important role in the development of tourism destination marketing efforts. In comparison between semirural and rural destination, semirural tourism destinations could be equipped with a better tourism infrastructure than rural tourism destinations. This study compares insights collected from two different tourism destinations, namely Annah Rais Bidayuh Longhouse (semirural) and Bario Kelabit Highlands (rural). Annah Rais Bidayuh Longhouse is located about 56 km from the city center of Kuching, approximately an hour’s drive by using the paved roads. Bario Kelabit Highlands, on the other hand, is a rural tourism destination that takes more than 8 hours’ drive via logging road, or by a 19-seater aircraft (see Figure 1 for the location of research sites).
Hence, the following hypotheses were proposed:
Hypothesis 5a (H5a).
Nature of tourism destination moderates the effect of destination appeal on rural tourism destination marketing efforts; such that the impact of destination appeal on destination marketing efforts is stronger in semirural than rural.
Hypothesis 5b (H5b).
Nature of tourism destination moderates the effect of tourism infrastructure on rural tourism destination marketing efforts; such that the impact of tourism infrastructure on destination marketing efforts is stronger in semirural than rural.
Hypothesis 5c (H5c).
Nature of tourism destination moderates the effect of service quality on rural tourism destination marketing efforts; such that the impact of service quality on destination marketing efforts is stronger in semirural than rural.
Hypothesis 5d (H5d).
Nature of tourism destination moderates the effect of destination image on rural tourism destination marketing efforts; such that the impact of destination image on destination marketing efforts is stronger in semirural than rural.
Based on this discussion of the existing research, the following research framework was proposed (see Figure 2):

3. Methodology

For data collection, a quantitative approach was adopted for this study via the distribution of questionnaires. This study applied a non-probability sampling method, specifically purposive sampling technique, the selection of respondents at the age of 16 years old and above, regardless of whether they are domestic or international tourists who are visiting the two selected tourism destination in Sarawak, namely Annah Rais Bidayuh Longhouse (semirural) and Bario Kelabit Highlands (rural). A total of 45 items were adapted from previous studies [54,76,111,112,113,114] and modified accordingly to fit the Malaysian context (see Appendix A). Respondents were requested to respond to the statements by stating their level of the agreement via a seven-point Likert-scale (ranging from 1 = strongly disagree to 7 = strongly agree. G*Power (version 3.1.9.2) software was adopted to calculate the minimum sample size. By running a priori power analysis using a medium effect size with a significant level of 0.05 and the power of 0.95, thus the suggested minimum sample size needed to assess the research model developed is 138. Out of the 350 distributed, a total of 293 were returned, which indicated an 83.7% response rate. The response rate of 83.7% has indicated a free from response error as it exceeds the suggested percentage of 70% [115]. Prior to measurement and structural analysis, a series of preliminary analyses via Statistical Package for Social Science 25.0 was conducted to eliminate the issue of missing values and straight lining. The SmartPLS (version 3.3.0) was used to perform the Partial Least Square—Structural Equation Modeling (PLS-SEM) estimation procedure to examine the research model developed (see Figure 2).

4. Findings

4.1. Assessment of the Measurement Model

Table 1 reported the demographic profile of the respondents based on full sample, semirural, and rural. At the stage of assessing the measurement model, a few analyses were performed to confirm the reliability and validity of the data. First, a confirmatory factor analysis (CFA) was performed, and the measurement scales’ reliability, convergent validity, and discriminant validity were tested. Based on the findings (see Table 2), all the items’ loadings meet the minimum cut of point of 0.50 [116], all the constructs’ composite reliability (CR), as well as the average variance extracted (AVE), were above 0.70 [117] and above 0.50 [118], respectively. Thus, the internal consistency was achieved.
For the discriminant validity (see Table 3), reference was made to [118] criterion, the value of AVE was square rooted and testified against the inter-correlation of the construct with other constructs in the research model, and all the values noted as greater than each of the constructs’ correlation [117]. The results of convergent validity were reported respectively, that include results for the full sample, semirural, and rural group. Hence, the measurement model was satisfactory and provided sufficient evidence in terms of reliability, convergent validity, and discriminant validity. The coefficient of determination (R2) for rural tourism destination marketing efforts was 0.477 (for full sample), 0.770 for semirural), and 0.403 (for rural), which explained more than 47.7%, 77.0%, and 40.3% of the construct, respectively. All of these R2 values reported indicating a substantial model [119].

4.2. Assessment of the Measurement Invariance

One of the essential analyses to test prior to perform a multi-group analysis (MGA) is the measurement invariance. The purpose of assessing the measurement invariance is to ensure measurement models yield measures of the same attributes even though it is tested under different observing conditions [120]. Therefore, to test the MGA for the proposed model, an invariance test was conducted to determine the measurements are similarly understood across both tourism destinations with different natures (i.e., semirural and rural). The three steps approach suggested by [120] was (i) configural invariance, (ii) compositional invariance, and (iii) equality of composite mean values and variances.
Firstly, an analysis of configural invariance was conducted between semirural and rural data sets. This was conducted because the measurement models have the same basic factor structure for both groups (i.e., the same number of constructs and items loaded on those constructs) [see Table 3]. Next, a permutation test was conducted to examine the compositional invariance. The requirement for compositional invariance is to ensure that the composite scores are equal across groups. The c value results (=1) was reported in Table 4, straddle between the upper and lower bounds of 95% confidence interval. Thus, the compositional invariance of the research model was established.
Finally, the composites equality of mean values and variances was tested (see Table 4) across the two groups of tourism destinations (i.e., semirural and rural) must fall within the 95% confidence interval. The results projected that all composite constructs have non-significant differences in terms of the composite mean and variances ratio. In sum, it can be concluded that the different model estimations of semirural and rural groups are not distinct in terms of the content or meaning of the constructs.

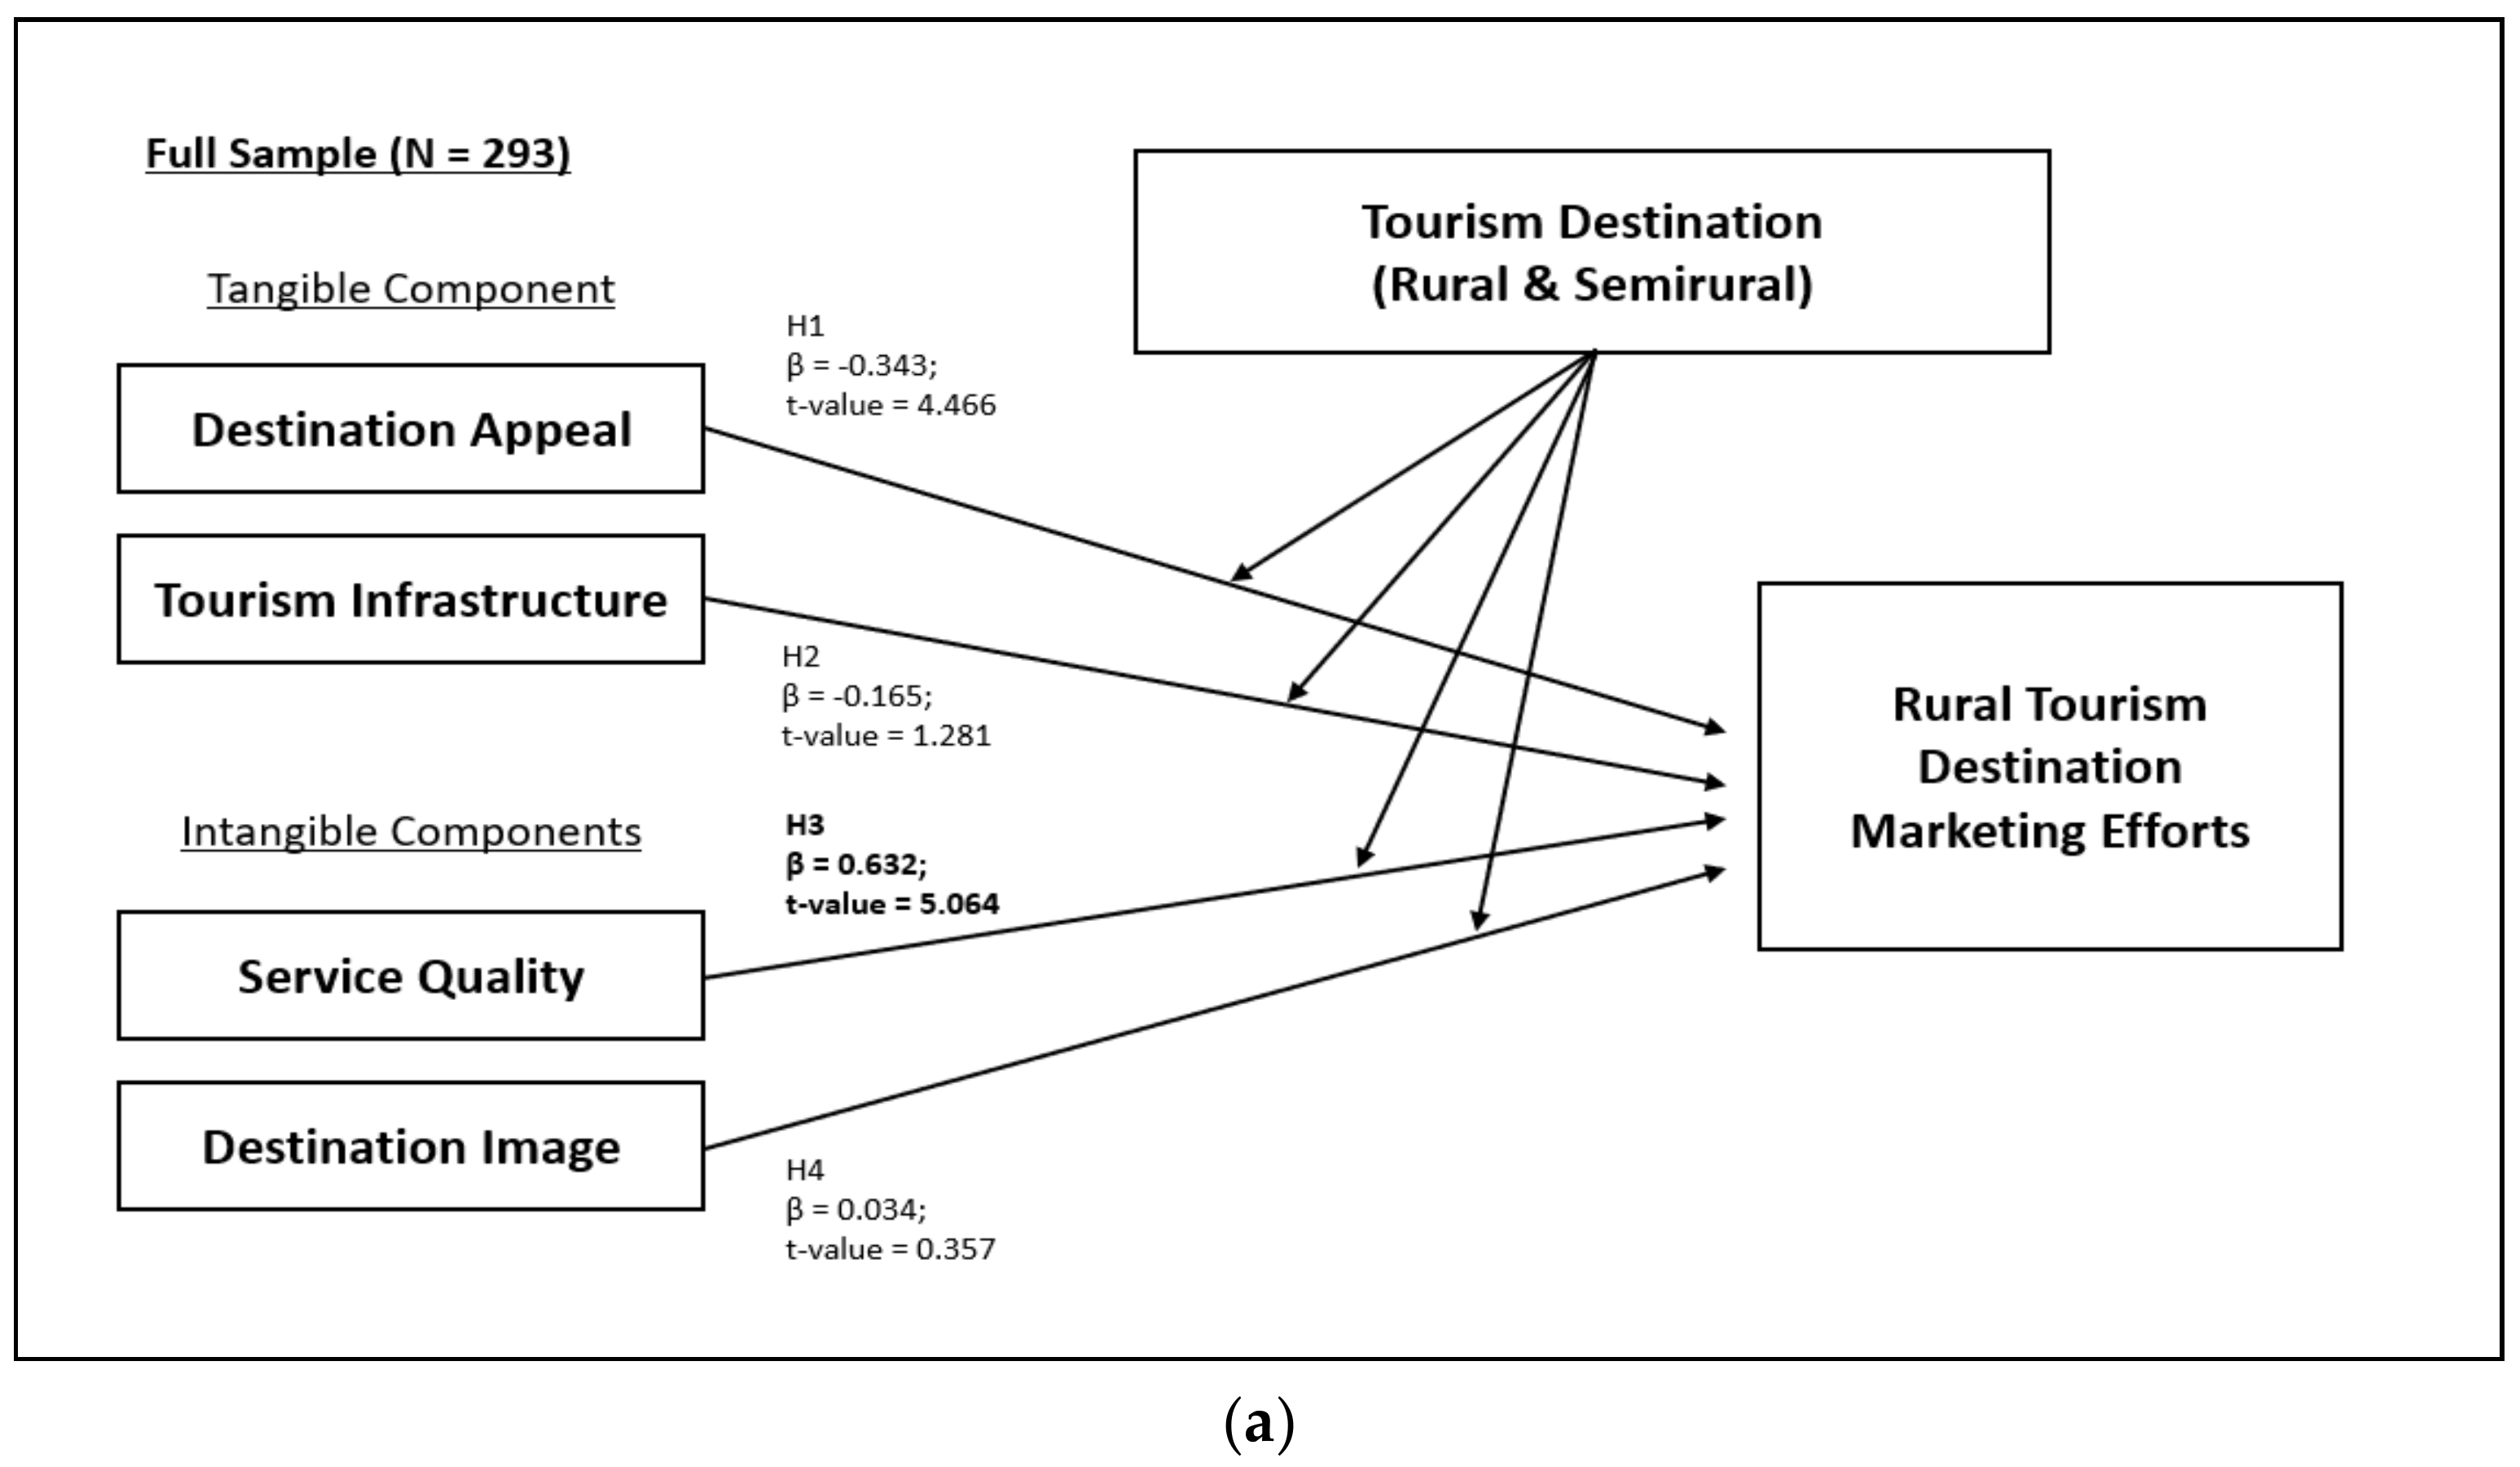
4.3. Assessment of the Structural Model

Next, Table 5, Figure 3 present the results from hypotheses testing. The rule of thumb for one-tailed hypotheses testing is t value should exceed 1.645 (p < 0.05) or 2.33 (p < 0.01). For the statistical findings for the full sample, the statistical results indicated that one of the direct relationship hypotheses tested was found supported. Service quality was found positively significant with destination marketing efforts (H3). Interestingly, in the group of semirural, three of the hypotheses proposed were found supported, which were H1, H3, and H4. Surprisingly, only one out of four hypotheses tested was found supported for the rural group, namely, H1. To explain the predictive relevance of the model, the Q2 value for the full model was obtained with the value of 0.307, and it is aligned with the suggestion by [121] that the Q2 value of more than zero value is relevant (see Table 6). On the other hand, the Q2 value for semirural and rural was 0.509 and 0.255, respectively. Table 6 shows the R2 value for the full sample (0.477), semirural (0.770), and rural (0.403).

4.4. Assessment of Group Differences

A partial least square—multi-group analysis (PLS-MGA) was conducted to explore the differences by using Welch–Satterthwait Test [122] on semirural and rural data sets. The differences in paths coefficients between the two data sets were reported in Table 7, Figure 3. Both H5a and H5b were not supported. The reason being is that H5a have a weaker path coefficient value for semirural (β = 0.125) compare to rural (β = 0.467), whereas H5b have a negative path coefficient value for semirural (β = −0.035). Interestingly, H5c and H5d were found supported, that is, both service quality and destination image were found to have a stronger impact on destination marketing efforts in semirural than rural.

5. Discussion

The results of the structural assessment are reported in Table 5 (results for direct relationship) and Table 7 (results for path differences between semirural and rural tourism destinations). Interestingly, hypothesis one (H1) shows consistent results across both semirural and rural destinations in Sarawak. The results demonstrated that destination appeal had a significant impact on the destination marketing efforts for semirural group (β = 0.125; t = 2.589) and rural group (β = 0.467; t = 7.613); thus, H1 is supported. The findings are congruent with past studies [34,90] which revealed that both variables, destination appeal and destination marketing, show a strong relationship with each other. It is undeniable that the sole unique selling proposition of a semirural or rural tourism destination is on their local destination resources (i.e., natural, cultural, and heritage components) which uniquely differentiates them from urban tourism. This is manifested in the statistical results and revealed that tourists in both semirural and rural groups considered destination appeal leads to better implementation of marketing activities. Destination marketing aims to promote the destination and to increase its visibility to prospective or potential visitors. To successfully promote tourism destinations, both tangible and intangible aspects of the destination plays a vital role in enhancing the effectiveness and the efficiency of marketing efforts. Hence, it is important for tourism stakeholders, especially government and local industry players, to preserve and take good care of the destination appeal resources of a tourism destination (i.e., natural resources, cultural heritage, and outdoor activities) as they play an important role in strengthening the tangible aspect of the tourism destination and indirectly enhance the destination marketing activity at the tourism destination [91].
Hypothesis two (H2) investigates the direct impact of tourism infrastructure on destination marketing efforts at both semirural and rural tourism destination. Surprisingly, the results demonstrated that tourism infrastructure was found to have no significant impact on destination marketing efforts for both semirural (β = −0.035; t = 0.554) and rural group (β = 0.130; t = 1.097); hence, H2 is not supported. The statistical findings contradict results from previous studies [94,95] as these studies established that the efficiency of tourism infrastructure (i.e., transportation and accommodation) at a tourism destination tends to an increase in the visitation rate [94]. The results of the present study indicate that tourists are of the opinion that the current tourism infrastructure at both semirural and rural tourism destinations do not lead to a better destination marketing effort. This is justifiable, as the existing quality of tourism infrastructure is not meeting their expectations. For instance, to reach Bario (rural destination), a tourist has the option of either flying in a 19-seater airplane from Miri to Bario, or alternatively, driving 8 h through logging roads. On the other hand, to visit Annah Rais (a semirural tourism destination), tourists are able to conveniently reach Annah Rais either by taxi or tour van, for which the fare could be high. Therefore, government or related tourism stakeholders should take the initiative to improve on the quality and the efficiency of tourism infrastructure (i.e., transportation, connectivity, and accommodation) as it is proven in the past that the quality of tourism infrastructure helps in the marketing initiatives for tourism destinations. Tourists are more convinced with the good experiences when dealing with these infrastructures, and this would lead to a positive word of mouth (WOM) and gain more visits or revisits of tourists to the destination. In the long run, the effort to promote the tourism destination will be a success, as the marketing mechanisms run on its own through tourists spreading good reviews of the destination.
As for hypothesis three (H3): Service quality is found to significantly impact destination marketing efforts at semirural and rural tourism destinations of Sarawak. The findings highlight a different result for the semirural and rural groups. It was found that service quality in semirural group (β = 0.812; t = 14.707) support destination marketing efforts, whereas in rural group (β = 0.180; t = 1.514), the results are in contrary. The results of this study for the semirural group are congruent with past studies [104] showing a significant positive relationship between service quality and destination marketing efforts. Notably, the quality of tangible elements alone will not build up a tourism destination, as the integration of intangible aspects are essential for destination marketing efforts and will be advantageous to the development of destination marketing effort initiatives. For instance, service quality in a hotel setting is dependent on the expertise and kindness of the staff [123]. Considering that tourists place a very high emphasis on the experiences gained during their visits [100] and want to ensure that their stay is worth the expenditure they spend, it can be surmised that the provision of better service quality would lead to a better destination marketing effort. The present study validated that local service providers for semirural tourism destination tend to provide a better quality of services compared to the rural tourism destination. This is possibly due to the fact that local service providers for the semirural tourism destination are more exposed and engaged with tourists, as they received more frequent visits from both domestic and international tourists. For rural tourism destinations, they received a minimal visitation from tourists due to the connectivity and accessibility issues. However, it is essential for tourism stakeholders to improve on the service quality, as good quality services provided by the local community and local industry players would strengthen marketing initiatives of the rural tourism destination. It is undeniable that service quality is one of the marketing tools for destination marketing [103].
The statistical findings for hypothesis four (H4) indicated a contradiction of results on semirural group (β = 0.142; t = 3.047) and rural group (β = 0.108; t = 1.227) of tourism destinations at Sarawak. The results revealed that in a semirural group, the destination image is found to support destination marketing efforts, whereas rural group results in contrary findings. One of the propositions that have been debated is the role of the destination image as a marketing tool for destination marketing or promotion [124,125]. The findings of this study authenticate that tourists believe a good image of a semirural tourism destination is important, and the positive image portrayed would indirectly benefit the marketing efforts of the tourism destination. Semirural tourism destinations in Sarawak are portrayed as destinations with an abundance of natural and cultural heritage resources, and these pristine resources have attracted many tourists seeking natural scenery to rest and unwind from the everyday urban lifestyle. For tourists to decide on a tourism destination, they are heavily reliant on existing promotional tools that create awareness and inspire interest. However, it is disappointing that the destination image of rural tourism destinations is not well promoted albeit local natural and cultural resources are available at rural tourism destinations. The ability of local tourism stakeholders to fully leverage those resources for promotional initiatives are still at a minimal level. From the findings, it accentuates the magnitude of building a good destination image of a rural tourism destination as positive images portrayed to tourists assist in implementing effective destination marketing efforts to promote the destination.
The results of the MGA analysis of this study highlighted that the relationship between service quality and tourism destination marketing efforts have a stronger impact on semirural tourism destination (β = 0.812) than on rural tourism destination (β = 0.180); thus supporting H5c. From the findings, tourists perceived that service quality at a semirural tourism destination is better than a rural tourism destination, which could be the consequences of tourists’ engagement with the local community [126]. In the semirural tourism setting, there is a higher chance that tourists will mingle with the local community compared to rural tourism destination. It is worth noting that tourists are found to be more engaged with the local community at the semirural tourism destination since local tourism service providers are familiar in dealing with visitors. as they received a higher and more consistent number of visitors throughout the year. Furthermore, the location of a semirural tourism destination is competitive, as it provides easy accessibility, unlike rural tourism destinations. As a result, the local communities at semirural destinations are found to be able to provide a better quality of service that meet tourists’ needs and expectation due to their frequent contacts with tourists. Therefore, the results from this study emphasize that tourism stakeholders should develop a platform that encourages knowledge-sharing initiatives across different natures of tourism destinations. Knowledge sharing between local tourism operators among the semi and rural groups could potentially boost the innovativeness and competitiveness [127] of tourism destinations in Sarawak.
Contrary to H5c, the MGA results indicated that H5a, H5b, and H5d are not supporting the hypotheses; that is, the relationship between destination appeal (H5a), tourism infrastructure (H5b), and destination image (H5d) on destination marketing efforts have a weaker impact on semirural than rural tourism destinations. Moreover, statistical findings of H5a insinuate to meet the acceptance rate of t-value and p-value, though the beta value for semirural is weaker compared to rural tourism destination. Thus, the results indicated that H5a is not supportive. One of the possibilities for this could direct towards destination appeal, the natural and cultural components of a rural tourism destination, which appeared to be unique compared to semirural. Similarly, the results for hypotheses H5b and H5d revealed that there are no significant relationships or impacts found among the semirural and rural tourism destinations.

6. Conclusions

The case study highlights the importance of destination appeal (e.g., natural, cultural, and heritage) components as these variables are found to be the most concerned by tourists visiting semirural and rural tourism destinations of Sarawak. From an intangible component perspective, both service quality and destination were found to be significantly related to destination marketing efforts at a semirural tourism destination. Based on the MGA results, it is noted that the relationship between service quality and destination marketing efforts results in a stronger impact on semirural than rural tourism destination. The findings of this case study have provided several significant insights to the local community, local tourism players, as well as the relevant government tourism departments. By taking into consideration the perspectives of tourists, it was found that service quality gave more impact on destination marketing efforts at a semirural tourism destination than a rural tourism destination. Thus, it is suggested that the government and the private tourism stakeholders need to work together, and they need to use all possible platforms to encourage sharing of knowledge among the community members residing at the semirural and rural tourism destinations. As sharing of these valuable insights is able to help other tourism destinations within Malaysia to better perform in serving tourists. The next section highlights the theoretical implications, practical implications, and directions for future research.

6.1. Research Implications

This study brings attention to the growing trend whereby more tourists are now gravitating to visiting places that offer natural and cultural attractions, specifically rural tourism destinations. We propose that rural tourism destinations are to be one of the main targets of tourism to revitalize the tourism industry post-COVID-19. Our rationalization is based on the exploration of the impacts of both hard and soft measures in a single framework at rural tourism destinations which are not found in the body of literature. This study is one of the initial initiatives to explore the potential contribution of both hard and soft components at semirural and rural tourism destinations of Sarawak. Indeed, the total number of tourists visiting rural tourism destinations in Sarawak at the current stage is limited, nevertheless, if we can obtain the views of tourists on factors that attract them the most to visit rural tourism destinations in Sarawak, the data could be applied to other rural tourism destinations in Sarawak or Malaysia. This could provide the impetus for destination marketing efforts in Sarawak and Malaysia post-COVID-19. Due to movement restrictions and lockdown imposed by governments to contain COVID-19, digital marketing platforms are regarded as one of the means to successfully promote rural tourism destination, The findings of this study provide empirical evidence and useful facts on the hard and soft measures that impact tourists while visiting semi or rural tourism destinations. Hence, this study has considerably contributed to destination marketing efforts and serves as a preliminary effort for boosting the digital marketing strategy in the tourism sector.
A number of tourism initiatives being prepared by countries including Malaysia to recover the tourism industry post COVID-19. Some of the recovery plans suggested by [3] are to refocus from quantity to quality, diversify cultural tourism, boost the community’s participation, and to be innovative through a digital platform. This study is probably one of the pioneers to identify the concerns of tourists in visiting the semirural and rural tourism destinations of Sarawak. The findings are regarded to be beneficial to tourism stakeholders in boosting their rural tourism industry at the state or country level. In developing a strategic digital marketing strategy, one of the prerequisites is to identify the local resource or the unique selling proposition of the destination. By leveraging the findings of the present study, there are a handful of components that are found to attract tourists to visit a rural tourism destination. Therefore, from the practitioners’ perspective, the findings of this study could support tourism stakeholders to manage and develop a destination marketing strategy effectively and promote rural tourism destinations in Sarawak. Ultimately, the findings of this study contributing to boost the tourism industry, increase the local community income, enhance a country’s economic growth, and indirectly contributing to the world Sustainable Development Goals (SDG), specifically to no poverty and gender equality at rural tourism destinations.

6.2. Limitations of the Research

As with any research, this study has several limitations. Firstly, this study relies primarily on samples drawn from tourists, both international and domestic, who have visited the semirural and rural tourism destinations in Sarawak, Malaysia. However, results may vary if the survey is to be conducted in the western context. As such, comparative studies across cultures, locations, and tourism industries are needed in order to truly understand the constructs comprised in this study that brings impact to the development of rural tourism destination marketing. Additionally, the data collection was done at one point in time and not from different points in time. Thus, the causality effect of this study cannot be determined due to data collected at one point and not from the same group of participants over a longer period of time. Therefore, the longitudinal study should be carried out and replace the cross-sectional study to determine the causality effect of the study.

6.3. Directions for Future Research

Future research may include other moderators in the current framework as the present study tests the moderating role of the nature of tourism destination (i.e., semirural and rural) by utilizing the MGA approach. Additionally, further study may consider examining other potential moderator variables such as ICT adoption, social media marketing, virtual reality experiences, and tourism product innovativeness into the research framework. The results and findings with other moderating variables could provide a substantial impact on the development of rural tourism destination marketing efforts. On top of that, it is suggested for scholars to further examine the present research model at different nature of tourism destinations in Malaysia as well as in other countries, a different set of results could possibly be drawn, or the results could be congruent with this study. In sum, the findings could add value to the domain of rural tourism destination marketing efforts.

Author Contributions

C.H.C.—Research Framework, Research Design, Methodology and Data Analysis; Professor M.C.L.—Literature Review and Research Framework; Z.b.R.—Research Framework and Introduction; P.P.—Research Framework and Discussion; A.A.M.—Research Framework and Literature Review. All authors have read and agreed to the published version of the manuscript.

Funding

This research was funded by Universiti Malaysia Sarawak (UNIMAS) and Sarawak Multimedia Authority (SMA). The APC was funded by Sarawak Multimedia Authority (SMA), grant number RG/I03/SMA/18/2019.

Conflicts of Interest

All authors declare that there are no conflicts of interests.

Appendix A

Table A1. Construct(s) and Measurement Item(s).
Construct(s)Item(s)Measurement Item(s)Sources
Destination Appeal (DA)DA_01This place has beautiful flora and fauna.[111,113]
DA_02This place has attractive natural scenery.
DA_03This place is rich with natural resources.
DA_04This place has variety of unique cultural attractions.
DA_05This place has unique heritage attractions.
DA_06This place has high quality craft products.
DA_07This place has many outdoor adventurous activities.
Tourism Infrastructure (TI)TI_01This place has adequacy of infrastructure to meet visitor needs.[93,111]
TI_02This place has availability of local transport systems to support tourism facilities.
TI_03The accommodation in this place has good quality.
TI_04There are electricity supplies in this place.
TI_05This place has the availability of telecommunication system for tourists.
TI_06The tourist attract spot are easily accessible.
Service Quality (SQ)SQ_01The service providers were friendly and courteous.[66]
SQ_02The service providers provided prompt service.
SQ_03The service providers were knowledgeable about the products and services offered.
SQ_04The service providers were professional and gave me confidence.
SQ_05The service providers were always willing to help me.
Destination Image (DI)DI_01This place is safe and clean.[76]
DI_02This place is a restful and relaxing place to visit.
DI_03There are many places of interest to visit in this place.
DI_04This place offers a pleasant environment.
DI_05This place provides an exciting experience.
DI_06This place provides a relaxing environment.
Destination Marketing Efforts (DM)DM_01Tourism helps to increase the development of a strong destination image.[111]
DM_02This place has an overall favorable image in the world community.
DM_03This place has commitment to providing a satisfactory vacation experience for tourists.
DM_04This place has continuous commitment to the ongoing improvement and development of a high-quality destination.
DM_05This place has commitment to providing a safe and secure environment.

References

  1. Scott, D.; Hall, C.M.; Gössling, S. Global tourism vulnerability to climate change. Ann. Tour. Res. 2019, 77, 49–61. [Google Scholar] [CrossRef]
  2. Yang, S.; Ishtiaq, M.; Thanh, B.T. Tourism industry and economic growth nexus in Beijing, China. Economies 2019, 7, 1–15. [Google Scholar]
  3. UNWTO. International Tourist Numbers Could Fall 60–80% in 2020, UNWTO Reports. Available online: https://www.unwto.org/news/covid-19-international-tourist-numbers-could-fall-60-80-in-2020 (accessed on 15 July 2020).
  4. Er, A.C.; Simon, S. Marketing mix of ecotourism product in Kuching, Sarawak, Malaysia. Mediterr. J. Soc. Sci. 2015, 6, 39–47. [Google Scholar] [CrossRef]
  5. Baggio, R. Measuring tourism methods, indicators, and needs: Innovation and sustainability. In The Future of Tourism: Innovation and Sustainability; Fayos-Sola, E., Cooper, C., Eds.; Springer: Heidelberg, Germany, 2019; pp. 255–269. [Google Scholar]
  6. Forbes. Why Millennials Are the Most Important Consumer Generation for the Travel Industry. Available online: https://www.forbes.com/sites/jefffromm/2017/11/08/why-millennials-are-the-most-important-consumer-generation-for-the-travel%20industry/#5725b740e1f1 (accessed on 18 December 2019).
  7. Ibănescu, B.-C.; Stoleriu, O.M.; Munteanu, A.; Iaţu, C. The Impact of Tourism on Sustainable Development of Rural Areas: Evidence from Romania. Sustainability 2018, 10, 3592. [Google Scholar] [CrossRef] [Green Version]
  8. Edirin, E.A. Opportunities and challenges of economic development in Malaysia’s rural areas. Trends Undergrad. Res. 2018, 1, 1–5. [Google Scholar] [CrossRef] [Green Version]
  9. Maksin, M. Sustainable heritage utilization in rural tourism development in Serbia. Spatium Int. Rev. 2012, 28, 37–44. [Google Scholar] [CrossRef]
  10. Freeman, R.E. Strategic Management: A Stakeholder Approach; Pitman Publishing: Boston, MA, USA, 1984. [Google Scholar]
  11. Donaldson, T.; Preston, L.E. The stakeholder theory of the corporation: Concepts, evidence, and implications. Acad. Manag. Rev. 1995, 20, 65–91. [Google Scholar] [CrossRef] [Green Version]
  12. Freeman, R.E. Five challenges to stakeholder theory: A report on research in progress. In Business and Society 360 Stakeholder Management; Wasieleski, D.M., Weber, J., Eds.; Emerald Group: Bingley, UK, 2017; Volume 1, pp. 1–20. [Google Scholar]
  13. Uribe, D.F.; Ortiz-Marcos, I.; Uruburu, A. What is going on with stakeholder theory in Project management literature? A symbiotic relationship for sustainability. Sustainability 2018, 10, 1300. [Google Scholar] [CrossRef] [Green Version]
  14. Federico, T.B.; Magdalena, G.T.; Cornelia, H. The competitiveness of the Uruguayan rural tourism sector and its potential to attract German tourists. Compet. Rev. Int. Bus. J. 2016, 26, 166–187. [Google Scholar]
  15. Pjetrotić, L.; Rađenović, M.; Tripković-Marković, A. Stakeholder collaboration in tourism destination planning—The case of Montenegro. Economics 2016, 4, 119–136. [Google Scholar] [CrossRef] [Green Version]
  16. Aas, C.; Ladkin, A.; Fletcher, J. Stakeholder collaborations and heritage management. Ann. Tour. Res. 2005, 32, 28–48. [Google Scholar] [CrossRef] [Green Version]
  17. Swarbrooke, J. Sustainable Tourism Management, 2nd ed.; CAB International: London, UK, 2001. [Google Scholar]
  18. Chin, C.H.; Thian, S.S.Z.; Lo, M.C. Community’s experiential knowledge on the development of rural tourism competitive advantage: A study on Kampung Semadang—Borneo Heights, Sarawak. Tour. Rev. 2017, 72, 238–260. [Google Scholar] [CrossRef]
  19. Novais, M.A. Tourism Destination Competitiveness: A Supply and Demand Perspective. Ph.D. Thesis, The University of Queensland, Brisbane, Australia, 2017. [Google Scholar]
  20. Leiper, N. Tourism Management; Pearson Education: Sydney, Australia, 2004. [Google Scholar]
  21. Stewart, E.J.; Draper, D. A collaborative approach to understanding local stakeholder perceptions of tourism in Churchill, Manitoba (Canada). Polar Geogr. 2007, 30, 7–35. [Google Scholar] [CrossRef]
  22. Dorcheh, S.A.; Mohamed, B. Local perception of tourism development: A conceptual framework for the sustainable cultural tourism. J. Manag. Sustain. 2013, 3, 31–39. [Google Scholar]
  23. Semrad, K.J.; Rivera, M. A destination performance analysis through the comparisons of tourists and stakeholders’ perceptions: The case of Curaçao. Tour. Hosp. 2015, 4, 1–6. [Google Scholar]
  24. Giray, F.H.; Kadakoğlu, B.; Çetin, F.; Bamoi, A.G.A. Rural tourism marketing: Lavender tourism in Turkey. Ciência Rural. 2019, 49, 1–15. [Google Scholar] [CrossRef] [Green Version]
  25. Matthias, F.; Birgit, P. Destination image analysis—A cross-cultural segmentation approach. In Proceedings of the TTRA, Glasgow, UK, 25–27 June 2019. [Google Scholar]
  26. Manhas, P.S.; Manrai, L.A.; Manrai, A.K. Role of tourist destination development in building its brand image: A conceptual model. J. Econ. Financ. Adm. Sci. 2016, 21, 25–29. [Google Scholar] [CrossRef] [Green Version]
  27. Buhalis, D. Marketing the competitive destination of the future. Tour. Manag. 2000, 21, 97–116. [Google Scholar] [CrossRef] [Green Version]
  28. Park, S.; Nicolau, J.L.; Fesenmaier, D.R. Assessing advertising in a hierarchical decision model. Ann. Tour. Res. 2013, 40, 260–282. [Google Scholar] [CrossRef] [Green Version]
  29. Thompson, F.M.; Newman, A.; Liu, M. The moderating effect of individual level collectivist values on brand loyalty. J. Bus. Res. 2014, 67, 2437–2446. [Google Scholar] [CrossRef]
  30. Xu, F.; Li, Y.; Zhou, J. Brand awareness for entrepreneurial hotel chains: Perceived quality and brand loyalty. Anthropologist 2015, 19, 763–771. [Google Scholar] [CrossRef]
  31. Lund, N.F.; Cohen, S.A.; Scarles, C. The power of social media storytelling in destination marketing. J. Destin. Mark. Manag. 2018, 8, 271–280. [Google Scholar]
  32. Ye, S. The impact of destination personality dimensions on destination brand awareness and attractiveness: Australia as a case study. Tourism 2012, 60, 397–409. [Google Scholar]
  33. Pinto, R.B.; Kastenholz, E. Collaborative destination marketing. In Proceedings of the International Conference on Tourism & Management Studies, Algarve, Portugal, 26 October 2011. [Google Scholar]
  34. Karalkova, Y. Rural tourism destination competitiveness: Portugal vs. Belarus. Master’s Thesis, Instituto Politécnico, Bragança, Portugal, 2016. [Google Scholar]
  35. Blain, C.; Levy, S.E.; Ritchie, J.R.B. Destination branding: Insights and practices from destination management organizations. J. Travel Res. 2005, 43, 328–338. [Google Scholar] [CrossRef]
  36. Morgan, N.; Pritchard, A.; Piggott, R. New Zealand, 100% Pure. The creation of a powerful niche destination brand. J. Brand Manag. 2002, 9, 335–354. [Google Scholar] [CrossRef]
  37. UNWTO. International Tourism Highlights 2019 Edition; UNWTO: Madrid, Spain, 2019. [Google Scholar]
  38. Qu, H.; Kim, L.H.; Im, H.H. A model of destination branding: Integrating the concepts of the branding and destination image. Tour. Manag. 2011, 32, 465–476. [Google Scholar] [CrossRef]
  39. Schaar, R. Destination branding: A snapshot. UW-L J. Undergrad. Res. 2013, 16, 1–10. [Google Scholar]
  40. Manrai, L.A.; Manrai, A.K.; Friedeborn, S. Environmental determinants of destination competitiveness and its tourism attractions-basics-context, A-B-C, indicators. A review, conceptual model and propositions. J. Econ. Financ. Adm. Sci. 2018. [Google Scholar] [CrossRef]
  41. Owiya, V.; Mulwa, J.M.; Kemboi, A. Strategic determinants of destination competitiveness: A case of Western tourist circuit, Kenya. East. Afr. J. Contemp. Res. (Eajcr) 2019, 1, 11–21. [Google Scholar]
  42. Davidoff, D.M. Contact: Customer Service in the Hospitality and Tourism Industry; Prentice Hall Career and Technology: Texas, NJ, USA, 1994. [Google Scholar]
  43. Yaru, L.; Liu, X.; Jing, M. Study on the quality of service in rural homestay—Taking Shanli Lohas as an example. J. Tour. Hosp. 2018, 7, 370–376. [Google Scholar] [CrossRef] [Green Version]
  44. Chew, E.Y.T.; Jahari, S.A. Destination image as a mediator between perceived risks and revisit intention: A case of post-disaster Japan. Tour. Manag. 2014, 40, 382–393. [Google Scholar] [CrossRef]
  45. Loureiro, S.M.C. Tourism in rural areas: Foundation, quality and experience. In Visions for Global Tourism Industry—Creating and Sustaining Competitive Strategies; Kasimoglu, M., Ed. 2012. Available online: http://www.intechopen.com/books/visions-for-global-tourism-industry-creating-and-sustaining-competitive-strategies/tourism-in-rural-areas-foundation-quality-and-experience (accessed on 16 June 2019). [CrossRef]
  46. Kresic, D.; Prebezac, D. Index of destination attractiveness as a tool for destination attractiveness assessment. Tourism 2011, 59, 497–517. [Google Scholar]
  47. Blinnikka, P.; Härkönen, A.; Väisänen, H.-M.; Tunkkari-Eskelinen, M. Finnish micro entrepreneurs’ perceptions of sustainability issues in rural tourism. In Proceedings in Rural Tourism as a Facilitator of Regional Development; Suni, J., Komppula, R., Eds.; Itä, Suomen yliopisto: Kuopio, Finland, 2014; ISBN 978-952-61-162-4. [Google Scholar]
  48. Potashova, I.; Girijchuk, D. The priority development of rural (agrarian) tourism in the Krasnodar region. E3s Web Conf. 2019, 91, 1–7. [Google Scholar] [CrossRef]
  49. Suryawardani, I.G.A.O.; Wiranatha, A.S.; Purbanto, I.G.R.; Nitivattananon, V. Identification tourism products and services provided at the rural tourism destinations in Bali. Int. J. Econ. Financ. Issues 2020, 1, 65–85. [Google Scholar]
  50. Nooripoor, M.; Khosrowjerdi, M.; Rastegari, H.; Sharifi, Z.; Bijani, M. The role of tourism in rural development: Evidence from Iran. GeoJournal 2020, 85, 1–15. [Google Scholar] [CrossRef]
  51. Lane, B. Rural tourism: An overview. In The SAGE Handbook of Tourism Studies; Robinson, M., Jamal, T., Eds.; Sage Publications: London, UK, 2009; pp. 354–370. [Google Scholar]
  52. Zaei, M.E.; Zaei, M.E. The impacts of tourism industry on host community. Eur. J. Tour. Hosp. Res. 2013, 1, 12–21. [Google Scholar]
  53. Tampakis, S.; Manolas, E.; Tampakis, V. Assessing tourist infrastructure in the island of Skiathos: The views of locals and visitors. Tour. Int. Multidiscip. J. Tour. 2012, 7, 175–191. [Google Scholar]
  54. Crouch, G.I.; Ritchie, J.R.B. Tourism, Competitiveness, and Societal Prosperity. J. Bus. Res. 1999, 44, 137–152. [Google Scholar] [CrossRef]
  55. Javanović, S.; Ilić, I. Infrastructure as important determinant of tourism development in the countries of southeast Europe. Ecoforum 2016, 5, 288–294. [Google Scholar]
  56. Ritchie, J.R.; Crouch, G.I. A model of destination competitiveness/sustainability: Brazilian perspectives. Rev. De Adm. Publica 2010, 44, 1049–1066. [Google Scholar] [CrossRef] [Green Version]
  57. Raad, N.G. A strategic approach to tourism development barriers in Iran. J. Tour. Hosp. 2019, 8, 410–417. [Google Scholar]
  58. Chi, X.; Lee, S.K.; Ahn, Y.; Kiatkawsin, K. Tourist-perceived quality and loyalty intentions towards rural tourism in China. Sustainability 2020, 12, 3614. [Google Scholar] [CrossRef]
  59. Kumar, S. Developing India as smart tourism destination – A Sap-Lap analysis. South Asian J. Tour. Heri. 2016, 9, 124–136. [Google Scholar]
  60. Ramseook-Munhurrun, P.; Naidoo, P.; Seebaluck, V.N.; Pillai, P. The impact of destination service quality on tourist satisfaction and loyalty: Evidence from Mauritius. In Proceedings of the International Academic Research Conference on Marketing & Tourism, Paris, France, 1–3 July 2016. [Google Scholar]
  61. Grönroos, C. A service quality model and its marketing implications. Eur. J. Mark. 1984, 18, 36–44. [Google Scholar] [CrossRef]
  62. Moreira, A.C.; Dias, A.M.C.D. Assessing the challenges of service quality in the Terra Quente Transmontana, Portugal. Tour. Hosp. Manag. 2010, 16, 31–45. [Google Scholar]
  63. Tan, C.H.; Omar, K. The impact of service quality on tourist satisfaction: The case study of Rantau Abang Beach as a Turtle Sanctuary Destination. Mediterr. J. Soc. Sci. 2014, 5, 1827–1832. [Google Scholar]
  64. Chang, F.-Y.; Tsai, C.-Y. Relationships among service quality, leisure benefits, overall satisfaction, and revisit intention: Cultural parks as an example. J. Soc. Sci. Hum. Res. 2016, 2, 1–8. [Google Scholar]
  65. Wei, M. Analysis of information systems applied to evaluating tourism service quality based on organizational impact. J. Softw. 2012, 7, 599–607. [Google Scholar] [CrossRef] [Green Version]
  66. Parasuraman, A.; Zeithaml, V.A.; Berry, L.L. SERVQUAL: A multiple-item scale for measuring customer perception of service quality. J. Retail. 1988, 64, 12–40. [Google Scholar]
  67. Cronin, J.J., Jr.; Taylor, S.A. Measuring service quality: A reexamination and extension. J. Mark. 1992, 56, 55–68. [Google Scholar] [CrossRef]
  68. Nguyen, X.T. Factors That Influence the Intentions to Revisit Korea of Vietnamese Tourists. J. Asian Financ. Econ. Bus. 2020, 7, 247–258. [Google Scholar] [CrossRef]
  69. Tinakhat, P.; Viriyachaikul, V.; Vorasingha, Y. The international guests’ satisfaction about service quality of guesthouse in Sukhothai. J. Tour. Theory Res. 2018, 4, 57–69. [Google Scholar] [CrossRef] [Green Version]
  70. Al-Ababneh, M. Service quality and its impact on tourist satisfaction. Interdiscip. J. Contemp. Res. Bus. 2013, 4, 164–177. [Google Scholar]
  71. Hsu, C.H.C.; Wolfe, K.; Kang, S.K. Image assessment for a destination with limited comparative advantages. Tour. Manag. 2004, 25, 121–126. [Google Scholar] [CrossRef]
  72. Sumaco, F.T.; Richardson, S. An analysis on international tourists’ perceptions towards destination branding: “Visit Indonesia 2008” Marketing Campaign. In Proceedings of the 2nd International Research Symposium in Service Management, Yogyakarta, Indonesia, 26–30 July 2011. [Google Scholar]
  73. Ahmed, Z.; Sohail, M.; Myers, C.; San, C. Marketing of Australia to Malaysian consumers. Serv. Mark. Q. 2006, 28, 54–78. [Google Scholar] [CrossRef]
  74. Gartner, W.C. Tourism Development—Principles, Processes, and Policies; Van Nostrand Reinhold: New York, NY, USA, 1996. [Google Scholar]
  75. Stepchenkova, S.; Mills, J.E. Destination image: A meta-analysis of 2000-2007 Research. J. Hosp. Mark. Manag. 2010, 19, 575–609. [Google Scholar] [CrossRef]
  76. Basaran, U. Examining the relationships of cognitive, affective, and conative destination image: A research on Safranbolu, Turkey. Int. Bus. Res. 2016, 9, 164–179. [Google Scholar] [CrossRef]
  77. Dann, G.M.S. Tourists’ images of a destination—An alternative analysis. J. Travel Tour. Mark. 1996, 5, 41–55. [Google Scholar] [CrossRef]
  78. Chon, K.-S. The role of destination image in tourism: A review and discussion. Tour. Rev. 1990, 45, 2–9. [Google Scholar] [CrossRef] [Green Version]
  79. Chen, Y.; Zhang, H.; Qiu, L. A review on tourist satisfaction of tourism destinations. In Proceedings of the 2nd International Conference on Logistics, Informatics and Service Science; Springer Science & Business Media: New York, NY, USA; Dordrecht, The Netherlands; London, UK, 2013; pp. 593–604. [Google Scholar]
  80. Triyanto, I.C.G.; Musikavanhu, T.B. Rural tourism as a way to build economic independence. Afr. J. Hosp. Tour. Leis. 2018, 7, 1–11. [Google Scholar]
  81. Jaafar, M.; Marzuki, A.; Abdullah, S. Rural Tourism in Malaysia; Penerbit USM: Pulau Pinang, Malaysia, 2019; ISBN 978-967-461-357-0. [Google Scholar]
  82. Lane, B. What is rural tourism? J. Sustain. Tour. 1994, 2, 7–21. [Google Scholar] [CrossRef]
  83. Okech, R.; Haghiri, M.; George, B.P. Rural tourism as a sustainable development alternative: An analysis with special reference to Luanda, Kenya. Culture: Revista de Cultura e Turismo 2012, 6, 36–54. [Google Scholar]
  84. Paimin, N.F.V.; Modilih, S.; Mogindol, S.H.; Johnny, C.; Thamburaj, J.A. Community participation and barriers in rural tourism: A case study in Kiulu, Sabah. Shs Web Conf. 2014, 12, 1–7. [Google Scholar]
  85. Luvanga, N.; Shitundu, J. The Role of Tourism in Poverty Alleviation in Tanzania; University of Dar-es-Salaam Press: Dar-es-Salaam, Tanzania, 2003. [Google Scholar]
  86. Kachniewska, M.A. Tourism development as a determinant of quality of life in rural areas. Worldw. Hosp. Tour. Themes 2015, 7, 500–515. [Google Scholar] [CrossRef]
  87. Othman, F.; Sazali, F.; Mohamed, B. Rural and community based tourism development in Malaysia: Prospects for homestays as a social economy enterprise. Team J. Hosp. Tour. 2013, 10, 65–76. [Google Scholar]
  88. Khound, J.M. Constraints and prospects of rural tourism development: An overview of tourism in Shyamgaon of Titabor of Jorhat, District (Assam). J. Tour. Hosp. Manag. 2013, 1, 27–31. [Google Scholar]
  89. Carneiro, M.J.; Lima, J.; Silva, A.L. Landscape and the rural tourism experience: Identifying key elements, addressing potential, and implications for the future. J. Sustain. Tour. 2015, 23, 1217–1235. [Google Scholar] [CrossRef]
  90. Ndivo, R.M.; Waudo, J.N.; Waswa, F. Examining Kenya’s tourist destinations’ appeal: The perspectives of domestic tourism market. J. Tour. Hosp. 2012, 1, 1–7. [Google Scholar]
  91. Lai, W.-H.; Vinh, N.Q. An application of AHP approach to investigate tourism promotional effectiveness. Tour. Hosp. Manag. 2013, 19, 1–22. [Google Scholar]
  92. Wilde, S.J.; Cox, C. Linking destination competitiveness and destination development: Findings from a mature Australian tourism destination. In Proceedings of the Travel and Tourism Research Association (TTRA) European Chapter Conference—Competition in Tourism: Business and Destination Perspectives, Helsinki, Finland, 23–25 April 2008; pp. 467–478. [Google Scholar]
  93. Murphy, P.; Pritchard, M.; Smith, B. The destination product and its impact on traveler perceptions. Tour. Manag. 2000, 21, 43–52. [Google Scholar] [CrossRef]
  94. Moric, I. Clusters as a factor of rural tourism competitiveness: Montenegro experiences. Bus. Syst. Res. 2013, 4, 94–107. [Google Scholar] [CrossRef] [Green Version]
  95. Goffi, G. A model of tourism destinations competitiveness: The case of the Italian destinations of excellence. Anu. Tur. Y Soc. 2013, 14, 121–147. [Google Scholar]
  96. Hosseini, M.R.; Bostani, M.K.; Anvari, M.R. Analysis and prioritization of factors affecting the tourists’ satisfaction (Case study: In Southern Khorasan Province). Iosr J. Eng. 2015, 5, 37–42. [Google Scholar]
  97. Tardivo, G.; Scilla, A.; Viassone, M. How to become a benchmark sustainable tourist destination? A descriptive model. Bus. Syst. Rev. 2014, 3, 207–230. [Google Scholar]
  98. Fabricius, M. Competitive Strategies for Tourism Destinations; University of South Africa: Pretoria, South Africa, 2001. [Google Scholar]
  99. Fuchs, M.; Weiermair, K. New perspectives of satisfaction research in tourism destinations. Tour. Rev. 2003, 58, 6–14. [Google Scholar] [CrossRef]
  100. Davidson, R. Harnessing local expertise and knowledge: A new concept in business tourism destination marketing. In Book of Proceedings Edited by Milovan Stanišić in Singidunum International Tourism Conference 2016; Singidunum University: Belgrade, Serbia, 2016. [Google Scholar]
  101. Žabkar, V.; Brenčič, M.M.; Dmitrović, T. Modelling perceived quality, visitor satisfaction and behavioral intentions at the destination level. Tour. Manag. 2010, 31, 537–546. [Google Scholar] [CrossRef]
  102. Rajesh, R. Impact of tourist perceptions, destination image and tourist satisfaction on destination. loyalty: A conceptual model. Pasos: Rev. De Tur. Y Patrim. Cult. 2013, 11, 67–78. [Google Scholar] [CrossRef]
  103. Akroush, M.N.; Jraisat, L.E.; Kurdieh, D.J.; Al-Faouri, R.N.; Qatu, L.T. Tourism service quality and destination loyalty—The mediating role of destination image from international tourists’ perspectives. Tour. Rev. 2016, 71, 18–44. [Google Scholar] [CrossRef]
  104. Aunalal, Z.I.; Kadir, A.R.; Taba, M.I.; Hamid, N. The influence of service quality dimensions, destination image, and satisfaction to tourist loyalty in Maluku Province. Sci. Res. J. 2017, V, 71–85. [Google Scholar]
  105. Govers, R. Virtual Tourism Destination Image: Glocal Identities Constructed, Perceived and Experienced. Rotterdam School of Management, Erasmus University, Erasmus Research Institute of Management. Available online: http://repub.eur.nl/res/pub/6981/EPS2005069MKT_9058921077_GOVERS.P (accessed on 25 January 2020).
  106. Dolnicar, S.; Grun, B. Validly measuring destination image in survey studies. J. Travel Res. 2013, 52, 3–14. [Google Scholar] [CrossRef] [Green Version]
  107. Echtner, C.; Ritchie, J.B. The meaning and measurement of destination image. J. Tour. Stud. 2003, 14, 37–46. [Google Scholar]
  108. Ragavan, N.A.; Subramonian, H.; Sharif, S.P. Tourists’ perceptions of destination travel attributes: An application to International tourists to Kuala Lumpur. Procedia Soc. Behav. Sci. 2014, 144, 403–411. [Google Scholar] [CrossRef] [Green Version]
  109. Almeida, P.; Miranda, F.J.; Elias-Almeida, A. Importance/value analyses applied to image components of a tourism destination. Tour. Manag. Stud. 2012, 8, 65–77. [Google Scholar]
  110. Agapito, D.; Valle, P.; Mendes, J. The sensory dimension of tourist experiences: Capturing meaningful sensory-informed themes in Southwest Portugal. Tour. Manag. 2014, 42, 224–237. [Google Scholar] [CrossRef] [Green Version]
  111. Dwyer, L.; Kim, C. Destination competitiveness: Determinants and indicators. Tourism 2003, 6, 369–414. [Google Scholar] [CrossRef]
  112. Liao, S.-H.; Chang, J.C.; Cheng, S.-C.; Kuo, C.-M. Employee relationship and knowledge sharing: A case study of a Taiwanese finance and securities firm. Knowl. Manag. Res. Pr. 2004, 2, 24–34. [Google Scholar] [CrossRef]
  113. Chi, C.G.Q.; Qu, H. Examining the structural relationships of destination image, tourist satisfaction and destination loyalty: An integrated approach. Tour. Manag. 2008, 29, 624–636. [Google Scholar] [CrossRef]
  114. Cho, H.-S.; Byun, B.; Shin, S. An examination of the relationship between rural tourists’ satisfaction, revisitation and information preferences: A Korean case study. Sustainability 2014, 6, 6293–6311. [Google Scholar] [CrossRef] [Green Version]
  115. Nulty, D.D. The adequacy of response rates to online and paper surveys: What can be done? J. Assess. Eval. High. Educ. 2008, 33, 301–314. [Google Scholar] [CrossRef] [Green Version]
  116. Bagozzi, R.R.; Yi, Y.; Philipps, L.W. Assessing construct validity in organizational research. Adm. Sci. Q. 1991, 36, 421–458. [Google Scholar] [CrossRef]
  117. Chin, W.W. How to write up and report PLS analyses. In Handbook of Partial Least Squares: Concepts, Methods and Application; Esposito, V.V., Chin, W., Henseler, J., Wang, H., Eds.; Springer: New York, NY, USA, 2010; pp. 645–689. [Google Scholar]
  118. Fornell, C.; Larcker, D.F. Evaluating structural equation models with unobservable variables and measurement error. J. Mark. Res. 1981, 18, 39–50. [Google Scholar] [CrossRef]
  119. Cohen, E. Authenticity and commoditization in tourism. Ann. Tour. Res. 1988, 15, 371–386. [Google Scholar] [CrossRef]
  120. Henseler, J.; Ringle, C.M.; Sarstedt, M. Testing measurement invariance of composites using partial least squares. Int. Mark. Rev. 2016, 33, 405–431. [Google Scholar] [CrossRef]
  121. Hair, J.F.; Hult, G.T.M.; Ringle, C.M.; Sarstedt, M. A Primer on Partial Least Squares Structural Equation Modelling (PLS-SEM), 2nd ed.; Sage: Thousand Oaks, CA, USA, 2016. [Google Scholar]
  122. Sarstedt, M.; Henseler, J.; Ringle, C.M. Multigroup analysis in Partial Least Squares (PLS) path modeling: Alternative methods and empirical results. Adv. Int. Mark. 2011, 22, 195–218. [Google Scholar]
  123. Blazeska, D.; Milenkovska, A.; Stojmirova, M. Hotel image as an important prerequisite for creating a competitive advantage. In Proceedings in SITCON 2016—Singidunum International Tourism Conference; SITCON: Belgrade, Serbia, 2016; pp. 230–234. [Google Scholar]
  124. Michaelidou, N.; Siamagka, N.T.; Moraes, C.; Micevski, M. Do marketers use visual representations of destinations that tourists value? Comparing visitors image of a destination with marketer-controlled images online. J. Travel Res. 2013, 52, 789–804. [Google Scholar] [CrossRef] [Green Version]
  125. Bilim, Y.; Bilim, M.B. Does a destination have personality? Personality and image issues of a destination. Anthens J. Tour. 2014, 1, 121–134. [Google Scholar] [CrossRef]
  126. Huang, S. Tourist Engagement: Conceptualization, Scale Development and Empirical Validation. Bachelor’s Thesis, University of Guelph, Ontario, Canada, September 2017. Available online: https://pdfs.semanticscholar.org/83a2/28c623adf00eca4c2044c43f9b48317cfa85.pdf.
  127. Haugland, S.A.; Håvard, N.; Bjørn, O.G.; Jarle, A. Development of tourism destinations. An integrated multilevel perspective. Ann. Tour. Res. 2011, 38, 268–290. [Google Scholar] [CrossRef]
Figure 1. Location of research sites—Annah Rais Bidayuh Longhouse and Bario Kelabit Highlands.
Sustainability 12 06787 g001
Figure 2. Research model.
Sustainability 12 06787 g002
Figure 3. (a) Research model with path coefficient and t-values—full sample; (b) Research model with path coefficient and t-values—semirural; (c) Research model with path coefficient and t-values—rural.
Sustainability 12 06787 g003aSustainability 12 06787 g003b
Table 1. Demographic statistics of the sample data.
Full Sample (n = 293)Semirural: Annah Rais (n = 158)Rural: Bario Highlands (n = 135)
VariableCategoryFrequency (n)%Frequency (n)%Frequency (n)%
GenderMale16154.98453.27757.0
Female13245.17446.85843.0
Education LevelHigh school or below5217.72515.82720.0
Diploma12342.05434.26951.1
Degree9331.75736.13626.7
Postgraduate93.163.832.2
Others165.51610.1--
Monthly Income (in RM)<RM15004816.44629.121.5
RM1501 to RM3000248.21610.185.9
RM3001 to RM45004615.72616.52014.8
RM4501 to RM60005518.81811.43727.4
RM6001 to RM75009331.74427.84936.3
RM7501 to RM9000279.285.11914.1
No of VisitOne23881.211774.112189.6
Two3712.62817.796.7
Three186.1138.253.7
Country of OriginDomestic18161.89862.08361.5
International 11238.26038.05238.5
Respondent’s profile (n = 293)Mean (Overall)SD (Overall)MinimumMaximumMinimumMinimumMinimumMaximum
Age (in years)35.812.63166016601855
Table 2. Factor loadings, CR and AVE.
ConstructItem(s)LoadingCR aAVE bLoadingCR aAVE bLoadingCR aAVE b
Full Sample (n = 293)Semirural (n = 158)Rural (n = 135)
Destination Appeal (DA)DA_010.7940.8780.5470.7700.8770.5480.7970.8800.557
DA_020.7900.8730.739
DA_040.6210.7560.500
DA_050.8000.7950.771
DA_060.7170.5780.842
DA_070.7010.6320.787
Tourism Infrastructure (TI) TI_010.7720.9370.7110.7190.9260.6760.8250.9420.730
TI_020.8160.8030.809
TI_030.8890.8730.880
TI_040.8710.8240.898
TI_050.8690.8340.884
TI_060.8390.8710.826
Service Quality (SQ)SQ_010.7770.8710.6930.6750.8190.6040.8730.9100.772
SQ_020.7400.8170.843
SQ_030.8770.8300.918
Destination Image (DI)DI_010.8300.8470.5830.8050.8680.6250.8920.7970.508
DI_030.7920.8700.533
DI_040.7810.8530.553
DI_060.6350.6070.804
Destination Marketing Efforts (DM)DM_020.8800.8570.6690.8870.8620.6770.8750.8650.682
DM_030.7120.7420.738
DM_040.8520.8320.858
Note: DA_03, SQ_04, SQ_05, DI_02, DI_05, DM_01, and DM_05 were deleted due to low loadings. a Composite Reliability (CR); b Average Variance Extracted (AVE); Semirural = Annah Rais; Rural = Bario Highlands.
Table 3. Discriminant validity of constructs.
Full Sample (n = 293)DADIDMSQTI
Destination Appeal (DA)0.740
Destination Image (DI)−0.0740.763
Destination Marketing Efforts (DM)0.3920.2870.818
Service Quality (SQ)0.2280.3140.6270.832
Tourism Infrastructure (TI)0.2170.2200.4230.6520.843
Semirural (n = 158)DADIDMSQTI
Destination Appeal (DA)0.741
Destination Image (DI)−0.0550.791
Destination Marketing Efforts (DM)0.3240.3440.823
Service Quality (SQ)0.2680.2600.6620.777
Tourism Infrastructure (TI)0.2780.0850.4690.5640.822
Rural (n = 135)DADIDMSQTI
Destination Appeal (DA)0.746
Destination Image (DI)0.0100.713
Destination Marketing Efforts (DM)0.5320.2460.826
Service Quality (SQ)0.2150.4240.4210.879
Tourism Infrastructure (TI)0.1900.4380.3970.7280.854
Note: Diagonals represent the square root of the average variance extracted (AVE) while the other entries represent the correlations.
Table 4. Measurement invariance of composite models (MICOM).
CompositecValue (=1)95% Confidence IntervalCompositional Invariance
Destination Appeal1.000[0.966; 1.000]Yes
Destination Image1.000[1.000; 1.000]Yes
Destination Marketing Efforts0.998[0.993; 1.000]Yes
Service Quality1.000[1.000; 1.000]Yes
Tourism Infrastructure0.995[0.995; 1.000]Yes
CompositeDifference of the composite’s mean value (=0)95% confidence intervalEqual mean values
Destination Appeal0.182[−0.204; 0.193]Yes
Destination Image0.069[−0.204; 0.203]Yes
Destination Marketing Efforts0.175[−0.205; 0.186]Yes
Service Quality0.405[−0.197; 0.190]Yes
Tourism Infrastructure0.356[−0.198; 0.189]Yes
CompositeDifference of the composite’s variance ratio (=0)95% confidence intervalEqual variances
Destination Appeal0.084[−0.241; 0.246]Yes
Destination Image0.290[−0.305; 0.307]Yes
Destination Marketing Efforts−0.022[−0.269; 0.277]Yes
Service Quality−0.214[−0.253; 0.284]Yes
Tourism Infrastructure−0.339[−0.296; 0.319]Yes
Table 5. Results for direct relationships.
Full Sample (n = 293)Semirural (n = 158)Rural (n = 135)
HPathStd. Betat-ValueResultStd. Betat-ValueResultStd. Betat-ValueResult
H1DA → DM−0.3434.466NS0.1252.589S0.4677.613S
H2TI → DM−0.1651.281NS−0.0350.554NS0.1301.097NS
H3SQ → DM0.6325.064S0.81214.707S0.1801.514NS
H4DI → DM0.0340.357NS0.1423.047S0.1081.227NS
Note: t > 1.645 = p < 0.05; t > 2.33 = p < 0.01; S = Supported; NS = Not Supported.
Table 6. Results of R2, Q2, and f2.
ConstructFull Sample (n = 293)Semirural (n = 158)Rural (n = 135)
R2Q2f2R2Q2f2R2Q2f2
DA 0.144 0.061 0.344
TI 0.000 0.003 0.012
SQ 0.277 1.751 0.025
DI 0.036 0.081 0.015
DM0.4770.307 0.7700.509 0.4030.255
Note: DA = Destination Appeal; TI = Tourism Infrastructure; SQ = Service Quality; DI = Destination Image; DM = Destination Marketing Efforts.
Table 7. Path differences by nature of tourism destination.
HypothesisPathSemiruralRural
BetaBetat-Valuep-Value
H5aDA → DM0.1250.4674.4090.000
H5bTI → DM−0.0350.1301.2330.110
H5cSQ → DM0.8120.1804.8310.000
H5dDI → DM0.1420.1080.3440.366
Note: t > 1.645 = p < 0.05; t > 2.33 = p < 0.01.

