Article

Yield Response, Nutritional Quality and Water Productivity of Tomato (Solanum lycopersicum L.) are Influenced by Drip Irrigation and Straw Mulch in the Coastal Saline Ecosystem of Ganges Delta, India

1
Department of Agronomy, Faculty of Agriculture, Bidhan Chandra Krishi Viswavidyalaya, Mohanpur, Nadia, West Bengal 741252, India
2
Department of Botany and Plant Physiology, Faculty of Agrobiology, Food and Natural resources, Czech University of Life Sciences Prague, Kamycka 129, 165 00 Prague, Czech Republic
3
Purba Medinipur Krishi Vigyan Kendra, Bidhan Chandra Krishi Viswavidyalaya, Mulakhop, Dayaldasi, Nandakumar, East Medinipur, West Bengal 721632, India
4
Sasya Shyamala Krishi Vigyan Kendra, Ramakrishna Mission Vivekananda Educational and Research Institute, Arapanch, Sonarpur, West Bengal 700150, India
5
Bangladesh Wheat and Maize Research Institute (BWMRI), Dinajpur 5200, Bangladesh
6
Department of Agricultural Meteorology, Bidhan Chandra Krishi Viswavidyalaya, Mohanpur, Nadia, West Bengal 741252, India
7
Agriculture Discipline, College of Science, Health, Engineering and Education, Murdoch University, Perth, WA 6150, Australia
8
Water Resource Management Program, CSIRO Land and Water, Black Mountain Laboratories, Canberra, ACT 2601, Australia
9
Department of Plant Physiology, Slovak University of Agriculture, Nitra, Tr. A. Hlinku 2, 949 01 Nitra, Slovakia
10
Graduate School of Integrated Sciences for Life, Hiroshima University, 1-4-4 Kagamiyama, Higashi-Hiroshima 739-8528, Japan
11
College of Agronomy, Sichuan Agricultural University, Chengdu 611130, China
12
Department of Field Crops, Faculty of Agriculture, Siirt University, Siirt 56100, Turkey
13
Department of Agronomy, Faculty of Agriculture, Kafrelsheikh University, Kafr El-Shaikh 33516, Egypt
*
Author to whom correspondence should be addressed.
Sustainability 2020, 12(17), 6779; https://doi.org/10.3390/su12176779
Submission received: 9 July 2020 / Revised: 1 August 2020 / Accepted: 7 August 2020 / Published: 21 August 2020

Abstract

:
In the coastal zone of the Ganges Delta, water shortages due to soil salinity limit the yield of dry season crops. To alleviate water shortage as a consequence of salinity stress in the coastal saline ecosystem, the effect of different water-saving (WS) and water-conserving options was assessed on growth, yield and water use of tomato; two field experiments were carried out at Gosaba, West Bengal, India in consecutive seasons during the winter of 2016–17 and 2017–18. The experiment was laid out in a randomized block design with five treatments viz., surface irrigation, surface irrigation + straw mulching, drip irrigation at 100% reference evapotranspiration (ET0), drip irrigation at 80% ET0, drip irrigation at 80% ET0 + straw mulching. Application of drip irrigation at 80% ET0 + straw mulching brought about significantly the highest fruit as well as the marketable yield of tomato (Solanum lycopersicum L.). The soil reaction (pH), post-harvest organic carbon, nitrogen, phosphorus and potassium (N, P and K) status and soil microbial population along with the biochemical quality parameters of tomato (juice pH, ascorbic acid, total soluble solids and sugar content of fruits) were significantly influenced by combined application of drip irrigation and straw mulching. Surface irrigation significantly increased the salinity level in surface and sub-surface soil layers while the least salinity development was observed in surface mulched plots receiving irrigation water through drip irrigation. The highest water productivity was also improved from drip irrigation at 80% ET0 + straw mulched plots irrespective of the year of experimentation. Such intervention also helped in reducing salinity stress for the tomato crop. Thus, straw mulching along with drip irrigation at 80% ET0 can be recommended as the most suitable irrigation option for tomato crop in the study area as well as coastal saline regions of South Asia. Finally, it can be concluded that the judicious application of irrigation water not only increased growth, yield and quality tomatoes but also minimized the negative impact of soil salinity on tomatoes grown in the coastal saline ecosystem of Ganges Delta.

1. Introduction

The cultivated area of the coastal saline zone of West Bengal is 4200 km2. Only 4% of this can be irrigated with available fresh water in the dry season. The region is, therefore, a mono-cropped area with full cropping in the wet season (5–6 months). The lands generally remain fallow during the rest of six to seven months of a year. In most cases, the farmers of the coastal zone are habituated to follow the traditional cropping systems satisfying their own needs, without thinking of their cost effectiveness, agro-ecological suitability, and sustainability. However, there is scope to increase farmers’ income by increasing total productivity through judicious repeated use of the same piece of coastal land without compromising soil health.
Tomatoes are popular in the world as a healthy food rich in nutrients and antioxidants (pro-vitamins, β-carotene, vitamin C, lycopene, potassium, dietary fiber, calcium) that help to fight against the risk of certain human diseases and even many forms of cancer [1,2]. India is one of the largest producers of tomatoes in the world with an estimated production of 18.7 million metric tons in 2015–16 [3]. Though tomatoes show sensitivity to salt with limited survivability and decreased yield under high salinity condition [4], salt-tolerant cultivars and advanced salt mitigating technologies have made it possible to augment crop yield in the saline coastal ecosystem [5].
Proper irrigation timing and amount increase the water use efficiency; consequently, the production per unit of water will be increased. Improper irrigation timing and amount can lead to the development of crop water deficit resulting in reduced yield due to water and nutrient deficiencies [6]. Effects of different irrigation intervals, amounts, and techniques on tomato yield and fruit quality have been extensively studied in many parts of the world [7,8,9,10]. However, identification of the critical irrigation amount and scheduling of irrigation are the most cost-efficient ways to improve water use efficiency [11]. Amongst the possible salinity alleviating technologies, drip irrigation from water stored during the monsoon season has been observed as promising in the coastal area [12,13]. The drip irrigation system can distribute water uniformly, control the water amount precisely, increase crop yields, reduce evapotranspiration (ET0) and deep percolation losses, decrease dangers of soil degradation and salinity, reduce energy consumption, improve disease and pest control and is feasible for undulating sloppy lands [14,15]. The delivery of low amounts of water at a high frequency usually limits water evaporation and drainage, which results in high water use efficiency (WUE) [16,17]. On an average, drip irrigation saves about 70 to 80% water as compared to conventional flood irrigation methods [13,18,19]. For tomatoes, a reasonable irrigation quota is beneficial for optimum yield and quality. The soluble solids, vitamin C, sugar and acid, and their ratio in the tomato increase with a lower water supply, resulting in an improved overall quality of tomatoes [20,21]. Moreover, under deficit irrigation conditions, the acid invertase, neutral invertase, proline, glucose, and fructose in the tomato fruits are increased, and this helps the tomato plants to be more adaptive to the drought stress [22].
On the other hand, mulching with both organic (grass, sawdust, corncobs, rice husks, straws of wheat and rice) and synthetic (plastic sheet—transparent, yellow, green, red, black and white colored) materials is widely used in vegetable production mainly to reduce the rate of water and nutrient losses from soils, facilitating moisture distribution, and improving hydrothermal regimes of soils [23]. Besides, mulches are also effective in conserving moisture and directing carbon dioxide from soil to the plant leaves; thereby, substantially promoting growth, yield, and quality of several crops, as in tomatoes [24,25].
Although to popularize high value cash crops like tomato, several salt mitigating technologies have been tested in different salt-affected soil over the world, none of these such technologies have been made in the coastal Ganges Delta of India. This study aimed to evaluate the effect of different water-saving (WS) options for enhancing the productivity of tomatoes under coastal saline soil of Sundarbans (Ganges Delta), West Bengal. Specific objectives of the study were to determine: (i) yield of tomato under different water-saving options in the coastal saline zone of West Bengal; (ii) water savings (WS) and productivity (WP) of different irrigation options; and finally, (iii) the nutritional as well as the post-harvest quality of tomato as influenced by different water-saving options.

2. Materials and Methods

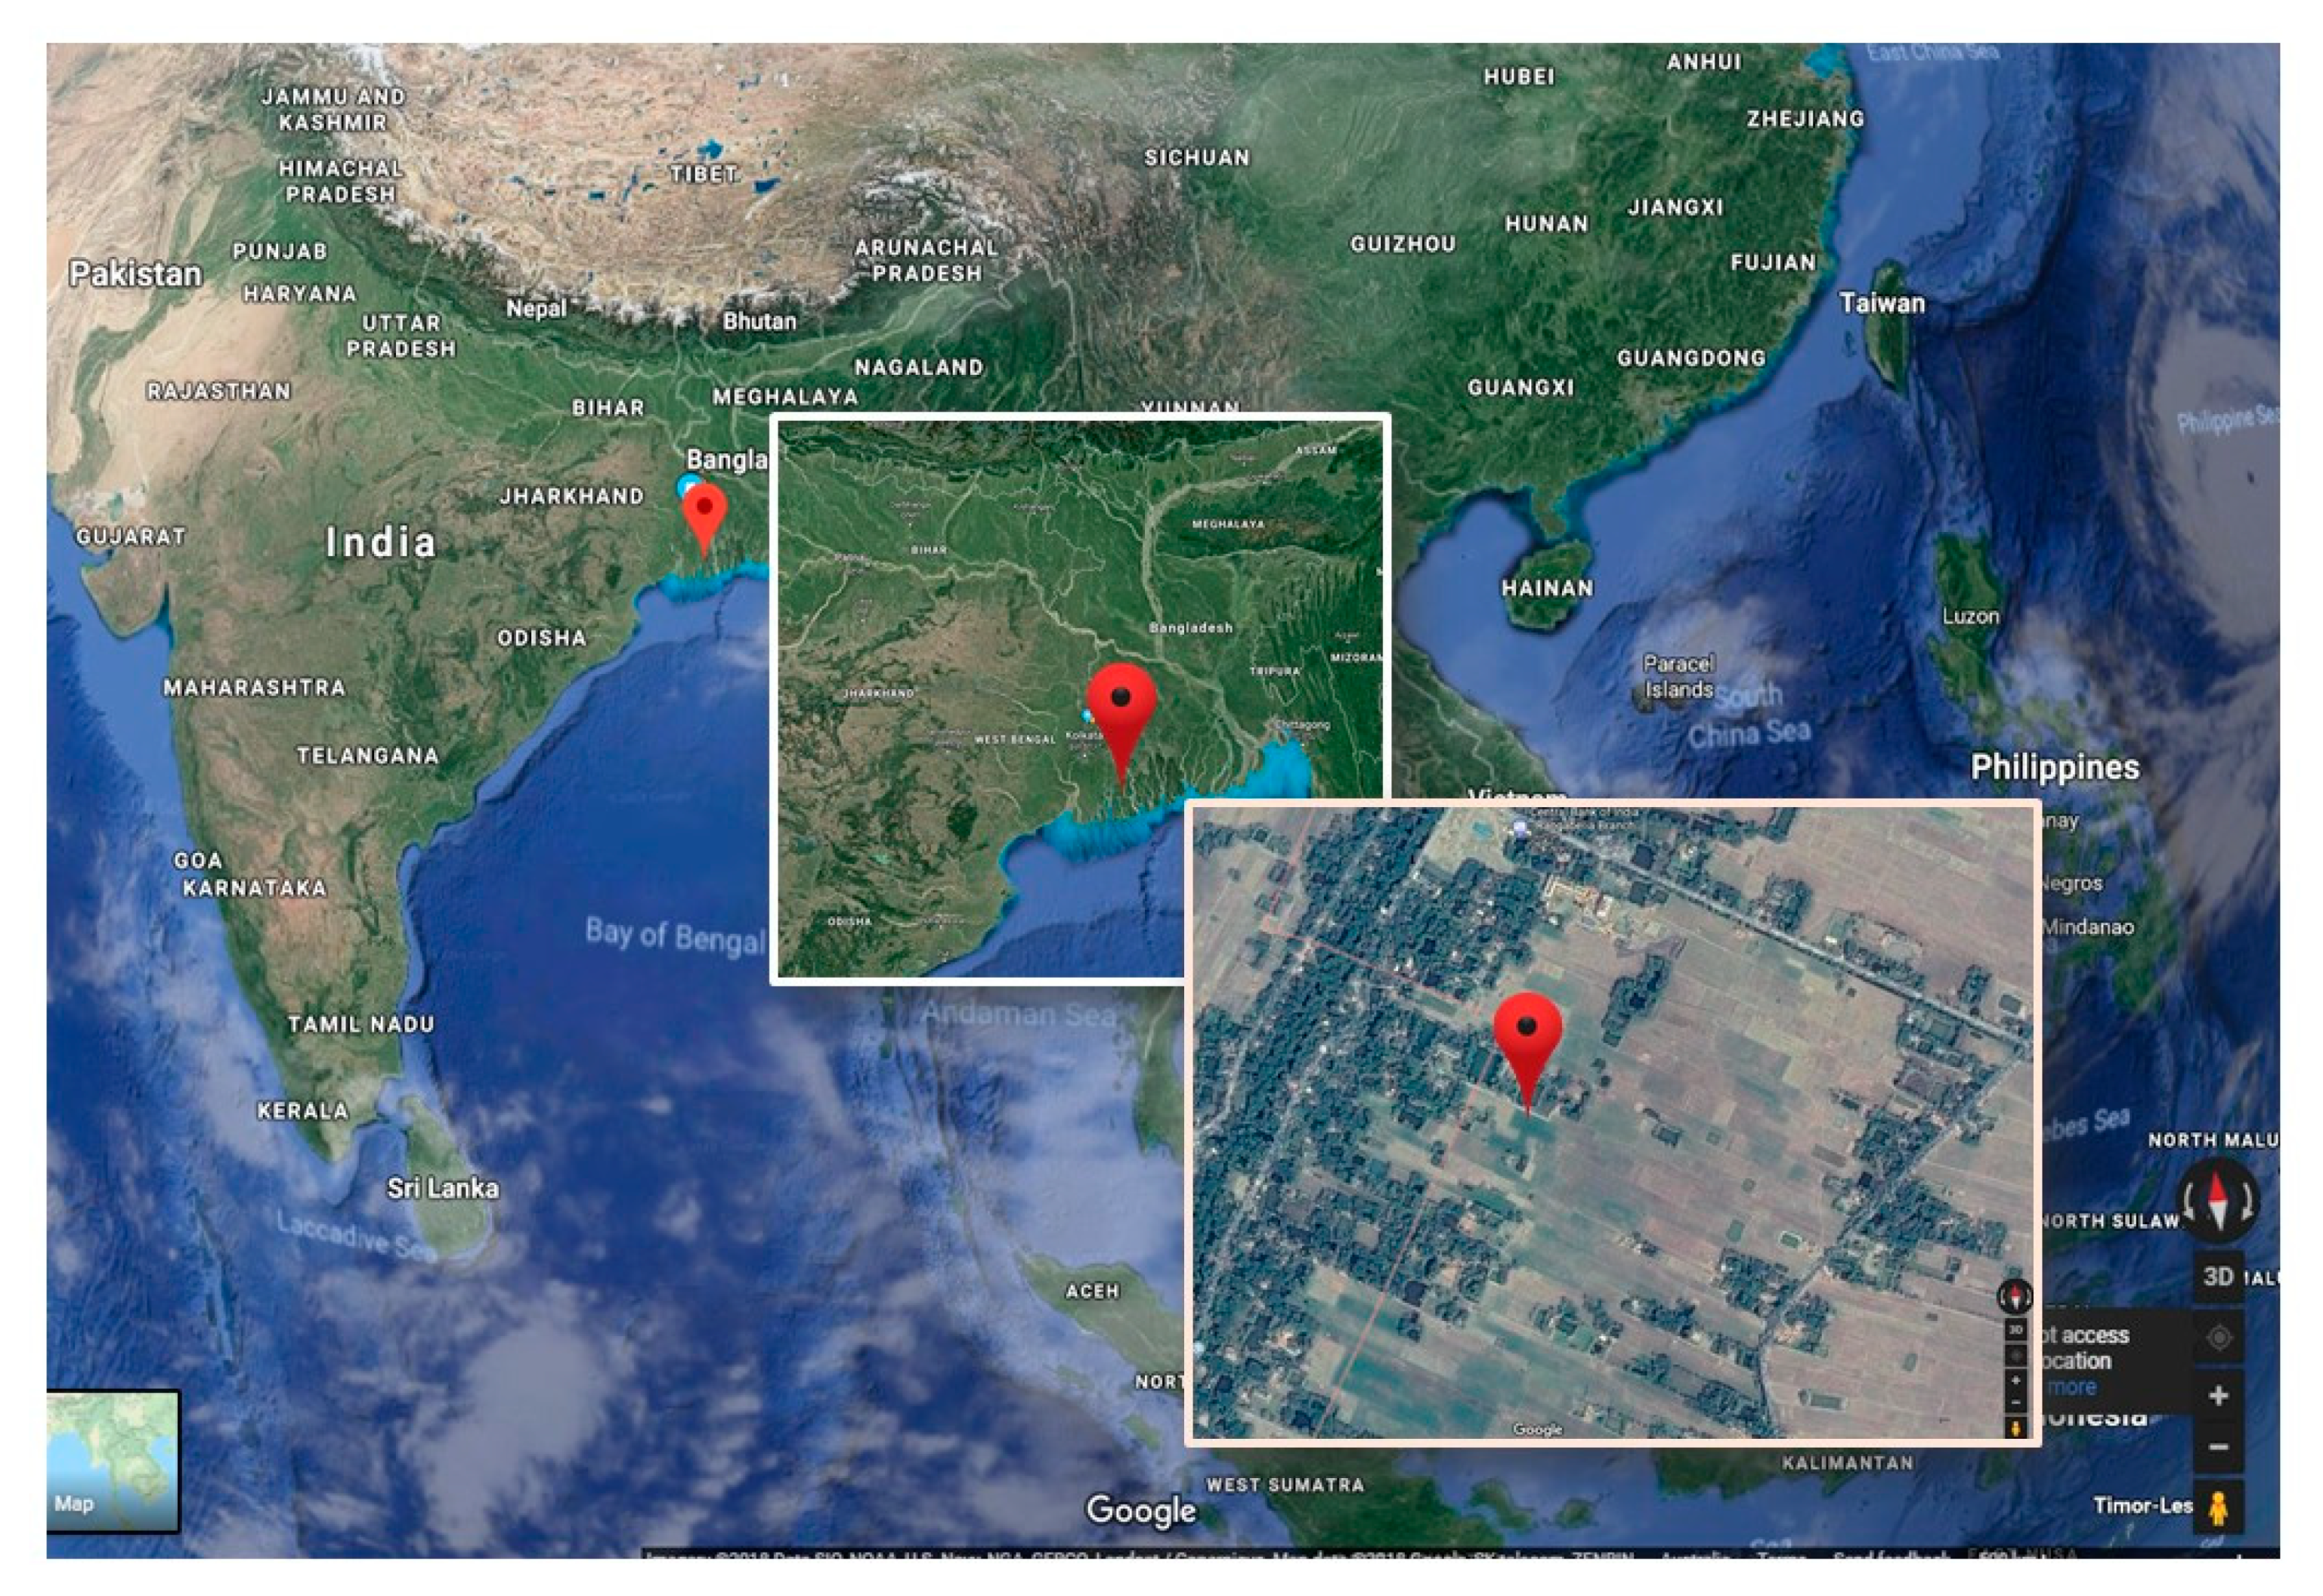
2.1. Experimental Site

Experiments were carried out in two consecutive seasons during winter of 2016–17 and 2017–18 in a farmer’s field of Rangabelia village, Gosaba Block of the state of West Bengal (21.92° N, 88.80° E, 3.5 m above mean sea level) (Figure 1).

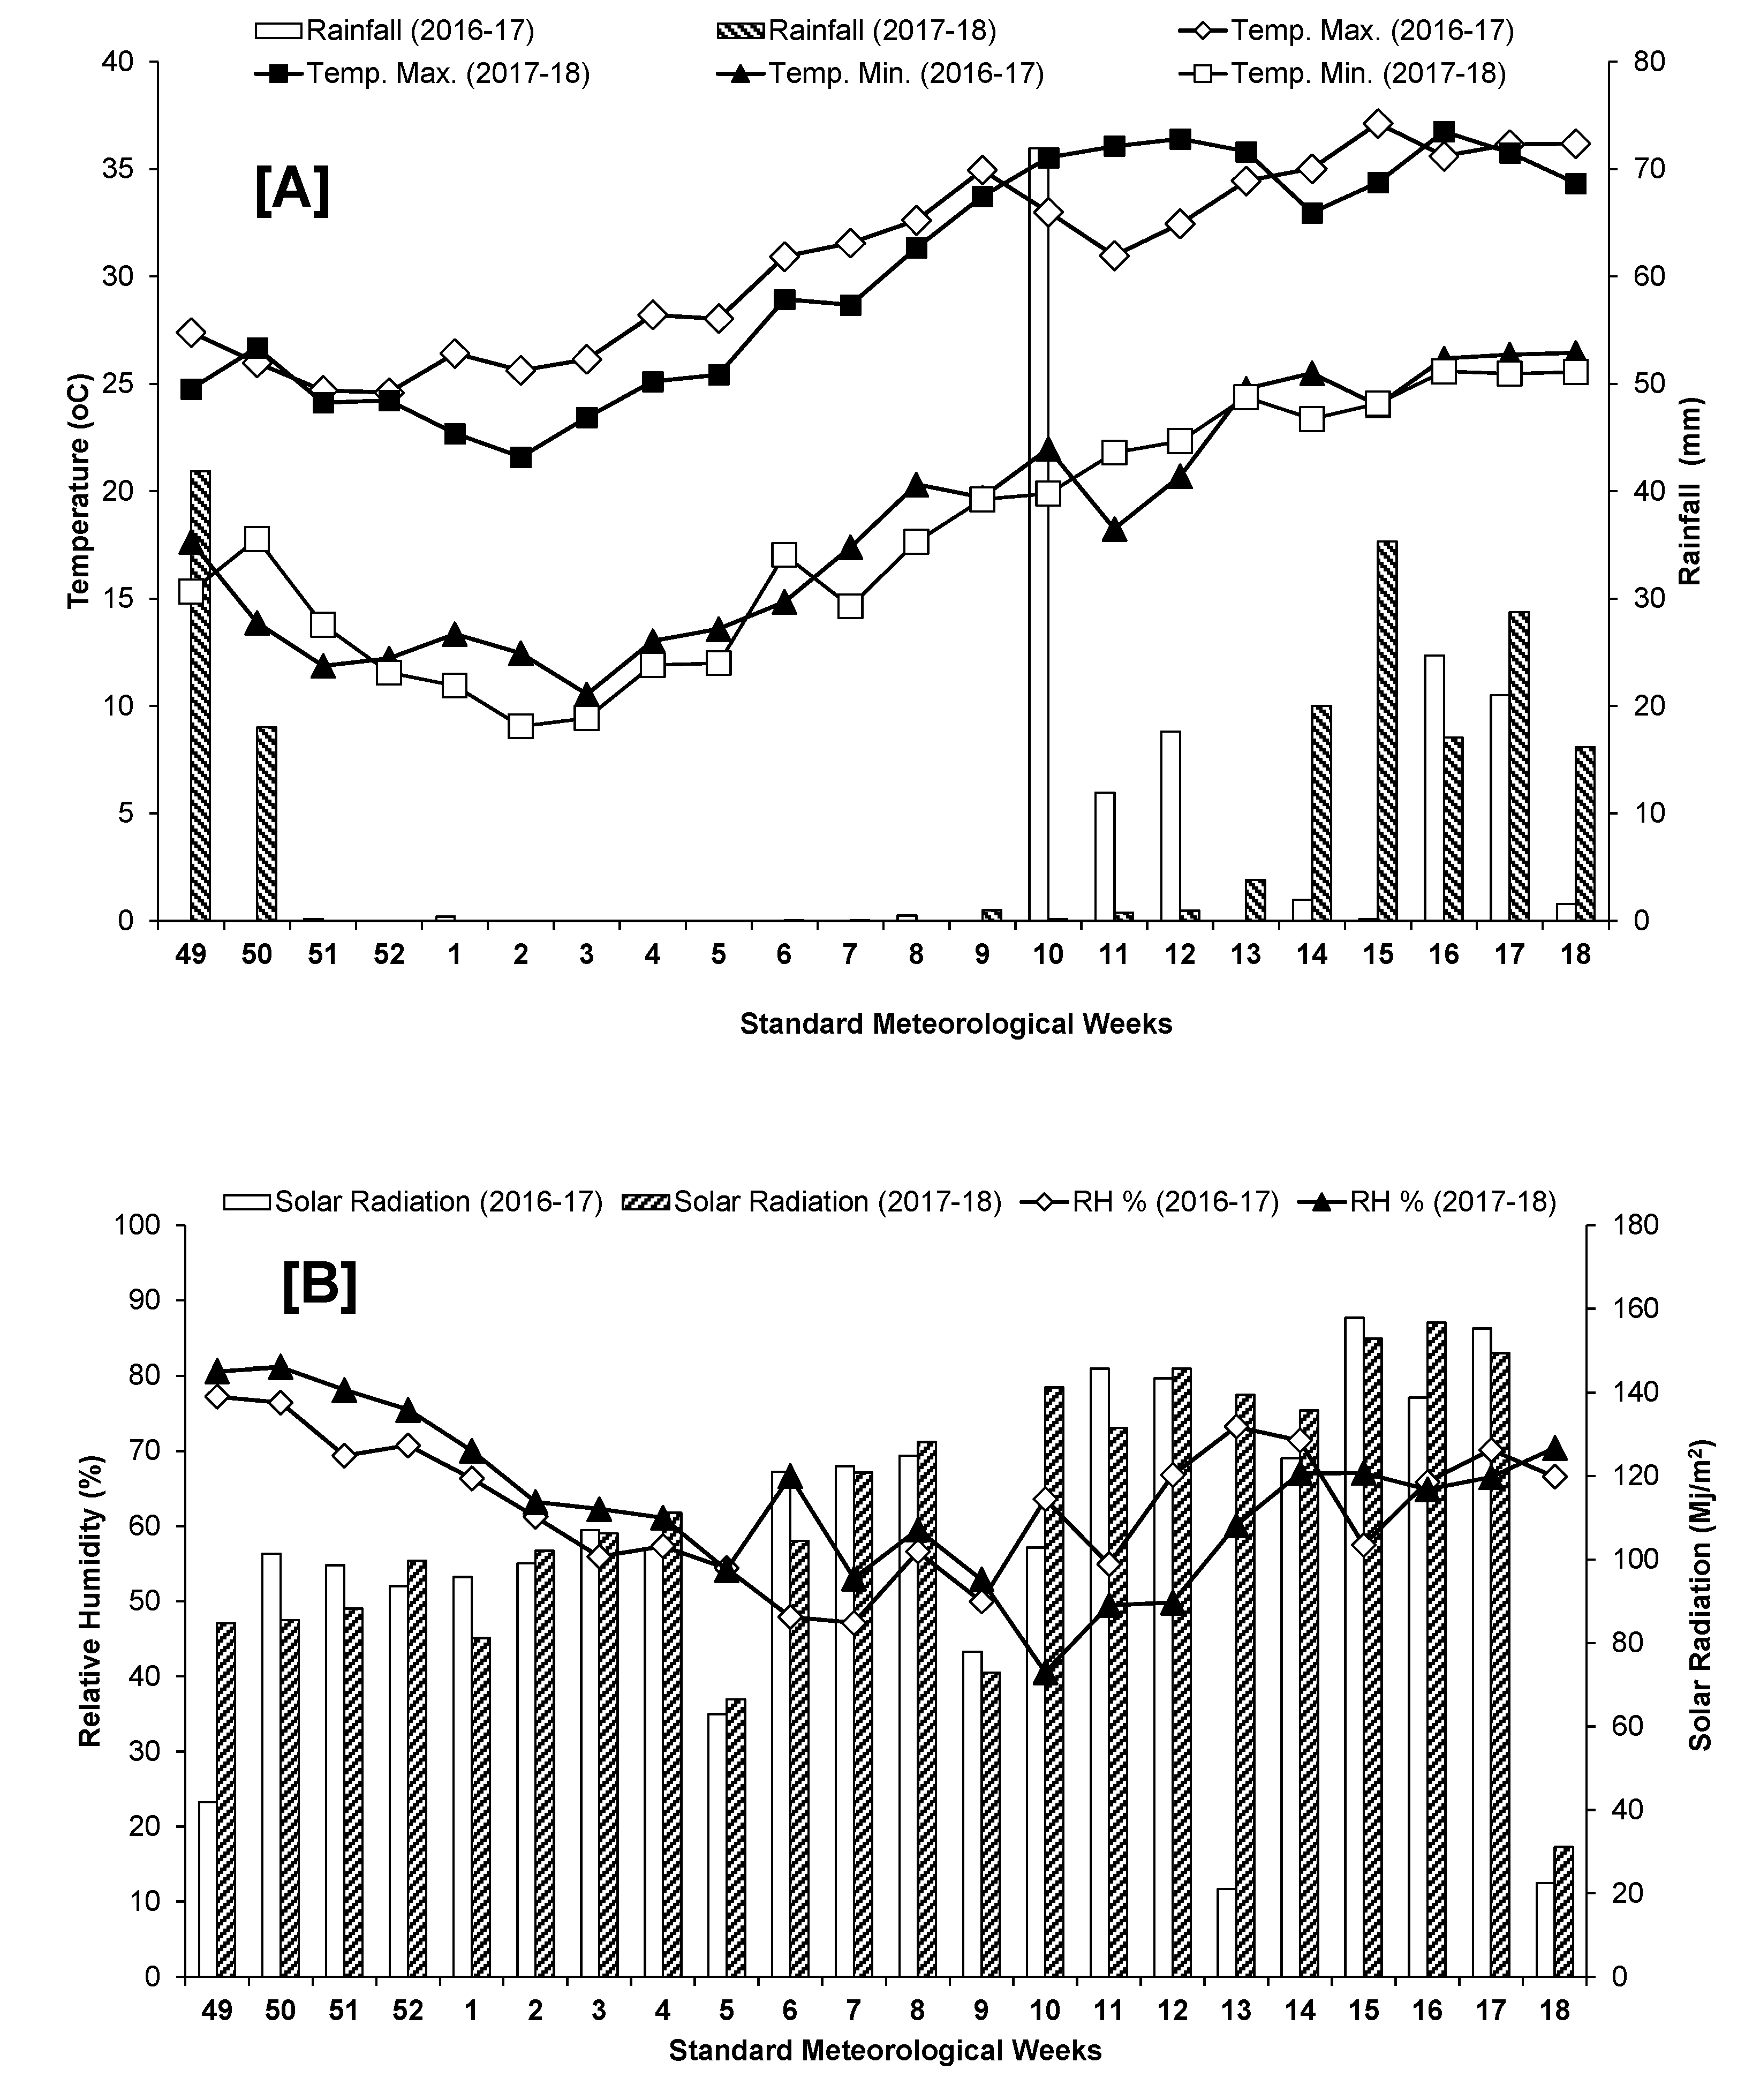
2.2. The Climatic and Edapahic Condition of Crop Growing Seasons

The agro-meteorological parameters were recorded at an Automatic Weather Station (EM50 Data Collection System, Decagon Inc., München, Germany) situated 50 m from the experimental site. Experimental site has a typical sub-tropical climate, and the monthly weather data of experimental years are presented in Figure 2A,B. The maximum and minimum temperature fluctuated between 37.6 °C–18.6 °C and 28.6 °C–8.6 °C, respectively. In general, there was a gradual drop in temperature from November to January. Relative humidity prevailed between 81.1% and 40.5%. The average rainfall during the experimental period (November to April) was 109.4 mm in 2016–17 and 141.1 mm in 2017–18. Average of 6.7 h of bright sunshine was recorded during the period of experimentation.
The mineralogy and soil temperature class of the experimental field are mixed and hyperthermic, respectively. The experimental soils of the area fall under lower deltaic physiographic unit and have developed on alluvium with shallow groundwater (≤2 m depth) The experimental soil samples from 0–15 cm, 15–30 cm and 30–45 cm depth (before starting of the experiment) were subjected to various physical and chemical analyses (Table 1).

2.3. Experimental Design and Crop Management

The experiment was laid out in a randomized block design with five treatments and four replications. The details of the treatment are given in Table 2. A detailed literature review (Supplementary Table S1) and a pilot study on the same experimental location before starting of the main research was carried out before selection of the irrigation management treatments. In both years of experiment, a hybrid tomato cultivar, i.e., NS 501 of Namdhari Seeds (P) Ltd., was grown. The selected tomato cultivar is suitable for tropics with tolerance to bacterial wilt and tomato leaf curl virus. In both years of the experiment, the seedlings of tomato were raised in early December by sowing one seed per plug in plastic trays using coir pith mixed with bio-fertilizer as media. The plots in the main experimental field were 4 m long and 3 m wide. The field was disc ploughed, followed by harrowing and cross cultivation to prepare a fine tilth. In each year of experimentation, moderate irrigation (20 mm) was provided to the beds a day before transplanting of the seedlings to keep the soil moist. Disease-free, vigorous and uniform height seedlings (28 days old) were selected and transplanted in the main experimental plots at 40 cm row spacing and 60 cm plant to plant spacing. Tomato plants received recommended doses of NPK fertilizer, i.e., N:P2O5:K2O :: 150:150:100 kg ha−1 respectively, out of which ½ N and all the P2O5 and K2O were applied before planting [37]. The rest of N was applied at 35 days after transplanting (DAT). Urea, single super phosphate (SSP) and muriate of potash (MOP) were used as sources of N, P and K, respectively. Chopped rice straw approximately 10 cm long was applied at 4.0 t ha−1 as mulching material. All other intercultural operations, such as weeding, staking and need-based plant protection measures were done following best management practices.

2.4. Irrigation Management

2.4.1. Establishment of Drip Irrigation System

To evaluate the different WS options for tomato crops grown by smallholder’s farms in the study area, a gravitational drip system was installed. The area is situated in a remote place with sparse electric supply. The drip system was made with 1.27 cm flexible PVC pipes as lateral with plastic emitters. A discharge controller was also fitted with the main laterals for controlling the flow of the water. A 500 L PVC storage tank was fitted with this drip system to store water at 4.5 m above ground level. The tank was filled with water through a petrol/kerosene engine water lifting device with the constant discharge rate as and when required. After the establishment of the entire drip system, for estimation of precise drip running time, the drip discharge rate (7.8 mL min−1) and drip application efficiency (87%) were also computed according to Payero et al. [38].

2.4.2. Calculation of Water Requirement

The USWB class A-pan evaporimeter (installed at the experimental site) was used for measuring daily pan evaporation (Ep). The pan evaporimeter method for estimation of Ep is one of the most popular and standardized methods for the Indian subcontinent and extensively used by the researchers [39,40,41]. The reference evapotranspiration (ET0) was obtained by multiplying Ep with pan coefficient (Kp), i.e., ET0 = Ep × Kp. The pan factor (Kp) value was assumed to be 0.80 as suggested for USWB class A-pan. After determination of ET0, the crop evapotranspiration (ETcrop) was determined using the following Equation (1) as suggested by Allen [42]:
E T c r o p = K c × E T 0
where, Kc is the crop coefficient and ETcrop is crop evapotranspiration. For most of the crops, Kc increases from a low value at the time of crop emergence to the maximum value during the period when the crop reaches the flowering stage and then declines as the crop approaches maturity. During the growth of tomato crop, the Kc values in FAO reference table followed Payero et al. [38].

2.4.3. Estimation of Water Requirement for Drip Irrigation

The water requirement of the crop was computed on a daily basis by the following Equation (2) (modified by Sukla et al. [43]).
V = E T c r o p × S p × S r × W p
where, V = volume of water required (L day−1 plant−1); Sp = plant to plant spacing (m); Sr = row to row spacing (m) and Wp = fractional wetted area, which varies with different growth stage (as suggested by Doorenbos and Pruitt [44]). The water requirement of tomato crop was estimated on a daily basis for all months considered under study. Daily time to operate the drip irrigation system was worked out using the application rate per plant. The drip system was scheduled on alternate days; hence, the total quantity of water delivered was cumulative water requirement of two days. The irrigation requirement by drip irrigation method was adjusted considering effective rainfall (using the CROPWAT 8.0 software) available at: http://www.fao.org/land-water/databases-and-software/cropwat/en/ and drip application efficiency.

2.4.4. Estimation of Water Requirement for Surface Irrigation Methods

For scheduling ‘surface irrigation methods’, i.e., ridge-furrow irrigation at critical growth stage approach (transplanting, active vegetative, flowering, early fruiting and fruit ripening stages), were followed according to Vijitha and Mahendran [45]. In each irrigation event, 5 cm of water was applied. The water was applied in the plots from a pond adjacent to the experimental field though a petrol/kerosene engine water lifting device with constant discharge rate (WBK30FF, Honda with a discharge rate 1000 L min−1).

2.5. Estimation of Water Salinity

In experimental years, surface water salinity (electrical conductivity or EC) of the farm pond (the source of irrigation water used) and ground water (from installed Piezometer at the experimental location at 5.48 m depth) were monitored at weekly intervals. The quality of ground water was measured with the help of AQUA-CRE conductivity meter; version 2.0.1. The results for surface water and ground water EC are presented in Supplementary Figures S1 and S2.

2.6. Plant Measurements

2.6.1. Biometrical Measurements

In each plot, second rows on either side were marked for destructive sampling and for recording other crop growth observations. The middle two rows were marked for the determination of yield. Five plants from each plot were randomly selected and tagged for recording plant height, total leaves plant−1 and stem diameter at 45 and 75 days after transplanting.

2.6.2. Yield and Yield Attributes

The fully mature fruits of tomato at 10–20% color break stage (red color and yellow color) were harvested periodically by manual harvesting. The harvesting was started from 1st April and was completed by 25th April, in both years. The number of fruits plant−1, the average weight of fruit (g) were recorded at the time of harvest and the observations were taken from the net plot avoiding the border effect. Weight of fruits of the net plot area was calculated treatment-wise. All fruits from the plants were harvested as per the treatment combinations, and fruit yield (in terms of kg plant−1 and t ha−1) was calculated accordingly.

2.6.3. Leaf Chlorophyll Content

To determine chlorophyll content (chlorophyll a, b and total chlorophyll), 0.5 g of fresh leaves at 60 days after transplanting (DAT) was sampled and soaked in 10 mL methanol (85%) for 24 h, in the presence of a small amount of Na2CO3; after that, extract were homogenized and centrifuged. Then the optical density of supernatant was spectrophotometrically measured, and chlorophyll content calculated by Nornal [46].

2.6.4. Analysis of Leaf Samples

In both years, tomato leaves from each plot were collected at 60 DAT, oven-dried, and ground for analyzing total N, P and K concentrations at harvest. Nitrogen was estimated by the micro-Kjeldahl method [31]. For determination of P and K content, plant material was digested in acid mixture (HNO3:H2SO4:HClO4 = 10:1:4) [30] and estimated by spectrophotometer and flame photometer, respectively.

2.6.5. Fruit Physical Properties

To determine fruit physical properties, ten fruits were selected randomly from each treatment. Fruit size was measured in terms of length and diameter of fruits with the help of the Vernier scale, and the fruit shape index was determined by dividing respective fruit length by its diameter. Average fruit weight was determined by digital weighing balance and volume was measured by water displacement technique of harvested fruits. The specific gravity was calculated by dividing weight of fruit by its volume. Fruit firmness of tomato was determined by a screw type Penetrometer (FT-327, Facchini, Italy) and the penetrometer reading was expressed in kg cm−2. To measure the average pulp thickness of tomato fruit, randomly selected fruits were cut and length between pericarp and core-line was taken with slide-calipers, and the average value was expressed in centimeters. To determine seed content, fruits were allowed to decay by dipping into the water and thereafter, seeds were separated from the decayed pulp and counted accordingly. To measure the moisture content of harvested fruits, freshly harvested fruits were randomly selected according to the treatments and the average fresh weight was taken by electrical balance; then fruits were cut into small pieces and oven-dried. After 48 h, the samples were taken out and the average dry weights were measured. The moisture percentage was calculated by the following Equation (3):
Moisture   percentage = ( Fresh   sample   weight dry   sample   weight ) Dry   sample   weight × 100

2.6.6. Fruit Biochemical Properties

Fruit biochemical parameters were determined for assessing the fruit quality. The properties were determined from the juice extracted from 10 fruits of each replication. The Soluble Solid Concentrate (SSC) was estimated using a digital refractometer (ATAGO, RX 5000, Tokyo, Japan) and was expressed as Brix. The total titratable acidity (TA) was determined by volumetric procedure. The known volume of filtered juice of fresh tomato after necessary dilution was titrated against standard alkali solution (N/10 NaOH) using phenolphthalein indicator and expressed as percentage in terms of citric acid [47]. From the homogenized juice of sample tomato fruit, pH was measured using a pH meter (Acorn pH 6 Meter, Oakton Instruments, Vernon Hills, IL, USA). The ascorbic acid content of the tomato fruit was estimated by using 2,6-dichlorophenolindophenol dye titration method [48]. Total sugars, reducing sugars and non-reducing sugars were estimated according to the method explained by Khan et al. [49] and were expressed as percentage (%). The lycopene content of mature tomato (harvested at the same date) was determined with petroleum-ether extract as suggested by Ranganna [50]. The petroleum-ether extract was decanted in a separating funnel containing cotton wool. After that, sodium sulphate slurry was added with petroleum-ether until it became colorless. The absorbance of the extract was measured with the help of spectrophotometer at 503 nm wavelength.

2.7. Assessment of Soil Microbes

Initial and post-harvest soil samples (after harvesting of 2nd season crop) were collected with an auger (5 cm diameter) from the mid-points between rows in five locations of each plot from a depth of 15 cm, 30 cm and 45 cm, and bulked, having almost 200–250 g fresh weight, and immediately stored in the refrigerated box. The colony-forming units (cfu) of fungi, bacteria, and actinomycetes were enumerated in Czapek’s Dox medium, nutrient agar, and actinomycetes isolation agar (Hi media), respectively, following serial dilution technique and agar/pour plate method using a 1 mL soil solution for plating [51]. The microbes were incubated at 30 °C after serial dilution, and spreading of the soil solution on the respective plates was done. The population of bacteria per plate were scored within 3 days, whereas the population of fungi and actinomycetes were observed after an incubation period of 5–7 days [52]. The sum of the populations of fungi, bacteria, and actinomycetes was considered for the total microbial populations.

2.8. Estimation of Water Productivity (WP)

Water Productivity (WP) of the crop was calculated based on the economic yield produce per unit of total water supply including the amount of plant available soil water on the planting date, amount of irrigation applied and effective rainfall during the growing season with the help of the following formula as suggested by Van Halsema and Vincent [53] and Carr et al. [54]:
Water   productivity = Economic   yield   produce   in   kg   per   unit   area Total   water   applied   in   mm   per   unit   area

2.9. Statistical Analysis

Data were subjected to analysis of variance (ANOVA) as randomized block design and the mean values were adjudged by Duncan Multiple Range Test (DMRT) method using GenStat software (20th Edition, VSN International, Hemel Hempstead, UK, web page: www.genstat.co.uk). The variance over the years was estimated homogeneously by performing Bartlett’s chi-square test and pooled analyses of observations are presented to draw logical conclusions. The Excel software (version 2016, Microsoft Inc., Redmond, WA, USA) was used to draw graphs and figures.

3. Results

3.1. Plant Growth Traits of Tomato

Both at 45 and 75 DAT, the maximum plant height (90.83 cm and 94.13 cm) was recorded in plots receiving drip irrigation at 80% ET0 + mulching. Shortest plants were observed from drip irrigation at 100% ET0 and surface irrigation treatments (Table 3). Similarly, the maximum stem diameter at 45 and 75 DAT was obtained in plants receiving drip irrigation at 80% ET0 + straw mulching treatment followed by drip irrigation at 100% ET0 treatment. The maximum values for the number of leaves plant−1 at 45 and 75 DAT were observed when the plants received drip irrigation at 80% ET0 along with straw mulch. On the other hand, the growth parameters of tomato were revealed as non-significant responses as influenced by Year and Year × Irrigation treatment factors.

3.2. Yield and Yield Attributes of Tomato

The maximum average fruit weight (64.96 g) was recorded from the plants receiving drip irrigation at 80% ET0 + straw mulching followed by those receiving drip irrigation at 100% ET0 (Table 4). Drip irrigation with or without straw mulching significantly increased the number of fruits plant−1. Amongst irrigation treatments, the maximum number of fruits plant−1 (36.50) was recorded from the plants receiving drip irrigation at 80% ET0 + straw mulching. As a result, significantly higher fruit yield (61.67 t ha−1) and marketable yield (60.32 t ha−1) were also recorded from the same treatment. Except fruit yield, all other yield attributes of tomato were revealed as non-significant responses as influenced by Year and Year × Irrigation treatment factors. The significantly higher fruit yield (53.63 t ha−1) was recorded from the second year of experimentation.

3.3. Changes in Leaf Macronutrient Content

The N and K concentration in tomato leaves were significantly (p ≤ 0.05) higher in straw mulched plots applied with drip irrigation at 80% ET0 than other irrigation treatments (Table 5). However, there was no significant effect of irrigation treatments on leaf P concentration. Except for leaf N concentration, Year and Year × Irrigation treatment factors revealed non-significant responses on leaf P and K content of tomato.

3.4. Leaf Pigment Content

The chlorophyll ‘a’ and chlorophyll ‘b’ contents of tomato leaves measured at the 60 DAT were significantly higher in plots receiving drip irrigation at 80% ET0 + straw mulching (Table 5). As a result, the total chlorophyll content was also highest (1.568 mg g−1 of fresh weight) in the same treatment.

3.5. Fruit Physical Parameters

Plants receiving drip irrigation at 80% ET0 along with straw mulch produced larger fruits (p ≤ 0.05) than surface irrigations (Table 6). However, there was no significant difference in L/B ratio of tomato among irrigation treatments. Adoption of different irrigation options failed to significantly change the fruit specific gravity. Fruit obtained from the plants receiving drip irrigation at 80% ET0 along with straw mulch recorded the highest fruit firmness value (6.014 kg cm−2) during both the years. Pericarp thickness of tomato was increased significantly (p ≤ 0.05) with the adoption of drip irrigation compared to surface water application (Table 6). Fruits with the maximum pericarp thickness (6.977 mm) were obtained from tomato plants receiving drip irrigation at 80% ET0 along with straw mulch. Fruit with high moisture content is generally soft in nature and deteriorates more quickly. Thus, less moisture content in tomato is always preferred by consumers for better keeping quality. Fruits obtained from the plots receiving drip irrigation at 80% ET0 along with straw mulch recorded the least moisture content (90.71%) in tomato than other irrigation options. Different irrigation options failed to change the number of seeds per fruit (Table 6). All fruit physical parameters except moisture percent and number of seeds fruit−1, recorded significantly higher values during the first year of experimentation (Table 6).

3.6. Fruit Biochemical Parameters

Tomato plants receiving drip irrigation at 100% ET0 had higher juice pH values but there were no significant changes with the values among other irrigation treatments (Table 7). Tomato plants receiving drip irrigation at 80% ET0 along with straw mulch produced fruits with the maximum TSS content (5.268 °Brix), vitamin C, sugars (reducing, non-reducing sugar and total sugar content) and lycopene content. Irrigation had no significant influence on the total acidity of tomato (Table 7). Amongst the fruit biochemical quality traits evaluated, significant and positive correlations were observed amongst all the quality parameters (Table 8).

3.7. Post-Harvest Soil Characteristics and Salinity Dynamics

The plots receiving surface irrigation recorded the maximum values of EC (Table 9) while the lowest EC values were recorded from the plots irrigated with drip irrigation at 80% ET0 along with straw mulching. However, the reduction in soil EC due to adoption of drip irrigation with mulch was mostly restricted within the top-soil layer (0–30 cm). Soil reaction at different depth of soil layer was not influenced significantly by different WS options except in the top-soil layer where the maximum pH (6.27) was found in the plots receiving drip irrigation at 100% ET0, followed by drip irrigation at 80% ET0 along with straw mulch. The organic carbon, available N, P and K status of the experimental soil did not vary significantly with the adoption of different WS options (Table 10).
Irrespective of the types of microbes, the highest microbial population was found in the top-soil layer (0–15 cm) as compared to the sub-surface soil layer (15–45 cm) (Table 11). Amongst the irrigation options, the significantly higher total microbial population was found from the plots receiving drip irrigation at 80% ET0 along with straw mulch. However, the beneficial effect of drip irrigation and straw mulch was mostly restricted to top-soil layer.

3.8. Water Balance and Water Productivity

The highest profile water contribution and total water use were recorded from surface water irrigated plots (Table 12). On the other hand, plots receiving drip irrigation at 80% ET0 along with straw mulch, recorded the least profile water contribution as well as total water use (Table 12). Plots with drip irrigation at 80% ET0 along with straw mulch recorded the maximum water productivity (186.38 and 182.33 kg ha-mm−1 in year 1 and year 2, respectively) by producing the maximum fruit yield (58.58 and 61.44 t ha−1 in year 1 and year 2, respectively) with the least application of irrigation water (329.67 and 322.47 mm in year 1 and year 2, respectively).

4. Discussion

The experimental area is a bit different from other tomato growing parts of the state of West Bengal. It is a polder area having a very high water table as well as high ground water salinity; as a result, there is a little scope for the lifting of ground water. Farmers of this region are forced to use limited surface water (ponds, canals, etc.) for irrigating their crops. The present study made an attempt to adjudge the suitable irrigation option for tomato crop in this saline area, and the recommendations are expected to be simultaneously applicable for other salinity stress areas.
The results of the experiment revealed that drip irrigation along with mulching demonstrated good impact on different soil and plant characters studied across the years. Application of drip irrigation at 80% ET0 along with mulching proved better than conventional surface irrigation, surface irrigation + mulching and sole drip irrigation (without mulching). In comparison to the surface irrigation, drip irrigation at 80% ET0 + mulching increased about 22.8, 28.6 and 25.7% plant height, stem diameter and number of leaves per plant of tomato, respectively at 75 DAT. Drip irrigation has been reported to apply the required amount of water directly to the root zone of crops [55]. Precise water application through drip system in mulched plots might have increased the growth characters, as was evidenced from the experiment (Table 3). In comparison to other irrigation methods, application of drip irrigation at 80% ET0 + mulching improved yield attributes and yield of tomato (Table 4). Results are in line with Michael [15] who observed higher crop yield with the application of drip irrigation. Singh et al. [56] confirmed that drip irrigation at 80% pan evaporation can significantly increase fruit yield in tomato compared with surface irrigation. Besides, mulching can also increase horticultural crop production in water scarcity regions [57,58]. The higher yields under drip system can be attributed to optimal soil moisture regime in the crop root zone and reduced nutrient losses. Higher marketable tomato yield from the drip-irrigated plot with a lesser amount of water than other irrigation treatments, in the present experiment, could be related to better root development which may encourage the plants to explore a greater soil mass and to increase the water absorption [59]. Increase in yields of drip-irrigated vegetables has also been reported by Imtiyaz et al. [60] and Tagar et al. [61].
In the present study, sole application (without mulch) of drip irrigation at 80% and 100% ET0 significantly improved juice pH value in tomato fruit, being followed by application of drip irrigation at 80% ET0 + straw mulch. Lowest juice pH value was obtained in the case of surface irrigated plots, which might be due to early ripening of fruits in those plots resulting in rapid deterioration of complex metabolites of fruits in simple forms [62,63]. The taste of tomato is largely determined by the sugar and organic contents and their ratios [64]. The occurrence of significantly higher TSS and sugar contents with drip irrigation at 80% ET0 along with straw mulch as compared to the surface irrigation may be an impact of the lower accumulation of water in the fruit and simultaneous lower dilution of fruit components [65,66]. Zegbe-Domiguze et al. [67] predicted promoted sugar transport to the fruits for drip irrigation as the cause of increased soluble solids content and improved taste and sensory qualities of tomato. In the present experiment, application of drip irrigation at 80% ET0 at straw mulched plots significantly increased lycopene, vitamin C and sugar (reducing, non-reducing and total) contents over other treatments. This might be due to the gradual supply of water to the plants in drip-irrigated + straw mulched plots. The comparative mild stress situation, as was observed in drip irrigation at 80% ET0, can help to increase vitamin C and lycopene contents in tomato [68,69]. Results of the present experiment are in accordance with findings of Nahar and Gretzmacher [70], who revealed enhancement of quality and sweetness of tomato with prerequisite increase in ascorbic acid contents with optimum water supply to the plants. Judicious supply of irrigation may exert beneficial effects upon fruit quality, mostly with respect to total soluble solid and soluble sugar contents in tomato [71]. The significant (p < 0.01) and positive correlation of ascorbic acid and sugar (reducing, non-reducing and total) content also signifies the manifested role of irrigation treatments in simultaneously increasing or decreasing these quality parameters in the present study (Table 8).
In the experiment, the combined use of drip irrigation and mulching had a positive impact on regulating soil salinity (Table 9). Application of drip irrigation has been reported to reduce soil evaporation, surface runoff, and deep percolation losses of water, which can be crucial factors in reducing salinity stress to the plants [72]. On the other hand, surface mulching has a significant and positive impact to regulate soil salinity by reducing evapotranspiration losses of water. Fan et al. [73] had reported that the salinity level of the soil (0.44%) decreased to 0.07% after being mulched with straw for consecutive two years. Yan-min et al. [74] also reported that soil salinity level at the surface layer was lower in mulched conditions as compared to control conditions (no mulch). In this study, soil salinity increased with increasing depth of soil sampling (Table 9). It was that salt concentration changed with the application of irrigation water mainly in the upper root zone around 0–60 cm [75,76]. Application of drip irrigation was also observed to have a good impact on post-harvest soil available N, P and K content. This might be due to better availability of water in drip-irrigated plots, which is expected to ensure nutrient use efficiency as a result of good water-nutrient nexus in soil and better available NPK status of the post-harvest soils [77].
Better soil microbial status was administered in drip-irrigated + straw mulched plots (Table 11). However, comparatively lesser soil microbial population was observed in surface irrigated plots. Wang et al. [77] reported that drip irrigation can significantly influence soil microbial communities of tomato crop grown under greenhouse environment. Application of drip irrigation can alter soil microbiological properties by improving the root-zone soil environment and can increase the oxygen content in the root-zone. It is also reported that alternate wet and dry conditions in the root zone, achieved with drip irrigation, are beneficial to bacterial growth owing to better soil respiration [78,79,80].
The combined use of drip irrigation and straw mulch improved the WP, irrespective of the years of experimentation (Table 12). Drip irrigation can uniformly distribute water, reduce ET0 and deep percolation losses, and decrease soil salinity [14]. In the experimentation, drip irrigation + straw mulching might have created alternate wetting and drying situation in the soil which is conducive for increased abscisic acid (ABA) concentration in xylem sap. Such accumulation of ABA has been reported to decrease stomatal conductance and reduce “luxury” transpiration loss, ultimately leading to improving crop yield and WUE [81]. Singh et al. [56] also reported higher water productivity of vegetable crops under drip irrigation technique. Drip irrigation can restrict salt accumulation in the surface layer of soil by the simultaneous supply of adequate water in the root zone of the plant, thus, can help in the development of a favorable environment for crop growth.

5. Conclusions

From the results and discussion of the current study, it can be revealed that application of drip irrigation at 80% ET0 in combination with straw mulching is useful for enhancing the number of fruits as well as the marketable yield of tomato. The results related to soil pH, post-harvest organic carbon, nitrogen, phosphorus and potassium status, and soil microbial population along with the biochemical quality parameters of tomato (juice pH, ascorbic acid, total soluble solids and sugar content of fruits) were also significantly influenced through the combined application of drip irrigation and mulching. Besides these findings, the study also confirmed that the surface irrigation significantly increased the salinity level in surface and sub-surface soil layers while the least salinity development was observed in surface mulched plots receiving irrigation water through drip irrigation. The drip irrigation along with straw mulching improved yield and quality of tomato with the simultaneous increase in water productivity. Such intervention also helped in reducing salinity stress for the tomato crop. Thus, straw mulching along with drip irrigation at 80% ET0 can be recommended as the most suitable irrigation option for tomato crop in coastal saline ecosystem of the Ganges Delta.

Supplementary Materials

The following are available online at https://www.mdpi.com/2071-1050/12/17/6779/s1, Figure S1: Ground water depth and salinity of the experimental site, Figure S2: Surface water (used for surface and drip irrigation) salinity of the experimental site, Table S1: Literatures behind the basis of selection of drip irrigation treatments, Table S2: Effect of drip and surface irrigation on yield of tomato.

Author Contributions

Conceptualization, K.B., M.K.N. and S.S. (Sukamal Sarkar); methodology, S.S. (Sukamal Sarkar) and S.S. (Sayan Sau); formal analysis, S.S. (Sukamal Sarkar), K.R. and A.G.; investigation, I.S. and S.S. (Sukamal Sarkar); resources, K.B. and M.M.; data curation, S.S. (Sukamal Sarkar), A.H. and R.W.B., writing—original draft preparation, I.S., S.S. (Sukamal Sarkar) and K.R.; writing—review and editing, K.B., A.H., M.S., R.B., M.M., M.B., L.L., H.S., M.A.R., M.E. and A.E.S.; supervision, K.B.; project administration, K.B. and M.M.; funding acquisition, M.S., M.B., L.L., H.S., M.A.R., M.E. and A.E.S.; All authors have read and agreed to the published version of the manuscript.

Funding

This research was funded by Australian Centre for International Agricultural Research (ACIAR) under “Cropping system intensification in the salt-affected coastal zones of Bangladesh and West Bengal, India” Project (https://www.aciar.gov.au/project/LWR-2014-073), grant number LWR/2014/073. The APC was funded by the project VEGA 1/0589/19.

Acknowledgments

The authors sincerely acknowledge the contributions of the Department of Agronomy and Department of Horticulture of Bidhan Chandra Krishi Viswavidyalaya, Mohanpur, West Bengal, India for providing necessary laboratory facilities during the investigation. The authors are highly grateful to Nirmal Mondal, the farmer involved in this experiment, for providing his valuable land.

Conflicts of Interest

The authors declare no conflict of interest. The funders had no role in the design of the study; in the collection, analyses, or interpretation of data; in the writing of the manuscript, or in the decision to publish the results.

Abbreviations

ABAAbscisic acid
ANOVAAnalysis of variance
DATDays after transplanting
DMRTDuncan Multiple Range Test
ET0Evapotranspiration
ECElectrical conductivity
KPotassium
MOPMuriate of potash
NNitrogen
PPhosphorus
SSPSingle superphosphate
WPWater Productivity
WSWater-Saving

References

  1. Willcox, J.K.; Catignani, G.L.; Lazarus, S. Tomatoes and cardio-vascular health. Crit Rev. Food Sci. Nutr. 2003, 43, 739–744. [Google Scholar] [CrossRef] [PubMed]
  2. Tigist, M.; Workneh, T.S.; Woldetsadik, K. Effects of variety on the quality of tomato stored under ambient conditions. J. Food Sci. Tech. Mys. 2013, 50, 477–486. [Google Scholar] [CrossRef] [PubMed] [Green Version]
  3. Government of West Bengal. Statistics Division; Department of Agriculture & Cooperation, Government of India: New Delhi, India, 2018.
  4. Hou, M.; Shao, X.; Zhai, Y. Effects of different regulatory methods on improvement of greenhouse saline soils, tomato quality, and yield. Sci. World J. 2014, 2014, 953675. [Google Scholar]
  5. Murad, K.F.I.; Hossain, A.; Fakir, O.A.; Biswas, S.K.; Sarker, K.K.; Rannu, R.P.; Timsina, J. Conjunctive use of saline and fresh water increases the productivity of maize in saline coastal region of Bangladesh. Agric. Water Manag. 2018, 204, 262–270. [Google Scholar] [CrossRef]
  6. Wright, J.L. Recent development in determining crop coefficient values. In Proceedings of the ASCE, Irrigation and Drainage Division Specialty Conference, Albuquerque, NM, USA, 12–16 July 2002; pp. 161–162. [Google Scholar]
  7. Dalvi, V.B.; Tiwari, K.N.; Pawade, M.N.; Phirke, P.S. Response surface analysis of tomato production under micro-irrigation. Agric. Water Manag. 1999, 41, 11–19. [Google Scholar] [CrossRef]
  8. Zegbe-Dominguez, J.A.; Behboudian, M.H.; Lang, A.; Clothier, B.E. Deficit irrigation and partial root zone drying maintain fruit dry mass and enhance fruit quality in ‘Petopride’ processing tomato (Lycopersicon esculentum Mill.). Sci. Hortc. 2003, 98, 505–510. [Google Scholar] [CrossRef]
  9. Kirda, C.; Cetin, M.; Dasgan, Y.; Topcu, S.; Kaman, H.; Ekici, B.; Derici, M.R.; Ozguven, A.I. Yield response of greenhouse grown tomato to partial root drying and conventional deficit irrigation. Agric. Water Manag. 2004, 69, 191–201. [Google Scholar] [CrossRef]
  10. Harmanto, V.M.; Salokhe, M.; Babel, S.; Tantau, H.J. Water requirement of drip irrigated tomatoes grown in greenhouse in tropical environment. Agric. Water Manag. 2005, 71, 225–242. [Google Scholar] [CrossRef]
  11. Simsek, M.; Tonkaz, T.; Kacira, M.; Comiekcioglu, N.; Dogan, Z. The effects of different irrigation regimes on cucumber (Cucumbis salivus L.) yield and yield characteristics under open field conditions. Agric. Water Manag. 2005, 73, 173–191. [Google Scholar] [CrossRef]
  12. Mainuddin, M.; Rahman, M.A.; Maniruzzaman, M.; Sarker, K.K.; Mandal, U.K.; Nanda, M.K.; Gaydon, D.S.; Sarangi, S.K.; Sarkar, S.; Yu, Y.; et al. The water and salt balance of Polders/Islands in the Ganges Delta. J. Indian Soc. Coast. Agric. Res. 2019, 37, 45–50. [Google Scholar] [CrossRef]
  13. Sarker, K.K.; Hossain, A.; Murad, K.F.I.; Biswas, S.K.; Akter, F.; Rannu, R.P.; Moniruzzaman, M.; Karim, N.N.; Timsina, J. Development and evaluation of an emitter with a low-pressure drip-irrigation system for sustainable eggplant production. J. Agric. Eng. 2019, 1, 376–390. [Google Scholar] [CrossRef] [Green Version]
  14. Karlberg, L.; de Vries, F.W.P. Exploring potentials and constraints of low-cost drip irrigation with saline water in sub-Saharan Africa. Phys. Chem. Earth Parts A/B/C 2004, 29, 1035–1042. [Google Scholar] [CrossRef]
  15. Michael, A.M. Irrigation Theory and Practic, 2nd ed.; Revised and Enlarged; Vikas Publishing House PVT. Ltd.: Delhi, India, 2008. [Google Scholar]
  16. Sharmasarkar, E.C.; Sharmasarkar, S.; Miller, S.D.; Vance, G.F.; Zhang, R. Assessment of drip and flood irrigation on water and fertilizer use efficiencies for sugar beets. Agric. Water Manag. 2001, 46, 241–251. [Google Scholar] [CrossRef]
  17. Sun, Y.; Hu, K.L.; Fan, Z.B.; Wei, Y.P.; Lin, S.; Wang, J.G. Simulating the fate of nitrogen and optimizing water and nitrogen management of greenhouse tomato in North China using the EU-Rotate_N model. Agric. Water Manag. 2018, 128, 72–84. [Google Scholar] [CrossRef]
  18. Camp, C.R.; Sadler, E.J.; Busscher, W.J.; Sojlka, R.E.; Karrlin, D.L. Experiencing with Sprinkler Irrigation for Agronomic Crops in the Southeastern USA. 2001; pp. 1–18. Available online: https://eprints.nwisrl.ars.usda.gov/1075/1/884.pdf (accessed on 25 August 2016).
  19. Sariyev, A.; Barutcular, C.; Acar, M.; Hossain, A.; EL Sabagh, A. Sub-surface drip irrigation in associated with H2O2 improved the productivity of maize under clay-rich soil of Adana, Turkey. Phyton Int. J. Exp. Bot. 2020, 89, 519–528. [Google Scholar] [CrossRef]
  20. Akhtar, S.S.; Li, G.; Andersen, M.N.; Liu, F. Biochar enhances yield and quality of tomato under reduced irrigation. Agric. Water Manag. 2014, 138, 37–44. [Google Scholar] [CrossRef]
  21. Conesa, M.À.; Galmés, J.; Ochogavía, J.M.; March, J.; Jaume, J.; Martorell, A.; Francis, D.M.; Medrano, H.; Rose, J.K.; Cifre, J. The postharvest tomato fruit quality of long shelf-life Mediterranean landraces is substantially influenced by irrigation regimes. Postharvest Biol. Technol. 2014, 93, 114–121. [Google Scholar] [CrossRef]
  22. Sánchez-Rodríguez, E.; Rubio-Wilhelmi, M.M.; Blasco, B.; Leyva, R.; Romero, L.; Ruiz, J.M.; SaÂnchez-RodrõÂguez, E. Antioxidant response resides in the shoot in reciprocal grafts of drought-tolerant and drought-sensitive cultivars in tomato under water stress. Plant Sci. 2012, 188–189, 89–96. [Google Scholar] [CrossRef]
  23. Biswas, S.K.; Akanda, A.R.; Rahman, M.S.; Hossain, M.A. Effect of drip irrigation and mulching on yield, water-use efficiency and economics of tomato. Plant Soil Environ. 2015, 6, 97–102. [Google Scholar]
  24. Kere, G.M.; Nyanjage, M.O.; Liu, G.; Nyalala, S.P.O. Influence of drip irrigation schedule and mulching material on yield and quality of greenhouse tomato (Lycopersicon esculentum Mill. ‘Money Maker’). Asian J. Plant Sci. 2003, 2, 1052–1058. [Google Scholar] [CrossRef]
  25. Liu, Q.Z.; Hu, Z.Z. Study of plastic mulching on Brassica Rapa in Alpine area. 1: Effects of plastic film mulching on micro-environment of brassica in alpine area. Practuc. Sci. 2000, 17, 19–22. [Google Scholar]
  26. Bouyoucos, G.J. Hydrometer method improved for making particle size analysis of soils. Agron J. 1962, 54, 464–465. [Google Scholar] [CrossRef]
  27. Black, C.A.; Evans, D.D.; White, J.L.; Ensminger, L.E.; Clark, F.E. Methods of Soil Analysis; Part. 1; Agronomy No. 9; American Society of Agronomy, Inc.: Madison, WI, USA, 1965. [Google Scholar]
  28. Tan, K.H. Soil Sampling, Preparation, and Analysis; Marcel Dekker: New York, NY, USA, 1996. [Google Scholar]
  29. Jackson, M.L. Soil Chemical Analysis; Prentice Hall of India Pvt. Ltd.: New Delhi, India, 1967. [Google Scholar]
  30. Jackson, M.L. Soil Chemical Analysis; Prentice Hall of India Private Ltd.: New Delhi, India, 1973. [Google Scholar]
  31. Subbiah, B.; Asija, G.L. A rapid procedure for the estimation of available N in soils. Curr. Sci. 1956, 25, 259–260. [Google Scholar]
  32. Olsen, S.R.; Cole, C.V.; Watanabe, F.S.; Dean, L.A. Estimation of Available Phosphorus in Soils by Extraction with Sodium Bicarbonate (USDA Circular 939); Government Printing Office: Washington, DC, USA, 1954.
  33. Brown, A.J.; Warncke, D. Recommended cation tests and measures of cation exchange capacity. In Recommended Chemical Soil Tests Procedures for the North Central Region; Bulletin No. 499 (Revised); Dahnke, W.C., Ed.; North Dakota Agricultural Experiment Station: Fargo, ND, USA, 1988; pp. 15–16. [Google Scholar]
  34. Lindsay, W.L.; Norvell, W.A. Development of a DTPA soil test for zinc, iron, manganese, and copper. Soil Sci. Soc. Am. J. 1978, 42, 421–428. [Google Scholar] [CrossRef]
  35. Chesnin, L.; Yien, C.H. Turbidimetric determination of available sulphate. Soil Sci. Soc. Am. Proc. 1951, 15, 149–151. [Google Scholar] [CrossRef]
  36. Berger, K.C.; Truog, E. Boron determination in soils and plants. Ind. Eng. Chem. Anal. Ed. 1939, 11, 540–545. [Google Scholar] [CrossRef]
  37. Kumar, P. Effect of Integrated Nutrient Management on Sustainable Cabbage and Tomato Production. Ph.D. Thesis, Department of Vegetable Crops, Dr. YS Parmar University of Horticulture and Forestry, Nauni, Solan, 2003; p. 282. [Google Scholar]
  38. Payero, J.O.; Tarkalson, D.D.; Irmak, S.; Davison, D.; Petersen, J.L. Effect of irrigation amounts applied with subsurface drip irrigation on corn evapotranspiration, yield, water use efficiency, and dry matter production in a semiarid climate. Agric. Water Manag. 2008, 95, 895–908. [Google Scholar] [CrossRef] [Green Version]
  39. Antony, E.; Singandhupe, R.B. Impact of drip and surface irrigation on growth, yield and WUE of capsicum (Capsicum annum L.). Agric. Water Manag. 2004, 65, 121–132. [Google Scholar] [CrossRef]
  40. Paul, J.C.; Mishra, J.N.; Panigrahi, B. Effect of drip and surface irrigation with plastic mulching on growth, yield, WUE and economics of growing brinjal in coastal Odisha. Conservation 2014, 13, 239–244. [Google Scholar]
  41. Sarkar, S.; Goswami, S.B.; Mallick, S.; Nanda, M.K. Different indices to characterize water use pattern of micro-sprinkler irrigated onion (Allium cepa L.). Agric. Water Manag. 2008, 95, 625–632. [Google Scholar] [CrossRef]
  42. Allen, R.G. Using the FAO-56 dual crop coefficient method over an irrigated region as part of an evapotranspiration intercomparison study. J. Hydrol. 2000, 229, 27–41. [Google Scholar] [CrossRef]
  43. Shukla, K.N.; Singh, P.K.; Singh, K.K. Crop Water Requirement under Drip Irrigation; Plasticulture Development Centre, GBPUAT: Pantnagar, India, 2001. [Google Scholar]
  44. Doorenbos, J.; Pruitt, W.O. Crop water requirements. In FAO Irrigation and Drainage Paper 24; Land and Water Development Division, FAO: Rome, Italy, 1977; p. 144. [Google Scholar]
  45. Vijitha, R.; Mahendran, S. Effect of moisture stress at different growth stages of tomato plant (Lycopersiconesculentum Mill.) on yield and quality of fruits. J. Sci. Univ. Kelaniya 2010, 5, 1–11. [Google Scholar] [CrossRef]
  46. Nornal, R. Formula for determination of chlorophyllous Pigments extracted with N—Dimethyleformamide. Plant Physiol. 1982, 69, 1371–1381. [Google Scholar]
  47. AOAC International. Official Methods of Analysis of AOAC International, 17th ed.; AOAC: Gaithersburg, MD, USA, 2000. [Google Scholar]
  48. Casanas, R.; González, M.; Rodríguez, E.; Marrero, A.; Díaz, C. Chemo-metric studies of chemical compounds in five cultivars of potatoes from Tenerife. J. Agric. Food Chem. 2002, 50, 2076–2082. [Google Scholar] [CrossRef]
  49. Khan, M.Z.; Akhtar, M.E.; Safdar, M.N.; Mahmood, M.M.; Ahmad, S.; Ahmed, N. Effect of source and level of potash on yield and quality of potato tubers. Pak. J. Bot. 2010, 42, 3137–3145. [Google Scholar]
  50. Ranganna, S. Manual of Analysis of Fruits and Vegetable Products; Tata McGrawHill Publishing Company Limited: New Delhi, India, 1979; p. 634. [Google Scholar]
  51. Alexander, M. Introduction to Soil Microbiology; Wiley Eastern Ltd.: New Delhi, India, 1978. [Google Scholar] [CrossRef]
  52. Das, T.K.; Sakhuja, P.K.; Zelleke, H. Herbicide efficacy and non-target toxicity in highland rainfed maize of Eastern Ethiopia. Int. J. Pest. Manag. 2010, 56, 315–325. [Google Scholar] [CrossRef]
  53. Van Halsema, G.E.; Vincent, L. Efficiency and productivity terms for water management: A matter of contextual relativism versus general absolutism. Agric. Water Manag. 2012, 108, 9–15. [Google Scholar] [CrossRef]
  54. Carr, T.; Yang, H.; Ray, C. Temporal Variations of Water Productivity in Irrigated Corn: An Analysis of Factors Influencing Yield and Water Use across Central Nebraska. PLoS ONE 2016, 11, e0161944. [Google Scholar] [CrossRef]
  55. Sharma, B.R. Availability, status and development and opportunities for augmentation of groundwater resources in India. Proceeding of the ICAR-IWMI Policy Dialogue on Ground Water Management, CSSRI, Karnal, India, 6–7 November 2001; pp. 1–18. [Google Scholar]
  56. Singh, R.; Kumar, S.; Nangare, D.D.; Meena, M.S. Drip irrigation and black polyethylene mulch influence on growth, yield and water use efficiency of tomato. Afr. J. Agric. Res. 1999, 4, 1427–1430. [Google Scholar]
  57. Ranjan, P.; Patle, G.T.; Prem, M.; Solanke, K.R. Organic mulching-a water saving technique to increase the production of fruits and vegetables. Curr. Agric. Res. J. 2017, 5, 371–380. [Google Scholar] [CrossRef]
  58. Kumar, S.D.; Lal, B.R. Effect of mulching on crop production under rainfed condition: A review. Int. J. Res. Chem. Environ. 2012, 2, 8–20. [Google Scholar]
  59. Ismail, S.M.; Ozawa, K.; Khondaker, N.A. Effect of irrigation frequency and timing on tomato yield, soil water dynamics and water use efficiency under drip irrigation. In Proceedings of the 11th International Water Technology Conference, Sharm El-Sheikh, Egypt, 15–18 March 2007; Volume 1, pp. 69–84. [Google Scholar]
  60. Imtiyaz, M.; Srivastava, S.K.; Alam, M.A. Yield and economic return of tomato as influenced by irrigation schedules and lateral spacing. In Proceedings of the 10th International Agricultural Engineering Conference, Role of Agricultural Engineering in Advent of Changing Global Landscape, Bangkok, Thailand, 7–10 December 2009; Asian Association for Agricultural Engineering: Bangkok, Thailand, 2009. [Google Scholar]
  61. Tagar, A.; Chandio, F.A.; Mari, I.A.; Wagan, B. Comparative study of drip and furrow irrigation methods at farmer’s field in Umarkot. World Acad. Sci. Eng. Technol. 2012, 6, 9–25. [Google Scholar]
  62. Klee, H.J.; Giovannoni, J.J. Genetics and control of tomato fruit ripening and quality attributes. Annu. Rev. Genet. 2011, 45, 41–59. [Google Scholar] [CrossRef] [PubMed]
  63. Haejin, B.; Seok Kyu, Y.; Ik Koo, Y.; Eun, Y.N.; Jung, H.K.; Ji Hae, J. Assessment of organic acid and sugar composition in apricot, plumcot, plum, and peach during fruit development. J. Appl. Bot. Food Qual. 2014, 87, 24–29. [Google Scholar]
  64. Kader, A.A. Flavour quality of fruits and vegetables. J. Sci. Food Agric. 2008, 88, 1863–1868. [Google Scholar] [CrossRef]
  65. Mitchell, J.P.; Shennan, C.; Grattan, S.R.; May, D.M. Tomato fruit yields and quality under water stress and salinity. J. Am. Soc. Hortic. Sci. 1991, 116, 215–221. [Google Scholar] [CrossRef] [Green Version]
  66. Guichard, S.; Gary, C.; Longuenesse, J.J.; Leonardi, C. Water fluxes and growth of greenhouse tomato fruits under summer conditions. Acta Horti. 1999, 507, 223–230. [Google Scholar] [CrossRef]
  67. Zegbe-Domiguze, J.A.; Behboudian, M.H.; Clothier, B.E. Partial root zone drying is a feasible option for irrigating processing tomatoes. Agric. Water Manag. 2004, 68, 195–206. [Google Scholar] [CrossRef]
  68. Chen, J.L.; Kang, S.Z.; Du, T.S.; Qiu, R.J.; Guo, P.; Chen, R.Q. Quantitative response of greenhouse tomato yield and quality to water deficit at different growth stages. Agric. Water Manag. 2013, 129, 152–162. [Google Scholar] [CrossRef]
  69. Kuscu, H.; Turhan, A.; Demir, A.O. The response of processing tomato to deficit irrigation at various phenological stages in a sub-humid environment. Agric. Water Manag. 2014, 133, 92–103. [Google Scholar] [CrossRef]
  70. Nahar, K.; Gretzmacher, R. Effect of water stress on nutrient uptake, yield and quality of tomato (Lycopersicon esculentum Mill.) under subtropical conditions. Die Bodenkult. 2002, 53, 45–51. [Google Scholar]
  71. Shao, G.; Wang, M.; Liu, N.; Yuan, M.; Kumar, P. Growth and comprehensive quality index of tomato under rain shelters in response to differant irrigation and drainage treatments. Sci. World J. 2014, 2014, 457937. [Google Scholar] [CrossRef] [PubMed]
  72. Kirkham, M.B. Water-use efficiency. In Encyclopedia of Soils in the Environment; Elsevier: Amsterdam, The Netherland, 2005; pp. 315–322. [Google Scholar]
  73. Fan, X.W.; Chi, B.L.; Jiao, X.Y.; Li, D.W.; Zhang, Z.P. Soil improvement and yield increment in salt-alkaline fields by straw mulch. Ganhan Diqu Nongye Yanjiu 1993, 11, 13–18. [Google Scholar]
  74. Yan-min, Y.; Xiao-jing, L.; Wei-qiang, L.; Cun-zhen, L. Effect of different mulch materials on winter wheat production in desalinized soil in Heilonggang region of North China. J. Zhejiang Univ. Sci. B 2006, 7, 858–867. [Google Scholar] [CrossRef] [Green Version]
  75. Zhang, H.; Xiong, Y.; Huang, G.; Xu, X.; Huang, Q. Effects of water stress on processing tomatoes yield, quality and water use efficiency with plastic mulched drip irrigation in sandy soil of the Hetao Irrigation District. Agric. Water Manag. 2017, 179, 205–214. [Google Scholar] [CrossRef]
  76. Tahjib-UI-Arif, M.; Sohag, A.A.M.; Afrin, S.; Bashar, K.K.; Afrin, T.; Mahamud, A.G.M.; Polash, M.A.S.; Hossain, M.; Sohel, M.; Taher, A.; et al. Differential response of sugar beet to long-term mild to severe salinity in a soil–pot culture. Agriculture 2019, 9, 223. [Google Scholar] [CrossRef] [Green Version]
  77. Shedeed, S.I.; Zaghloul, S.M.; Yassen, A.A. Effect of method and rate of fertilizer application under drip irrigation on yield and nutrient uptake by tomato. Ozean J. Appl. Sci. 2009, 2, 139–147. [Google Scholar]
  78. Wang, J.; Niu, W.; Zhang, M.; Li, Y. Effect of alternate partial root-zone drip irrigation on soil bacterial communities and tomato yield. Appl. Soil. Ecol. 2017, 119, 250–259. [Google Scholar] [CrossRef]
  79. Yan, P.; Shao, H.B.; Shao, C.; Chen, P.; Zhao, S.; Brestic, M.; Chen, X. Physiological adaptive mechanisms of plant grown in saline soil and implications for sustainable saline agriculture in coastal zone. Acta Physiol. Plant. 2013, 2867–2878. [Google Scholar] [CrossRef]
  80. Zhang, L.; Song, L.; Shao, H.B.; Shao, C.; Li, M.; Liu, M.; Brestic, M.; Xu, G. Spatial-temporal variation of rhizosphere soil microbial abundance and enzyme activities under different vegetation types in the coastal zone, Shandong, China. Plant. Biosyst. 2014, 148, 403–409. [Google Scholar] [CrossRef]
  81. Du, T.S.; Kang, S.Z.; Zhang, J.H.; Li, F.S.; Hu, X.T. Yield and physiological responses of cotton to partial root-zone irrigation in the oasis field of northwest China. Agric. Water Manag. 2006, 84, 41–52. [Google Scholar] [CrossRef]
Figure 1. Location map of the experimental site in a satellite view (images obtained from Google Maps). The figure is similar but not identical to the original image and, therefore, for illustrative purposes only.
Sustainability 12 06779 g001
Figure 2. Monthly variation in temperature and rainfall [A], and relative humidity and solar radiation [B] of the experimental site during winter season of 2016–17 and 2017–18.
Sustainability 12 06779 g002
Table 1. Physical-chemical properties of the experimental soil at the initial stage of the experiment (before starting the first year experiment).
ParameterSoil Depth (cm)MethodologyCitationEquipment Used
0–1515–3030–45
Physical Properties
Particle Size Distribution
Sand (%)25.724.622.7Hydrometer method[26]Hydrometer
Silt (%)28.729.029.5
Clay (%)22.729.547.8
Textural ClassClayClayClayTextural triangle[27]-
Bulk Density (g cm−3)1.471.451.43Soil Core Method[28]-
pH5.455.635.61(in 1:5 :: Soil: Water)[29]μ-processor based pH-EC-Ion meter
EC (dS m−1)0.560.730.83(in 1:5 :: Soil: Water)[29]
Chemical properties
Organic carbon (%)0.500.410.32Wet oxidation method[30]-
Available N (kg ha−1)535.20574.90583.70Hot alkaline KMnO4 Method[31]Kjeldahl apparatus
Available P (kg ha−1)14.3719.4328.960.5 M NaHCO3 extract[32]Spectrophotometer
Available K (kg ha−1)127.44150.52156.44Neutral N NH4OAc extract[33]Flame photometer
DTPA Extractable Zn (mg kg−1)2.011.711.48DTPA-TEA (pH 7.3) extraction[34]Atomic Absorption Spectrophotometer
DTPA Extractable Cu (mg kg−1)4.944.264.40DTPA extraction[34]
DTPA Extractable Fe (mg kg−1)25.3223.3024.28DTPA extraction[34]
DTPA Extractable Mn (mg kg−1)17.9619.2019.70DTPA extraction[34]
Available S (mg kg−1)51.8266.2536.20Turbidimetric method[35]Spectrophotometer
Available B (mg kg−1)0.340.540.51Hot water extraction[36]Spectrophotometer
Table 2. Details of the treatment.
TreatmentTreatment in Abbreviated from
Surface irrigation (at critical growth stages)Surface
Surface irrigation (at critical growth stages) + Straw MulchingSurface + Mulching
Drip irrigation at 100% ET0Drip 100% ET0
Drip irrigation at 80% ET0Drip 80% ET0
Drip irrigation at 80% ET0 + Straw MulchingDrip 80% ET0 + Mulching
Table 3. Effect of drip and surface irrigation on plant growth parameters of tomato.
TreatmentPlant Height (cm)Stem Diameter (mm)Number of Leaves Plant−1
45 DAT †75 DAT45 DAT75 DAT45 DAT75 DAT
Year
Year 176.47 a82.70 a5.354 a10.255 a314.6 a327.7 a
Year 277.45 a83.64 a5.214 b9.923 b315.9 a329.9 a
Irrigation treatment
Surface72.46 cd76.69 c4.980 e8.69 c285.9 d304.9 c
Surface + Mulching74.58 bc77.77 c5.176 d9.93 b286.5 d307.5 c
Drip 100% ET069.92 d88.46 b5.399 b10.80 a325.1 b335.5 b
Drip 80% ET077.01 b78.79 c5.285 c9.99 b307.1 c313.6 c
Drip 80% ET0 + Mulching90.83 a94.13 a5.581 a11.04 a371.4 a382.3 a
Source of Variation
Irrigation treatment************
YearNSNSNSNSNSNS
Year × Irrigation treatmentNSNSNSNSNSNS
DAT, Days after transplanting; NS, Non-significant; Year 1, 2016–17; Year 2, 2017–18; Values are the mean of four replicates of the sample on each treatment. ** indicates significant at p ≤ 0.01.; Means in a column with the same letter are not significantly different (p ≤ 0.05).
Table 4. Effect of drip and surface irrigation on yield and yield attributes of tomato.
TreatmentAverage Weight of Fruit (g fruit−1)Number of Fruits Plant−1Fruit Yield (t ha−1)Marketable Yield (t ha−1)
Year
Year 157.44 a35.88 a53.12 b49.67 a
Year 256.81 a21.72 a53.63 a51.68 a
Irrigation treatment
Surface48.46 d19.99 d43.37 d39.38 d
Surface + Mulching54.62 c27.36 c52.33 c48.55 c
Drip 100% ET061.32 b30.56 b56.51 b55.19 b
Drip 80% ET056.26 c29.60 bc53.00 c49.94 c
Drip 80% ET0 + Mulching64.96 a36.50 a61.67 a60.32 a
Source of variation
Irrigation treatment*******
YearNSNSNSNS
Year × Irrigation treatmentNSNSNSNS
Year 1, 2016–17; Year 2, 2017–18; Values are the mean of four replicates of the sample on each treatment; ** indicates significant at p ≤ 0.01; * indicates significant at p ≤ 0.05; Means in a column with the same letter are not significantly different (p ≤ 0.05).
Table 5. Effect of drip and surface irrigation on leaf macronutrient and chlorophyll content (mg g−1 of fresh weight) of tomato.
TreatmentLeaf Macronutrient Content (%)Leaf Chlorophyll Content (mg g−1) of Fresh Weight
Leaf N (%)Leaf P (%)Leaf K (%)Chlorophyll AChlorophyll BTotal Chlorophyll
Year
Year 12.75 a0.20 a3.11 a0.7124 a0.4383 a1.15 a
Year 22.69 b0.27 a3.22 a0.7117 a0.4251 a1.14 a
Irrigation treatment
Surface2.02 c0.205 a2.69 c0.4300 d0.1388 e0.569 d
Surface + Mulching2.62 b0.238 a2.84 c0.4738 d0.2846 d0.758 c
Drip 100% ET03.13 a0.243 a3.48 b0.8440 b0.4975 b1.296 b
Drip 80% ET02.71 b0.215 a2.92 c0.5537 c0.4088 c1.527 a
Drip 80% ET0 + Mulching3.18 a0.260 a3.86 a1.2588 a0.8288 a1.568 a
Source of variation
Irrigation treatment**NS*******
Year**NSNSNSNSNS
Year × Irrigation treatmentNSNSNSNSNS**
Year 1, 2016–17; Year 2, 2017–18; Values are the mean of four replicates of the sample on each treatment; ** indicates significant at p ≤ 0.01; * indicates significant at p ≤ 0.05; Means in a column with the same letter are not significantly different (p ≤ 0.05).
Table 6. Effect of drip and surface irrigation on physical quality parameters of tomato.
TreatmentFruit Length (mm)Fruit Breadth (mm)L:B RatioSpecific Gravity (g cm−3)Fruit Firmness (kg cm−2)Thickness of Pericarp (mm)Moisture (%)Number of Seeds Fruit−1
Year
Year 150.19 a43.34 a1.16 a1.117 a5.317 a6.338 a92.98 a64.81 a
Year 247.81 b42.43 a1.13 b1.052 b5.146 b6.213 b92.32 a64.50 a
Irrigation treatment
Surface45.25 d39.59 b1.144 a1.050 bc4.776 e5.429 e94.95 a61.74 c
Surface + Mulching50.31 ab43.76 a1.151 a1.133 a5.021 c6.492 c92.97 b67.14 ab
Drip 100% ET048.50 c44.64 a1.088 b1.008 c5.430 b6.682 b91.88 b64.46 bc
Drip 80% ET049.45 bc43.28 a1.144 a1.138 a4.917 d5.797 d92.74 b61.33 c
Drip 80% ET0 + Mulching51.48 a43.16 a1.193 a1.094 ab6.014 a6.977a90.71 c68.61 a
Source of variation
Irrigation treatment****************
Year**NS******NSNS
Year × Irrigation treatmentNSNSNSNSNSNSNSNS
Year 1, 2016–17; Year 2, 2017–18; Values are the mean of four replicates of the sample on each treatment; ** indicates significant at p ≤ 0.01; * indicates significant at p ≤ 0.05; Means in a column with the same letter are not significantly different (p ≤ 0.05).
Table 7. Effect of drip and surface irrigation on chemical quality parameters of tomato.
TreatmentpH of JuiceTSS (°Brix)Titratable Acidity (%)Lycopene Content (mg 100 g−1)Ascorbic Acid (mg 100 g−1)Reducing Sugar (%)Non-Reducing Sugar (%)Total Sugar (%)
Year
Year 13.9695 a4.801 a0.3818 a5.810 a20.006 a2.4175 a0.873 a3.2910 a
Year 23.8795 a4.651 a0.3525 a5.539 a19.431 a2.3150 a0.817 a3.0990 a
Irrigation treatment
Surface3.375 e4.076 e0.3057 e4.496 e16.76 e2.212 d0.633 d2.826 e
Surface + Mulching3.742 d4.749 c0.3357 d4.660 d18.05 d2.296 c0.731 c3.031 d
Drip 100% ET04.377 a4.952 b0.4254 a6.309 b21.16 b2.430 b0.913 b3.355 b
Drip 80% ET04.279 b4.587 d0.3995 b5.420 c19.97 c2.400 b0.848 b3.204 c
Drip 80% ET0 + Mulching3.849 c5.268 a0.3694 c7.490 a22.65 a2.493 a1.101 a3.559 a
Source of variation
Irrigation treatment****************
YearNSNSNSNSNSNSNSNS
Year × Irrigation treatmentNSNS*NSNSNSNS*
Year 1, 2016–17; Year 2, 2017–18; Values are the mean of four replicates of the sample on each treatment; ** indicates significant at p ≤ 0.01; * indicates significant at p ≤ 0.05; Means in a column with the same letter are not significantly different (p ≤ 0.05).
Table 8. Correlation between fruit chemical biochemical quality attributes of tomato (based on mean data of 2016–17 and 2017–18).
Fruit Chemical Quality AttributesTSS (°Brix)Titratable Acidity (%)Lycopene Content (mg 100 g−1)Ascorbic Acid (mg 100 g−1)Reducing Sugar (%)Non-Reducing Sugar (%)Total Sugar (%)
pH of juice0.523 *0.969 **0.464 *0.589 **0.666 **0.489 *0.606 **
TSS (oBrix) 0.543 *0.857 **0.850 **0.830 **0.847 **0.903 **
Titratable acidity (%) 0.541 *0.648 **0.682 **0.533 *0.640 **
Lycopene content (mg 100 g−1) 0.935 **0.859 **0.896 **0.947 **
Ascorbic acid (mg 100 g−1) 0.808 **0.922 **0.941 **
Reducing sugar (%) 0.721 **0.901 **
Non-reducing sugar (%) 0.950 **
* Indicates significant at p ≤ 0.05; ** Indicates significant at p ≤ 0.01.
Table 9. Effect of drip and surface irrigation on electrical conductivity (EC) and pH of post-harvest soil (after two years).
Irrigation Treatment0–15 cm15–30 cm30–45 cm
EC (dS m−1)pHEC (dS m−1)pHEC (dS m−1)pH
Surface3.61 a6.01 c3.78 a6.16 b4.42 a6.40 a
Surface + Mulching2.50 b6.01 c3.52 b6.28 a4.13 b6.26 b
Drip 100% ET02.48 b6.27 a3.50 b6.29 a3.90 c6.16 c
Drip 80% ET02.13 c6.03 c2.60 c6.04 c3.67 d6.16 c
Drip 80% ET0 + Mulching2.10 c6.14 b2.49 d6.27 a3.60 d6.26 b
Values are the mean of four replicates. Means in a column with different letters indicate significant differences at p < 0.05 (otherwise statistically at par).
Table 10. Characterization of post-harvest soils (depth-wise) as influenced by drip and surface irrigation (after two years).
Irrigation TreatmentOrganic Carbon (%)Available N (kg ha−1)Available P (kg ha−1)Available K (kg ha−1)
0–15 cm15–30 cm30–45 cm0–15 cm15–30 cm30–45 cm0–15 cm15–30 cm30–45 cm0–15 cm15–30 cm30–45 cm
Surface0.48 b0.39 c0.32429.70 d364.73 c308.88 d28.09 b24.49 a20.45 a75.18 c76.24 e113.7 c
Surface + Mulching0.53 a0.46 ab0.30432.17 d380.56 b368.35 a32.75 a27.10 a23.53 a87.86 b101.6 d135.5 a
Drip 100% ET00.52 a0.48 a0.31487.70 b364.40 c341.54 c28.16 b25.27 a22.44 a89.60 b113.3 b132.8 ab
Drip 80% ET00.52 a0.47 a0.36465.92 c378.20 b369.96 a32.55 a28.83 a24.20 a77.60 c106.0 c122.7 b
Drip 80% ET0 + Mulching0.53 a0.42 bc0.35501.90 a399.41 a355.92 b32.78 a29.29 a21.81 a98.70 a125.0 a125.6 b
Values are the mean of four replicates. Means in a column with different letters indicate significant differences at p < 0.05 (otherwise statistically at par).
Table 11. Microbial population at post-harvest soil (depth-wise) as influenced by drip and surface irrigation (after completion of the two years of experiment).
Irrigation TreatmentBacterial Population
(cfu/g of soil × 107)
Actinomycetes Population
(cfu/g of soil × 105)
Fungal Count
(cfu/g of soil × 103)
0–15 cm15–30 cm30–45 cm0–15 cm15–30 cm30–45 cm0–15 cm15–30 cm30–45 cm
Surface18.60 c18.88 e17.55 a57.25 d77.50 c56.25 c15.00 b52.50 a30.50 a
Surface + Mulching19.50 b19.50 d17.18 a66.00 c75.25 c66.75 ab20.00 b43.00 ab41.00 a
Drip 100% ET019.75 b20.28 c17.95 a74.25 b86.75 b62.50bc32.25 a35.00 b34.25 a
Drip 80% ET022.15 a20.78 a18.33 a76.50 b78.50 c66.25 ab29.25 a47.50 ab34.75 a
Drip 80% ET0 + Mulching22.53 a22.03 b18.15 a87.75 a113.00 a71.50 a37.25 a57.50 a27.75 a
Values are the mean of four replicates of the sample on each treatment. Means in a column with the same letter are not significantly different (p ≤ 0.05).
Table 12. Components of soil water balance, water use and water productivity of tomato under drip and surface irrigation systems.
Irrigation TreatmentProfile Contribution (mm)Irrigation (mm) †Effective Rainfall (mm)Total Water Use (mm)Water Productivity
(kg ha-mm−1) ††
Year 1Year 2Year 1Year 2Year 1Year 2Year 1Year 2Year 1Year 2
Surface2018.7300.00300.0056.262.50396.20408.20116.24105.46
Surface + Mulching18.918.00300.00300.0056.262.50395.10405.50129.88132.18
Drip 100% ET017.517.00295.08278.4356.262.50388.78377.93151.05142.04
Drip 80% ET017.917.80236.07222.7456.262.50330.17323.04153.04171.91
Drip 80% ET0 + Mulching17.416.23236.07222.7456.262.50329.67322.47186.38182.23
Before transplanting, 20 mm water was used by the tomato crop (at nursery bed); †† Water productivity (kg ha mm−1) was calculated based on the fruit yield of two years; Year 1, 2016–17; Year 2, 2017–18; The two-year fruit yield is presented in Supplementary Table S2.

