Article

Decisions in Power Supply Chain with Emission Reduction Effort of Coal-Fired Power Plant under the Power Market Reform

1
Management School, Jiangsu University, 301 Xuefu Road, Zhenjiang 212013, China
2
Department of Systems Design Engineering, University of Waterloo, Waterloo, ON N2L 3G1, Canada
*
Author to whom correspondence should be addressed.
Sustainability 2020, 12(16), 6582; https://doi.org/10.3390/su12166582
Submission received: 15 June 2020 / Revised: 28 July 2020 / Accepted: 29 July 2020 / Published: 14 August 2020
(This article belongs to the Section Energy Sustainability)

Abstract

:
Sustainability in power supply chain has been supported by emission reduction of coal-fired power generation and increasing renewable energy power generation. Under the power market reform of direct power purchase transactions, this paper focuses on the channel selection and emission reduction decisions of power supply chain. From the theoretical perspective, this paper develops the decision-making models of centralized and decentralized power supply chain, which consist of one renewable energy power generation enterprise, one coal-fired power plant and one power grid enterprise. The optimal strategies of power quantities and profits for power supply chain members and their corresponding numerical experiments are analyzed in different cases. The results show that there are q A 1 N c * < q A 1 L c * for renewable energy power generation enterprise A, q B 1 N c * > q B 1 L c * and e B N c * > e B L c * for coal-fired power plant B, which indicate that the direct power purchase channel in the centralized scenario is conducive to promoting the transaction quantity of renewable energy power generation, as well as the on-grid power quantity and emission reduction efforts of coal-fired power plant B. Furthermore, the profit of whole power supply chain could be enhanced by the increasing on-grid power preference coefficient of coal-fired power generation, subsidy for renewable energy power generation and preference coefficient for clean production, and by the decreasing emission reduction cost coefficient of coal-fired power plant. Additionally, the emission reduction effort of coal-fired power plant is positively relevant with preference coefficient for clean production, whereas it is negatively relevant with power grid wheeling charge, emission reduction cost coefficient and subsidy for renewable energy power generation. Our findings can provide useful managerial insights for policymakers and enterprises in the sustainability of power supply chain.

1. Introduction

Carbon emissions are closely related to energy consumption, especially of coal-fired power generation [1]. Driven by more and more energy demand, global energy-related CO2 emissions rose 1.7% to a historic high degree in 2018, among which the power sector accounted for nearly two-thirds of emissions growth, and mostly in coal-fired power plants. In particular, China, India and the United States accounted for 85% of the net increase in emissions [2]. Thus, to curb carbon emissions, governments have implemented multiple policies to promote renewable energy and curtail the continued rapid construction of coal-fired power plants [3]. For example, the National Energy Administration (NEA) of China canceled 103 coal-fired power plants in 2017, eliminating 120 gigawatts of future coal-fired power capacity. Although currently China has the world’s largest installed capacity of hydro, solar and wind power, its energy demands are so large due to its industry development that most of the power comes from coal, which accounted for 71% in 2018 [4]. Furthermore, it is confirmed that coal-fired power generation in which the main emission pollutants consist of particle matter, SO2 and NOx, is the culprit for the air pollution in China [5]. As environmental issues are becoming increasingly prominent, coal-fired power plants should take more focus on adopting low-emission and pollution control technologies to optimize production and meet pro-environmental requirement [6]. In fact, as long as structural adjustment, technological progress, energy conservation, and emission reduction are taken in the progress of coal-fired power generation, it can also be developed cleanly and sustainably [7]. However, these need a lot of costs to improve technologies and management. Thus, coal-fired power plants would require decisions on their efforts to balance the costs and return on pro-environmental investment.
To effectively solve ecological and environmental problems, reduce carbon emissions, and gradually replace coal and other fossil resources, the development of renewable energy is the key way; thus, governments have implemented multiple policies to promote renewable energy power generation [8]. Therefore, renewables accounted for a third of net increase in power generation in 2018. Especially for the world’s largest country in renewable energy power generation, China is also the largest contributor to renewables growth [9]. However, it also evokes some issues, such as the phenomenon of abandoning wind, sun, and water [10,11]. These are mainly due to the conflicts between the concentrated, large-scale construction of renewable energy power generation and limited local consumption, lacking in trans-regional market mechanism [12,13]. Besides this, renewable energy power generation are unable to ensure stable and continued power due to fluctuating generated power [14,15]. Thus, in practice more and more governments would give priority to coal-fired power generation to ensure the stable operation of power supply chain and optimize allocation of power resources and consumption of renewables through direct power purchase transaction by large power users [16].
The implementation of direct power purchase transaction by large power users would effectively promote the transformation of power market from a single power generation market to a bilateral market with the participation of the selling side, which could not only reduce the costs of large power users, but also provide a highly efficient selling channel for power generation enterprises except power grid enterprises [17]. Additionally, according to a new report on renewable power generation costs by the International Renewable Energy Agency (IRENA), the current costs of renewable power generation are declining fast, and the power pricing of renewables may be competitive in direct purchase transaction, which will influence the consumption of renewable energy power generation and the emission reduction efforts of coal-fired power plants. As thus, from the perspective of the sustainability in power supply chain, how to allocate the power quantity in direct purchase channel and traditional single-channel is particularly important for both coal-fired and renewable energy power enterprises.
To summarize, it is necessary to take both coal-fired and renewable energy power generation enterprise, and power grid enterprises as a whole power supply chain to make joint decisions of channel selections and emission reductions under the background of direct power purchase transaction reform and the sustainability of the power supply chain. Based on this, this paper focuses on the following questions:
(1)
What is the impact of direct power purchase transaction by large power users on the allocation of power resources and consumption of renewables in the power supply chain?
(2)
How to allocate the power quantity in direct purchase channel and traditional single-channel for both coal-fired and renewable energy power enterprises?
(3)
What are the influencing factors of coal-fired power plant’ decisions in its emission reduction effort?
(4)
How about the impact of subsidy, preference and cost coefficient on the power supply chain’s optimal decisions?
To address these questions, this paper conducted profit and emission reduction decision models under the scenarios of centralized and decentralized decision in traditional single-channel and dual-channel when considering direct power purchase transaction by large power users. It not only provided managerial insights on dual-channel power supply chain under the mechanism of direct power purchasing and the regulation of emission reduction by coal-fired power plants, but also helped to design the coordination contract to achieve the Pareto improvement of the decentralized and centralized decision-making in power supply chain. Based on these analyses, this paper can present suggestions for power supply chain members to improve their profits and environmental performance, and government to perfect the market-based mechanism and the sustainability for power supply chain. The contributions of this paper are:
Firstly, since the implementation of direct power purchase transaction by large power users would effectively promote the sustainability of power industry, this paper introduced direct purchase transaction in the dual-channel power supply chain for renewable energy power consumption and emission reduction of coal-fired power. Secondly, this paper studied the impact of competition between two manufacturers of one coal-fired power plant and one renewable energy power generation enterprise on their channel selection and emission reduction decisions, and found out the optimal strategies for them in different decision scenarios. Thirdly, strategies were proposed by analyzing the impacts of factors from policy, market and supply chain to achieve the Pareto improvement of profit and emission reduction effort in different scenarios of the power supply chain. It can not only inspire the coal-fired power plant’s initiative for clean production, but also promote the consumption of renewable energy power generation and the profit of whole power supply chain.
The remaining parts of this paper are organized as follows. Section 2 presents the literature review. In Section 3, the notations used in this paper are provided. Section 4 constructs models and derives the equilibrium solutions and discusses the results. In Section 5, this paper conducts numerical experiments and makes comparison analysis in different scenarios. This paper also provides impacts of parameters on decision variables variations in different scenarios. In Section 6, this paper provides concluding remarks and future research directions. In addition, all proofs of this paper are provided in Appendix A and Appendix B.

2. Literature Review

This research is closely related to two streams of literature: power supply chain management and dual-channel supply chain management.

2.1. Power Supply Chain Management

These researches on power supply chain management mostly include two types: one is the traditional power supply chain consisting of coal-fired power plants, power grid enterprises and large power users, and the other is the renewable power supply chain consisting of renewable energy power generation enterprises, power grid enterprises and large power users.
From the perspective of decision-making research under emission reduction about the traditional power supply chain, Khosrojerdi et al. proposed a power supply chain equilibrium model to find out how to enhance the reduction of carbon emission by calculating the power grid cost [18]. Ding et al. developed a model to investigate the opportunity of outsourcing a pollutant-reduction service to meet the environmental constraint and showed that the government’s incentive policy would motivate the collaboration between the service supply chain partners in coal-fired power generation [19]. Further, Zhao et al. focused on the influence of carbon footprint sensitivity coefficient of consumers, carbon emission quota and carbon emission reduction cost coefficient on the optimal decision-making and emission reduction effect of power supply chain members. Their research showed that power supply chain could promote profits by investing in carbon reduction technologies [20]. By considering the cap-and-trade regulation and the manufacturer’s two types of strategies: adopting green technology and purchasing carbon, Zhang et al. investigated the manufacturer’s production and emission abatement decisions under three supply chain power structures. They found that the innovation level of low-carbon technology was the best under the manufacturer-led model [21]. Based on the above analysis, models in this paper are characterized by introducing direct purchase transaction to the power supply chain which consist of large power users and two manufacturers including coal-fired power plant and renewable energy power generation enterprise, to achieve dual objectives of renewable energy power consumption and emission reduction of coal-fired power plant.
To improve operational efficiency of the traditional power supply chain, Oliverira et al. proposed a model of the supply chain in power market with multiple power generation plants and retailers when considering several market structures, and found that the two-part tariff was the best contract to reduce double marginalization and increase efficiency [22]. Similarly, Dou et al. discussed the impacts on the profits of the whole supply chain and members from the distribution of increased profits and adoption of the buyback strategy of power generation plants respectively. Their research showed that if the members could form a cooperative relationship, the power supply chain would realize the maximization in long-term profits [23]. Chen et al. examined the optimal social welfare problem in the power supply chain network with consideration to transmission power flows and constraints based on a mathematic model. However, in their model, each player tried to maximize its own profit and competed with others in a noncooperative manner [24]. Based on their results, this paper focuses on the operational efficiency of the power supply chain including coal-fired power plant and renewable energy power generation enterprise as manufacturers. This paper aims to contribute this stream of literature by considering the impact of policy factors (e.g., subsidy for renewable energy power generation and power grid wheeling charge), market factors (e.g., on-grid power preference coefficient of coal-fired power generation and preference coefficient for cleaner production), and supply chain factors (e.g., emission reduction cost coefficient of the coal-fired power plant) on the channel selection and emission reduction strategies.
In view of renewable power supply chain management, Nasiri and Zaccour considered the process of utilizing biomass for power generation as a game among the power supply chain, and they pointed out incentives and initial target on the Nash equilibrium [25]. Wu et al. discussed the impact of renewable energy policy on the profit and distribution of stakeholders in the renewable power supply chain. They found that government’s regulation policy of the price or quantity of renewable energy power generation could improve the benefits of the whole power supply chain, while it could not be reasonably distributed among the stakeholders [26]. In this aspect, Yuan et al. identified key stakeholders along the power supply chain and found that the de-motivation of power grid companies, incompatible technical codes of power grid operation, and neglected demand response were the key issues [27]. From the perspective of the whole power supply chain, Li et al. considered the power supply system including one power plant and two power grid enterprises, and predicted the joint ordering strategies of power and renewable energy certificates of two symmetrical power grid enterprises [28]. Memari et al. presented a multi-period bio-energy supply chain under carbon pricing and carbon trading policies. Their results showed that carbon pricing increased with the carbon tax linearly, whereas both cost increase and carbon emissions’ reductions had a relatively upward trend in the carbon trading scheme [29]. By contrast, this paper highlights a supply chain game model of one coal-fired power plant and one renewable energy power generation enterprise as manufacturers, and power grid enterprise as the retailer to maximize profits and emission reductions of the power supply chain. Other closely related studies can be seen from the reference of Hou et al. [30].

2.2. Dual-Channel Supply Chain Management

The literature on dual-channel supply chain management mainly include price competition and decision [31,32]. Dan et al. found that retail services strongly influence the manufacturer and the retailer’s pricing strategies when adopting a dual-channel [33]. Meanwhile, Batarfi et al. investigated the effect of adopting a dual-channel supply chain. They demonstrated that adding a customized-product online channel would increase the profit of the centralized supply chain system while evoking a conflict of the competition between the retail and online channels [34]. In the field of influence factors, He et al. found that products’ deterioration rate and quality dropping rate had significant impacts on inventory and pricing decisions for a dual-channel supply chain [35]. Feng et al. constructed a dual-channel supply chain of remanufactured and original products. They indicated that the price and demand of the original products could be lower under the remanufacturing subsidy policy, while the demand for original products would decrease with the price increase under the carbon tax policy [36]. Additionally, Nikunja and Peter examined a dual-channel supply chain under the mechanism of price and delivery-time dependent stochastic customer demand, and they highlighted that the demand uncertainty affected the optimal price and lead time of inventories [37]. Based on their results, this paper focuses on the effect of direct purchase transaction on power supply chain’s competition and decision. In addition, this paper also aims to make contributions by analyzing the impact of competition between two manufacturers on their channel selection strategies and the impact of policies in different scenarios.
Some researchers have considered emission reduction decisions in dual-channel supply chain. He et al. showed that a governmental tax on e-commerce could help reduce consumer free riding and total carbon emissions [38]. Ji et al. and Wang et al. focused on the emission reduction behaviors in both retail-channel and dual-channel cases using the Stackelberg game model. They presented that the joint emission reduction strategy was more profitable for both manufacturer and retailer with cap-and-trade regulation and consumers’ low-carbon preference [39,40]. Further, Yang et al. examined how non-perishable products’ and perishable products’ properties and consumers’ channel preference affected the manufacturer’s channel selection and emission reduction decisions [41]. Xu et al. considered the coordination of a dual-channel supply chain under mandatory carbon emission capacity regulation and proposed online channel price discount and offline channel price discount contracts to coordinate the supply chain [42]. Zhou and Ye developed a differential game model of joint emission reduction strategies and contract in a dual-channel supply chain, and they indicated that manufacturer’s profit and emission reduction effort were higher and retailer’s profit and advertising effort were lower in a dual channel supply chain than in a single channel supply chain [43]. The above studies considered cap-and-trade regulation and consumers’ channel and low-carbon preference in dual-channel supply chain’s emission reduction decisions, but the competition from other low-emission manufacturers was not analyzed.

3. Problem Assumptions and Notations

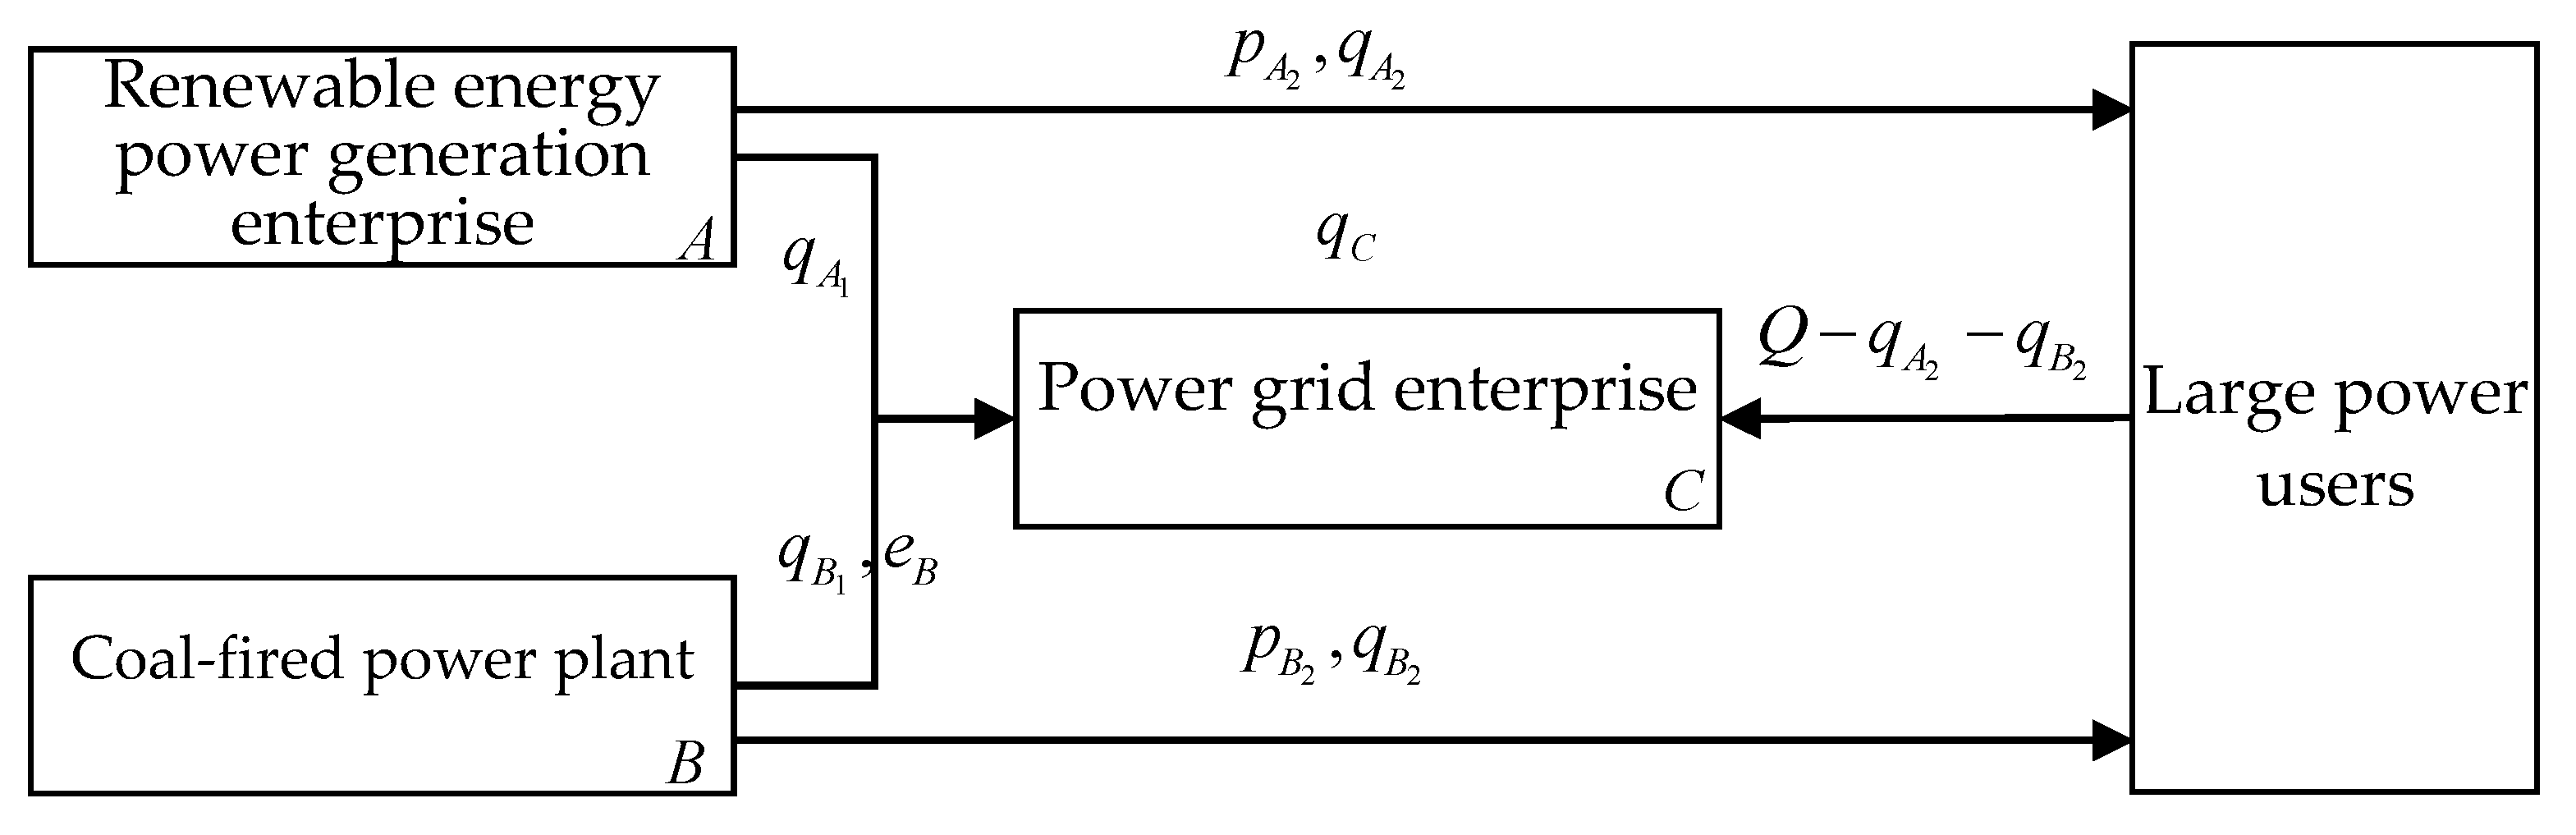
This paper considers a traditional single-channel and a dual-channel power supply chain respectively in the power market under the constraint of emission reduction including two upstream manufacturers which are renewable energy power generation enterprise and coal-fired power plant, as well as a downstream retailer which is power grid enterprise. Models in this paper address the issues of the power generation enterprises’ channel selection strategies and emission reduction decisions. Combining with the actual situation, this paper lists the following notations in Table 1 where A and B in subscripts are defined for the renewable energy power generation enterprise and coal-fired power plant, and C and S in subscript are defined for power grid enterprise and the whole supply chain respectively. Superscript L and N respectively represents the traditional power supply chain with single-channel and dual-channel power supply chain with direct power purchase, meanwhile superscript c and d respectively denotes centralized and decentralized decision-making scenario.
Other assumptions are presented as follows:
Assumption 1.
The unit cost of power generation and its pollution emission coefficient by the coal-fired power plant are certain under the current power generation technology.
Assumption 2.
The power network system is security and stable. Power generation enterprises have enough capacity to meet the power order quantity of power grid enterprise, meanwhile the power generation quantity is based on the fixed demand, which means there is no inventory and no response time of power.
Assumption 3.
The coal-fired power generation emit much pollution, thus, to balance the performance of economic and environmental, the coal-fired power generation plant must pay a certain environmental cost. Some measures such as technological innovation, equipment upgrading and carbon emission permits trading to reduce the total emission are taken to meet environmental performance requirement.
Assumption 4.
Due to the technological limitation, the cost of renewable energy power generation is often higher than that of coal-fired power generation. Hence, the average on-grid power price of nuclear power, biomass and photovoltaic power generation in developing countries is often higher than that of coal-fired power generation besides that of hydropower and wind power, which indicates that p A 1 > p B 1 .

4. Model Construction and Solution

This section derives the equilibrium solutions for each member and the whole power supply chain in four scenarios: centralized and decentralized decisions in the case of traditional single-channel power supply chain, centralized and decentralized decisions in the case of dual-channel power supply chain with direct power purchase transaction.

4.1. Model Solutions in Traditional Single-Channel Power Supply Chain

Assume that power generation enterprises A and B only distribute power to large power users through power grid enterprise C, which indicates that q A 1 + q B 1 = q C . To ensure the stability of power grid, the power supply is generally greater than demand of large power users, which means q C Q . The power grid enterprise C declares the power order quantity q C , and then power generation enterprises A and B decide their on-grid power quantity q A 1 and q B 1 , as well as emission reduction effort of B to maximize profits. Additionally, due to environmental regulations and incentives to reduce emissions for coal-fired power plant, q B 1 is not only determined by the preference of power grid enterprise C for coal-fired power generation, but also determined by their own emission reduction effort. Therefore, the on-grid power quantity of coal-fired power plant B is formulated as following:
q B 1 = θ q C + δ e B
The framework about traditional single-channel power supply chain is illustrated by Figure 1.
Based on the above demand function, the profits of A, B and C can be modeled as follows:
π A L = ( p A 1 c A + γ ) q A 1
π B L = ( p B 1 c B ) q B 1 1 2 η e B 2 ,   η [ 0 , 1 ]
π C L = p Q p A 1 q A 1 p B 1 q B 1 1 2 μ q C 2 + p r ( q C Q ) ,   μ [ 0 , 1 ]

4.1.1. Centralized Decision in Traditional Single-Channel Power Supply Chain

In the scenario of centralized decision with traditional single-channel power supply chain, power grid enterprise and two power generation enterprises form in a whole system. Each system member gives up its own interest to maximize the overall profit of traditional single-channel power supply chain, and then decides the order power quantity and emission reduction effort.
Then the overall profit function of traditional single-channel supply chain is as following:
π S L c = π A L + π B L + π C L = ( γ c A ) q A c B q B 1 2 η e B 2 + p Q 1 2 μ q C 2 + p r ( q C Q )
Lemma 1.
For the scenario of centralized decision with traditional single-channel power supply chain, there exist equilibrium solutions, where
q C L c * = p r + ( 1 θ ) ( γ c A ) θ c B μ ,
e B L c * = δ ( c A γ c B ) η ,
q A 1 L c * = ( 1 θ ) p r + ( 1 θ ) ( γ c A ) θ c B μ δ 2 ( c A γ c B ) η ,
q B 1 L c * = δ 2 ( c A γ c B ) η + θ p r + ( 1 θ ) ( γ c A ) θ c B μ .
As q C L c * > 0 and e B L c * > 0 , we can conclude that there should be p r + ( 1 θ ) ( γ c A ) θ c B > 0 and c A γ c B > 0 .
By substituting these optimal solutions into Equation (5), we can obtain the optimal overall profit of traditional single-channel supply chain:
π S L c * = ( p r + ( 1 θ ) ( γ c A ) θ c B ) 2 2 μ + δ 2 ( γ c A + c B ) 2 + 2 η Q ( p p r ) 2 η
Proof. 
Proofs of Lemma 1 are given in Appendix A.1. □

4.1.2. Decentralized Decision in Traditional Single-Channel Power Supply Chain

In the scenario of decentralized decision with traditional single-channel power supply chain, power grid enterprise and two power generation enterprises make decisions according to their own profit maximization.
Lemma 2.
For the scenario of decentralized decision with traditional single-channel power supply chain, the optimal decision maximizing profit of each member is obtained, where
q C L d * = p r p A 1 ( 1 θ ) θ p B 1 μ ,
e B L d * = δ ( p B 1 c B ) η ,
q A 1 L d * = ( 1 θ ) p r p A 1 ( 1 θ ) θ p B 1 μ δ 2 ( p B 1 c B ) η ,
q B 1 L d * = δ 2 ( p B 1 c B ) η + θ p r p A 1 ( 1 θ ) θ p B 1 μ .
Due to q C L d * > 0 and e B L d * > 0 , we can conclude that there are p r p A 1 ( 1 θ ) θ p B 1 > 0 and p B 1 c B > 0 .
By substituting these optimal solutions into Equations (2)–(4), we can obtain the optimal profit of each enterprise in traditional single-channel supply chain:
π A L d * = ( p A 1 c A + γ ) ( η ( 1 θ ) ( p r p A 1 ( 1 θ ) θ p B 1 ) μ δ 2 ( p B 1 c B ) ) μ η
π B L d * = δ 2 ( p B 1 c B ) 2 2 η + θ ( p B 1 c B ) ( p r p A 1 ( 1 θ ) θ p B 1 ) μ
π C L d * = Q ( p p r ) + ( p r p A 1 ( 1 θ ) θ p B 1 ) 2 2 μ + δ 2 ( p B 1 c B ) ( p A 1 p B 1 ) η
Proof. 
Proofs of Lemma 2 are given in Appendix A.2. □

4.2. Model Solutions in Dual-Channel Power Supply Chain

With reform of power market, power generation enterprises can not only distribute on-grid power quantity q A 1 and q B 1 to large power users through power grid enterprise with traditional single channel, where q A 1 + q B 1 = q C and q B 1 = θ q C + δ e B are met, but also can distribute power quantity q A 2 and q B 2 to large power users through direct purchase, where the trading price are denoted as p A 2 and p B 2 Followed by Xu [44], the trading price in direct purchase channel are formulated as follows:
{ p A 2 = a α A 2 q A 2 β B 2 q B 2 δ A 2 e B p B 2 = a α B 2 q B 2 β A 2 q A 2 + δ B 2 e B
where α A 2 and α B 2 are indicated as price elastic coefficient of its own supply, β B 2 and β A 2 are indicated as cross-price elastic coefficient of others. To simplify the calculation and analysis, we can assume that β A 1 = β B 1 = β A 2 = β B 2 = β > 0 . In general, there is α > β . Meanwhile, δ A 2 and δ B 2 are indicated as preference coefficient for cleaner production of coal-fired power plant B in power market, and then we can also assume that δ A 2 = δ B 2 = δ > 0 .
The framework about dual-channel power supply chain is illustrated by Figure 2.
Based on the above analysis, large power users not only have certain propensity of two channels respectively but also have preference on emission reduction effort of coal-fired power plant. In the dual-channel power supply chain, large power users should decide which channel to order from and accordingly how much is the order’s quantity. However, the power demand of large power users is fixed, which is denoted as Q , as such these two power generation enterprises and power grid enterprise become competitors and cooperators.
Based on the above demand function, the profits of A, B and C in dual-channel power supply chain can be modeled as follows:
π A N = p A 1 q A 1 + ( p A 2 ψ ) q A 2 + ( γ c A ) ( q A 1 + q A 2 )
π B N = p B 1 q B 1 + ( p B 2 ψ ) q B 2 c B ( q B 1 + q B 2 ) 1 2 η e B 2
π C N = p ( Q q A 2 q B 2 ) p A 1 q A 1 p B 1 q B 1 + ( ψ c 0 ) ( q A 2 + q B 2 ) 1 2 μ q C 2 + p r ( q C ( Q q A 2 q B 2 ) )

4.2.1. Centralized Decision in Dual-Channel Power Supply Chain

In the scenario of centralized decision with dual-channel power supply chain, the overall profit function is as following:
π S N c = p A 2 q A 2 + ( γ c A ) ( q A 1 + q A 2 ) + p B 2 q B 2 c B ( q B 1 + q B 2 ) 1 2 η e B 2 + p Q ( p + c 0 p r ) ( q A 2 + q B 2 ) 1 2 μ q C 2 + p r ( q C Q )
Lemma 3.
For the scenario of centralized decision-making with dual-channel power supply chain, there exist equilibrium solutions, where
q C N c * = p r + ( γ c A ) ( 1 θ ) θ c B μ ,
e B N c * = δ ( 1 + 2 ( α β ) ) ( γ c A + c B ) 2 ( δ 2 η ( α β ) ) ,
q B 1 N c * = θ p r + ( γ c A ) ( 1 θ ) θ c B μ + δ 2 ( 1 + 2 ( α β ) ) ( γ c A + c B ) 2 ( δ 2 η ( α β ) ) ,
q A 1 N c * = ( 1 θ ) p r + ( γ c A ) ( 1 θ ) θ c B μ δ 2 ( 1 + 2 ( α β ) ) ( γ c A + c B ) 2 ( δ 2 η ( α β ) ) ,
q A 2 N c * = a c 0 p + p r c B 2 ( α + β ) + ( 2 α η δ 2 + 2 δ 2 ( α + β ) ) ( c A γ c B ) 4 ( α + β ) ( δ 2 η ( α β ) ) ,
q B 2 N c * = a c 0 p + p r c B 2 ( α + β ) ( 2 β η + δ 2 + 2 δ 2 ( α + β ) ) ( c A γ c B ) 4 ( α + β ) ( δ 2 η ( α β ) ) .
Due to e B N c * > 0 , α > β and c A γ c B > 0 , we can conclude that there should be δ 2 η ( α β ) < 0 .
By substituting these optimal solutions into Equation (14), we can obtain the optimal overall profit of dual-channel supply chain:
π S N c * = ( a p c 0 + p r + γ c A α q A 2 N c * β q B 2 N c * δ e B N c * ) q A 2 N c * + ( γ c A ) ( ( 1 θ ) q C N c * δ e B N c * ) + ( a p c 0 + p r c B α q B 2 N c * β A 2 q A 2 N c * + δ e B N c * ) q B 2 N c * c B ( θ q C N c * + δ e B N c * ) 1 2 η ( e B N c * ) 2 + p Q 1 2 μ ( q C N c * ) 2 + p r ( q C N c * Q )
Proof. 
Proofs of Lemma 3 are given in Appendix A.3. □

4.2.2. Decentralized Decision in Dual-Channel Power Supply Chain

Lemma 4.
For the scenario of decentralized decision with dual-channel power supply chain, the optimal decision maximizing profit of each member is obtained, where
q C N d * = p r p A 1 ( 1 θ ) θ p B 1 μ ,
e B N d * = 2 E δ ( B + 2 α D ) + β δ 3 ( A + B + ( 2 α + β ) D β C ) β δ η ( 2 α A β B ) 2 E ( 2 α η δ 2 ) ,
q A 2 N d * = δ 2 ( A B ( 2 α + β ) D + β C ) + 2 α η A β η B 2 E ,
q B 2 N d * = η B + δ 2 D 2 α η δ 2 + η β δ 2 ( A + B + ( 2 α + β ) D β C ) η 2 β ( 2 α A β B ) 2 E ( 2 α η δ 2 ) ,
q A 1 N d * = ( 1 θ ) p r p A 1 ( 1 θ ) θ p B 1 μ δ 2 E δ ( B + 2 α D ) + β δ 3 ( A + B + ( 2 α + β ) D β C ) β δ η ( 2 α A β B ) 2 E ( 2 α η δ 2 )
q B 1 N d * = θ p r p A 1 ( 1 θ ) θ p B 1 μ + δ 2 E δ ( B + 2 α D ) + β δ 3 ( A + B + ( 2 α + β ) D β C ) β δ η ( 2 α A β B ) 2 E ( 2 α η δ 2 ) .
By substituting these optimal solutions into Equations (11)–(13), we can obtain the optimal profit of each member in dual-channel supply chain:
π A N d * = ( p A 1 + γ c A ) ( ( 1 θ ) q C N d * δ e B N d * ) + ( a ψ + γ c A α q A 2 N d * β q B 2 N d * δ e B N d * ) q A 2 N d * ,
π B N d * = ( p B 1 c B ) ( θ q C N d * + δ e B N d * ) + ( a ψ c B α q B 2 N d * β q A 2 N d * + δ e B N d * ) q B 2 N d * 1 2 η ( e B N d * ) 2 ,
π C N d * = p Q p A 1 ( ( 1 θ ) q C N d * δ e B N d * ) p B 1 ( θ q C N d * + δ e B N d * ) + ( p r + ψ c 0 p ) ( q A 2 N d * + q B 2 N d * ) 1 2 μ ( q C N d * ) 2 + p r ( q C N d * Q ) )
Proof. 
Proofs of Lemma 4 are given in Appendix A.4. □

5. Model Discussions

In this section, we take comparisons in different decision scenarios and different channel power supply chains to find the optimal strategies for each member and the whole power supply chain.

5.1. On-grid Power Strategy

In traditional single-channel power supply chain, renewable energy power generation enterprise A and coal-fired power plant B are competitors in terms of on-grid power. To increase the market share of renewable energy power generation, the best response interval of preference coefficient of power grid enterprise C for coal-fired power generation is given in the following proposition.
Proposition 1.
In traditional single-channel power supply chain, there should be:
(1) 
q B 1 L c * < q A 1 L c * , if the condition θ ( η ( 3 c A c B 2 p r 3 r ) η ( η ( c A + c B 2 p r r ) 2 16 μ δ 2 ( c B c A + r ) 2 4 η ( c A c B r ) , η ( 3 c A c B 2 p r 3 r ) + η ( η ( c A + c B 2 p r r ) 2 16 μ δ 2 ( c B c A + r ) 2 4 η ( c A c B r ) ) is meet, or else q B 1 L c * > q A 1 L c * ;
(2) 
q B 1 L d * < q A 1 L d * , if the condition θ ( η ( 3 p A 1 p B 1 2 p r ) η ( η ( p A 1 + p B 1 2 p r ) 2 16 μ δ 2 ( p B 1 c B ) ( p A 1 p B 1 ) 4 η ( p A 1 p B 1 ) , η ( 3 p A 1 p B 1 2 p r ) + η ( η ( p A 1 + p B 1 2 p r ) 2 16 μ δ 2 ( p B 1 c B ) ( p A 1 p B 1 ) 4 η ( p A 1 p B 1 ) ) is meet, or else q B 1 L d * > q A 1 L d * .
Proof. 
Proofs of Proposition 1 are given in Appendix B.1. □
Proposition 1 shows that the required conditions of θ when the on-grid power of renewable energy power generation enterprise A is greater than that of coal-fired power plant B in traditional single-channel power supply chain. In other words, by adjusting the preference of power grid enterprise C for coal-fired power generation, the dilemma of insufficient consumption of renewable energy in the traditional single-channel power supply chain can be solved. The dilemma of the shortness in on-grid power of renewable energy is mainly due to its immature power generation and transmission technology and intermittent output when compared with coal-fired power generation.
To examine the impact of opening direct power purchase channel on the on-grid power quantity of renewable energy power generation enterprise A and coal-fired power plant B under centralized decision, comparisons between single-channel power supply chain and dual-channel power supply chain are made, and the following proposition is obtained.
Proposition 2.
(1) 
For renewable energy power generation enterprise A: q A 1 N c * < q A 1 L c * ;
(2) 
For coal-fired power plant B: q B 1 N c * > q B 1 L c * .
Proof. 
Proofs of Proposition 2 are given in Appendix B.2. □
From Proposition 2(1) we can know that, under centralized decision-making, the on-grid power quantity of renewable energy power generation enterprise A will decrease with the development of dual-channel compared with traditional single-channel. This is mainly due to the development of direct purchase channel has increased power transactions between renewable energy power generation enterprise A and large power users. In other words, direct purchase channel is beneficial to promoting power consumption from renewable sources, which is consistent with previous research [45,46].
However, Proposition 2(2) shows that the on-grid power quantity of coal-fired power plant B will increase with the development of dual-channel under centralized decision. This is mainly because of the key role of coal-fired power plant in ensuring the power market and the core position of power grid enterprise in current power market [47]. As power grid enterprise not only supplies power to large power users, it also supplies power to other power users in the market.

5.2. Direct Purchase Transaction Power Strategy

Proposition 3.
In the case of centralized decision, there is q B 2 N c > q A 2 N c , which indicates that the power quantity purchased from coal-fired power plant B in centralized direct channel is greater than that of renewable energy power generation enterprise A.
Proof. 
Proofs of Proposition 4 are given in Appendix B.3. □
Proposition 3 shows that in the case of centralized decision, the proportion of coal-fired power generation is greater than that of renewable energy power generation in the direct purchase power transaction by large power users. This is because of the stability and continuity of coal-fired power generation and its low cost, coal-fired power plant remains competitive in the direct power purchase market with large power users [48], which means large power users are more inclined to transact with coal-fired power plant.

5.3. Emission Reduction Effort’ Strategy

To find which strategy is beneficial to improving emission reduction effort of coal-fired power plant, this paper takes comparisons between traditional single-channel and dual-channel power supply chain in centralized decision scenario, as well as comparisons between decentralized and centralized decision scenario in traditional single-channel power supply chain, then obtain the following proposition.
Proposition 4.
For coal-fired power plant B:
(1) 
e B N c * > e B L c * ;
(2) 
e B L c * > e B L d * if c A γ p B 1 > 0 .
Proof. 
Proofs of Proposition 3 are given in Appendix B.4. □
Proposition 4(1) indicates that in the scenario of centralized decision, dual-channel power supply chain is more conducive to improving emission reduction efforts of coal-fired power plant than traditional single-channel, which is also supported by other researches [49,50]. To some extent, this is because the preference for emission reduction effort of direct-purchase channel from large power users in power supply chain has enhanced emission reduction effort of coal-fired power plant.
Moreover, Proposition 4(2) shows that centralized decision in traditional single-channel is more effective to encourage emission reduction effort of coal-fired power plant than decentralized decision when c A γ p B 1 > 0 . In other words, if the condition c A γ > p B 1 is satisfied, in which c A γ is denoted as subsidized power generation cost of renewable energy power generation enterprise A, the optimal strategy to encourage emission reduction effort of coal-fired power plant should be made in centralized decision scenario. Therefore, how coal-fired power plant B decides emission reduction effort in centralized traditional single-channel depends on the on-grid power price of coal-fired power plant B, which should be lower than the subsidized power generation cost of renewable energy power generation enterprise A.

5.4. Overall Profit’ Strategy

Since the profit function in decentralized decision is too complicated to calculate, this paper will take its analysis in numerical examples. In this section, comparisons with traditional single-channel and dual-channel power supply chain in centralized decision-making scenario are made to find out which strategy is optimal for overall profit. The following proposition is obtained.
Proposition 5.
In the case of centralized decision, the overall profit of dual-channel power supply chain is greater than that of traditional single-channel power supply chain, which indicates that π S N c * > π S L c * .
Proof. 
Proofs of Proposition 4 are given in Appendix B.5. □
As Proposition 5 shows that renewable energy power generation enterprise A and coal-fired power plant B’s participating in direct power purchase transactions by large power users is conducive to improve overall profit of the power supply chain under centralized decision scenario, which is also confirmed in other dual-channel supply chain management [51]. In other words, Proposition 5 indicates that direct power purchase transactions between power generation enterprises and large power users is more effective than traditional single-channel in the scenario of centralized decision.

6. Numerical Analysis

This section presents numerical analysis of above theoretical results and explores the differences between different scenarios to explain some managerial insights. Based on the China power yearbook of 2018 and relevant policies, the values of model parameters are set as following: c A = 486 , c B = 281 , c 0 = 100 , p A 1 = 535.64 , p B 1 = 377.22 , p = 622.6 , p r = 519.56 , Q = 300000 , α = 0.8 , β = 0.1 , θ = 0.7 , δ = 0.2 , ψ = 160 , γ = 100 , η = 2 , μ = 0.0001 , a = 656 .

6.1. Decisions and Profits in Different Scenarios

According to the results in Table 2, the optimal decisions and profits in different scenarios are obtained and compared.
Table 2 shows that when θ = 0.7 , there should be q B 1 L c * > q A 1 L c * and q B 1 L d * > q A 1 L d * , which supports Proposition 1. Meanwhile, q A 1 N c * < q A 1 L c * and q B 1 N c * > q B 1 L c * can be also found in Table 2, which corresponds with Proposition 2. Additionally, when compared with decentralized decision scenario, centralized decision scenario can significantly improve the overall profit of the power supply chain, while the emission reduction effort of coal-fired power plant B would be reduced, which is consistent with Proposition 3. Comparing with traditional single-channel power supply chain, the dual-channel power supply chain in which power generation enterprises participate in direct power purchase transactions with large power users is conducive to significantly improve the emission reduction effort of coal-fired power plant B, which is consistent with Propositions 3 and 4, and efficiently enhance the profits of each member and whole power supply chain.

6.2. Impact of Policy Factors

This subsection presents the impact of policy factors including power grid wheeling charge and subsidy to renewable energy power generation on the optimal profits of each member and whole power supply chain, as well as emission reduction effort of coal-fired power plant B and the power quantity purchased in direct and indirect channel from power generation enterprises.

6.2.1. Impact of ψ on the Optimal Results

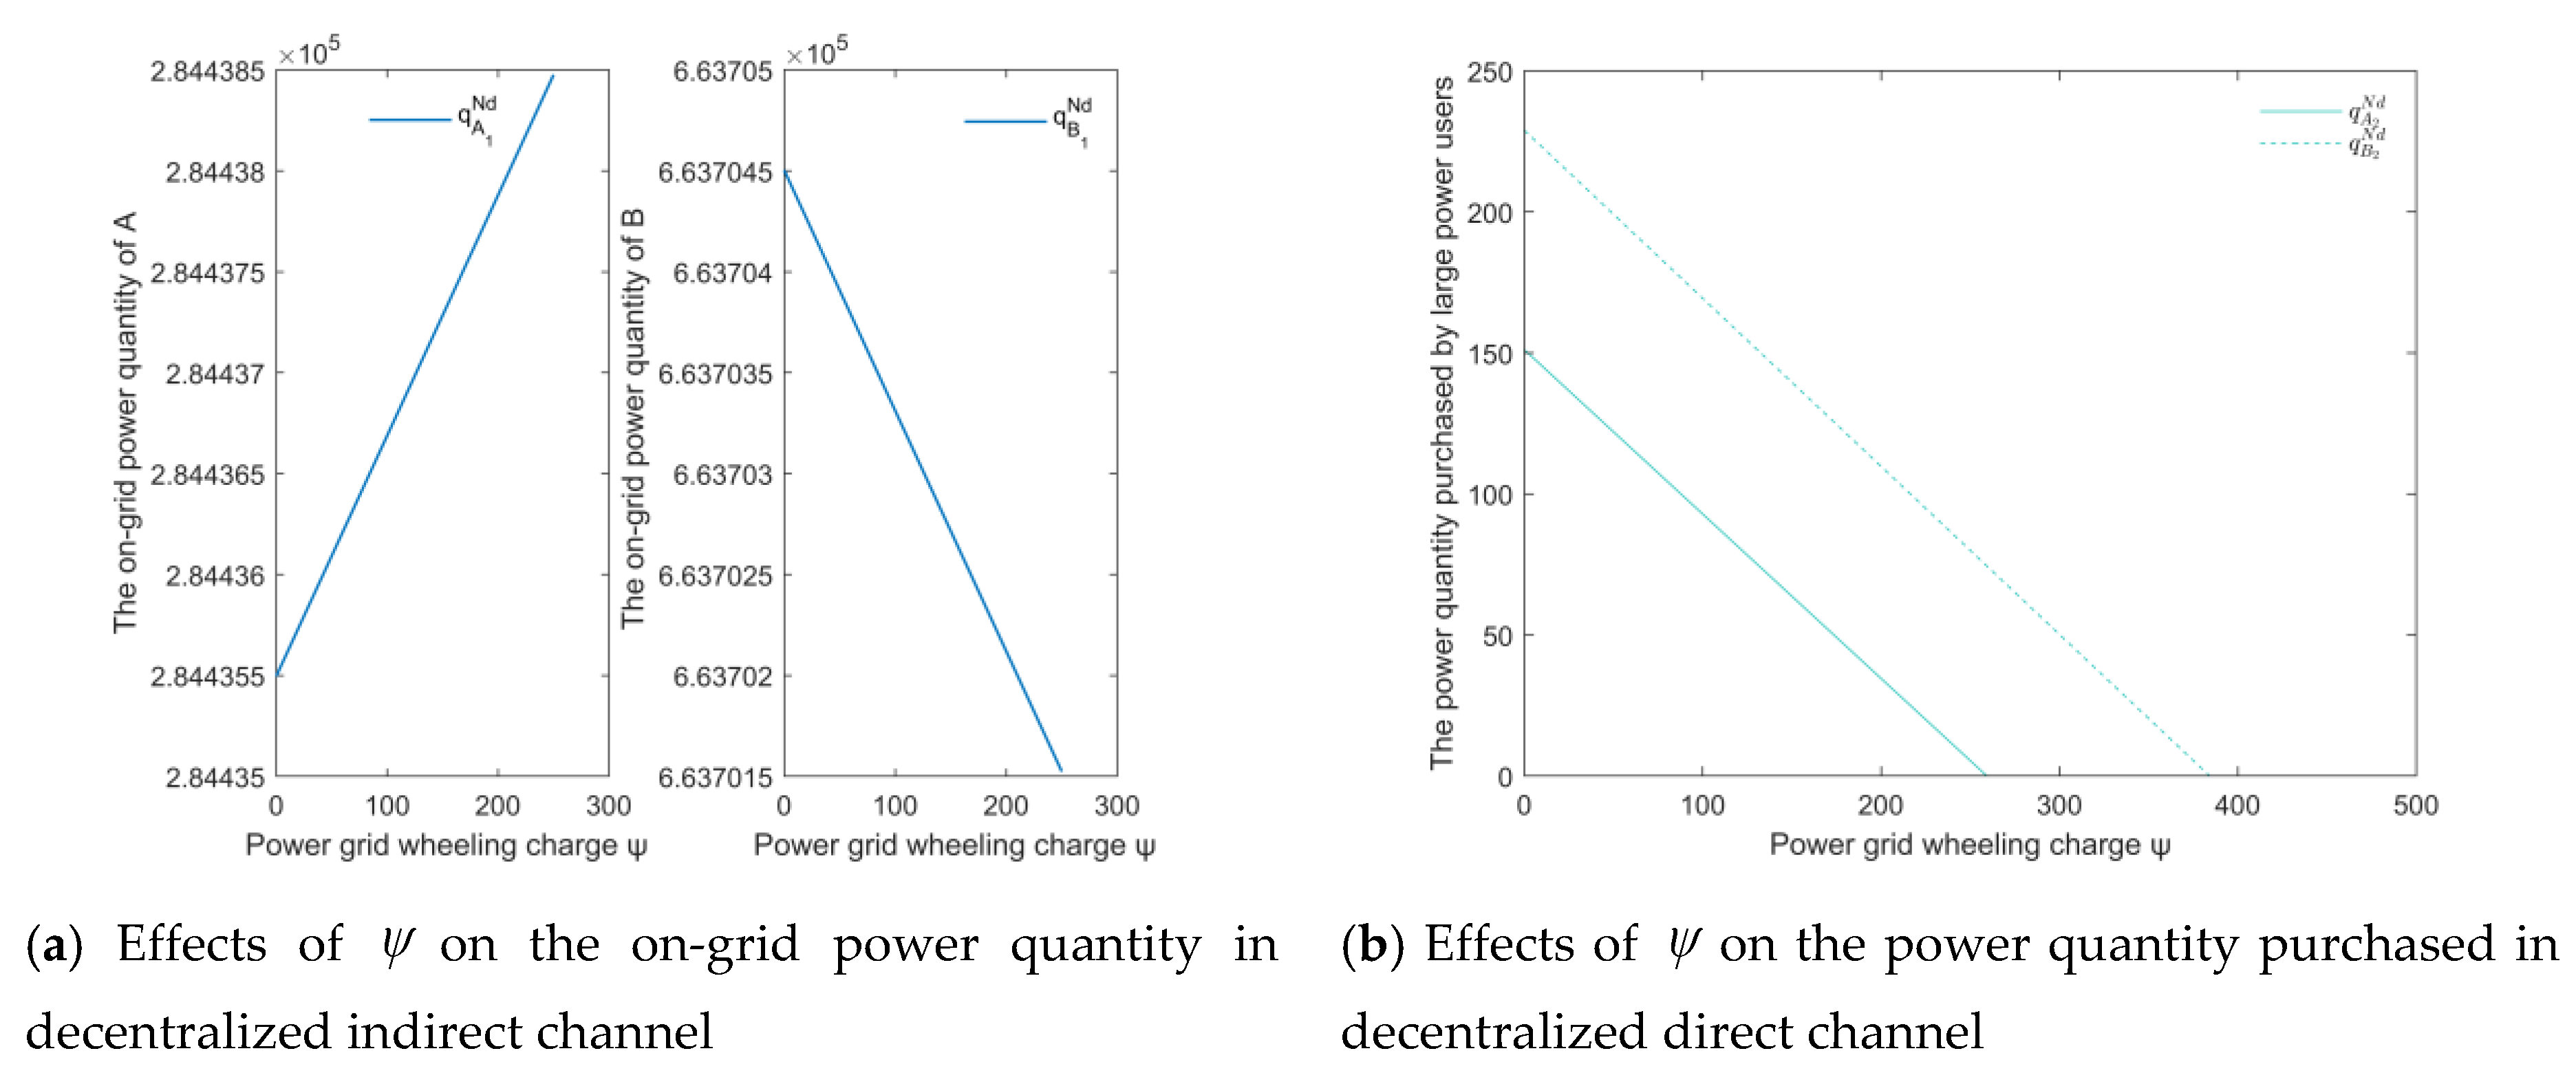
Power generation enterprises’ participation in the direct power purchase transactions with large power users will erode the market share of power grid enterprise, accordingly its profit would be reduced. To reduce the loss, power grid enterprise would charge power grid wheeling charge from power generation enterprises for the direct power purchase transactions with large power users. In other words, power grid wheeling charge is equivalent to the opening cost of direct power purchase channel for power generation enterprises. Therefore, the value of power grid wheeling charge is particularly important for the optimal result of power supply chain. Based on the above analysis, power grid wheeling charge is only expected to affect the optimal results in the decentralized dual-channel scenario, in which the results are illustrated in Figure 3a–f.
As seen in Figure 3a–c, in the scenario of decentralized dual-channel power supply chain, the on-grid power quantity q A 1 and q B 1 show distinctly opposite trend with power grid wheeling change ψ . Meanwhile, the power quantity q A 2 and q B 2 which are purchased separately from power generation enterprise A and B in direct channel by large power users, as well as e B which refers to emission reduction effort of coal-fired power plant B will decrease with the increase of power grid wheeling charge ψ if q A 2 > 0 and q B 2 > 0 are met, when ψ < 259.3341 is required. This is because the operation cost of power generation enterprise A and B is increasing. Meanwhile, there is ψ A 2 N d < ψ B 2 N d when q A 2 N d = 0 and q B 2 N d = 0 , which means the maximum power grid wheeling charge accepted by coal-fired power plant B is higher than that of renewable energy power generation enterprise A in the scenario of decentralized dual-channel power supply chain. This is mainly because the coal-fired power generation technology is mature with lower cost when compared with mostly renewable energy power generation.
Figure 3d–f depicts the curve of optimal profit for each member in decentralized power supply chain with respect to power grid wheeling charge, respectively. Obviously, in the scenario of decentralized dual-channel power supply chain, as power grid wheeling charge increases, the optimal profit of power generation enterprise A and B will decrease, while the optimal profit of power grid enterprise C will increase. Moreover, the profit of each member in decentralized dual-channel power supply chain is more than that in decentralized single-channel power supply chain, when 200.6266 < ψ < 226.85 is satisfied. In addition, it can be found from Figure 3g that the whole profit of power supply chain would increase firstly and then decrease with the increase of ψ . Thus, it is suggested that the government could mobilize the initiative of members’ joining in direct power purchase transactions in decentralized power supply chain by setting a reasonable value of power grid wheeling charge ψ .
Furtherly, it can be concluded from the above analysis that there is no effect of ψ on q C and other decision parameters in the scenario of centralized dual-channel power supply chain.

6.2.2. Impact of γ on the Optimal Results

The rapid development of China’s renewable energy power generation industry is mostly related with the subsidy from government; however, the massive installed scale of renewable energy power generation also caused a large gap in subsidies funding and insufficient consumption of huge renewable energy power. These indicate that the government should establish a rational subsidy standard of renewable energy power generation. Thus, the impact of γ on the optimal results are illustrated in Figure 4a–f.
Figure 4a illustrates that the on-grid power quantity of q A 1 and q B 1 will both increase with increase of the subsidy of renewable energy power generation γ in the centralized scenarios. However, q A 1 and q B 1 show different variation trend with the impact of γ in the scenario of decentralized dual-channel. Additionally, Figure 4b,c show that when 61.8718 < γ < 205 is met, the power quantity purchased from renewable energy power generation enterprise A will increase with increase of γ , while it is conversely found on the power quantity purchased from coal-fired power plant B. Furthermore, in addition to the traditional decentralized single-channel power supply chain, in which e B is irrelevant to γ , the emission reduction effort of coal-fired power plant B will decrease by increase of γ .
Figure 4d,g illustrate that the subsidy of renewable energy power generation can effectively motivate renewable energy power generation enterprise A and the whole power supply chain. The high degree is γ , the higher profits are of renewable energy power generation enterprise A and the whole power supply chain. However, it can be concluded from Figure 4d,g that the profits of coal-fired power plant B and power grid enterprise C are both negatively correlated with the subsidy of renewable energy power generation in dual-channel power supply chain, while these are irrelevant in traditional single-channel power supply chain. Thus, the subsidy of renewable energy power generation is important to the development of renewable energy power generation and the profit of the whole power supply chain.
From Figure 4d,e,g, when γ is fixed, the profits of power generation enterprise A, B and the whole power supply chain in dual-channel are greater than that in traditional single-channel. Conversely, it can be found from Figure 4f that the profit of power grid enterprise C in dual-channel is lower than that in traditional single-channel when γ is fixed. As such, despite of some advantages, the subsidy policy of renewable energy power generation should be adopted in conjunction with other incentives to enhance the efficacy of the whole power supply chain and each member.
Moreover, it can be also concluded from the above analysis that there is no effect of γ on q A 1 and q B 1 in the scenario of decentralized single-channel. As there are q C L c * / γ = ( 1 θ ) / μ > 0 , q C L d * / γ = 0 , q C N c * / γ = ( 1 θ ) / μ > 0 , and q C N d * / γ = 0 , then we can conclude that q C will increase with the increasing of θ in centralized scenarios while have no variations in decentralized scenarios.

6.2.3. Impact of θ on the Optimal Results

In recent years, with the huge support of policies, the installed capacity of renewable energy power generation in China has been greatly improved. However, the consumption of renewable energy power lags far behind its production due to the intermittent and volatile disadvantage of renewable energy when compared with traditional coal-fired power generation. Although the direct channel of power transaction has enhanced its consumption, the indirect channel of on-grid power is still the main way for the consumption of renewable energy power. Therefore, the impact of on-grid power preference coefficient of coal-fired power generation on power generation enterprise A and B’s on-grid power are shown in Figure 5a,b.
As seen in Figure 5a,b, the on-grid power quantity of coal-fired power plant B increases with increase of θ in different scenarios. However, it is shown that the on-grid power quantity of renewable energy power generation enterprise A decreases with increase of θ  in centralized scenarios of traditional single-channel and dual-channel, while in decentralized scenarios it will increase firstly and then decrease by θ = 0.5 . In the cases of centralized scenario, when θ < 0.5  is satisfied, which means power grid enterprise C has no significant preference for coal-fired power plant B, the on-grid power quantity of renewable energy power generation enterprise A will be greater than that of coal-fired power plant B. Meanwhile, in the case of decentralized scenario, when 0.1055 < θ < 0.5 is satisfied, the on-grid power quantity of renewable energy power generation enterprise A is larger than that of coal-fired power plant B.
Figure 5d–f exhibit that the profit of coal-fired power plant B, power grid enterprise C and the whole power supply chain will increase as on-grid power preference coefficient of coal-fired power generation increases in both traditional single-channel and dual-channel power supply chain. However, Figure 5c illustrates that the profit of renewable energy power generation enterprise A will increase firstly and then decrease with the increase of θ. In addition, although the difference of respective profit for each member and whole power supply chain between traditional single-channel and dual-channel power supply chain is small, it can be concluded that opening of direct power purchase channel is conducive to improving the profit for each member and the whole power supply chain.
Furthermore, based on the above equations and analysis, it can be concluded that θ is irrelevant with q A 2 N c * , q B 2 N c * , q A 2 N d * , q B 2 N d * , e B N c * and e B N d * in the direct channel of power supply chain. As there are q C L c * θ = c A c B γ μ > 0 , q C L d * θ = p A 1 p B 1 μ > 0 , q C N c * θ = c A c B γ μ > 0 , q C N d * θ = p A 1 p B 1 μ > 0 , then we can conclude that q C will increase with the increase of θ in different scenarios.

6.2.4. Impact of δ on the Optimal Results

With the increasingly serious problems of environmental pollution and climate change, the pro-environmental awareness of publics is constantly enhanced, and the preference of power market for clean production is increasing. The impacts of preference for cleaner production of coal-fired power plant B in power market on the optimal decisions are illustrated in Figure 6a–g.
Figure 6a depicts that q A 1 will decrease with the increase of δ in each scenario, while will show the opposite trend. As seen in Figure 6b,c, the emission reduction effort and power quantity purchased in direct channel from coal-fired power plant B in centralized and decentralized scenarios will increase with the increase of δ , when δ < 0.5831 is required to ensure the decision variables are greater than 0. Moreover, it can be concluded from Figure 6c that, the preference for clean production of coal-fired power plant B in power market can more effectively motivate coal-fired power plant B to enhance its emission reduction effort in the dual-channel power supply chain than that in traditional single-channel power supply chain. This is mainly due to the increased profit of coal-fired power plant B in the dual-channel power supply chain that can enable it to invest more funds in emission reduction. On the contrary, the power quantity purchased in direct channel from renewable energy power generation enterprise A in centralized and decentralized scenarios will decrease with the increase of δ , and δ < 0.5831 should be satisfied.
Figure 6d–g depict that with the increase of δ , the profit of renewable energy power generation enterprise A will decrease while the profit of coal-fired power plant B, power grid enterprise C and the whole power supply chain will increase in both single-channel and dual-channel. This is because the emission reduction effort of coal-fired power plant B will be enhanced by the increasing δ , so that the market share and profit of renewable energy power generation enterprise A will be reduced.
Additionally, it can be seen from the previous expressions of q C L c * , q C L d * , q C N c * and q C N d * , there is no impact of δ on q C in each scenario.

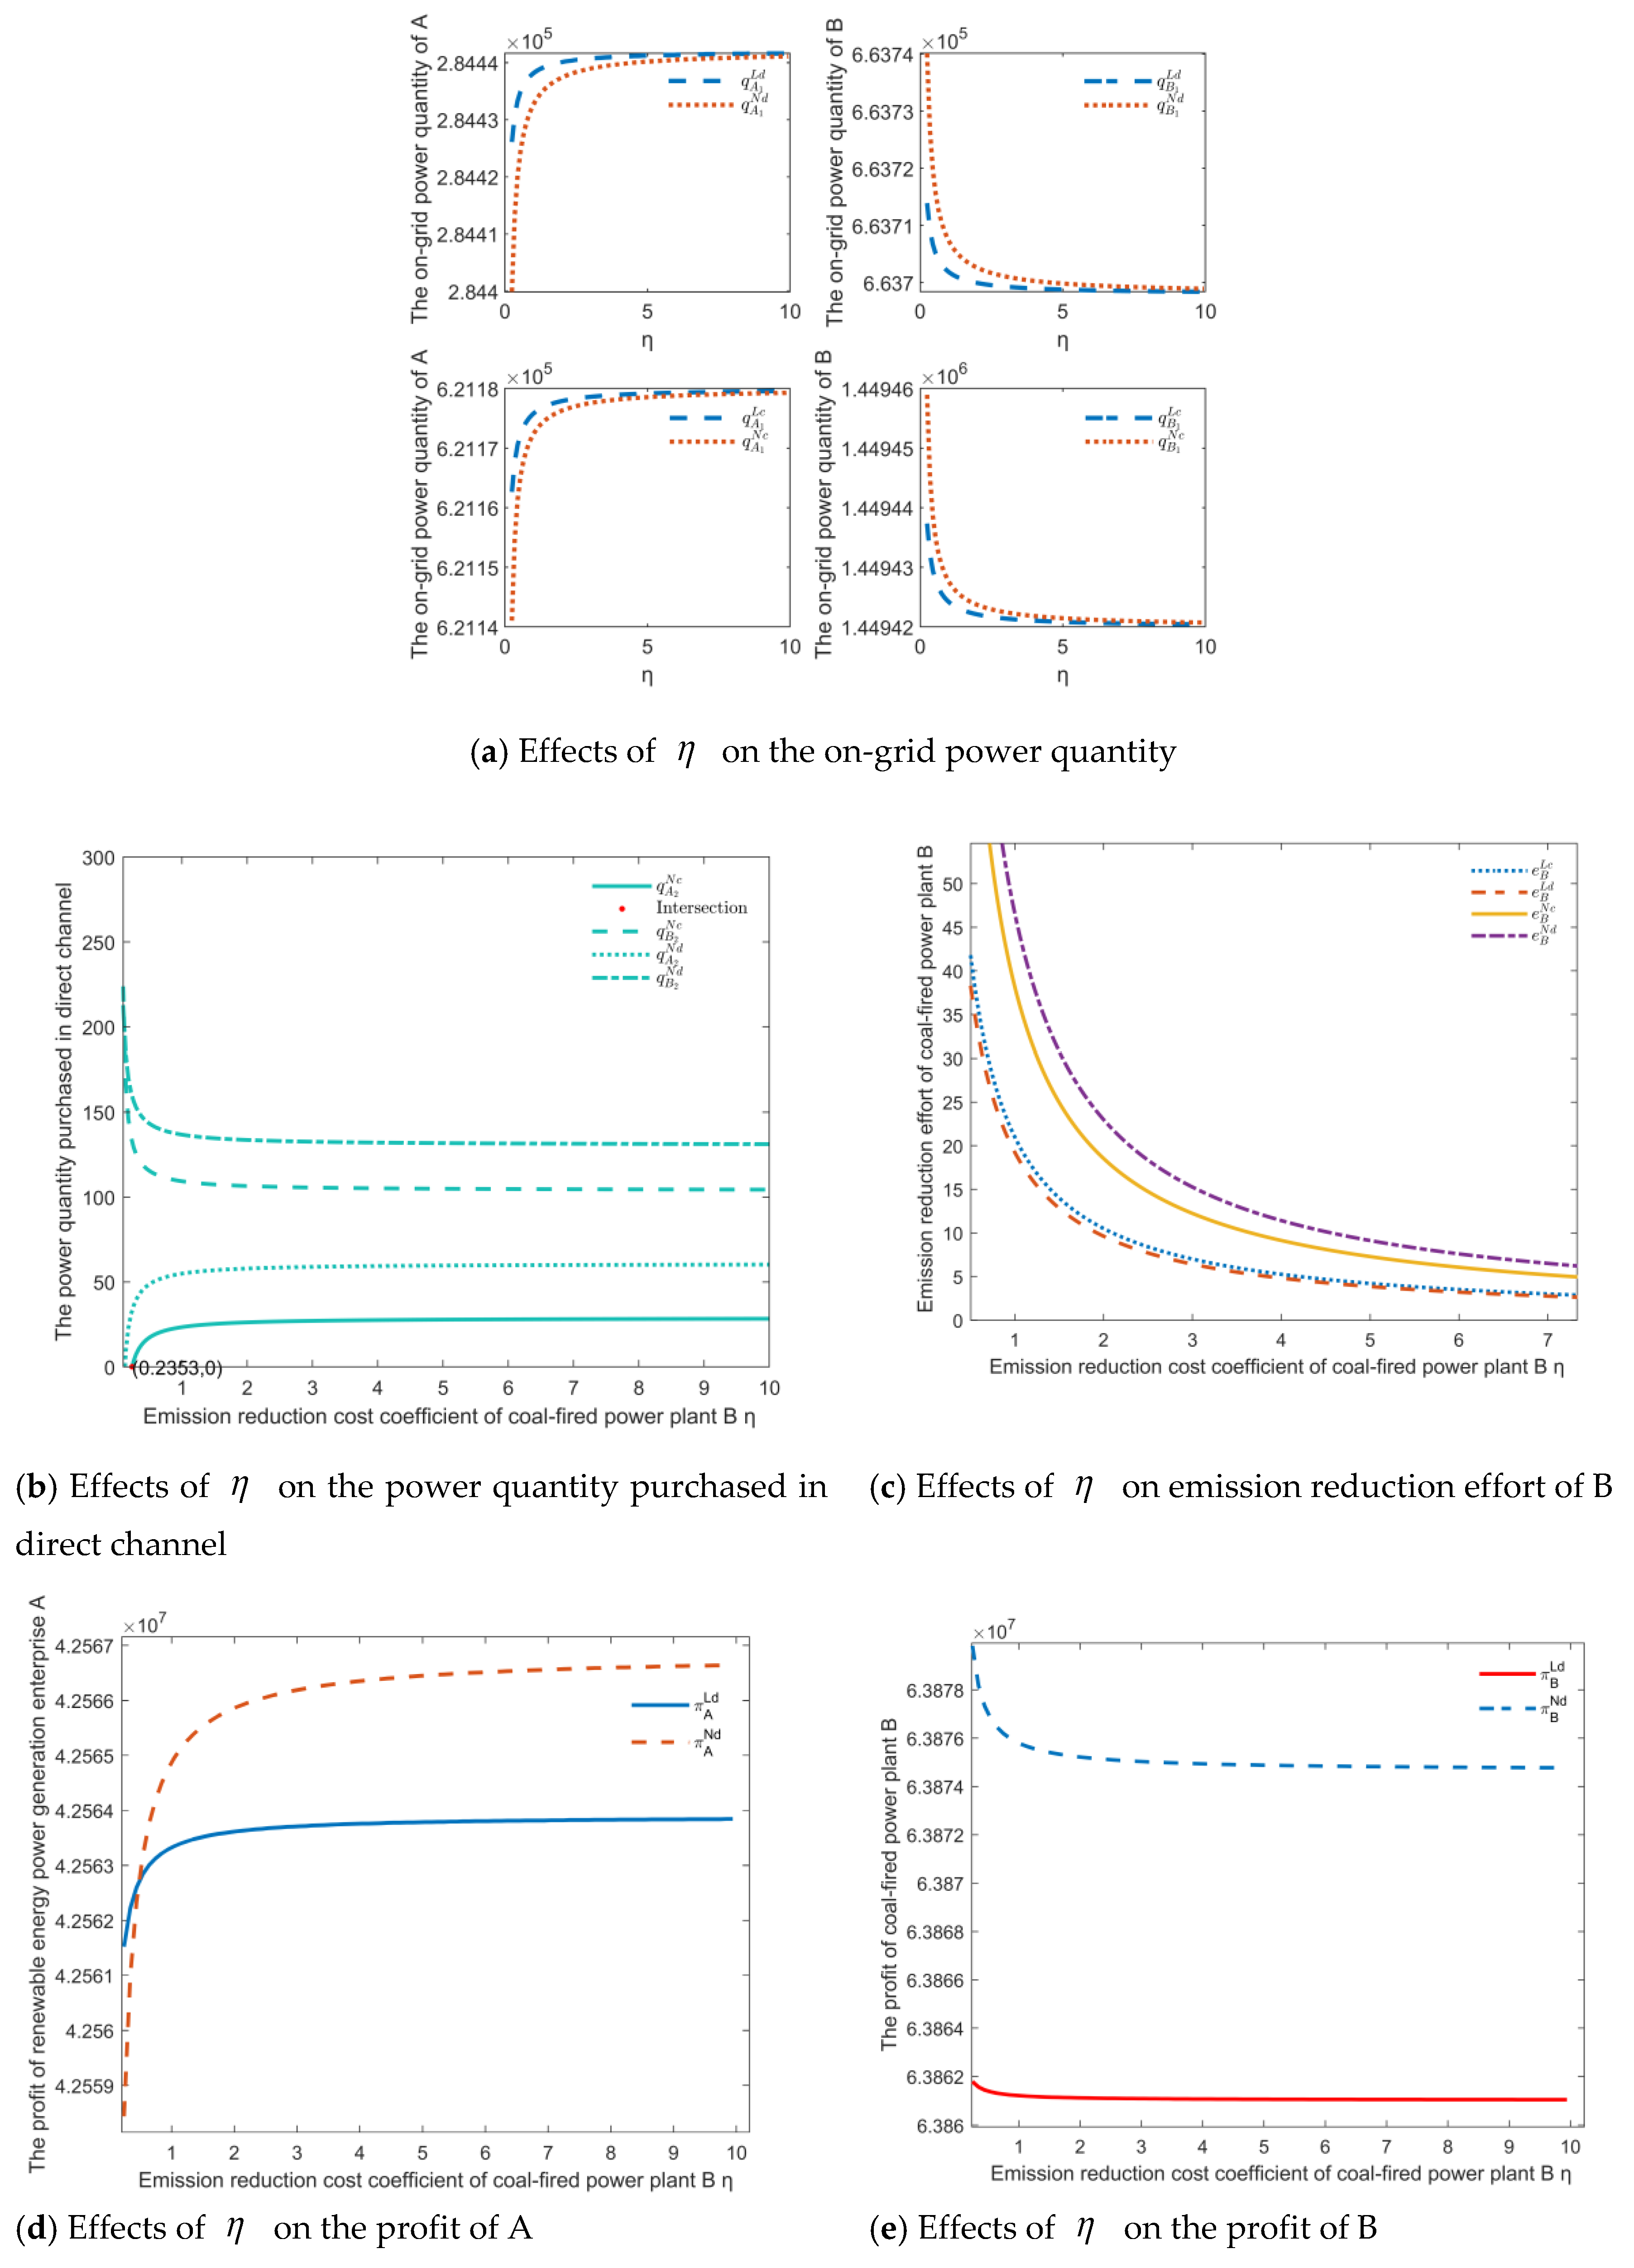
6.2.5. Impact of η on the Optimal Results

Under the requirement of clean production, the impact of emission reduction cost of coal-fired power plant B on the optimal decisions are demonstrated in Figure 7a–g.
As seen in Figure 7a, it can be concluded that the on-grid power quantity of renewable energy power generation enterprise A and coal-fired power plant B exhibit exactly opposite with the increase of η . From Figure 7b,c, with the requirement of decision variables should be above 0, when η > 0.242 is satisfied, the emission reduction effort and power quantity purchased in direct channel from coal-fired power plant B in centralized and decentralized scenarios will decrease with the increase of η . Conversely, the power quantity purchased in direct channel from renewable energy power generation enterprise A in centralized and decentralized scenarios will increase with the increase of η . Furthermore, 
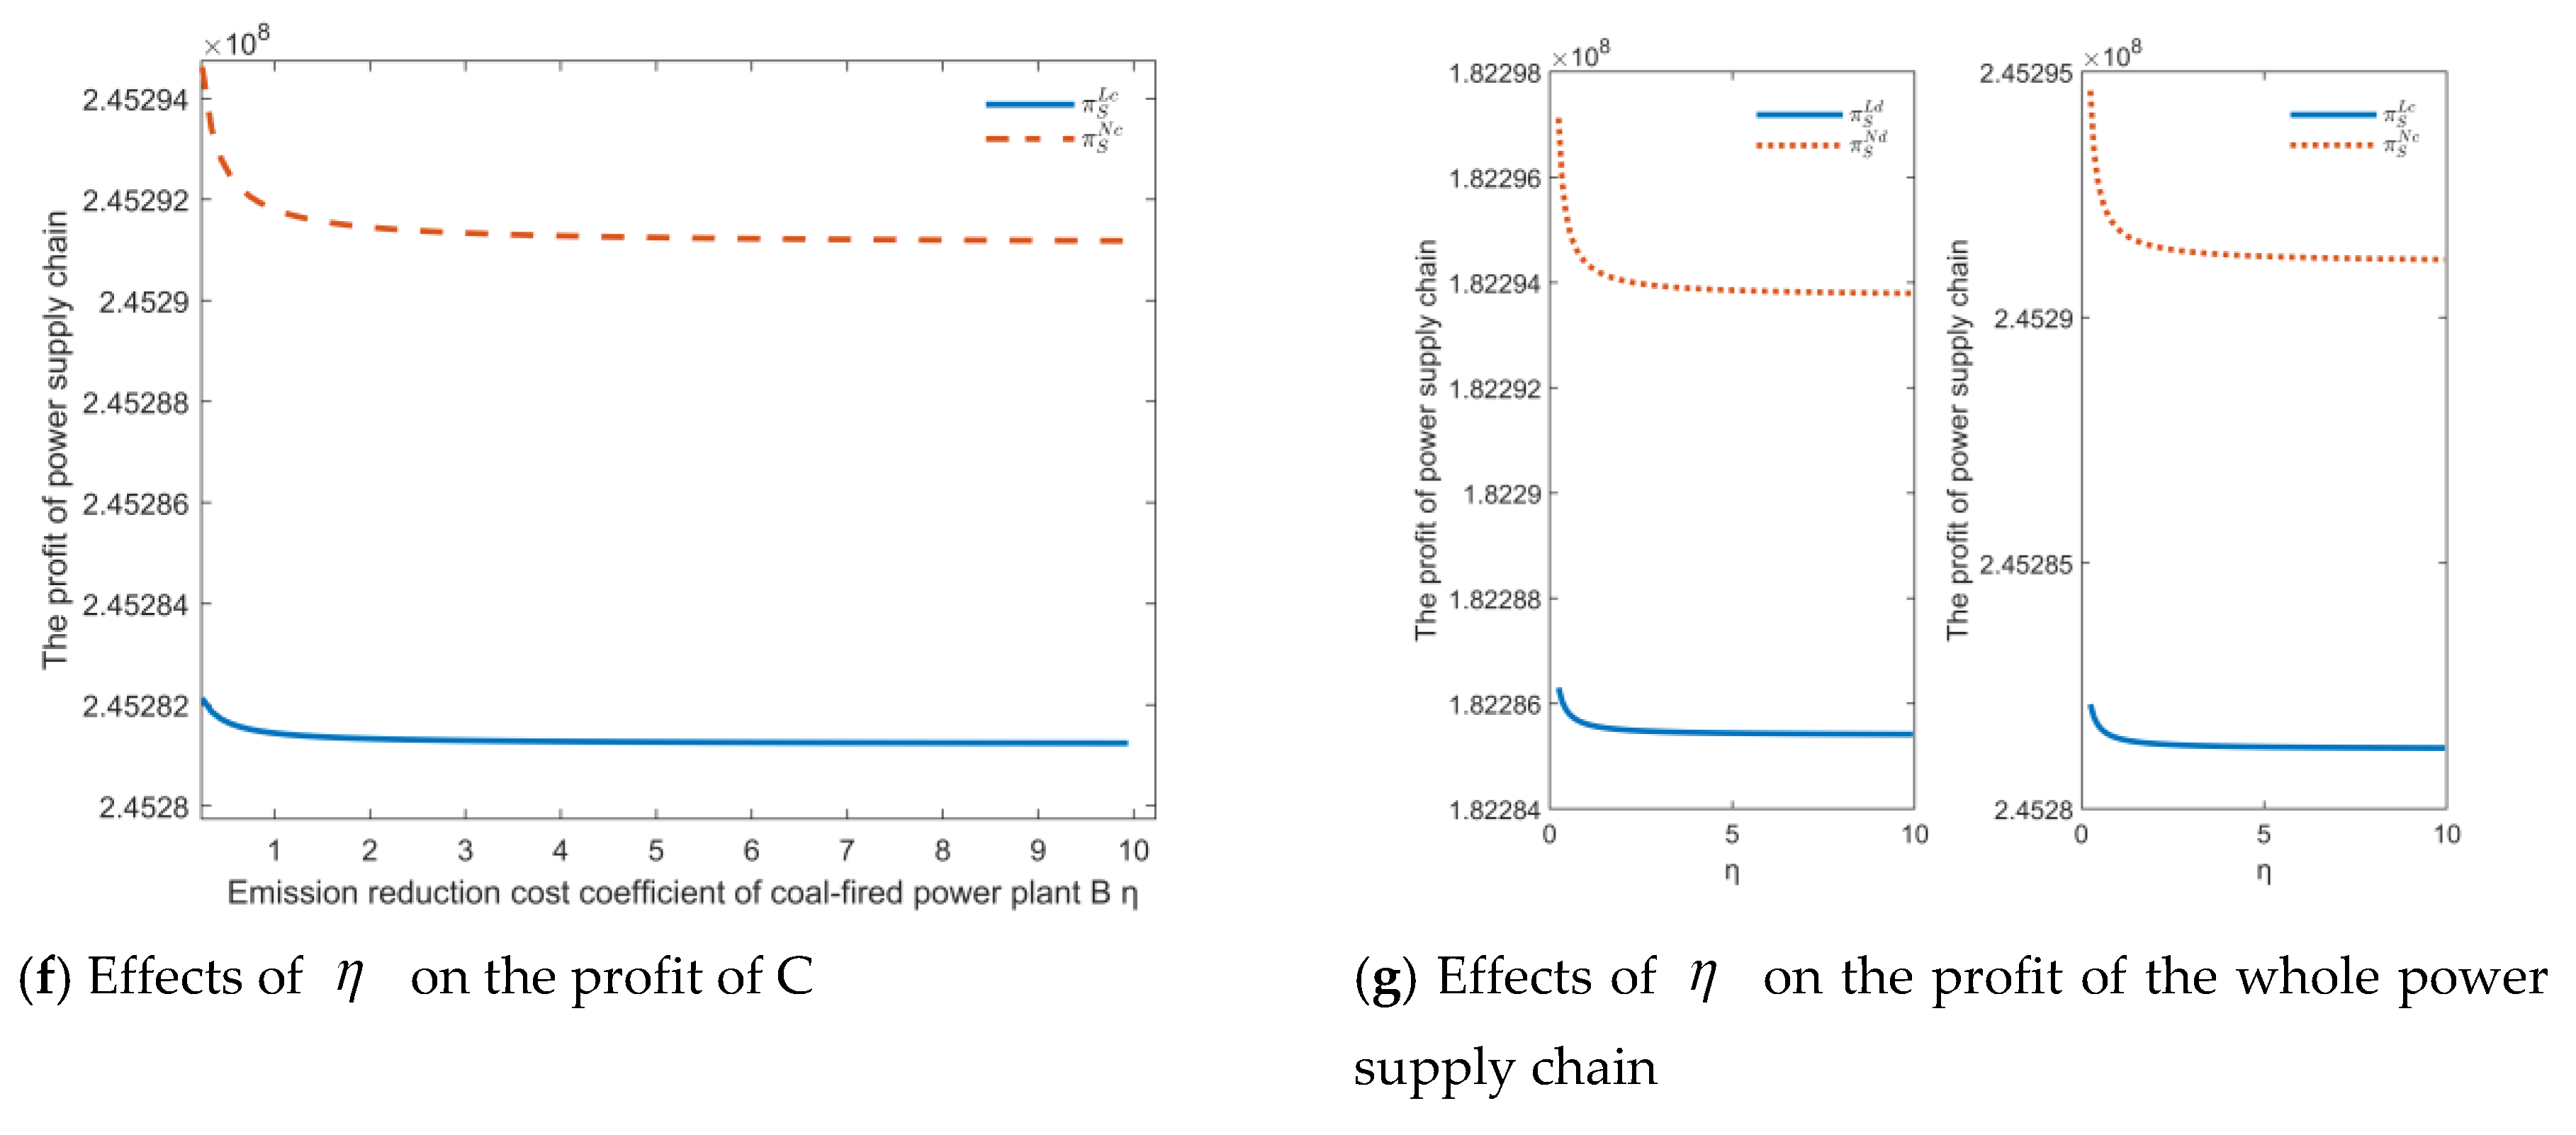
Figure 6d–g exhibit that with the increase of η , the profit of renewable energy power generation enterprise A will increase while the profit of coal-fired power plant B, power grid enterprise C and the whole power supply chain will decrease in both single-channel and dual-channel. This is mainly due to the increase of emission reduction cost coefficient, the willingness of coal-fired power plant B to invest in emission reduction will decrease, and accordingly the lower emission reduction efforts will weaken the competitive advantage of coal-fired power plant B in the power supply chain.
Further, as previous expressions of q C L c * , q C L d * , q C N c * and q C N d * show, there is no impact of η on q C in each scenario.
From the above numerical studies, the decision variables variations with parameters of ψ , γ , θ , δ and η in different scenarios could be summarized in Table 3.

7. Conclusions

With the marketization reform of power supply chain, the centralized and decentralized decisions of power quantity and emission reduction effort in the traditional single-channel and dual-channel power supply chain with direct power purchase transactions by large power users were analyzed in this paper. Based on these, the optimal decisions and profits in four different scenarios were derived. Finally, the optimal decisions and profits in different scenarios by numerical analysis were compared, and the impact of parameters’ variations on the decision variables were analyzed.
The main findings are summarized as follows. (1) The on-grid power preference coefficient of coal-fired power generation has a significant influence on the on-grid power quantity of renewable energy power generation enterprise A in traditional single-channel power supply chain. (2) In the centralized scenario, the direct power purchasing channel is conducive to promote the consumption of renewable energy power generation, as well as the on-grid power quantity and emission reduction effort of coal-fired power plant B and the profit of whole power supply chain. (3) Power grid wheeling charge has negative relationship with direct channel power quantity, on-grid power quantity of B, emission reduction effort of B, and profits of A and B, while has a positive relationship with on-grid power quantity of A and profit of C in decentralized dual-channel power supply chain. (4) The emission reduction effort of coal-fired power plant B could be enhanced by preference coefficient for clean production, while reduced by power grid wheeling charge, emission reduction cost coefficient and subsidy for renewable energy power generation. (5) The profit of whole power supply chain would increase with increase of on-grid power preference coefficient of coal-fired power generation, subsidy for renewable energy power generation and preference coefficient for clean production, while decrease with increase of emission reduction cost coefficient of coal-fired power plant B in all scenarios, and additionally increase firstly and then decrease by the increase of power grid wheeling charge in the scenario of decentralized dual-channel power supply chain.
The findings provide useful managerial insights for government and power supply chain to promote clean production of coal-fired power plant, consumption of renewable energy power generation and profit of whole power supply chain. For government, subsidy for renewable energy power generation and power grid wheeling charge should be adopted as policy instruments. A subsidy for renewable energy power generation and power grid wheeling charge has a negative relationship with emission reduction effort of coal-fired power plant B, while it has a positive relationship with the profit of whole power supply chain. Thus, a reasonable value of subsidy for renewable energy power generation and power grid wheeling charge should be necessary for these optimal strategies. Furthermore, this research is also implicational for clean production of power supply chain. Firstly, on-grid power preference coefficient of coal-fired power generation and preference coefficient for clean production could be applied as market incentive instruments for power supply chain, as they are positively related with profit of whole power supply chain, and preference coefficient for clean production is also positively related with emission reduction effort of coal-fired power plant B. Secondly, emission reduction cost coefficient should be reduced to promote clean production of coal-fired power plant B and profit of whole power supply chain.
However, there are several limitations to deep exploring in this research. First, this paper assumes all the information is common knowledge to members in the power supply chain. Discussions under asymmetric information could be made in further research. Second, as the security and optimal operation of a power network system is important in modern power systems which has been a concern of previous researches [52,53], it also should be studied in our future research. Third, this paper supposes all decisions are static, which can be considered in multi-period for future research. Forth, channel preference for direct power purchasing transactions in dual-channel supply chain can be considered in future. Fifth, there is a lack of some sensitivity analysis (i.e., how the change in the price of power from coal or renewables would influence the power market and policy), as well as of concrete values of the results obtained in numerical analysis which are only the curves of the trends because of the computational complexity.

Author Contributions

Conceptualization, L.X. and J.D.; methodology, L.X. and F.H.; software, F.H. and D.W.; writing—original draft preparation, L.X. and F.H.; writing—review and editing, L.X.; visualization, F.H. All authors have read and agreed to the published version of the manuscript.

Funding

This research is funded by the National Nature Science Foundation of China (71704066 and 71704068), National Social Science Foundation of China (18VSJ038 and 15BGL128), Natural Science Foundation of Jiangsu Province in China (BK20170542), Social Science Foundation of Jiangsu Province in China (18GLC006 and 19GLC003), Natural Science Foundation of Jiangsu Provincial Department of Education in China (17KJB610003), Youth Talents Cultivation Program of Jiangsu University (411160001), the Jiangsu Overseas Visiting Scholar Program for University Prominent Young & Middle-Aged Teachers and Presidents, and China Postdoctoral Science Foundation (2019M651833). The APC was funded by the National Nature Science Foundation of China (71704066).

Acknowledgments

The authors are indebted to the anonymous reviewers for their very insightful comments and constructive suggestions, which helped ameliorate the quality of this paper.

Conflicts of Interest

The authors declare no conflict of interest.

Appendix A

Appendix A.1. Proof of Lemma 1

In order to obtain the equilibrium of centralized decision-making with traditional single-channel power supply chain, the optimal solutions of q C and e B should be determined at first. By substituting the formula of q A 1 and q B 1 into Equation (5), and taking the first-order partial derivative of π S L c with respect to q C and e B , we can obtain π S L c / q C = ( 1 θ ) ( γ c A ) θ c B + p r μ q C and π S L c / e B = δ ( c A γ c B ) η e B . Furtherly, we can obtain the Hessian matrix of q C and e B .
H = ( μ 0 0 η )
As the order principal sub-formula | H 1 | = μ < 0 , | H 2 | = μ η > 0 , thus the Hessian matrix is a negative definite. Hence, π S L c is concave in q C and e B . Let π S L c / q C = 0 and π S L c / e B = 0 , and then we can get q C L c * and e B L c * .
By substituting q C L c * and e B L c * into formulas about q A 1 , q B 1 , then we can get q A 1 L c * and q B 1 L c * . And with Equation (5), we can get π S L c * .

Appendix A.2. Proof of Lemma 2

With Equation (4), we can get power grid enterprise’s response as follows: 2 π C L d / q C 2 = μ < 0 . Let π C L d / q C = p r p A 1 ( 1 θ ) θ p B 1 μ q C = 0 , then the best response of power grid enterprise is given by q C L d * = p r p A 1 ( 1 θ ) θ p B 1 μ .
By substituting q C L d * into Equation (3), then we can take the first-order partial derivative and second-order partial derivative of π B L with respect to e B . Due to 2 π B L / e B 2 = η < 0 , then let π B L / e B = η e B + δ ( p B 1 c B ) = 0 , then we can get e B L d * .
By substituting q C L d * and e B L d * into formulas about q A 1 , q B 1 , then we can get q A 1 L d * and q B 1 L d * . And with Equations (2)–(4), we can get π A L d * , π S L d * and π C L d * .

Appendix A.3. Proof of Lemma 3

With Equation (14), we can get the first-order partial derivative of π S N c with respect to q C , e B , q A 2 and q B 2 , furtherly we can obtain the Hessian matrix of them.
H = [ μ 0 0 0 0 η δ δ 0 δ 2 α 2 β 0 δ 2 β 2 α ]
As the order principal sub-formula | H 1 | = μ < 0 , | H 2 | = μ η > 0 , | H 3 | = μ ( δ 2 + 2 α η ) < 0 , and | H 4 | = 4 δ 2 ( α + β ) + 4 η ( α 2 β 2 ) > 0 , thus the Hessian matrix is a negative definite. Hence, π S N c is concave in q C , e B , q A 2 and q B 2 . Let π S N c / q C = 0 , π S N c / e B = 0 , π S N c / q A 2 = 0 and π S N c / q B 2 = 0 , then we can get q C N c * , e B N c * , q A 2 N c * and q B 2 N c * .
By substituting q C N c * and e B N c * into formulas about q A 1 , q B 1 , then we can get q A 1 N c * and q B 1 N c * . And with Equation (14), we can get π S N c * .

Appendix A.4. Proof of Lemma 4

With Equation (13), we can get the first-order and second-order partial derivative of π C N d with respect to q C . As 2 π C N d / q C 2 = μ < 0 , then let π C N d / q C = p r p A 1 ( 1 θ ) θ p B 1 μ q C = 0 , then we can get q C N d * .
By substituting q C N d * into Equation (12), we can get the first-order partial derivative of π B N d with respect to e B and q B . Furtherly, we can obtain the Hessian matrix of e B and q B .
H = ( η δ δ 2 α )
As the order principal sub-formula | H 1 | = η < 0 and | H 2 | = 2 α η δ 2 > 0 , thus the Hessian matrix is a negative definite. Therefore, π B N d is concave in e B and q B . Let π B N d / e B = 0 and π B N d / q B = 0 , then we can obtain e B N d and q B 2 N d :
e B N d = δ ( a ψ c B + 2 α ( p B 1 c B ) β q A 2 ) 2 α η δ 2
q B 2 N d = η ( a c B ψ β q A 2 ) + δ 2 ( p B 1 c B ) 2 α η δ 2
By substituting q C N d * , e B N d and q B 2 N d into Equation (11), we can get the first-order partial derivative of π A N d with respect to q A 2 .
π A N d q A 2 = A + δ 2 ( B ( 2 α + β ) D + β C ) β η B 2 E q A 2 2 α η δ 2 ,
where A = a + γ c A ψ , B = a c B ψ , C = p A 1 + γ c A , D = p B 1 c B and E = α ( 2 α η δ 2 ) β ( β η + δ 2 ) .
Furthermore, we can get the second-order partial derivative of π A N d with respect to q A 2 . As α > β and δ 2 η ( α β ) < 0 , then we can conclude that E > 0 and 2 α η δ 2 > 0 , then we can obtain that 2 π A N d / q A 2 2 = 2 E / ( 2 α η δ 2 ) < 0 , and π A N d is concave in q A 2 . Let π A N d / q A 2 = 0 , then we can obtain q A 2 N d * . By substituting into formula of e B N d and q B 2 N d , we can derive e B N d * and q B 2 N d * .
By substituting above equilibriums into formulas about q A 1 , q B 1 , then we can get q A 1 N d * and q B 1 N d * . Accordingly, we can obtain π A N d * , π B N d * and π C N d * respectively.

Appendix B

Appendix B.1. Proof of Proposition 1

q B 1 L c * q A 1 L c * = ( 2 θ 1 ) p r + ( 1 θ ) ( γ c A ) θ c B μ + 2 δ δ ( c A γ c B ) η . As c A γ c B > 0 , then thus if the condition η ( c A + c B 2 p r r ) 2 16 μ δ 2 ( c B c A + r ) 2 > 0 is meet, we can obtain q B 1 L c * < q A 1 L c * , where θ ( η ( 3 c A c B 2 p r 3 r ) + η ( η ( c A + c B 2 p r r ) 2 16 μ δ 2 ( c B c A + r ) 2 4 η ( c A c B r ) , η ( 3 c A c B 2 p r 3 r ) η ( η ( c A + c B 2 p r r ) 2 16 μ δ 2 ( c B c A + r ) 2 4 η ( c A c B r ) )
q B 1 L d * q A 1 L d * = ( 2 θ 1 ) p r p A 1 ( 1 θ ) θ p B 1 μ + 2 δ δ ( p B 1 c B ) η . As p A 1 p B 1 > 0 , if the condition η ( p A 1 + p B 1 2 p r ) 2 16 μ δ 2 ( p B 1 c B ) ( p A 1 p B 1 ) > 0 is meet, we can obtain q B 1 L d * < q A 1 L d * , where θ ( η ( 3 p A 1 p B 1 2 p r ) η ( η ( p A 1 + p B 1 2 p r ) 2 16 μ δ 2 ( p B 1 c B ) ( p A 1 p B 1 ) 4 η ( p A 1 p B 1 ) , η ( 3 p A 1 p B 1 2 p r ) + η ( η ( p A 1 + p B 1 2 p r ) 2 16 μ δ 2 ( p B 1 c B ) ( p A 1 p B 1 ) 4 η ( p A 1 p B 1 ) )
As such, we can get Proposition 1.

Appendix B.2. Proof of Proposition 2

q A 1 N c * q A 1 L c * = δ 2 ( c A r c B ) ( η + 2 δ 2 ) 2 η ( δ 2 η ( α β ) ) . As c A γ c B > 0 and δ 2 η ( α β ) < 0 , then we can conclude that q A 1 N c * < q A 1 L c * .
q B 1 N c * q B 1 L c * = δ 2 ( r + c B c A ) ( η + 2 δ 2 ) 2 η ( δ 2 η ( α β ) ) . Accordingly, we can conclude that q B 1 N c * > q B 1 L c * .

Appendix B.3. Proof of Proposition 3

q B 2 N c q A 2 N c = ( c A r c B ) ( η + 2 δ 2 ) 2 ( δ 2 η ( α β ) ) . As c A γ c B > 0 and δ 2 η ( α β ) < 0 , then we can conclude that q B 2 N c > q A 2 N c .

Appendix B.4. Proof of Proposition 4

e B N c * e B L c * = δ ( η + 2 δ 2 ) ( c A γ c B ) 2 η ( δ 2 η ( α β ) ) . As c A γ c B > 0 and δ 2 η ( α β ) < 0 , then we can conclude that e B N c * > e B L c * .
e B L c * e B L d * = δ ( c A γ p B 1 ) η . Thus if c A γ p B 1 > 0 , there should be e B L c * > e B L d * , else if c A γ p B 1 < 0 , then there should be e B L c * < e B L d * .

Appendix B.5. Proof of Proposition 5

π S N c * π S L c * = ( a c 0 p + p r c B ) ( a c 0 p + p r c A + γ ) 2 ( α + β ) ( η ( 2 α η δ 2 ) + 4 δ 2 ( α + β ) ( 1 + η ) ) 8 η ( α + β ) ( δ 2 η ( α β ) ) ( c A γ c B ) 2 . As δ 2 η ( α β ) < 0 and 2 α η δ 2 > 0 , then there should be ( η ( 2 α η δ 2 ) + 4 δ 2 ( α + β ) ( 1 + η ) ) 8 η ( α + β ) ( δ 2 η ( α β ) ) ( c A γ c B ) 2 > 0 .
With q A 2 N c * = a c 0 p + p r c B 2 ( α + β ) + ( 2 α η δ 2 + 2 δ 2 ( α + β ) ) ( c A γ c B ) 4 ( α + β ) ( δ 2 η ( α β ) ) > 0 , we can get a c 0 p + p r c B > c A γ c B > 0 , thus there is ( a c 0 p + p r c B ) ( a c 0 p + p r c A + γ ) 2 ( α + β ) > 0 .
Hence, we can obtain π S N c * > π S L c * .

References

  1. Zhang, M.; Liu, X.; Wang, W.; Zhou, M. Decomposition analysis of CO2 emissions from electricity generation in China. Energy Policy 2013, 52, 159–165. [Google Scholar] [CrossRef]
  2. IEA. Available online: https://www.iea.org/reports/global-energy-co2-status-report-2019 (accessed on 25 July 2020).
  3. Deng, H.; Farah, P.; Wang, A. China’s role and contribution in the global governance of climate change: Institutional adjustments for carbon tax introduction, collection and management in China (24 November 2015). J. World Energy Law Bus. 2015, 8, 581–599. [Google Scholar]
  4. The Statistical Communique on National Economic and Social Development in the Year of 2018. Available online: http://www.stats.gov.cn/tjsj/zxfb/201902/t20190228_1651265.html (accessed on 25 July 2020).
  5. Wang, J.; Wang, R.; Zhu, Y.; Li, J. Life cycle assessment and environmental cost accounting of coal-fired power generation in China. Energy Policy 2018, 115, 374–384. [Google Scholar] [CrossRef]
  6. Tang, L.; Qu, J.; Mi, Z.; Bo, X.; Chang, X.; Anadon, L.D.; Wang, S.; Xue, X.; Li, S.; Wang, X.; et al. Substantial emission reductions from Chinese power plants after the introduction of ultra-low emissions standards. Nature Energy 2019, 4, 929–938. [Google Scholar] [CrossRef]
  7. Wang, W.; Lyu, J.; Li, Z.; Zhang, H. Energy conservation in China’s coal-fired power industry by installing advanced units and organized phasing out backward production. Front. Energy 2019, 13, 798–807. [Google Scholar] [CrossRef]
  8. Consolación, Q.; Callejas-Albiñana, F.E.; Tarancón, M.Á.; Martínez-Rodríguez, I. Econometric Studies on the Development of Renewable Energy Sources to Support the European Union 2020–2030 Climate and Energy Framework: A Critical Appraisal. Sustainability 2020, 12, 4828. [Google Scholar] [CrossRef]
  9. BP Statistical Review of World Energy. 2019. Available online: https://www.bp.com/content/dam/bp/business-sites/en/global/corporate/pdfs/energy-economics/statistical-review/ bp-stats-review-2019-full-report.pdf (accessed on 25 July 2020).
  10. Li, S.; Wang, J.; Liu, Q.; Li, L.; Hua, Y.; Liu, W. Analysis of Status of Photovoltaic and Wind Power Abandoned in China. J. Power Energy Eng. 2017, 5, 91–100. [Google Scholar] [CrossRef] [Green Version]
  11. Liu, J. China’s renewable energy law and policy: A critical review. Renew. Sustain. Energy Rev. 2019, 99, 212–219. [Google Scholar] [CrossRef]
  12. He, Y.; Xu, Y.; Pang, Y.; Tian, H.; Wu, R. A regulatory policy to promote renewable energy consumption in China: Review and future evolutionary path. Renew. Energy 2016, 89, 695–705. [Google Scholar] [CrossRef]
  13. Liu, S.; Bie, Z.; Lin, J.; Wang, X. Curtailment of renewable energy in Northwest China and market-based solutions. Energy Policy 2018, 123, 494–502. [Google Scholar] [CrossRef]
  14. Mitani, T.; Aziz, M.; Oda, T.; Uetsuji, A.; Watanabe, Y.; Kashiwagi, T. Annual Assessment of Large-Scale Introduction of Renewable Energy: Modeling of Unit Commitment Schedule for Thermal Power Generators and Pumped Storages. Energies 2017, 10, 738. [Google Scholar] [CrossRef] [Green Version]
  15. Bruce, N. Stram. Key challenges to expanding renewable energy. Energy Policy 2016, 96, 728–734. [Google Scholar]
  16. Zeng, M.; Yang, Y.; Fan, Q.; Liu, Y.; Zou, Z. Coordination between clean energy generation and thermal power generation under the policy of “direct power-purchase for large users” in China. Utilities Policy 2015, 33, 10–22. [Google Scholar] [CrossRef]
  17. Guo, L.; Wang, J.; Ma, C.; Gao, C.; Zhang, Q. Optimal model of power purchase strategy for direct power purchase by large consumers based on the multi-state model of electricity price. In Proceedings of the 2016 IEEE International Conference on Power and Renewable Energy (ICPRE), Shanghai, China, 21–23 October 2016. [Google Scholar] [CrossRef]
  18. Khosrojerdi, A.; Zegordi, S.H.; Allen, J.; Mistree, F. A method for designing power supply chain networks accounting for failure scenarios and preventive maintenance. Eng. Optim. 2016, 48, 154–172. [Google Scholar] [CrossRef]
  19. Ding, H.; Huang, H.; Tang, O. Sustainable supply chain collaboration with outsourcing pollutant-reduction service in power industry. J. Clean. Prod. 2018, 186, 215–228. [Google Scholar] [CrossRef]
  20. Zhao, W.; Gao, J.; Song, Y.; Yu, J. Investment decision on carbon emission reduction in power industry based on supply chain. Sci. Technol. Manag. Res. 2017, 37, 242–249, 259. [Google Scholar]
  21. Zhang, S.; Wang, C.X.; Yu, C.; Ren, Y. Governmental cap regulation and manufacturer’s low carbon strategy in a supply chain with different power structures. Comput. Ind. Eng. 2019, 134, 27–36. [Google Scholar] [CrossRef]
  22. Oliverira, F.S.; Rriz, C.; Conejo, A. Contract design and supply chain coordination in the electricity industry. Eur. J. Oper. Res. 2013, 227, 527–537. [Google Scholar] [CrossRef]
  23. Dou, X.; Li, Y.; Wang, B.; Xue, C. Power supply chain incentive mechanism based on overall profit. Power Autom. Equip. 2010, 30, 58–62. [Google Scholar]
  24. Chen, M.J.; Hu, Y.F.; Wu, Y.C. Modified penalty function method for optimal social welfare of electric power supply chain with transmission constraints. Int. J. Electr. Power Energy Syst. 2014, 57, 90–96. [Google Scholar] [CrossRef]
  25. Nasiri, F.; Zaccour, G. An exploratory game-theoretic analysis of biomass electricity generation supply chain. Energy Policy 2009, 37, 4514–4522. [Google Scholar] [CrossRef]
  26. Wu, W.; Ren, Y.; Shi, L. Comparison of Renewable Energy Policy Based on Electricity Supply Chain Benefit. China Popul. Resour. Environ. 2013, 23, 44–48. [Google Scholar]
  27. Yuan, J.H.; Sun, S.H.; Shen, J.K.; Xu, Y.; Zhao, C.H. Wind power supply chain in China. Renew. Sustain. Energy Rev. 2014, 39, 356–369. [Google Scholar] [CrossRef]
  28. Li, J.; Min, M.; Chen, Z. The Optimal Procurement Strategy of Electricity and Renewable Energy Certificates. Syst. Eng.-Theory Pract. 2017, 37, 901–913. [Google Scholar]
  29. Memari, A.; Ahmad, R.; Rahim, A.R.A.; Jokar, M.R.A. A multi-period bio-energy supply chain under carbon pricing and carbon trading policies. Clean. Technol. Environ. Policy 2018, 20, 113–125. [Google Scholar] [CrossRef]
  30. Hou, L.; Sun, J.; Wang, H. Bullwhip Effect of Double Sources Electricity Supply Chain for Large-scale Wind Power Integration on Power System. Oper. Res. Manag. 2015, 24, 86–94. [Google Scholar]
  31. Pan, Z.; Xiong, Z.K.; Guo, N. Dual-Channel Strategies for Retailers with Price and Service Competition. Ind. Eng. J. 2012, 15, 57–62. [Google Scholar]
  32. Song, Y.; Chen, J.; Yang, Y.; Jia, C.; Su, J. A dual-channel supply chain model considering supplier’s mental accounting and retailer’s fairness concerns. Procedia Comput. Sci. 2018, 139, 347–355. [Google Scholar] [CrossRef]
  33. Dan, B.; Xu, G.; Liu, G. Pricing policies in a dual-channel supply chain with retail services. Int. J. Prod. Econ. 2012, 139, 312–320. [Google Scholar] [CrossRef]
  34. Batarfi, R.; Mohamad, Y.; Jaber, S. Dual-channel supply chain: A strategy to maximize profit. Appl. Math. Model. 2016, 40, 9454–9473. [Google Scholar] [CrossRef]
  35. He, Y.; Huang, H.; Li, D. Inventory and pricing decisions for a dual-channel supply chain with deteriorating products. Oper. Res. Int. J. 2018. [Google Scholar] [CrossRef]
  36. Feng, D.; Ma, L.; Ding, Y.; Wu, G.; Zhang, Y. Decisions of the Dual-Channel Supply Chain under Double Policy Considering Remanufacturing. Int. J. Environ. Res. Public Health 2019, 16, 465. [Google Scholar] [CrossRef] [PubMed] [Green Version]
  37. Nikunja, M.; Peter, K. Managing a dual-channel supply chain under price and delivery-time dependent stochastic demand. Eur. J. Oper. Res. 2019, 272, 147–161. [Google Scholar]
  38. He, R.; Xiong, Y.; Lin, Z. Carbon emissions in a dual channel closed loop supply chain: The impact of consumer free riding behavior. J. Clean. Prod. 2016, 134, 384–394. [Google Scholar] [CrossRef] [Green Version]
  39. Ji, J.; Zhang, Z.; Yang, L. Carbon emission reduction decisions in the retail-/dual-channel supply chain with consumers’ preference. J. Clean. Prod. 2017, 141, 852–867. [Google Scholar] [CrossRef]
  40. Wang, X.; Xue, M.; Xing, L. Analysis of Carbon Emission Reduction in a Dual-Channel Supply Chain with Cap-And-Trade Regulation and Low-Carbon Preference. Sustainability 2018, 10, 580. [Google Scholar] [CrossRef] [Green Version]
  41. Yang, L.; Ji, J.; Wang, M.; Wang, Z. The manufacturer’s joint decisions of channel selections and carbon emission reductions under the cap-and-trade regulation. J. Clean. Prod. 2018, 193, 506–523. [Google Scholar] [CrossRef]
  42. Xu, J.; Qi, Q.; Bai, Q. Coordinating a dual-channel supply chain with price discount contracts under carbon emission capacity regulation. Appl. Math. Model. 2018, 56, 449–468. [Google Scholar] [CrossRef]
  43. Zhou, Y.; Ye, X. Differential game model of joint emission reduction strategies and contract design in a dual-channel supply chain. J. Clean. Prod. 2018, 190, 592–607. [Google Scholar] [CrossRef]
  44. Xu, L.; Wang, C.; Zhao, J. Decision and coordination in the dual-channel supply chain considering cap-and-trade regulation. J. Clean. Prod. 2018, 197, 551–561. [Google Scholar] [CrossRef]
  45. Chen, Y.; Jiang, X.; Yu, T.; Huang, S. Coalition Trading Mode Design and Analysis for Distributed Generators and Loads in Regional Distribution Network. Autom. Electr. Power Syst. 2017, 41, 78–86. [Google Scholar]
  46. Chen, Y.; Wei, Z.; Xu, Z.; Huang, W.; Sun, G.; Zhou, Y. Optimal Scheduling Strategy of Multiple Virtual Power Plants Under Electricity Market Reform. Autom. Electr. Power Syst. 2019, 43, 58–67, 245. [Google Scholar]
  47. Wang, D.; Liu, J. US Electricity Reform Practice and Its Inspiration to China. Res. Econom. Manag. 2017, 38, 58–61. [Google Scholar]
  48. Zhao, X.; Liu, P.; Liu, L.; Wang, J. Empirical Analysis on Technological Substitution of Electric Power Generation of Renewable Energy for Thermal Power Generation in China: Based on Lotka-Volterra Competition Model. Technol. Econ. 2011, 30, 40–44. [Google Scholar]
  49. Feng, T.; Lu, Z.; Li, X.; Wang, H.; Sun, Y. Dynamic Emission Economic Dispatch Considering Large Consumers Direct Purchasing. Trans. China Electrotech. Soc. 2016, 31, 151–159. [Google Scholar]
  50. Lee, C. Decentralized allocation of emission permits by Nash data envelopment analysis in the coal-fired power market. J. Environ. Manag. 2019, 241, 353–362. [Google Scholar] [CrossRef]
  51. Huang, S.; Xu, F.; He, J.; Liu, J. Cooperative Reduction and Promotion Decision Model in Dual Channel Supply Chain. Sci. Technol. Manag. Res. 2017, 37, 246–256. [Google Scholar]
  52. Macdonald, N.S.P.; Daniel, C.; Olawale, P. Application Assessment of Pumped Storage and Lithium-Ion Batteries on Electricity Supply Grid. Energies 2019, 12, 2855. [Google Scholar] [CrossRef] [Green Version]
  53. Zhang, D.; Du, T.; Yin, H.; Xia, S.; Zhang, H. Multi-Time-Scale Coordinated Operation of a Combined System with Wind-Solar-Thermal-Hydro Power and Battery Units. Appl. Sci. 2019, 9, 3574. [Google Scholar] [CrossRef] [Green Version]
Figure 1. The single-channel power supply chain framework considering emission reduction effort of coal-fired power plant.
Sustainability 12 06582 g001
Figure 2. The dual-channel power supply chain framework considering emission reduction effort of coal-fired power plant.
Sustainability 12 06582 g002
Figure 3. Effects of ψ on the model equilibrium result.
Sustainability 12 06582 g003aSustainability 12 06582 g003b
Figure 4. Effects of γ on the model equilibrium result.
Sustainability 12 06582 g004aSustainability 12 06582 g004b
Figure 5. Effects of θ on the model equilibrium result.
Sustainability 12 06582 g005aSustainability 12 06582 g005b
Figure 6. Effects of δ on the model equilibrium result.
Sustainability 12 06582 g006aSustainability 12 06582 g006b
Figure 7. Effects of η on the model equilibrium result.
Sustainability 12 06582 g007aSustainability 12 06582 g007b
Table 1. Notations for parameters and variables.
Model Parameters
c A , c B Unit power generation cost of power generation enterprise A and B, respectively
c 0 Unit power transmission cost of power grid enterprise C
p A 1 , p B 1 The on-grid power price of power generation enterprise A and B, respectively
p The catalog power price of power grid enterprise C
p A 2 , p B 2 The power price of power generation enterprise A and B in direct channel for large power users
p r The retail selling power price of power grid enterprise C (except for large power users)
Q Total power demand of large power users
θ On-grid power preference coefficient of coal-fired power generation
δ Preference coefficient for cleaner production of coal-fired power plant B in power market
ψ Power grid wheeling charge of power generation enterprises for direct channel by power grid enterprise C
γ Subsidy for renewable energy power generation from government
η Emission reduction cost coefficient of coal-fired power plant B
μ Transmission and distribution cost coefficient of power grid enterprise C
a Basic power price
Decision Variables
q C Power order quantity by power grid enterprise C
q A 1 , q B 1 The on-grid power quantity of power generation enterprise A and B, respectively
q A 2 , q B 2 The power quantity purchased in direct channel from power generation enterprise A and B by large power users
e B Emission reduction effort of coal-fired power plant B
Table 2. Optimal decisions and profits in different scenarios.
Scenarios q C * e B * q B 2 * q B 1 * q A 2 * q A 1 * π A * π B * π C * π S *
Centralized single-channel scenario207.0610.5143.942262.117724,528.13
Centralized dual-channel scenario207.0618.5290.0106143.94240.002662.117624,529.14
Decentralized single-channel scenario94.8149.62266.369928.4444256.366386.117586.0818,228.51
Decentralized dual-channel scenario94.81422.98480.013366.37020.005828.44374256.596387.557585.3018,230.44
Table 3. Decision variables variations with parameters in different scenarios.
Model ParametersScenarioDecision Variables
q C q A 1 q B 1 q A 2 q B 2 e B π A π B π C π S
ψ Nd/+++,
γ Lc+++/////+
Ld//////+//+
Nc++++///+
Nd/++++
θ Lc++//////+
Ld++, +///+, +++
Nc++//////+
Nd++, +///+, +++
δ Lc/+//+///+
Ld/+//++++
Nc/+++///+
Nd/++++++
η Lc/+/////
Ld/+//+
Nc/++///
Nd/+++
Note: +, , / indicates that the decision variable is positively, negatively related and irrelevant with ψ , γ , θ , δ and η respectively.

