Article

WGV: Quantifying Mains Water Savings in a Medium Density Infill Residential Development

1
Curtin University Sustainability Policy Institute, Curtin University, Perth, 6102 Western Australia, Australia
2
Josh Byrne & Associates, Fremantle, 6160 Western Australia, Australia
*
Author to whom correspondence should be addressed.
Sustainability 2020, 12(16), 6483; https://doi.org/10.3390/su12166483
Submission received: 15 July 2020 / Revised: 4 August 2020 / Accepted: 7 August 2020 / Published: 11 August 2020

Abstract

:
The development called the ‘WGV precinct’ is a 2.2 ha medium density residential urban infill development in the Fremantle suburb of White Gum Valley, Western Australia. It was delivered by DevelopmentWA, the State Government development agency. DevelopmentWA and the project’s consultant team designed the WGV precinct to be an exemplar of urban water management in this type of development. Working within commercial constraints, the team established strategies to achieve ambitious reductions in mains water consumption compared to a business-as-usual approach. This paper discusses the process of establishing the precinct’s water related technologies and design features, a valuable case study in demonstrating water innovations in residential developments. Monitoring and transparently reporting on the real-world performance of the project is a key element. A comprehensive metering and data gathering system was put in place, which continues collecting data as the WGV precinct becomes increasingly established. Based on the design water strategies and early stage modelling, a target of 60–70% mains water reduction against the suburban average was set. The measured performance shows that a 65% reduction has been achieved. Barriers and constraints were observed that, if resolved, indicate that more ambitious targets can be considered for future projects. The paper includes discussion of opportunities for further work and compares some basic project qualities and outcomes to two other Australian residential development projects that had reduction in mains water consumption as an explicit objective.

1. Introduction

1.1. Background

Water conservation is an issue of increasing importance globally [1]. In Australia, water reserves support ecosystems of international significance but are under pressure from a drying climate and increasing urban water demand [2]. Traditionally, urban water supplies have been sourced from streamflow into dams and groundwater aquifers; however, with declining rainfall and subsequent reduced streamflow, alternative water sources have to be found [2]. In Perth, the capital city of Western Australia, urban water sources have changed from being supplied from dams (88%) and groundwater (12%) in the 19060s to now being sourced from seawater desalination (48%), groundwater (40%), dams (10%), and groundwater replenishment technology providing the final 2% [3,4]. Along with changes in the sources of water, the energy intensity of urban water has also increased, with desalination more energy intensive than conventional freshwater sources, along with the associated infrastructure costs [5,6]. A reduction in urban water use is therefore ideal to reduce pressure on existing supplies, energy demand, and resultant greenhouse gas emissions.
After water use in the bathroom (shower and bath), laundry practices use the largest amount of water inside the house across Australia [7]. Outdoors, water use in gardening practices is also an intensive use of water [8]. Variations in water use in different dwelling typologies has also been identified as an influence in household water use [9,10]. Water sensitive urban design (WSUD) principles can address outdoor water use, while changes in water fixtures can have an immediate impact on household water use when paired with additional behaviour change measures [9,11]. WSUD reduces the impact of stormwater runoff events by directing water into infiltration devices (tree pits, swales, and underground galleries) within the urban form that also replenish groundwater aquifers in the region [12]. It also includes the harvesting of rainwater and stormwater for potable and non-potable use, along with reducing the urban heat island effect through greening of urban spaces [13]. Households can complement their use of mains water sources through rainwater, greywater, or groundwater sourced through a bore either on-site or through precinct wide shared systems [12].
Practical demonstrations of WSUD and household level water efficiency measures are required to assess their suitability to specific climates, regulatory situations, and stakeholder influences. This can be done through intervention projects termed ‘living laboratories’ [14,15,16]. These sites are demonstration projects that are based in real-life settings that enable various stakeholder engagement, regulatory, and technology combinations to generate learnings [16]. The entire life cycle of a development or technological innovation can be studied in living laboratories, from conception of projects, design stages, building or installation, and finally the occupancy stage [17]. The case study outlined in this paper focuses on the design stage of a residential development, outlining the ambitious design targets set, the modelling undertaken to test if these targets are realistic, and discussing the governance and technology implications of such an approach. This highlights the importance of establishing sustainable design principles from the beginning of a project [18]. Other living laboratory projects around Australia have discussed a similar approach and their ability to further realistic approaches to sustainable water management [19,20,21].

1.2. Case Study

This paper documents the mains water savings achieved at a 2.2 ha medium density residential infill project near Fremantle, Western Australia (WA). The project, known as the ‘WGV precinct’, located in the suburb of White Gum Valley [22], was delivered by the WA State Government land development agency DevelopmentWA, with civil works commencing in 2014. At the time of publication, WGV was approximately 80% built out and occupied. Objectives and targets were set for the WGV precinct around exemplary WSUD, fit-for-purpose water use, and reducing mains water consumption, while also placing emphasis on creating a highly livable environment with quality green space.
The project addresses two important issues in Western Australian land development: infill development that is making more efficient use of existing infrastructure and amenity, and WSUD in a location with a drying climate that is increasingly reliant on high embodied energy water from seawater desalination for the mains supply (nearly 50%). [23]. The overall energy intensity of Perth mains water is 2.41 kilowatt hours per kilolitre [24], while the energy intensity of desalinated mains water is higher at 4 kilowatt hours per kilolitre, or more [25]. This energy intensity is an important part of the interest in reducing mains water consumption, as well as the capital and operational cost of desalination plants.
The drive to reduce mains water consumption has seen varied government responses. Responsibility for water resources in Western Australia is shared between the Water Corporation and the Department of Water and Environmental Regulation (DWER). DWER is broadly responsible for water source allocation and management across the state [26], while the Water Corporation, a State Government owned operator, primarily provides the direct service of mains water supply and wastewater removal to homes and businesses connected to the mains water network [27]. Both run programs intended to address water efficiency and resilience in the urban context [28,29]. The Water Corporation provides recognition, through their Waterwise Development program, to land development projects that have met certain criteria around water performance [30]. At the Commonwealth Government level there is a national scheme, the Water Efficiency and Labelling Standards (WELS) scheme [31,32], to address water efficiency of appliances, fixtures, and fittings. Despite these various programs, there are very few attempts to make water performance and management a key theme of a residential development evident in the literature.
In another innovative approach, the WGV precinct has set a series of ambitious targets at the beginning of the project for water efficiency and design that are above the standard in Western Australia. The implementation of a comprehensive metering and monitoring system was undertaken to robustly test the outcomes in a commercially viable and mainstream residential precinct to highlight approaches that can be taken by designers and developers of households and precincts to go beyond business-as-usual water practices.

1.2.1. WGV Typologies

There are three main typologies, or forms of residential dwelling, at WGV:
Detached dwellings: There are 22 detached (no common walls) completed residential dwellings on lots ranging in size from 250–350 m2. A site that had previously been proposed as a group dwelling site has now been subdivided into six lots that have detached dwellings now under construction. Each of these lots has metered connections to mains water and groundwater irrigation supply. Most also have a rainwater system plumbed into the home that is also metered.
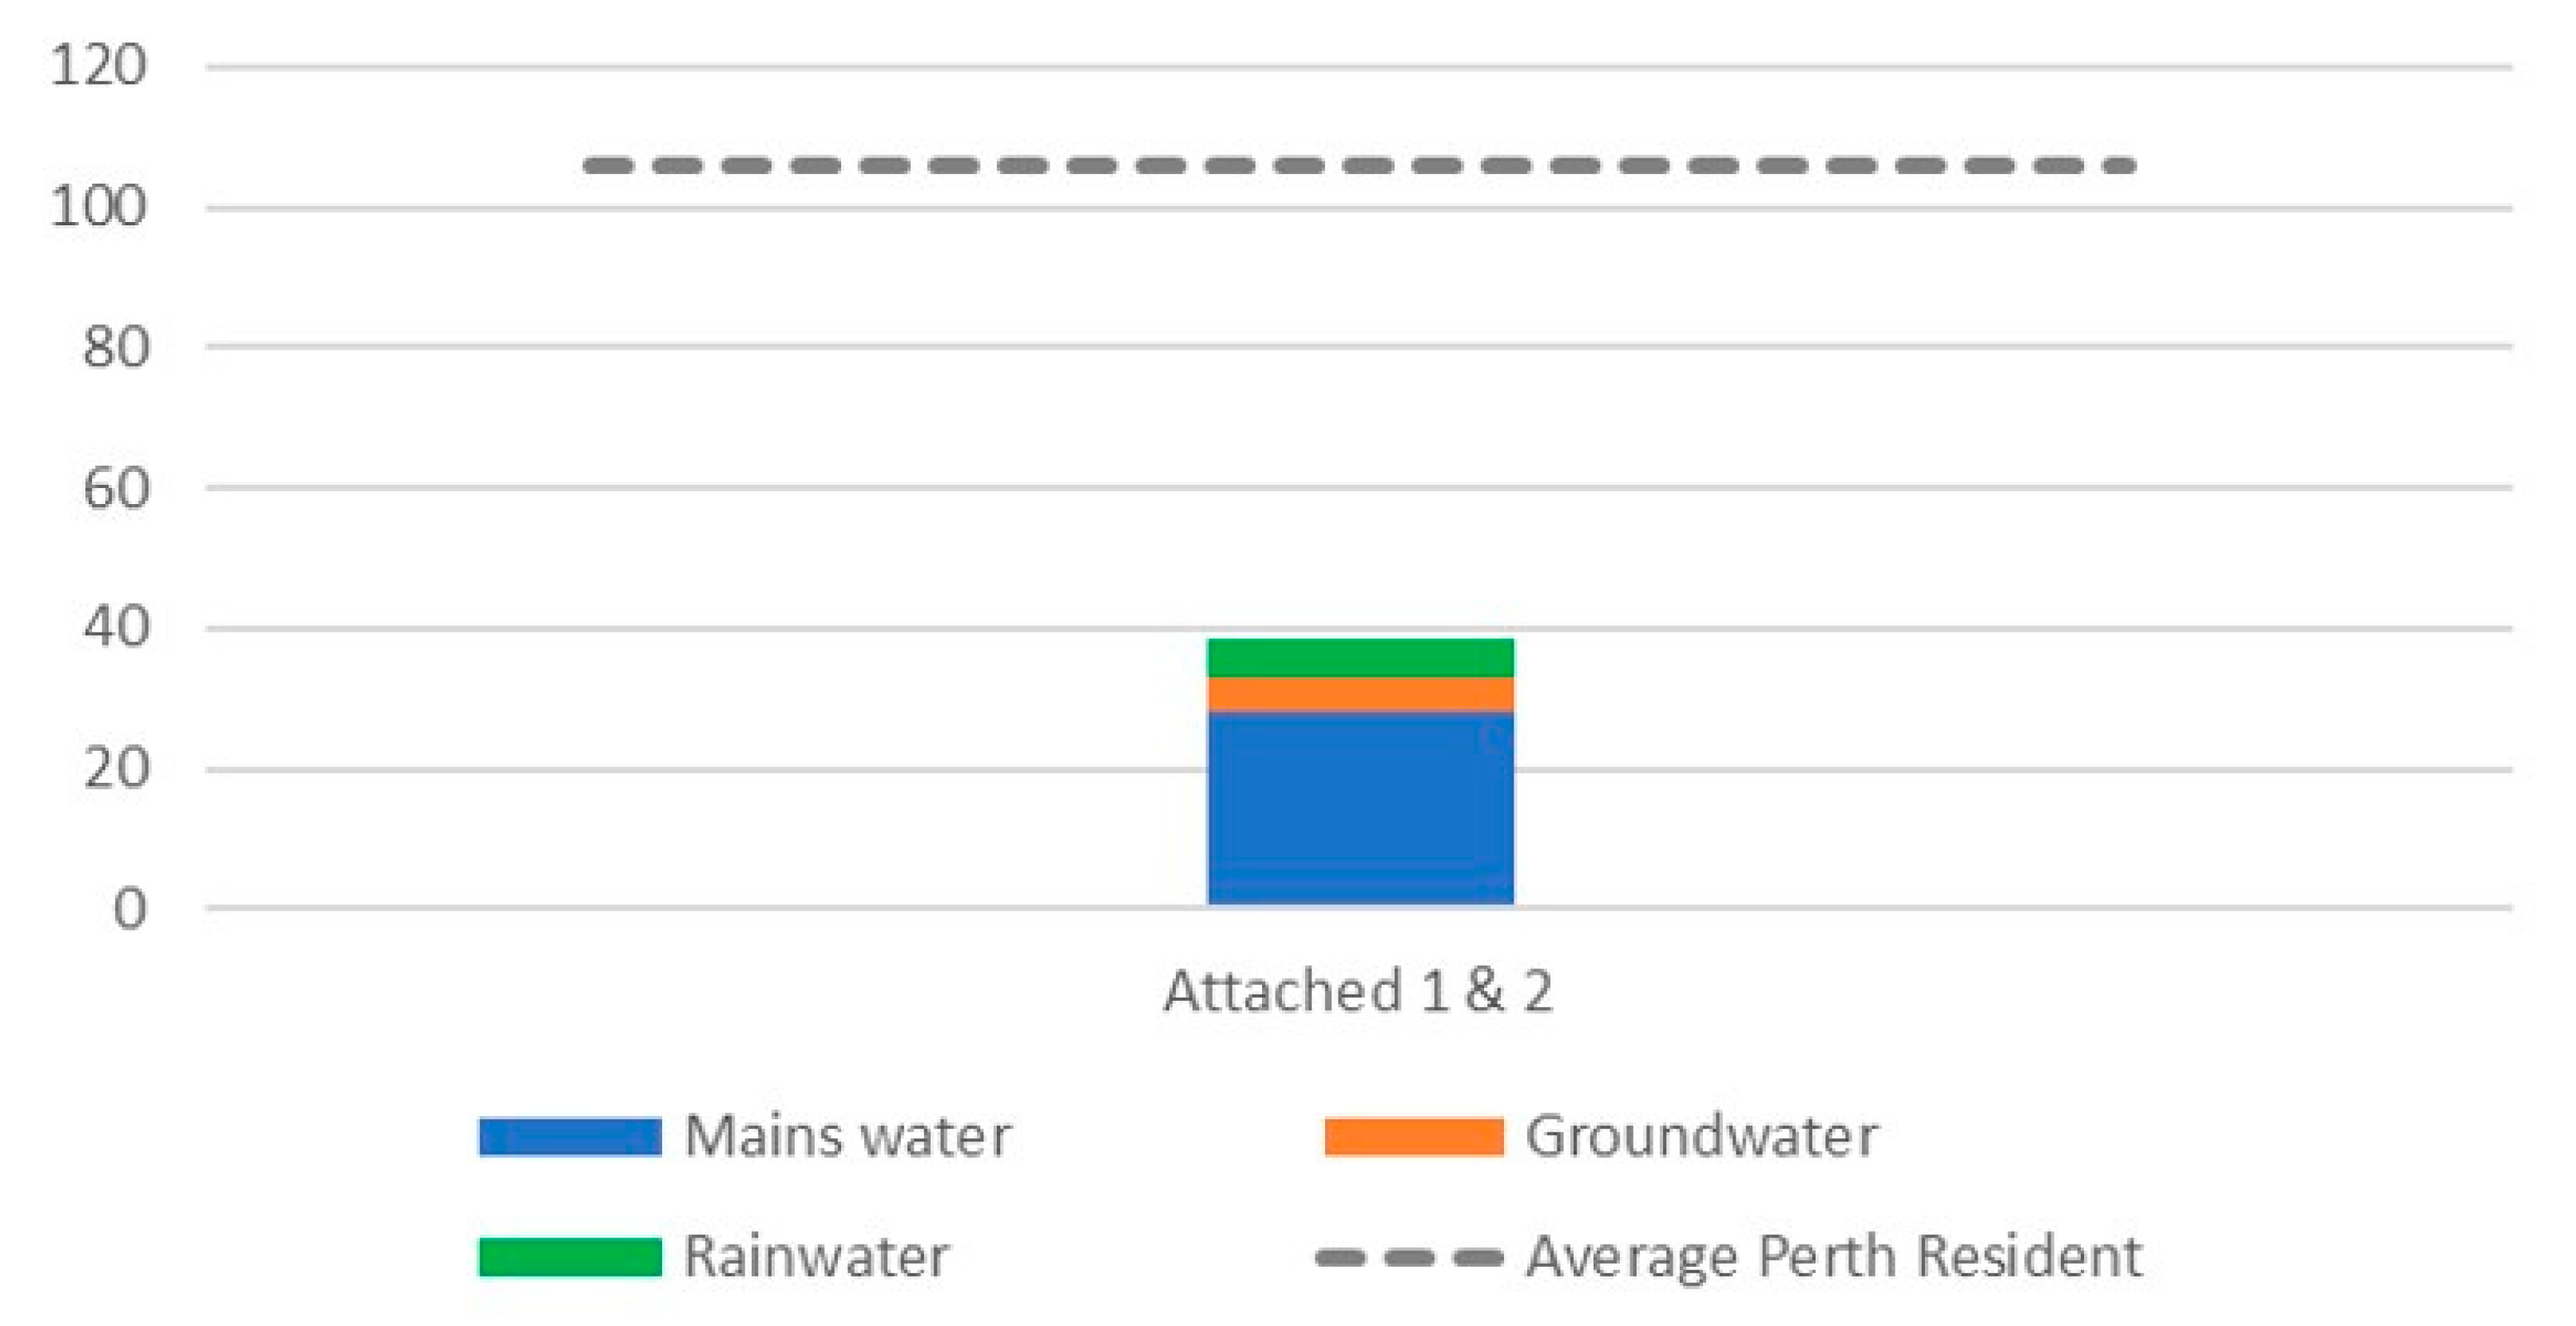
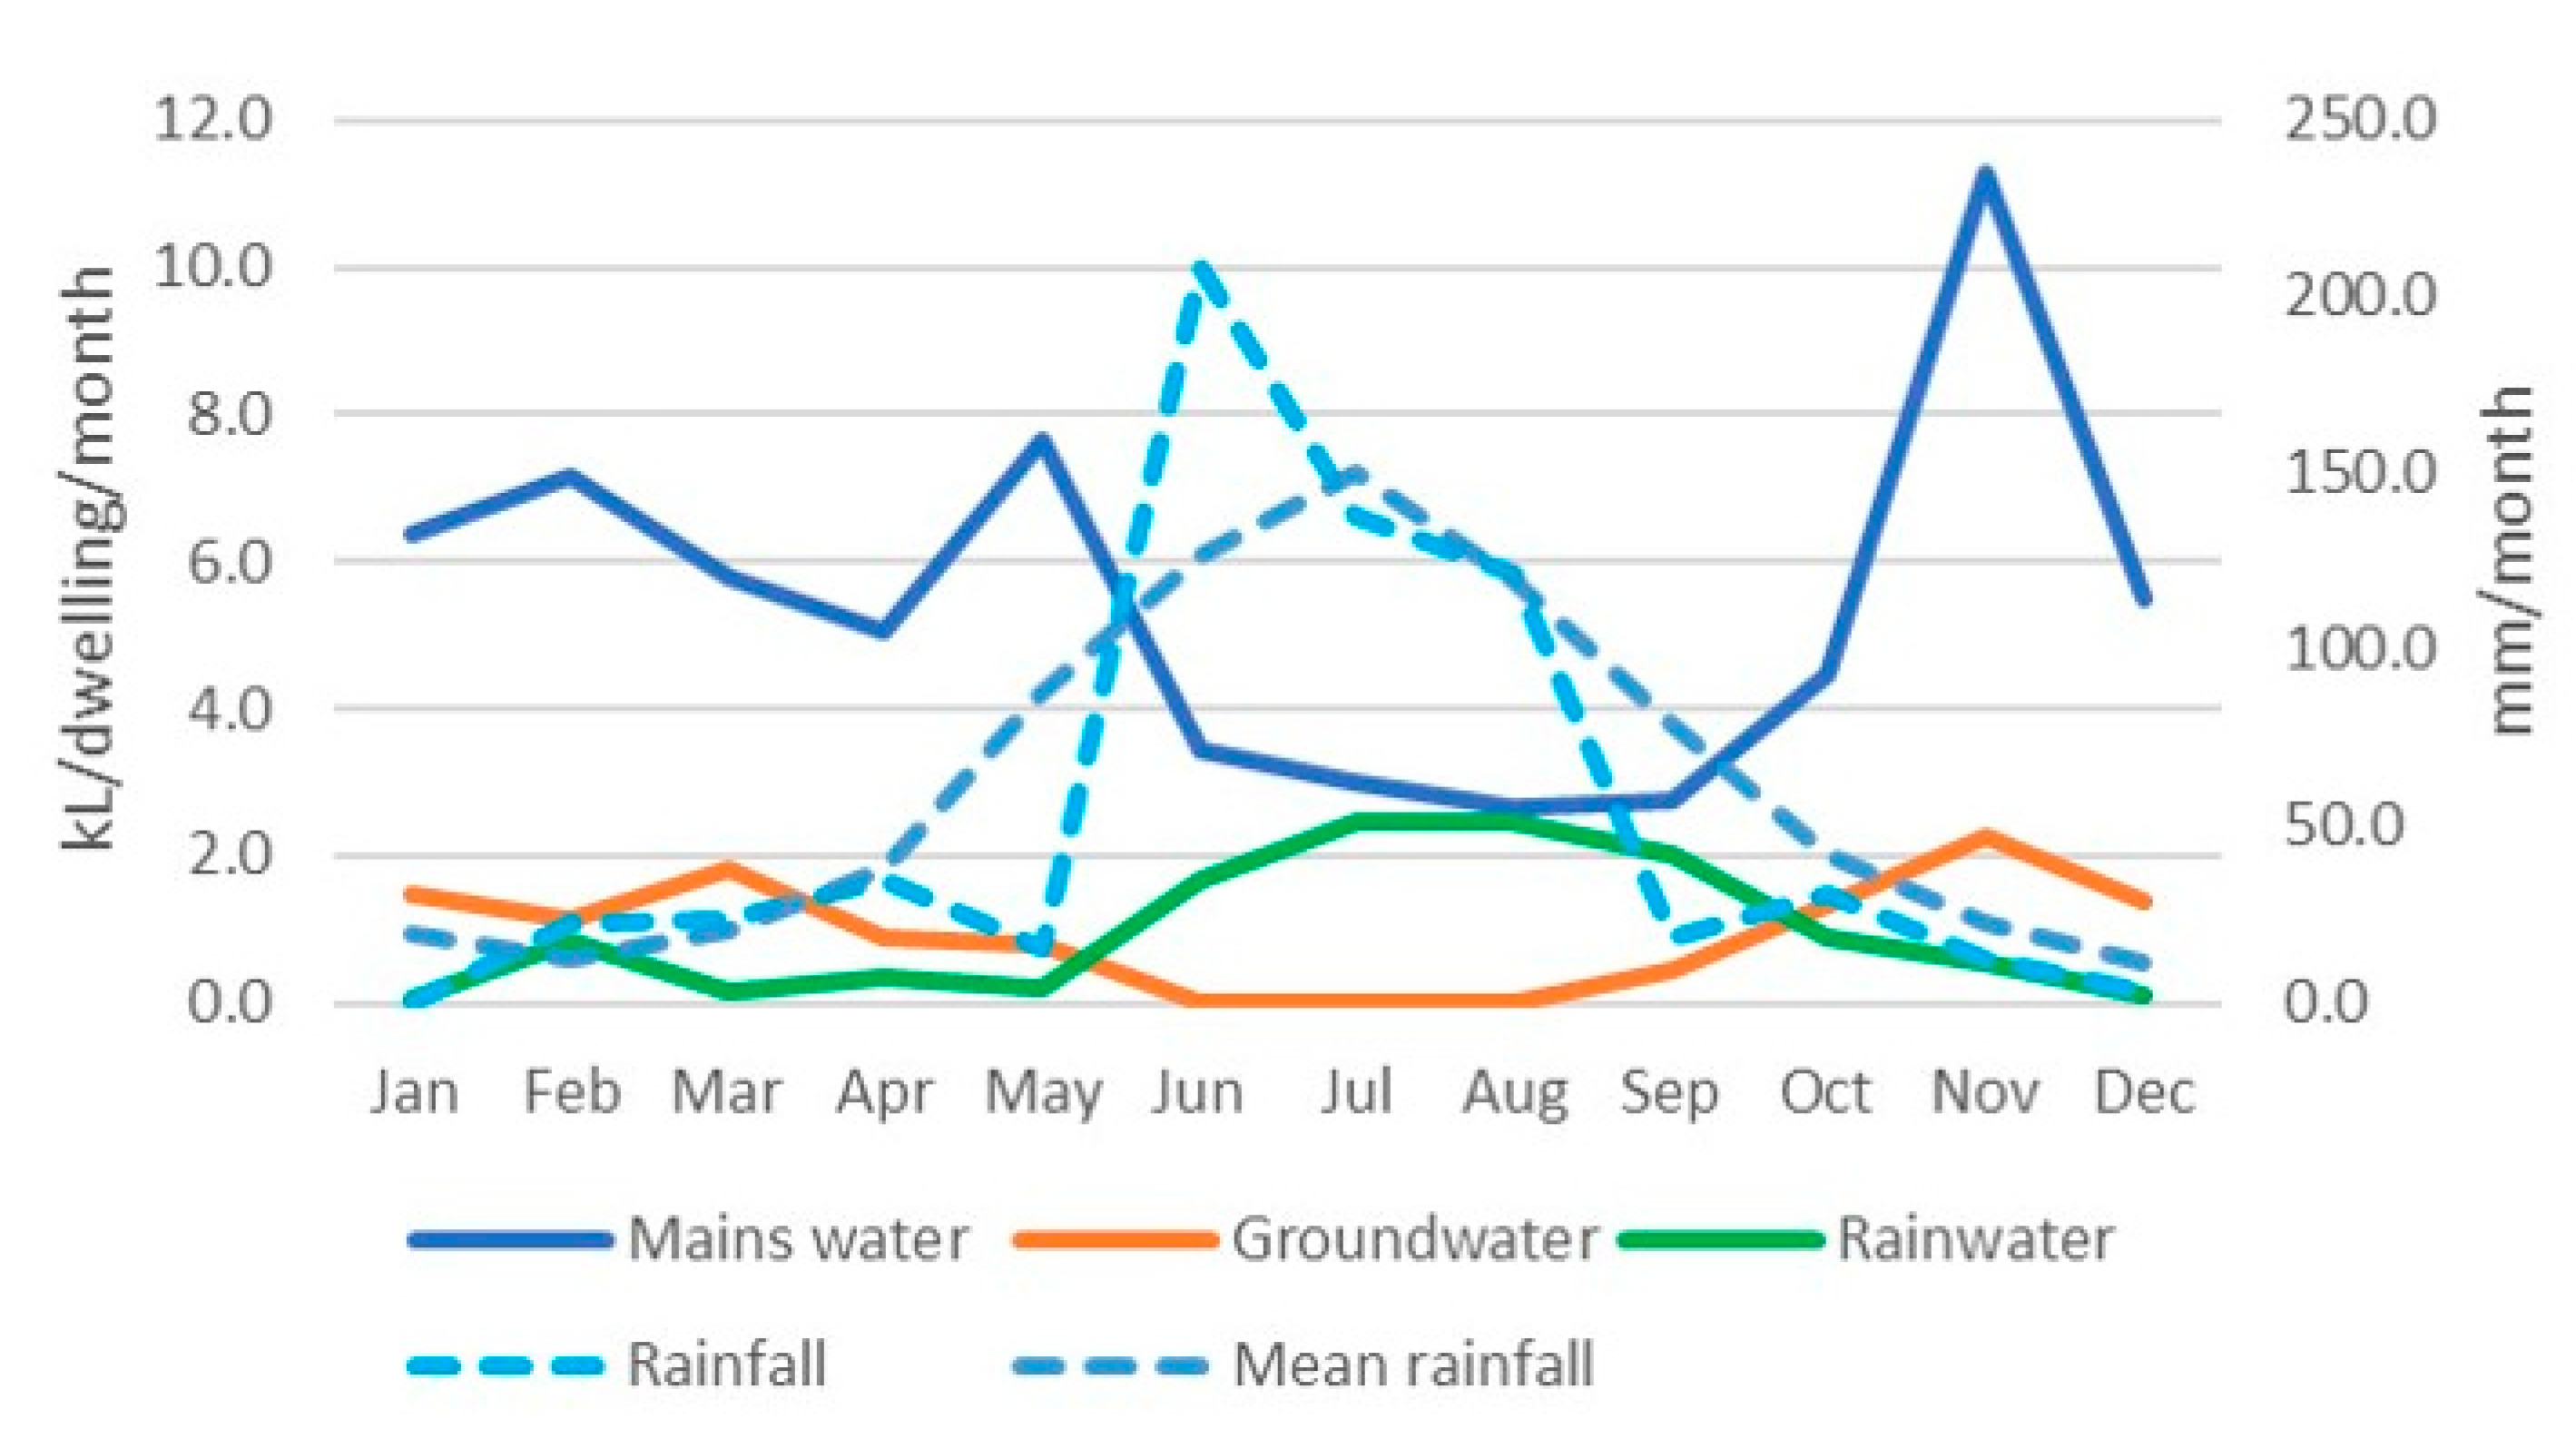
Attached dwellings: There is one duplex site at WGV. The two attached dwellings on this site share a rainwater system, and their mains water supply is connected at a single meter. They are connected to the community groundwater bore for irrigation supply, again at a single point of supply for the site.
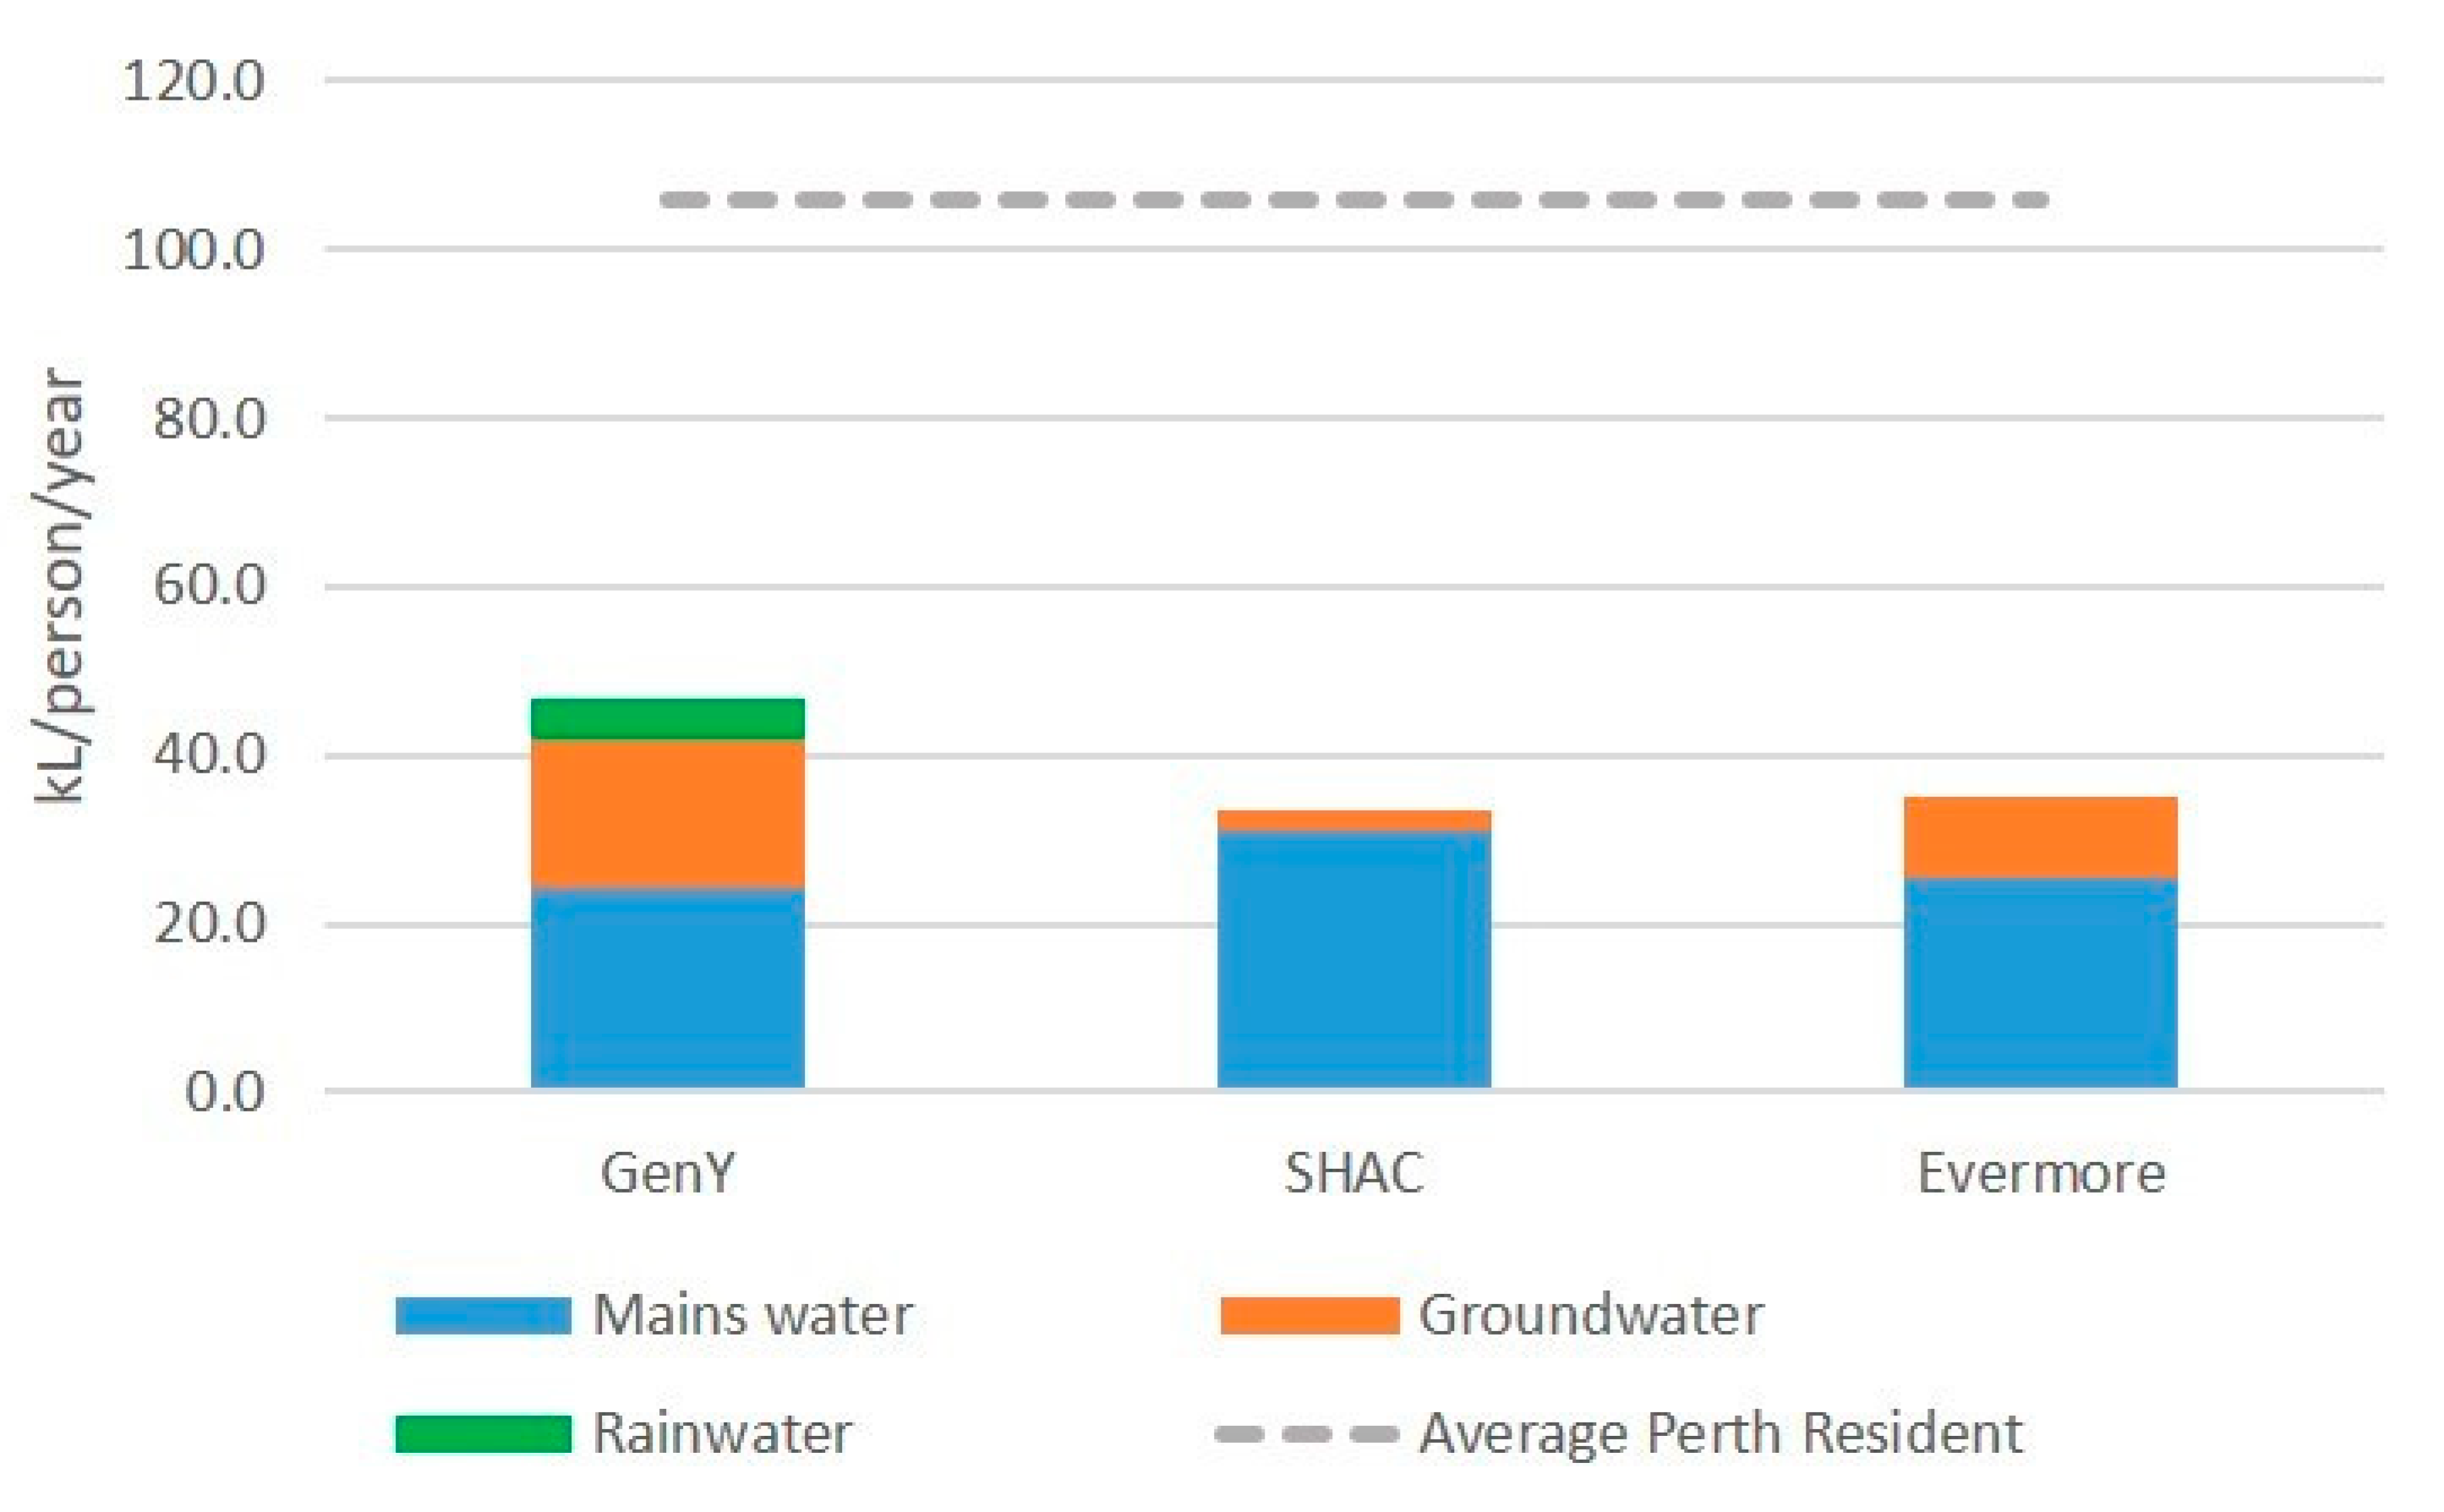
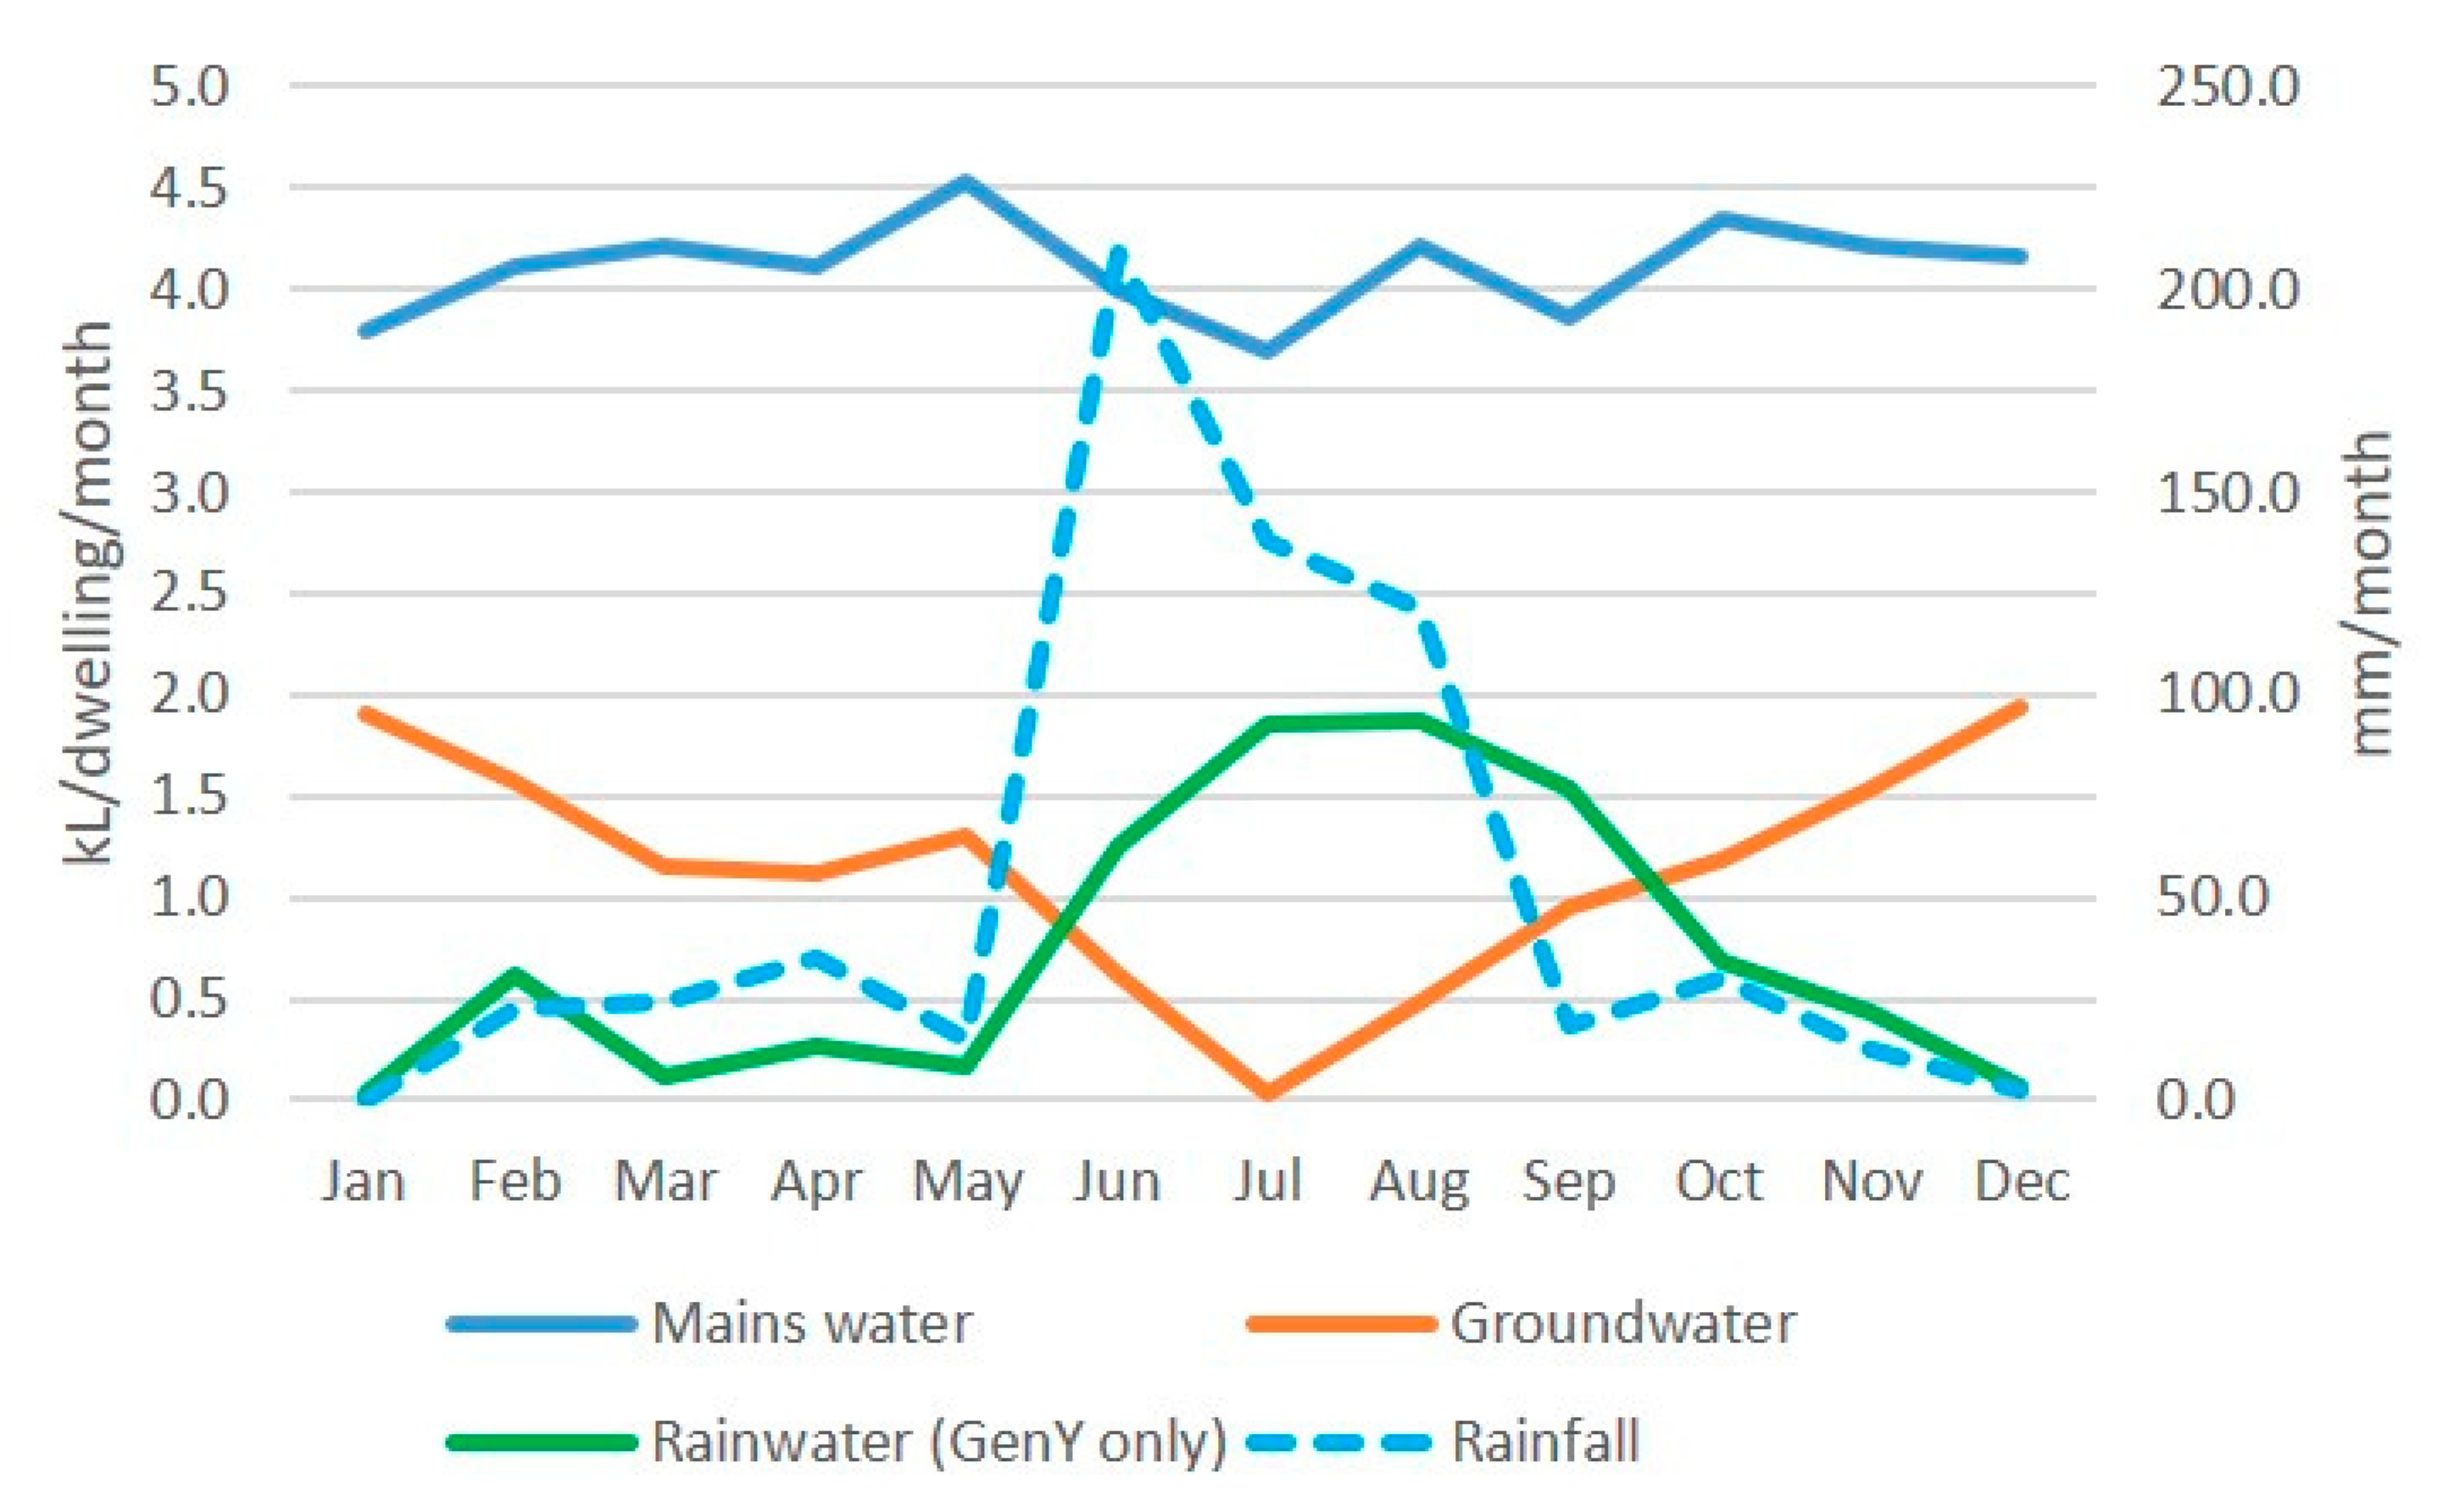
Apartments (multi-residential dwellings): There are four apartment sites at WGV, with three built and occupied as of mid-2020. As well as individual apartment metering of mains water consumption, the complexes have site level metered connections to mains water and irrigation supply. The sites include: the Sustainable Housing for Artists and Creatives (SHAC) apartments that contain 12 dwellings plus two studios, which have water consumption being monitored; the Evermore apartments (24 dwellings), which are almost fully occupied; GenY Demonstration House, which consists of three apartments, all occupied, on a single house footprint; and Lot 2, which will be developed in the future as an apartment building.
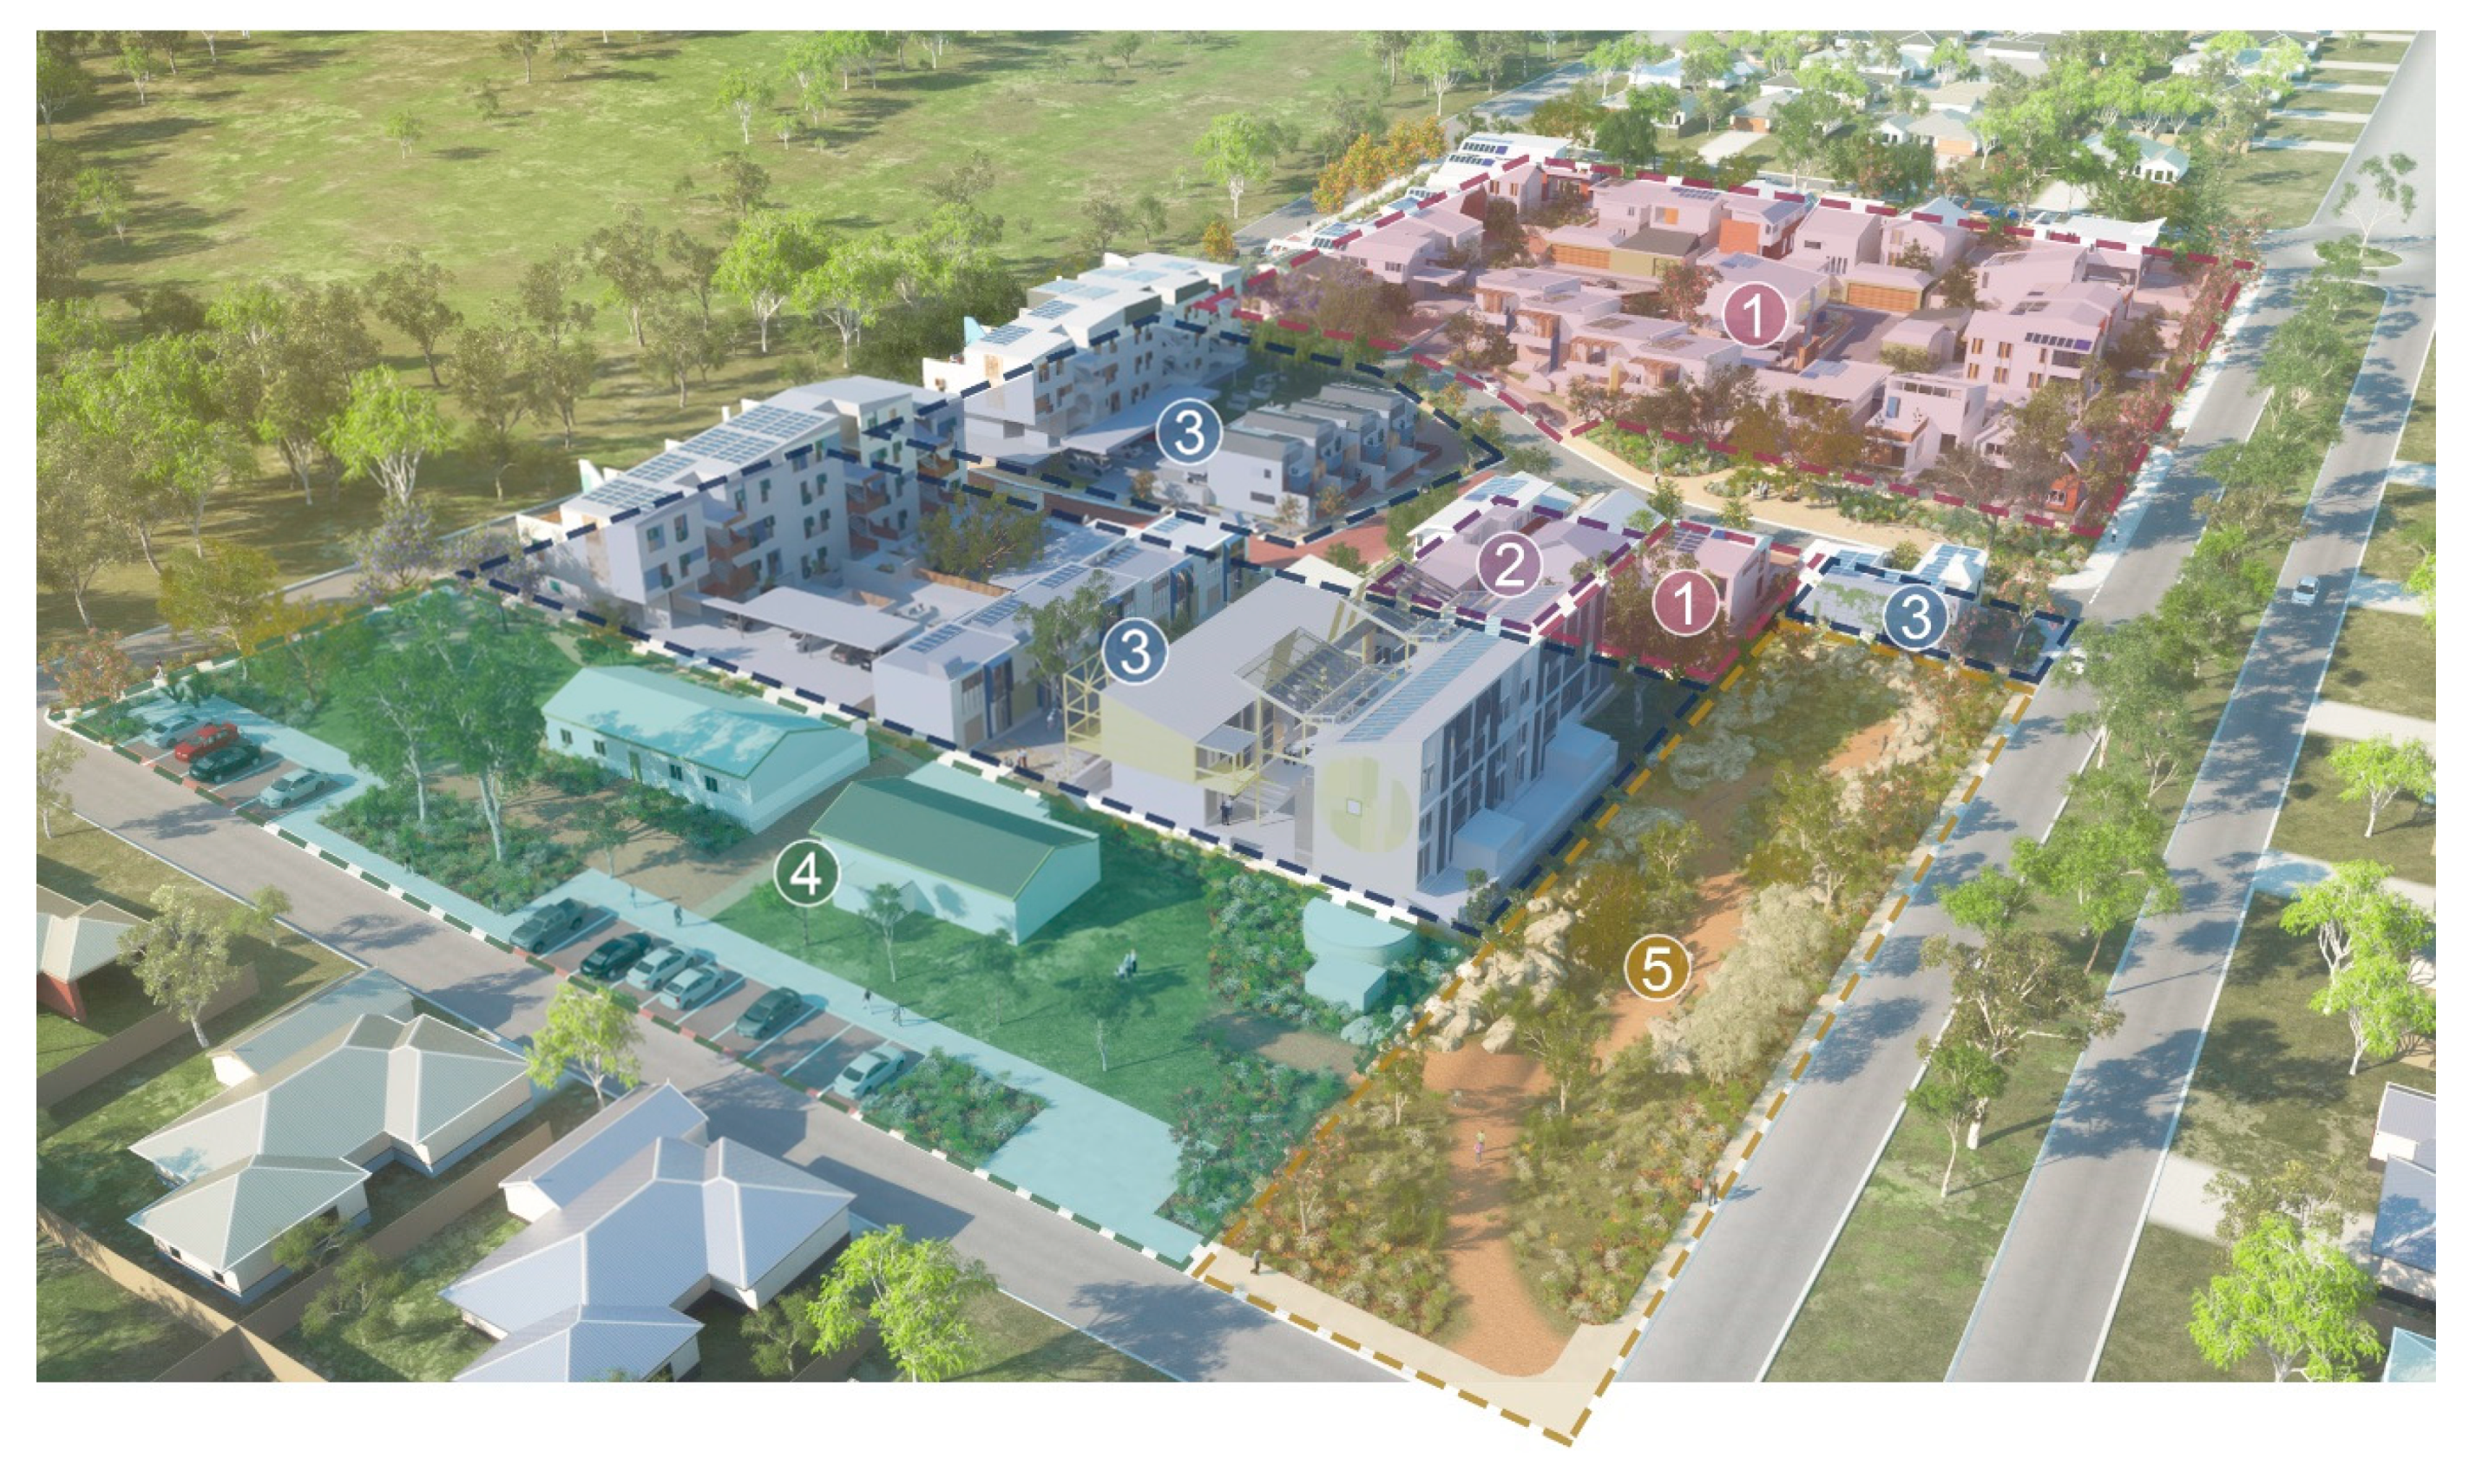
Figure 1 shows the layout of WGV including lot arrangement, roads, laneways, and verges. It also shows early concepts of the eventual building footprints at WGV, which is a close approximation of what has now been constructed.

1.2.2. Occupancy

The actual occupancy figures for the various typologies at the WGV precinct are not known. The Australian Bureau of Statistics does not provide occupancy rates specific to these typologies, so suitable figures have been inferred from what is available for use in water modelling. Table 1 shows the occupancy figures used in this paper along with the expected accommodation figures, totally approximately 190 residents across the three typologies [13].

1.2.3. Research and Demonstration Programs at WGV

The WGV precinct integrates a unique set of leading-edge mains water reduction strategies with climate sensitive considerations and creative urban greening to be the first certified ‘One Planet Community’ in Western Australia [34]. The WGV Waterwise Development Exemplar is a collaboration between DevelopmentWA, Water Corporation, and other parties to monitor, analyse, and communicate the water management outcomes at WGV. The WGV Waterwise Development Exemplar is testing the objective of reducing mains water consumption by 60–70% compared to the Perth average mains water consumption through various initiatives deployed at the site, including efficiency measures, rainwater harvesting, and a precinct-scale groundwater irrigation scheme for both residential and public green space [13].

2. Mains Water Reduction Initiatives

This section outlines the key mains water reduction initiatives put in place at WGV and provides some detail on how they were implemented. It also shows the modelling results based on these strategies, which informed the original performance targets.

2.1. Density Savings

Conventional housing in Perth is considered as low density, often with zoning of residential code (R) 20 lots per hectare with an average size of 450 m2 [35]. Lots at WGV have been designed in densities at R35 (medium density) to R80 (high density), with the average lot size being 288 m2; this includes 35 m2 of paving, 30 m2 of turfed area, and 27 m2 of garden. Using the Water Corporation regulation of two 10 mm watering events per week from September through to May [36], it was modelled that a reduction in mains water consumption of 25 kL/person/year would be achieved.

2.2. Indoor Water Efficiencies

The Building Code of Australia specified minimum water efficient fixtures for all future housing in Western Australia in 2014 [37]. The water reduction savings were estimated to be 10 kL/person/year for modelling. The developer, DevelopmentWA, mandated further indoor water efficiencies as seen in Table 2. This was modelled to reduce mains water consumption by a further 7 kL/person/year.

2.3. Landscape Initiatives

Development controls and design guidance were also put in place to improve outdoor water use efficiency as outlined in Table 3. These combined landscape initiatives were modelled and predicted to reduce mains water consumption by 7 kL/person/year.

2.4. Metering and Monitoring

Average mains water loss from leakage in the Perth metropolitan scheme is estimated at 4 kL/person/year [38]. The implementation of real time monitoring of connected water meters will allow for early leak detection, leading to the elimination of these leakage losses.

2.5. Behaviour Change

DevelopmentWA has provided residents with factsheets on water consumption with the aim of educating residents to reduce their own consumption. Modelling assumed that savings from behaviour change would be 5 kL/person/year.

2.6. Rainwater Harvesting

The supply and installation of a 3 kL rainwater tank with a pump and controls was available via the developer’s sustainability package for those building on detached and attached lots. Rainwater tanks have been installed at all detached dwellings that are currently occupied, and the two attached dwellings share a single, larger rainwater tank. Design guidelines mandate dual plumbing to toilets and washing machines, provision of enough space for a rainwater tank, and sufficient connected roof catchment area. The GenY House includes 10,000-litre underground rainwater tanks connected to a dual plumbed circuit supplying toilet cisterns and washing machines in the three apartments. Modelling indicated that savings from rainwater harvesting would be 10 kL/person/year.

2.7. Precinct-Scale Groundwater Irrigation Scheme

Groundwater from the superficial aquifer is supplied via a centrally controlled third pipe (purple pipe) system. Design guidelines stipulate that irrigation systems and controllers must be installed for optimal efficiency. The precinct-scale groundwater irrigation scheme is connected to all lots and is metered at each connection. Metering is for data gathering as the water supply is paid for through an annual charge, rather than billing being based on consumption. Most owners have connected their garden reticulation system to the irrigation scheme. The community groundwater bore was designed to deliver 5000 kL/year, with an expected split of 48% private irrigation and 52% public realm irrigation. Modelling indicated that private irrigation mains water savings resulting from substitution with groundwater would be 15 kL/person/year.

2.8. Summary of Modelled Outcomes

This modelled outcome provided some confidence that an ambitious approach to mains water reduction was in place in the early stages of the project, and now provides a basis for comparison to the real-world measured results at WGV. The overall mains water reduction target for the project was set in the context of the agreed set of strategies at 60–70%. The rationale for a range rather than a set figure had several elements:
  • Uptake of some initiatives was uncertain. In particular, rainwater systems were voluntary, and unlikely to be incorporated into the apartment complexes, as this is very unusual in Western Australia.
  • It provides some commercial comfort to the developer, indicating to the project team that the lower limit is a minimum but that targeting much higher performance was not expected to be commercially viable.
  • It acknowledges the uncertainty of modelling versus the real world.
The selected initiatives and modelled performance were fed back into the project planning and design to determine.

3. Results

This section reports on water consumption patterns for dwellings and residents in WGV from the most recent full year of data. There is some variation in the exact dates used, as some typologies were missing data due to a period of some dwelling being unoccupied or building works interrupting the data flow. By typology of building, date ranges for data are:
  • Detached: 1 March 2019–1 March 2020 (366 days)
  • Attached: 1 March 2019–1 March 2020 (366 days)
  • Apartments, GenY House: 10 February 2019–10 February 2020 (365 days)
  • Apartments, SHAC: 15 November 2018–15 November 2019 (365 days)
  • Apartments, Evermore: 10 February 2019–10 February 2020 (365 days)

3.1. Overview of WGV Dwellings Water Consumption

Figure 2 shows a profile of annual per-person water consumption by source for each of the three main typologies. It also shows the Perth average per-person annual consumption for comparison [38].
Table 4 shows the numerical breakdown of consumption by source for each of the three main typologies. This also considers the Perth average mains water consumption of 106 kL/person/year [38]. Overall the project has reduced mains water consumption by 65% on a per-person/per-year basis compared to the typical Perth resident.

Overall Comparison of Results to Modelled Predictions

The original target for reduction in mains water consumption was 60–70% of the Perth average [11], based on the initial suite of mains water reduction strategies. The measured results indicate a reduction of 65%. The constraints and learnings around optimal performance are discussed later in the Discussion section of this paper.

3.2. Detailed Results—Detached Dwellings

Not all dwellings had sufficient usable data for meaningful analysis. The results for detached dwellings are based on performance data collected from fourteen reference dwellings. Nine dwellings recorded data for all water sources (mains water, groundwater, and rainwater). Three dwellings show data from mains and rainwater only, and two show data from mains water and groundwater only. This is not unexpected, as some detached dwelling owners had chosen not to connect to the community groundwater bore, possibly due to not fully understanding the system, while others had yet to make their rainwater tank fully operational.
A variation in water use between the detached dwellings is observed in both quantity and pattern of consumption. Figure 3 shows the breakdown by source for the reference detached dwellings.
The interaction of consumption by detached dwelling lots from the three different sources, and the interaction of consumption with rainfall, is illustrated in Figure 4. Note that this chart and those that follow show monthly quantities per dwelling, rather than the per-person units that are generally in use in this paper. Figure 4 clearly shows a response to cooler weather and rainfall, with mains water and groundwater consumption dropping off as use of rainwater increases. The decrease in mains water consumption in autumn is not as relatively significant as the decrease in groundwater consumption but is larger than the increase in rainwater consumption. This would indicate that some households are using mains water for irrigation (or hand watering), and that it may be a significant portion of the overall mains water consumption at WGV.

3.2.1. Detached Dwellings—Measured Versus Modelled Performance

Preliminary modelling anticipated that detached dwellings would consume approximately 30 kL/person/year of mains water, 12 kL/person/year of groundwater for irrigation purposes and 10 kL/person/year of rainwater for non-potable indoor water uses. Table 5 shows how the performance data compares. Mains water consumption is considerably higher than was modelled. It is apparent in the results that some households are irrigating with mains water, which would be having some impact. It will be interesting to repeat this analysis when the development has been longer established to understand if there is an early period peak that settles with time. Possible explanations for the lower groundwater and rainwater consumption are discussed in the sections below.

3.2.2. Detached Dwellings—Groundwater

Average consumption of groundwater for irrigation in detached lots was 13 kL/person/year, in line with the modelled prediction of 12 kL/person/year. Looking further into the consumption on groundwater for detached residents within WGV, it was identified that some residents were not turning off their reticulation system during the winter months. The Water Corporation winter sprinkler switch off applies to all scheme and bore water users in Perth, Mandurah and some parts of the South West and Great Southern from 1 June to 31 August every year [39], which runs in parallel to the DWER Winter Sprinkler Ban applied between the same dates [40]. Some WGV detached dwellings appear to be irrigating through this period, with the data showing a minimum groundwater consumption of approximately 1 kL/dwelling/month on average during these months. The consumption trend can be seen in Figure 4. Detached dwellings at WGV are using at least 19% of their total water consumption for irrigation with groundwater. It is likely that some irrigation with mains water is also occurring, but the total proportion is expected to be less than the typical Perth home, reflecting the density savings of smaller lots and gardens, along with the more efficient irrigation systems mandated in the WGV Design Guidelines.

3.2.3. Detached Dwellings—Rainwater

The performance data shows that residents of detached dwellings at WGV consume around 4 kL/person/year of rainwater through their household rainwater systems. This is significantly less than the modelled prediction of 10 kL/person/year. Figure 4 shows the consumption pattern (in per-dwelling monthly figures) against the actual rainfall for the period and the mean rainfall from all years on the record [41]. Rainfall was down for the study period compared to the mean rainfall on record: 629 mm/year compared to the mean of 729 mm/year for this location. This is not sufficient to fully explain the shortfall on actual rainwater consumption compared to the modelled prediction, which may also be the result of systems not operating optimally, or incomplete data sets, or residents disconnecting the systems. More work would be required to survey residents and observe the systems in more detail to determine if the modelling assumption was simply too high.

3.3. Detailed Results—Attached Dwellings

The data collection for the attached dwellings at WGV was collected from March 2019 until March 2020. There is one pair of attached dwellings at WGV, both connected through shared mains, groundwater, and rainwater with combined data available but with no breakdown of the individual dwellings. The summary of consumption by source for attached dwellings at WGV is shown in Figure 5, noting that the results are representative of each dwelling because the metered volumes from the shared services have been divided by two. The attached dwelling water results demonstrate a major reduction in comparison to the typical Perth home with a 63% reduction in total water consumption and a 73% reduction in mains water consumption.
The attached dwelling water source profile indicates a stronger reliance on rainwater than the other typologies and relatively less use of groundwater for irrigation. Anecdotally, the dwellings make use of a simple greywater diversion system to irrigate some of the garden. It may be that the type of garden is relatively less water intensive. The owners of these lots installed a larger, shared rainwater system of a slightly different type to the detached dwellings. This level of interest and investment in the system may be leading to more effective operation, hence the larger proportion of demand being met by rainwater.
Figure 6 illustrates the interaction of the three water sources over time and rainfall records from the same period in WGV attached lots. Mains water consumption reduces as cool weather and rainfall arrives in late autumn. In the case of the attached dwellings, this appears to be aligned to the increase in rainwater consumption, indicating that it is unlikely that significant amounts of irrigation from mains water are occurring.

3.3.1. Attached Dwellings—Measured Versus Modelled Performance

Table 6 shows the comparison of modelled to measured performance by source in the attached dwelling lots. The attached lots are in good alignment to the modelling on mains water consumption, but both groundwater and rainwater consumption are lower than modelled. Possible explanations for the lower groundwater and rainwater consumption are discussed in the sections below.

3.3.2. Attached Dwellings—Groundwater

Attached dwellings consume on average 5 kL/person/year groundwater for irrigation. This is significantly less than the modelled prediction of 15 kL/person/year. Consumption of groundwater during the summer is somewhat variable month to month, which may indicate that residents are responding to weather and intervening in the irrigation schedule to suit. Knowing anecdotally that there is a grey water system in place providing irrigation of some of the gardens at these lots, the marked difference between the modelled and measured consumption of groundwater may be the result of an additional source of irrigation water combined with attentive irrigation management.

3.3.3. Attached Dwellings—Rainwater

Attached dwellings consume on average 5 kL/person/year of rainwater. This is less than the modelled prediction of 10 kL/person/year. Figure 6 presents the rainwater consumption (L) for the attached dwellings at WGV against the modelled and actual annual rainfall (mm). Mean rainfall from all years on record is also shown. The dependence of the rainwater supply on rainfall is clearly illustrated. The actual rainfall during the study period was lower than the mean rainfall: 629 mm total for the study year versus 729 mm for the mean of all recorded years. This is significant but not sufficient to explain the difference in actual to modelled rainwater consumption. As with the discussion of the results for detached dwellings, modelling assumptions may need to be reconsidered on the basis of these results.

3.4. Detailed Results—Apartments

There are three multi-residential buildings completed and occupied at WGV: the GenY house, SHAC, and Evermore. Another multi-residential building is planned on a currently undeveloped site at WGV, Lot 2.
Figure 7 provides an overview of the three apartment buildings’ water consumption by source. Of the three apartment buildings, only GenY has a rainwater system. The system is similar to the detached and attached dwelling rainwater systems in that is supplies toilet cisterns and washing machines when rainwater is available. The small amount of rainwater in the profile is indicative of GenY having three apartments compared to twelve (plus two studios) at SHAC and twenty-four at Evermore. In Western Australia it is very unusual to see rainwater use in apartment buildings. The GenY House has a higher overall level of water consumption per person, which is mainly driven by higher groundwater consumption. This is to be expected given the larger area of garden relative to the number of residents. Anecdotally, it has been suggested that SHAC residents use more mains water to irrigate private courtyards because of the way their irrigation system was installed. This would explain the higher mains water and lower groundwater consumption profile compared to the other apartment buildings.
Figure 8 illustrates the interaction of the three water sources over time and rainfall records from the same period in WGV apartments. Note that only the three apartments at the GenY House have rainwater connected; hence, it is plotted per these dwellings rather than averaged across all apartments. Mains water consumption is slightly variable but does not noticeably reduce as cool weather and rainfall arrives in late autumn. There is a to-be-expected increase in rainwater consumption with rainfall. The variability from month to month is less with this typology, reflecting the larger number of residents, with a diversity of individual water consumption patterns, that have been combined here.

3.4.1. Apartments—Measured Versus Modelled Performance

Table 7 compares modelled predictions for apartments buildings to the measured water consumption. The measured mains water and groundwater consumption closely match the predicted figures. Possible explanations for the lower rainwater consumption are discussed in the relevant section below.

3.4.2. Apartments—Groundwater

Average consumption of groundwater for irrigation in detached lots was 8 kL/person/year, in line with the modelled prediction of 8 kL/person/year. The consumption of groundwater at the WGV apartment buildings is for irrigation of shared landscape and private courtyards where they exist. Figure 8 indicates that residents and property managers are turning off their shared reticulation system during the middle of winter but continue some watering in the cooler months. The data indicates that 22% of water consumption in the apartment buildings is groundwater for irrigation.

3.4.3. Apartments—Rainwater (Gen Y Only)

Figure 8 shows that residents of the three Gen Y apartments consumed on average 5 kL/person/year, in line with the detached and attached typologies. As previously discussed, rainwater is not typically a water source for apartment buildings in WA; however, the rainwater system at GenY can effectively respond to rainfall and make it available to apartments for appropriate (non-potable) indoor uses. The system at GenY has demonstrated that small apartments can make use of 5 kL/person/year of rainwater, comprising around 11% of annual demand. The difference between modelled and actual results is consistent with the other typologies and indicates again that modelling assumptions may need to be revisited.

3.5. Overall Resulting Water Balance for WGV

Figure 9 shows a water balance for WGV as a whole. The inputs have been determined from measured results, while the outputs are based on the input sources and assumptions about potable water use.

4. Discussion and Conclusions

The ambition of the WGV Precinct was to create an exemplar project demonstrating the implementation of a suite of initiatives to target stretch reductions in mains water consumption. From a review of the literature it can be seen that few projects set explicit targets for water outcomes, and fewer still attempt to robustly measure and publish the real-world results of the water strategy. This section reflects on the lessons learned through implementing the water initiatives at WGV, as well as providing a comparison of the results with published figures from two other Australian residential development projects for context.

4.1. Governance

The nature of land development is that there are many stakeholders and a commercial imperative that will generally have primacy over researcher needs. DevelopmentWA’s enthusiasm for both the ambition of the WGV sustainable water management initiatives and the value of monitoring and being transparent about the outcomes was an enormous advantage. Notwithstanding that support, the management of stakeholders and the practicalities of gathering data and publishing results should not be underestimated.

4.2. Technology

The WGV water data gathering system had three main elements:
  • Telemetry for meters in the field (property meters): Battery operated data loggers by Outpost Central [42], connected through the GSM network, and the Outpost Central data platform were selected, because these were in use by Water Corporation, who was a key partner in the project. These worked well in general but even the best systems require commissioning and managing. Having some of these devices on private property made diagnosis of problems very time-consuming and occasionally resulted in loss of data. If they could have been located in an easily accessible location on the edge of the properties, and if a simple testing mechanism were available to run diagnostics in the field, much time could have been saved and the early data would be more complete.
  • Apartment metering: Individual apartments were metered via a building-scale data logger that was implemented by a third-party provider as part of installing energy systems in the apartment buildings. Unfortunately, although basic metering is well understood, the tools for gathering detailed interval data and for parsing that data effectively are not as established.
  • Storage and access: the data is being stored and made accessible through Curtin University’s Institute for Computation. This is an excellent outcome, and the system is functioning well now, but the reality is that parsing of data to ensure that it is complete and within bounds is not as straightforward as might be imagined. Without an intimate understanding of the subject that is being monitored, the process cannot be effective. Part of the system design should be to establish acceptable ranges for all inputs and to establish a useful response to out-of-bound and other errors.

4.3. Commissioning and Maintenance

A principle of implementing these systems is that they will not function effectively in the first instance—this should be the starting assumption. System design should include the design of a robust commissioning process, ensuring that any conceivable difficult scenario is tested. A gateway system that spells out the required performance of each element of the system and includes a strong incentive, such as a financial incentive or penalty, should be a minimum.

4.4. Dashboard Access for Residents

Although it is well understood that dashboard systems, which provide access to a resident’s own consumption data, often have limited engagement [11], they can still be a valuable tool to alert householders about unexpected consumption trends and the diagnose of defective equipment in their home. This provides an enormously useful addition to the commissioning process through that early stage interest in how the home systems are performing. The complexities described in system commissioning and troubleshooting resulted in dashboard access coming later than it otherwise might have, when ideally these interfaces would be a priority.

4.5. WGV Comparison to Two Selected Projects

Table 8 compares the results at WGV to those from two other projects that have implemented ambitious mains water reduction strategies. It also happens that all three projects have been delivered by State agencies. The two selected projects are:
  • Lochiel Park: a 15 ha development in South Australia [19]. The project targeted a 78% reduction in mains water consumption through the integration of rainwater and stormwater harvesting as well as water efficiencies and conservation.
  • Aurora Estate: a 700 ha development that accommodates over 25,000 people in Victoria [20,21]. The development aimed to reduce mains water consumption by 72% in comparison to the state typical residents. Mains water reduction strategies included the implementation of rainwater harvesting and a community-scale recycled water scheme.
All three projects have achieved significant reductions on their local average mains water consumption levels. Perth’s higher average mains water consumption benchmark compared to the other two locations has meant that the reduction at WGV appears proportionally larger. Clearly, there are notable differences: Aurora is a much larger development that presumably faced the challenge of scaling up what must have been quite innovative initiatives at that time, while Lochiel Park has a similar occupancy to WGV but has a larger area with large green spaces. The commonality is in State development agencies making reduction in mains water consumption an objective for high profile projects that are then monitored and performance is reported on publicly.
WGV provides a case study in applying water consumption reduction strategies and alternative water sources in a residential infill development, where the project team has actively sought to create a precinct-scale demonstration of sustainable urban design and housing. The use of a living laboratory experimental design has assisted in understanding how innovations can be applied in real-life developments with consideration of regulatory and technology considerations, leading to findings that can have immediate applications. This case study has shown that large reductions on the average per-person water consumption in WA are possible in well designed, desirable residential infill developments.
Modelling of mains water consumption was overly optimistic for the detached dwellings. Understanding why these household are using more mains water than expected may unlock opportunities on future projects and contribute to the understanding of individual water use influences [9,43]. Further monitoring and analysis of WGV data is recommended, with the addition of targeted surveys of residents and further investigation into the use of the various water sources. This will assist research in how these hybrid water systems, including rainwater and greywater systems, can be integrated into urban water systems [12].The community groundwater bore has been a successful initiative, with consumption largely matching the modelled predictions and showing reasonably good responsiveness to rainfall patterns, indicating that, with some exceptions, this fit-for-purpose irrigation water source is being used responsibly. This adds to the growing body of research calling for their use in urban areas [12,36,44].
Modelling of rainwater consumption in this kind of development may have been based on optimistic assumptions. Whatever the reasons for the disparity, 5 kL/person/year appears to be a more appropriate estimate in this case.
The final water balance at WGV shown in Figure 9 indicates that, on average, the residential typology mix at WGV uses 77% of total water consumption indoors and 23% outdoors. This is a much lower proportion used by residents in gardens than was determined in the Water Corporation’s 2010 study, which indicated that Perth homes typically use 42% of total water consumption for irrigation [38].
There is much more that can be understood from WGV and its growing dataset, along with further comparison of learnings from other residential projects with water reduction initiatives. These insights and learnings from WGV will enable future projects to target even more ambitious water performance. This will contribute to a reduction in urban water demand, alleviating pressures on current and future water systems to supply water for a growing urbanised population and allowing dependent ecosystems to be supported instead.

Author Contributions

Conceptualisation: J.B., M.T., and T.W.; methodology: J.B., M.T., and T.W.; software: M.T. and T.W.; validation: J.B., M.T., and T.W.; formal analysis: J.B., M.T., and T.W.; investigation: J.B., M.T., and T.W.; resources: J.B. and M.T.; data curation: M.T. and T.W.; writing—original draft preparation: J.B., M.T., and T.W.; writing—review and editing: J.B., M.T., T.W., and J.K.B.; visualisation: J.B., M.T., and T.W.; supervision: J.B.; project administration: J.B., M.T., and J.K.B.; funding acquisition: J.B. and M.T. All authors have read and agreed to the published version of the manuscript.

Funding

This research received funding from the Cooperative Research Centre for Low Carbon Living, an Australian Government initiative, and was also supported by Water Corporation.

Acknowledgments

This paper has drawn on the work of DevelopmentWA and their consultants (particularly Josh Byrne & Associates) who were commissioned as part of the design and development of the WGV project.

Conflicts of Interest

The authors declare no conflict of interest. The funders had no role in the design of the study; in the collection, analyses, or interpretation of data; in the writing of the manuscript; or in the decision to publish the results.

References

  1. Campbell, H.E.; Johnson, R.M.; Larson, E.H. Prices, Devices, People, or Rules: The Relative Effectiveness of Policy Instruments in Water Conservation. Rev. Policy Res. 2004, 21, 637–662. [Google Scholar] [CrossRef]
  2. Argent, R. Inland water: Inland Water. In Australia State of the Environment 2016; Department of the Environment and Energy: Canberra, Australia, 2016. Available online: https://soe.environment.gov.au/theme/inland-water (accessed on 2 July 2020).
  3. Water Corporation Our Water Sources. Available online: https://www.watercorporation.com.au/water-supply/our-water-sources (accessed on 2 July 2020).
  4. Water Corporation Perth’s Water Supply. Available online: https://www.watercorporation.com.au/Our-water/Perths-water-supply (accessed on 31 July 2020).
  5. Tian, X.; Galelli, S.; de Neufville, R. Impact of operating rules on planning capacity expansion of urban water supply systems. Urban Water J. 2018, 15, 654–661. [Google Scholar] [CrossRef]
  6. Elimelech, M.; Phillip, W.A. The Future of Seawater Desalination: Energy, Technology, and the Environment. Science 2011, 333, 712–717. [Google Scholar] [CrossRef] [PubMed]
  7. Sapkota, M.; Arora, M.; Malano, H.; Moglia, M.; Sharma, A.; Pamminger, F. Understanding the Impact of Hybrid Water Supply Systems on Wastewater and Stormwater Flows. Resour. Conserv. Recycl. 2018, 130, 82–94. [Google Scholar] [CrossRef]
  8. Ashton, V.; Browne, A.; Lawson, R.; Marshallsay, D.; McCluckie, A.; Rogerson, S.; Sims, A. Integration of Behavioural Change into Demand Forecasting and Water Efficiency Practices; UK Water Industry Research: London, UK, 2016. [Google Scholar]
  9. Breadsell, J.K.; Byrne, J.J.; Morrison, G.M. Household Energy and Water Practices Change Post-Occupancy in an Australian Low-Carbon Development. Sustainability 2019, 11, 5559. [Google Scholar] [CrossRef] [Green Version]
  10. Eon, C.; Liu, X.; Morrison, G.M.; Byrne, J. Influencing energy and water use within a home system of practice. Energy Build. 2018, 158, 848–860. [Google Scholar] [CrossRef] [Green Version]
  11. Breadsell, J.K.; Eon, C.; Morrison, G.M. Understanding resource consumption in the home, community and society through behaviour and social practice theories. Sustainability 2019, 11, 6513. [Google Scholar] [CrossRef] [Green Version]
  12. Schmack, M.; Anda, M.; Dallas, S.; Fornarelli, R. Urban water trading—Hybrid water systems and niche opportunities in the urban water market—A literature review. Environ. Technol. Rev. 2019, 8, 65–81. [Google Scholar] [CrossRef]
  13. Byrne, J.; Green, M.; Dallas, S. WSUD Implementation in a Precinct Residential Development: Perth Case Study. In Approaches to Water Sensitive Urban Design: Potential, Design, Ecological Health, Urban Greening, Economics, Policies and Community Perceptions; Sharma, A.K., Gardner, T., Begbie, D., Eds.; Elsevier: Amsterdam, The Netherlands, 2018; pp. 541–559. [Google Scholar]
  14. Liedtke, C.; Baedeker, C.; Hasselkuß, M.; Rohn, H.; Grinewitschus, V. User-integrated innovation in Sustainable Living Labs: An experimental infrastructure for researching and developing sustainable product service systems. J. Clean. Prod. 2015, 97, 106–116. [Google Scholar] [CrossRef] [Green Version]
  15. Chronéer, D.; Ståhlbröst, A.; Habibipour, A. Urban Living Labs: Towards an Integrated Understanding of their Key Components. Technol. Innov. Manag. Rev. 2019, 9, 50–62. [Google Scholar] [CrossRef]
  16. Von Wirth, T.; Fuenfschilling, L.; Frantzeskaki, N.; Coenen, L. Impacts of urban living labs on sustainability transitions: Mechanisms and strategies for systemic change through experimentation. Eur. Plan. Stud. 2019, 27, 229–257. [Google Scholar] [CrossRef]
  17. Burbridge, M.; Morrison, G.M.; van Rijin, M.; Silverster, S.; Keyson, D.V.; Virdee, L.; Baedeker, C.; Liedtke, C. Business Models for Sustainability in Living Labs. In Living Labs Design and Assessment of Sustainable Living; Keyson, D.V., Guerra-Santin, O., Lockton, D., Eds.; Springer International Publishing: Cham, Switzerland, 2017; pp. 391–403. [Google Scholar]
  18. Leminen, S.; Westerlund, M. Towards innovation in Living Labs Networks. Int. J. Prod. Dev. 2012, 17, 43–59. [Google Scholar] [CrossRef]
  19. Berry, S.; Davidson, K.; Saman, W. The impact of niche green developments in transforming the building sector: The case study of Lochiel Park. Energy Policy 2013, 62, 646–655. [Google Scholar] [CrossRef]
  20. Edwards, J.; Pocock, B. Comfort, Convenience and Cost: The Calculus of Sustainable Living at Lochiel Park; University of South Australia: Adelaide, Australia, 2011; Available online: https://www.unisa.edu.au/hawkeinstitute/cwl/documents/Lochiel-Park-report.pdf (accessed on 2 June 2020).
  21. Mitchell, C.; Chong, J.; Turner, A.; Retamal, M.; Carrard, N.; Murta, J.; Mukhelblr, P.; Moy, C. Aurora Case Study: Pioneering Sewage Recycling in a Greenfield Residential Development Provides Many Lessons; Australian Water Recycling Centre of Excellence: Brisbane, Australia, 2013.
  22. LandCorp Innovation through Demonstration: WGV. Available online: https://www.landcorp.com.au/innovation/wgv/ (accessed on 21 May 2020).
  23. Water Corporation Desalination. Available online: https://www.watercorporation.com.au/Our-water/Desalination (accessed on 8 May 2020).
  24. Water Corporation. Water Corporation Annual Report 2019; Water Corporation: Perth, Australia, 2019; Available online: https://www.watercorporation.com.au/about-us/our-performance/annual-report (accessed on 2 June 2020).
  25. Water Technology. Perth Seawater Desalination Plant. Available online: https://www.water-technology.net/projects/perth/ (accessed on 2 June 2020).
  26. Department of Water and Environmental Regulation Water. Available online: https://www.dwer.wa.gov.au/water (accessed on 2 June 2020).
  27. Water Corporation The Way We Work. Available online: https://www.watercorporation.com.au/About-us/The-way-we-work (accessed on 2 June 2020).
  28. Department of Water and Environmental Regulation Urban Water. Available online: https://www.water.wa.gov.au/urban-water (accessed on 2 June 2020).
  29. Water Corporation Waterwise. Available online: https://www.watercorporation.com.au/Waterwise (accessed on 2 June 2020).
  30. Water Corporation Waterwise Development. Available online: https://www.watercorporation.com.au/Help-and-advice/Waterwise-business-programs/Waterwise-Development-Program/About-our-program (accessed on 2 June 2020).
  31. Australian Government Water Rating “Choosing Water Efficient Products”. Available online: https://www.waterrating.gov.au/ (accessed on 3 June 2020).
  32. Department of Water and Environmental Regulation Water Efficiency Labelling and Standards (WELS) Scheme. Available online: https://www.water.wa.gov.au/urban-water/water-recycling-efficiencies/water-efficiency-labelling-and-standards-scheme (accessed on 2 June 2020).
  33. Australian Bureau of Statistics Quickstats. Available online: https://quickstats.censusdata.abs.gov.au/census_services/getproduct/census/2016/quickstat/036 (accessed on 8 June 2020).
  34. Bioregional. One Planet Living. Available online: https://www.bioregional.com/one-planet-living (accessed on 2 June 2020).
  35. Falconer, R.; Newman, P.; Giles-Corti, B. Is practice aligned with the principles? Transp. Policy 2010, 17, 287–294. [Google Scholar] [CrossRef] [Green Version]
  36. Water Corporation. Water Forever; Water Corporation: Perth, Australia, 2010; Available online: https://www.watercorporation.com.au/-/media/WaterCorp/Documents/Our-Water/Sustainability-and-Innovation/Securing-Supply/Water-forever-recycling-and-efficiency-report.pdf (accessed on 2 June 2020).
  37. Australian Building Codes Board. National Construction Code Series Volume 3; Australian Building Codes Board: Canberra, Australia, 2014. Available online: https://www.builderassist.com.au/wp-content/uploads/2016/02/NCC2014-PCA-Volume-Three.pdf (accessed on 2 June 2020).
  38. Water Corporation. Perth Residential Water Use Study 2008/2009; Water Corporation: Perth, Australia, 2010. Available online: http://www.newwaterways.org.au/downloads/nww-speaker-series/2011%2007%20-%20Perth%20Residential%20Water%20Use%20Study%20Cilla%20Delacy.pdf (accessed on 2 June 2020).
  39. Water Corporation Winter Sprinkler Switch off. Available online: https://www.watercorporation.com.au/Help-and-advice/Watering-days/Winter-sprinkler-switch-off/Winter-sprinkler-switch-off (accessed on 8 May 2020).
  40. Department of Water and Environmental Regulation Winter Sprinkler Switch off. Available online: https://www.water.wa.gov.au/urban-water/water-restrictions/garden-bores/winter-sprinkler-ban (accessed on 3 May 2020).
  41. Bureau of Meteorology Climate Statistics for Australian Locations-Swanbourne. Available online: http://www.bom.gov.au/climate/averages/tables/cw_009215.shtml (accessed on 8 May 2020).
  42. OutpostCentral.com. Device Features. Available online: https://outpostcentral.com/iot-device-features/ (accessed on 2 July 2020).
  43. Eon, C.; Breadsell, J.K.; Morrison, G.M.; Byrne, J. The home as a system of practice and its implications for energy and water metabolism. Sustain. Prod. Consum. 2018, 13, 48–59. [Google Scholar] [CrossRef] [Green Version]
  44. Sarker, A.; Baldwin, C.; Ross, H. Managing groundwater as a common-pool resource: An Australian case study. Water Policy 2009, 11, 598–614. [Google Scholar] [CrossRef] [Green Version]
Figure 1. WGV precinct: (1) detached dwellings; (2) attached dwellings; (3) apartment sites; (4) public open space and community buildings; and (5) historical stormwater drainage reserve retrofitted into public green space. Source: authors, adapted from Last Pixel.
Sustainability 12 06483 g001
Figure 2. Water consumption at WGV by source and by typology. Source: authors.
Sustainability 12 06483 g002
Figure 3. WGV detached dwellings water consumption overview. Source: authors.
Sustainability 12 06483 g003
Figure 4. WGV detached dwelling lots monthly consumption by source versus rainfall. Source: authors.
Sustainability 12 06483 g004
Figure 5. Attached dwelling water consumption in comparison to the preliminary modelling. Source: authors.
Sustainability 12 06483 g005
Figure 6. WGV attached dwelling monthly consumption by source versus rainfall. Source: authors.
Sustainability 12 06483 g006
Figure 7. WGV apartment water consumption overview. Source: authors.
Sustainability 12 06483 g007
Figure 8. WGV apartments monthly consumption by source versus rainfall. Source: authors.
Sustainability 12 06483 g008
Figure 9. WGV measured water supply sources, assumed destinations. Source: authors.
Sustainability 12 06483 g009
Table 1. Occupancy rates used in this paper. Source: authors.
TypologyOccupancy Rate 1 (People/Dwelling)Total DwellingsExpected Total Residents
Detached 2.822 (complete)62
6 (to be completed)17
Attached 2.325
Apartment 1.841 (complete)74
18 (to be confirmed)32
Total 89189
1 Occupancy is based on Australian Bureau of Statistics figures [33].
Table 2. Summary of indoor water efficiency requirements at WGV. Source: authors, adapted from [38].
Water Saving FeatureExplanation
Internal Fittings
ShowerheadsMandated WELs 3 Star (<9 L per minute)
TapsDesign guidelines recommend WELs 4 Star (6 L per minute)
Internal Fixture
ToiletsDesign guidelines recommend dual flush toilets
Hot water systemsFollows standard—minimum mandated location of less than 20 m from point of use
BathsDesign guidelines recommend low volume bath/spa surface area
Internal Appliances
DishwasherMandated WELs 4 Star rated dishwasher or better
Washing machineMandated WELs 4 Star rated dishwasher or better
Table 3. Summary of outdoor water efficiency requirements at WGV. Source: authors.
Water Saving FeatureExplanation
PLANTS
Plant selectionWaterwise/drought tolerant plants selected
MulchDesign guidelines include waterwise mulch of 5–10 cm in all garden beds
DESIGN
LawnDesign guidelines mandate lawn areas are less than 50% of garden areas
VergeAll residents that take up the sustainability package by DevelopmentWA are required to use native/waterwise plants on verges
IRRIGATION
Irrigation systemMandated substrata drip irrigation for all residential and public open space gardens.
Moisture sensorRain sensors are used to turn off automatic watering systems during rain events
OTHER
PoolsPool blankets mandated to reduce evaporation losses
Table 4. Water consumption at WGV by source and by typology. Source: authors.
TypologyMains Water Consumption (kl/person/year)Mains Water Reduction on Typical Perth Resident (106 kL/person/year)Groundwater Consumption (kl/person/year)Rainwater Consumption (kL/person/year)Total Water Consumption (kL/person/year)
Detached5251%13469
Attached2873%5538
Apartments2775%10238
precinct Weighted average3765%11351
Table 5. Detached dwelling water consumption overview. Source: authors.
Mains Water (kL/person/year)Groundwater (kL/person/year)Rainwater (kL/person/year)
Modelled301210
Measured performance52134
Table 6. Attached dwelling water consumption—comparison to model. Source: authors.
Mains Water (kL/person/year)Groundwater (kL/person/year)Rainwater (kL/person/year)
Modelled301510
Measured performance2855
Table 7. Apartment water consumption—comparison to model. Source: authors.
Mains Water (kL/person/year)Groundwater (kL/person/year)Rainwater * (kL/person/year)
Modelled30810
Measured performance27.27.55.0
* GenY House rainwater data only.
Table 8. Comparison of WGV to Lochiel Park and Aurora Estate. Source: authors.
Lochiel Park Aurora EstateWGV
LocationSouth Australia VictoriaWestern Australia
Launched200620062015
ClimateMediterraneanSub-MediterraneanMediterranean
Total size15 Ha700 Ha2.2 Ha
Local av. mains water consumption75 (kL/p/year)75 (kL/p/year)106 (kL/p/year)
dwellings103800089
POS4.3 Ha50 Ha0.25 Ha
Residents24725,000189
Mains water reduction target78%72%60–70%
Mains water consumption (modelled)17 (kL/person/year)21 (kL/person/year)32 (kL/person/year)
Mains water consumption (measured)49 (kL/person/year)41 (kL/person/year)37 (kL/person/year)
Mains water reduction (measured)36%45%65%

