1. Introduction
Urban forests are an emergent natural resource of critical importance to people and their environments. There are an estimated 5.5 billion trees in urban areas across the U.S. [
1], and recent projections indicate that urban land area will more than double in the contiguous U.S. between 2010 and 2060, further expanding the footprint of urban forests [
1]. Urban tree populations are in constant flux due to land use changes and mortality driven by extreme weather, pests, construction, and old age. The scale of tree mortality nationwide is considerable, averaging 36 million trees per year over the past decade in urbanizing areas of the U.S. [
2]. The impacts of urban tree loss are manifold, ranging from diminished human health [
3] to increased stormwater runoff [
4] to loss of climate regulating services [
5,
6]. Sustainable management of urban forests has come into focus in recent years [
7], with increased emphasis on an ecosystem approach that holistically considers social, economic, and environmental implications of management decisions [
8]. An element of sustainable management receiving greater attention is the responsible disposal and utilization of debris resulting from tree removal [
9].
The amount of tree debris removed from urban land in the U.S. has been reported periodically since the early 1990s, with estimates ranging from 14.5 to 38 million green tons per year [
10,
11,
12]. A recent national assessment using data on urban tree standing biomass and mortality rates revealed above-ground biomass losses due to mortality and removals of around 70 million green tons per year [
13]. The fresh-weight merchantable wood generated from these biomass losses equals 46 million tons, with a potential annual value of
$786 million if processed as saw logs for lumber [
13]. For perspective, this quantity of potential urban lumber equates to around 10% of the total U.S. lumber production in 2013 [
14].
The endpoint of tree debris varies from disposal in a landfill to a range of utilization options such as mulch, firewood, lumber, and furnishings. Little is known about these disposal and utilization practices, yet each has economic and environmental implications for urban forest management. A nationwide survey of landscape waste generators in the 1990s determined that around 25% of an estimated 13.5 million cubic meters of urban tree debris was utilized for products; additionally, 42% of waste was given away (fate unknown) and 17% went to a landfill [
15]. Recent surveys in several southeastern states found private tree care firms disposing about 21% of their log waste at a solid waste facility (perhaps resulting in either landfilling or recycling) and utilizing around 58% of the log waste, either by the firm or by a third party, most often as firewood [
16].
In the U.S., tree debris is a form of municipal solid waste referred to as “yard trimmings”, which also comprises grass, leaves, and brush. Estimated nationwide generation of yard trimmings in 2017 was 31.9 million tons, around 13.1% of total municipal solid waste [
17]. Heightened concerns about environmental impacts have led to bans on landfilling of vegetative waste in many states [
18] and increased municipal disposal fees for yard waste [
19], yet 25% of yard waste delivered to municipal solid waste facilities is still landfilled nationwide [
17]. Landfilling is particularly detrimental to the carbon footprint of urban forests because methane, a by-product of anaerobic decomposition, is 25 times more potent than carbon dioxide as a greenhouse gas [
20]. Landfills were the third largest source of anthropogenic methane emissions across the U.S. in 2018 [
20], with municipal solid waste landfills emitting 95.6 million tons of CO
2-equivalent methane [
20]. Quantifying the proportional contribution of yard trimmings to total landfill methane emissions has proven difficult at large geographic scales [
20]. Landfilling, with or without methane recovery, was reported as the worst end-of-life wood waste management technique in terms of carbon footprint for a city-scale simulation in Northern Italy [
21]. For these reasons, diverting tree debris away from landfills and recycling it into various products is currently viewed as a priority for increasing urban forest sustainability, decreasing management costs, and increasing income opportunities for local entrepreneurs [
13,
22]. Utilization of urban wood to manufacture durable products (lumber, furniture) has the added value of long-term carbon storage and avoidance of near-term carbon losses to the atmosphere via decomposition (mulch) or combustion (firewood).
Although awareness of urban wood utilization is growing, considerable barriers still exist to widespread implementation. Many barriers relate to the supply chain, both in terms of quantity and quality of urban wood. The crux is that there is a large amount of urban wood resulting from tree mortality and removals, but the quality is highly variable and poorly understood, which makes it challenging to create an economically viable wood utilization program [
23]. Moreover, crafting urban wood into durable products requires specialized equipment and skills; therefore, wood utilization enterprises are often niche businesses focused on hand-picking high-quality wood and crafting a limited supply of premium products. In contrast, municipal wood utilization programs often process large amounts of wood waste into low-value products (mulch and firewood) which are indiscriminate of wood quality because they either lack resources to sort and process wood for high-value products or lack information about community demand for high-value products [
16,
24].
Residential property owners may be overlooked, both as generators of urban wood as well as stakeholders in urban wood utilization programs. A survey of wood waste generators in several southeastern states found that private tree care firms handled 40% of their wood waste from clients on private residential property; their municipal counterparts reported that curbside pick-up from residential areas accounted for 38% of wood waste handled by the municipality [
16]. This large output of wood waste from residential areas is driven by the abundance of trees found there—around 75% of urban tree cover nationwide is found on residential and vacant lands [
1]. While there is an intrinsic role of residential lands in generating a large percentage of urban wood, and property owners are tax-paying patrons of municipal solid waste operations, perspectives of residential property owners are rarely considered when developing urban wood utilization programs. Instead, primary consideration is given to commercial tree care firms, utility vegetation managers, and municipal solid waste operators as primary actors in wood waste generation and wood product recovery [
24,
25,
26]. However, residential property owners, through their tree debris disposal practices, apart from professional interventions, may have substantial influence on the urban wood supply chain and municipal-scale wood utilization efforts. Without the broad-based participation of residential property owners in tree debris recycling, it is unlikely that substantive progress will be made in diverting urban wood into high-value, durable products that accomplish the economic and environmental objectives of sustainable urban forest management.
To gain insight into residential property owners, we conducted a household survey in the city of Harrisonburg, Virginia, aimed at understanding tree removal practices and perceptions of tree debris recycling. In the survey, we couched tree debris recycling in the context of general household recycling (e.g., paper, plastic, metal) and probed aspects of tree stewardship and sustainability linked to recycling. The following research questions were examined: (1) How are residential trees removed and the debris handled? (2) In what ways do households recycle tree debris? (3) What motivates willingness to participate in recycling? (4) Can future recycling intentions be predicted by household characteristics? The following sections outline our sampling approach and survey instrument, our primary results, and the broader implications of this work toward expanding wood utilization programs.
2. Materials and Methods
2.1. Study Area
The city of Harrisonburg, Virginia, is located in the Shenandoah Valley region of the Valley and Ridge physiographic province. The climate is humid subtropical, with four distinct seasons and summers that are generally hot and wet (Köppen–Geiger climate classification; see [
27]). The Kuchler potential natural vegetation is southern mixed forest comprising oak-hickory-pine forest cover types [
28]. A 2012 assessment of street tree composition in the city identified 112 different tree species growing in rights-of-way that abutted residential properties [
29]. Trees were a mix of wild trees and those planted by the city and adjacent private property owners. The five most populous species were callery pear (
Pyrus calleryana), flowering dogwood (
Cornus florida), eastern redbud (
Cercis canadensis), northern white-cedar (
Thuja occidentalis), and Siberian elm (
Ulmus pumila), each accounting for 3% to 10% of the population. In terms of canopy cover, the five most dominant species were sugar maple (
Acer saccharum), Siberian elm (
Ulmus pumila), black walnut (
Juglans nigra), callery pear (
Pyrus calleryana), and silver maple (
Acer saccharinum), each accounting for 4% to 6% of total tree cover. The landscapes within city limits are heavily influenced by the historical legacy of extensive agriculture in the region. Therefore, city-wide tree canopy cover is relatively low, at 27%, but ranges from 21% to 61% across six major watersheds within the city [
30].
Harrisonburg has been recognized as a Tree City USA community for 15 years and is pursuing a comprehensive urban forestry program. Recent years have seen a rapid increase in the number of trees removed from city parks due to invasion by emerald ash borer (
Agrilus planipennis). In preparation for such removals, the city has partnered with the Virginia Department of Forestry (VDOF) and the Virginia Urban Wood Group (VUWG) to develop an urban wood program that aims to “recover wood products from fallen or removed trees so that wood can be reused in creative ways and kept from going into landfills” [
31]. The VDOF has been conducting statewide technical assistance and outreach to promote urban wood utilization over the past decade as well as creating baseline studies, workshops, and a business directory. The VUWG was catalyzed by VDOF and several public and private partners in 2017 to offer a unified front on addressing urban wood issues and opportunities statewide [
32]. The study described here was conducted, in part, to inform the development of Harrisonburg’s urban wood program and provide guidance to the VDOF and the VUWG on outreach and technical assistance to residential property owners statewide.
Harrisonburg is a mid-sized city (population 53,016 in 2019), with 34% of the population characterized as non-white, which is comparable to both state (38%) and national (40%) demographics [
33]. Hispanics or Latinos of any race comprise 19.3% of the city’s population, Black or African American 7.4%, Asian 4.0%, and a mix of races comprise the remainder [
33]. Socio-economic diversity is high, in part due to the heavy mix of manufacturing and non-manufacturing employers and the proximity to nearby metropolitan areas in Northern Virginia and Washington D.C. Many of the major manufacturing employers involve poultry processing and packaging, while non-manufacturing employers include James Madison University and the Sentara RMH Medical Center. The median household income in 2018 was
$43,893, with 28.2% of the population below the poverty line [
33], statistics which are heavily influenced by the large university student population (~21,000) within the city. Comparative state and national demographics in 2019 were
$71,564 (10.7%) and
$60,293 (11.8%), respectively.
2.2. Sampling Approach
Surveys were delivered to a stratified random sample of owner-occupied, single-family dwellings using elements of Dillman’s tailored design method [
34]. We chose to focus on this community demographic and land base because these types of residential parcels support large tree populations, and owner occupancy ensured survey responses directly from decision-makers about tree removal and debris disposal on the properties. Property information (including address, homeowner name, and lot size) was purchased from BB Direct (Cape Coral, FL), a provider of direct marketing data and data-related services. The initial sampling frame comprised 11,903 households within the city boundary. Sampling units were stratified into nine strata based on parcel size, ranging from ≤465 square meters to >20,439 square meters. Within each stratum, a random sample of approximately 10% of households was selected, totaling 1000 households contacted to participate in the survey. The aim of this stratification was to ensure adequate representation of small and large parcels among the survey responses to allow statistical testing of parcel size influence on variables of interest. In summer 2018, each household was mailed a packet enclosing a paper copy of the survey and a cover letter with a link to a project website. This website provided basic information about the study and a password-protected link to an online version of the survey (Qualtrics) as an alternative to the paper survey. Households were contacted a maximum of three times at approximately 14 to 21-day intervals requesting survey participation. After the initial correspondence, up to two reminder postcards were sent to households yet to submit a survey response. All survey respondents gave their informed consent to voluntarily participate in the study, which was conducted in accordance with the Declaration of Helsinki, and the protocol was approved by the Institutional Review Board of James Madison University (Protocol ID Number 19-0041, IRB Registration # 00004266).
2.3. Survey Instrument
Prior to administering the survey to households, a draft was beta-tested by several arborists, foresters, and municipal employees affiliated with the VUWG. Given their technical expertise and familiarity with the study population, these testers were asked to provide feedback on question clarity, to suggest topics that may have been overlooked, and to delete or modify weak questions. Recommendations of the testers were given consideration and incorporated into the final survey at the discretion of the authors.
Questions in the final survey were presented in a variety of formats. The “background” section asked respondents to answer basic questions about their property, including the length of their residence on the property and the year in which the property was developed. The “household recycling” section asked respondents a number of multiple-choice questions aimed at understanding their participation in, and perspectives about, general household recycling. Some of these questions were used to develop indices that could comprehensively explain household recycling behavior and perceptions about recycling, which are described in the next section. The “yard and woodlot trees” section asked respondents to characterize the number of existing trees on the property and the process of past tree removals and debris disposal or recycling. The fourth section, “municipal tree recycling” asked about the respondents’ use of products recycled from trees and their interest in potential neighborhood wood recycling programs within the municipality. The final “participant information” section asked respondents to answer demographic questions about their age, gender, education, and household income. The full survey instrument is available in
Supplementary File S1. Around half of the survey questions were multiple-choice format. The remaining half asked respondents to select their level of agreement (or frequency of action) for various statements about general household recycling and tree debris recycling. Survey responses that were completed on paper and returned via mail were input into Qualtrics by the authors. After closing the survey, data were exported from Qualtrics, screened for errors and omissions, organized, and analyzed using Microsoft Excel and SPSS Statistics 26.
2.4. Assessment of Non-Response Bias
Basic demographic information solicited from respondents was used to assess the representativeness of the survey sample relative to the study population of owner-occupied, single-family dwellings in the city. Researchers who employ household surveys adopt various approaches to assess non-response bias. The most common approach involves a comparison of respondent sociodemographic characteristics to an external dataset [
35], which is often the most recent census data for the population [
36,
37]. While this provides a relatively quick and free assessment, the spatial resolution of the external data tends to be coarser than the survey data. For example, the smallest geographical unit for which the U.S. Census Bureau publishes data is the census block group, which typically includes a population of 600 to 3000 people—a much larger spatial area than a single household and its associated parcel.
To capture finer resolution data on the survey non-respondents, we utilized a number of external datasets. The first dataset was generated from the Real Estate Property Information System of Harrisonburg (
https://www.harrisonburgva.gov/real-estate-info-system). Real estate data provided information on the assessed value of the home (including infrastructure and land), square footage of the home, and year built. Given the presence of incomplete records and inconsistencies in the home and parcel sizes reported, we supplemented this information with parcel information obtained from the Virginia Parcels geodatabase (
https://vgin.maps.arcgis.com/home/index.html). Parcel size was of interest as a potential proxy for neighborhood density and household income, factors which may influence a household’s experience with tree stewardship and professional tree removal services. Parcel boundaries were overlaid with the Virginia address point data layer using ArcGIS10 to assign an address to a given parcel. Respondent and non-respondent households were selected by address and parcel size extracted for comparative purposes. Finally, demographic information about non-respondent households was obtained from BB Direct. Address-based attributes included age of household respondent, household income, highest level of education achieved, ethnicity, and race. Collectively, our assessment of non-response bias utilized four demographic and socioeconomic attributes (household income, education, age, and a combined ethnicity/race variable) and one property-level variable (parcel size).
2.5. Statistical Analyses
A series of analyses were employed to better understand residential property owners’ roles in removing trees, generating tree debris, and recycling wood. We first conducted descriptive statistical analyses to understand prevailing attitudes and actions and current household- and property-level characteristics. Most of the variables that we examined were drawn directly from responses to individual survey questions. Three variables were constructed as indices from responses to multiple survey questions that summarized (1) household attitudes toward recycling (“Green Moral Index”, GMI), (2) their recycling behaviors (“Green Behavior Index”, GBI), and (3) their attitudes toward trees on their property (“Tree Stewardship Index”, TSI). GMI was modeled after [
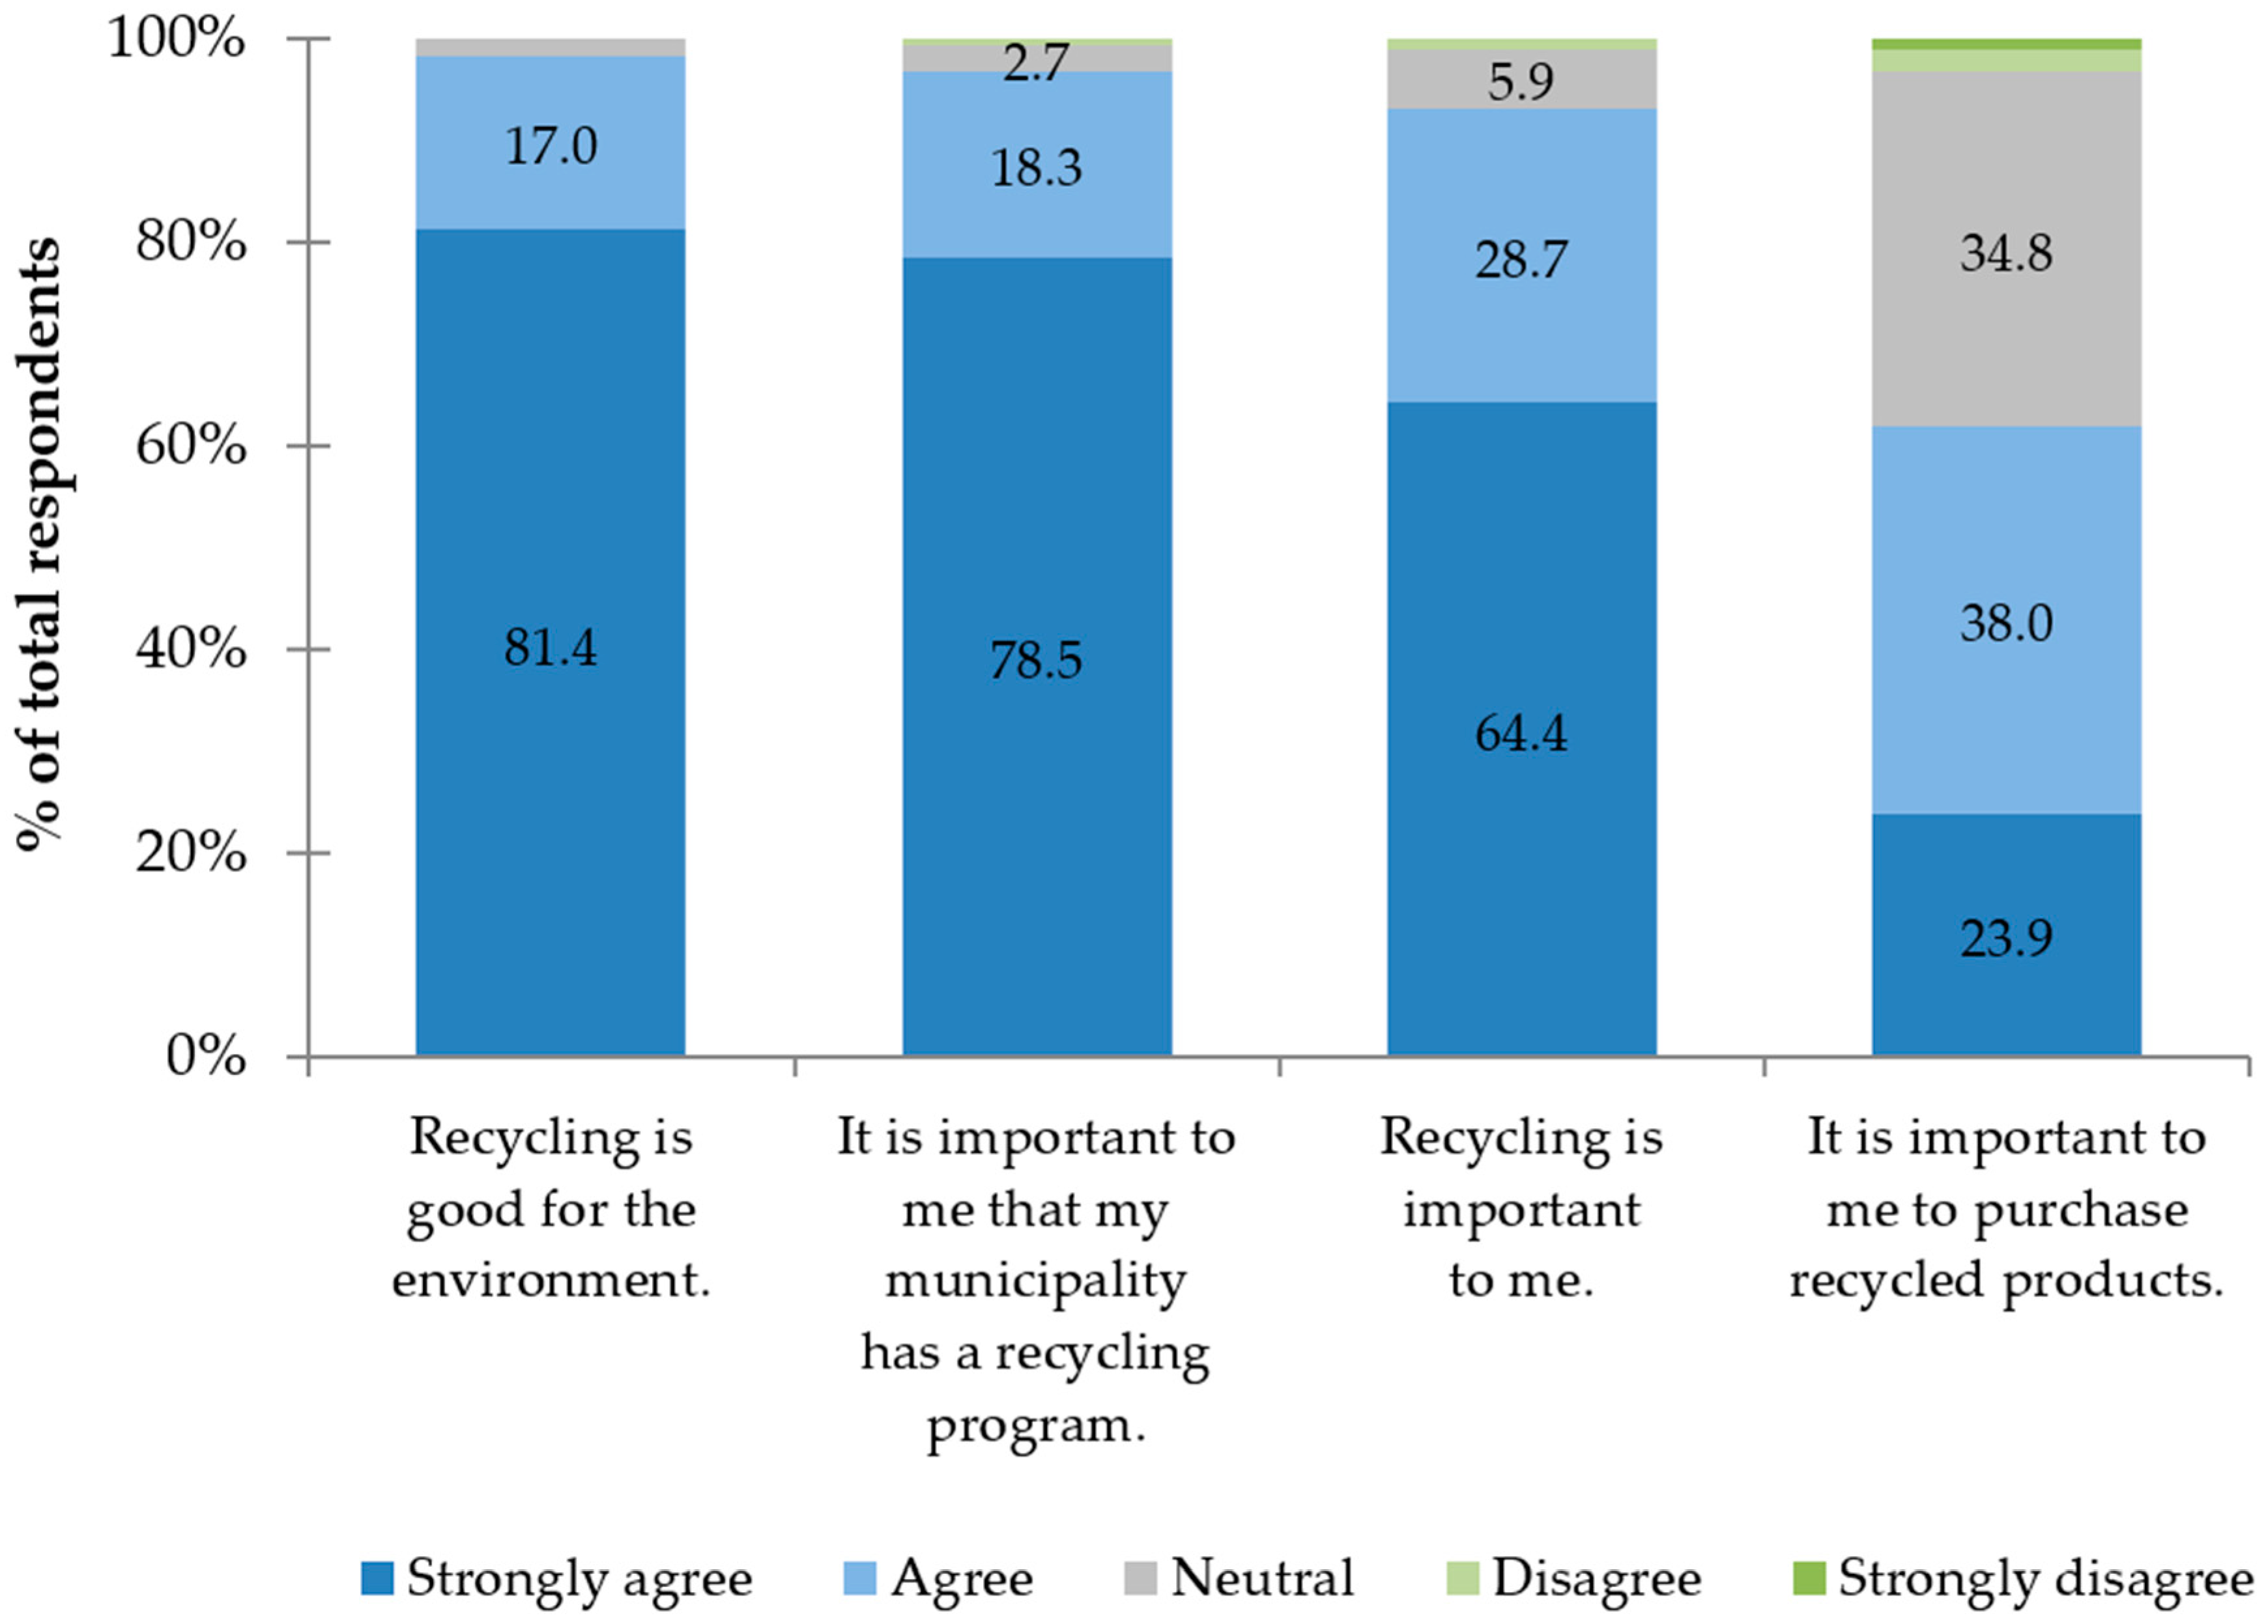
38] as an indicator of the respondents’ perceptions of recycling and its importance to them personally and to the environment. Calculation of the GMI was based on the degree to which respondents agreed with the following four statements: (1) recycling is good for the environment, (2) recycling is important to me, (3) it is important to me to purchase recycled products, and (4) it is important to me that my municipality has a recycling program. For each statement, “strongly agree” was assigned a value of four (4), “agree”, three (3), “neutral”, two (2), “disagree”, one (1), and “strongly disagree”, zero (0). By summing values for each respondent, we obtained GMI scores that ranged from 0 to 16.
GBI aimed to capture respondents’ recycling behaviors and the frequency with which they recycle various items. To construct the GBI, we scored recycling frequency reported by each respondent for a list of 12 household items (paper, cardboard boxes, plastic containers, plastic bags, metal containers, glass containers, batteries, electronic devices, food waste, grass clippings, leaves, and wood from tree removals). When coding responses, “always” was assigned a value of four (4), “often”, three (3), “sometimes”, two (2), “rarely”, one (1), and “never”, zero (0). By summing these values for each respondent, we obtained GBI scores that ranged from 0 to 48.
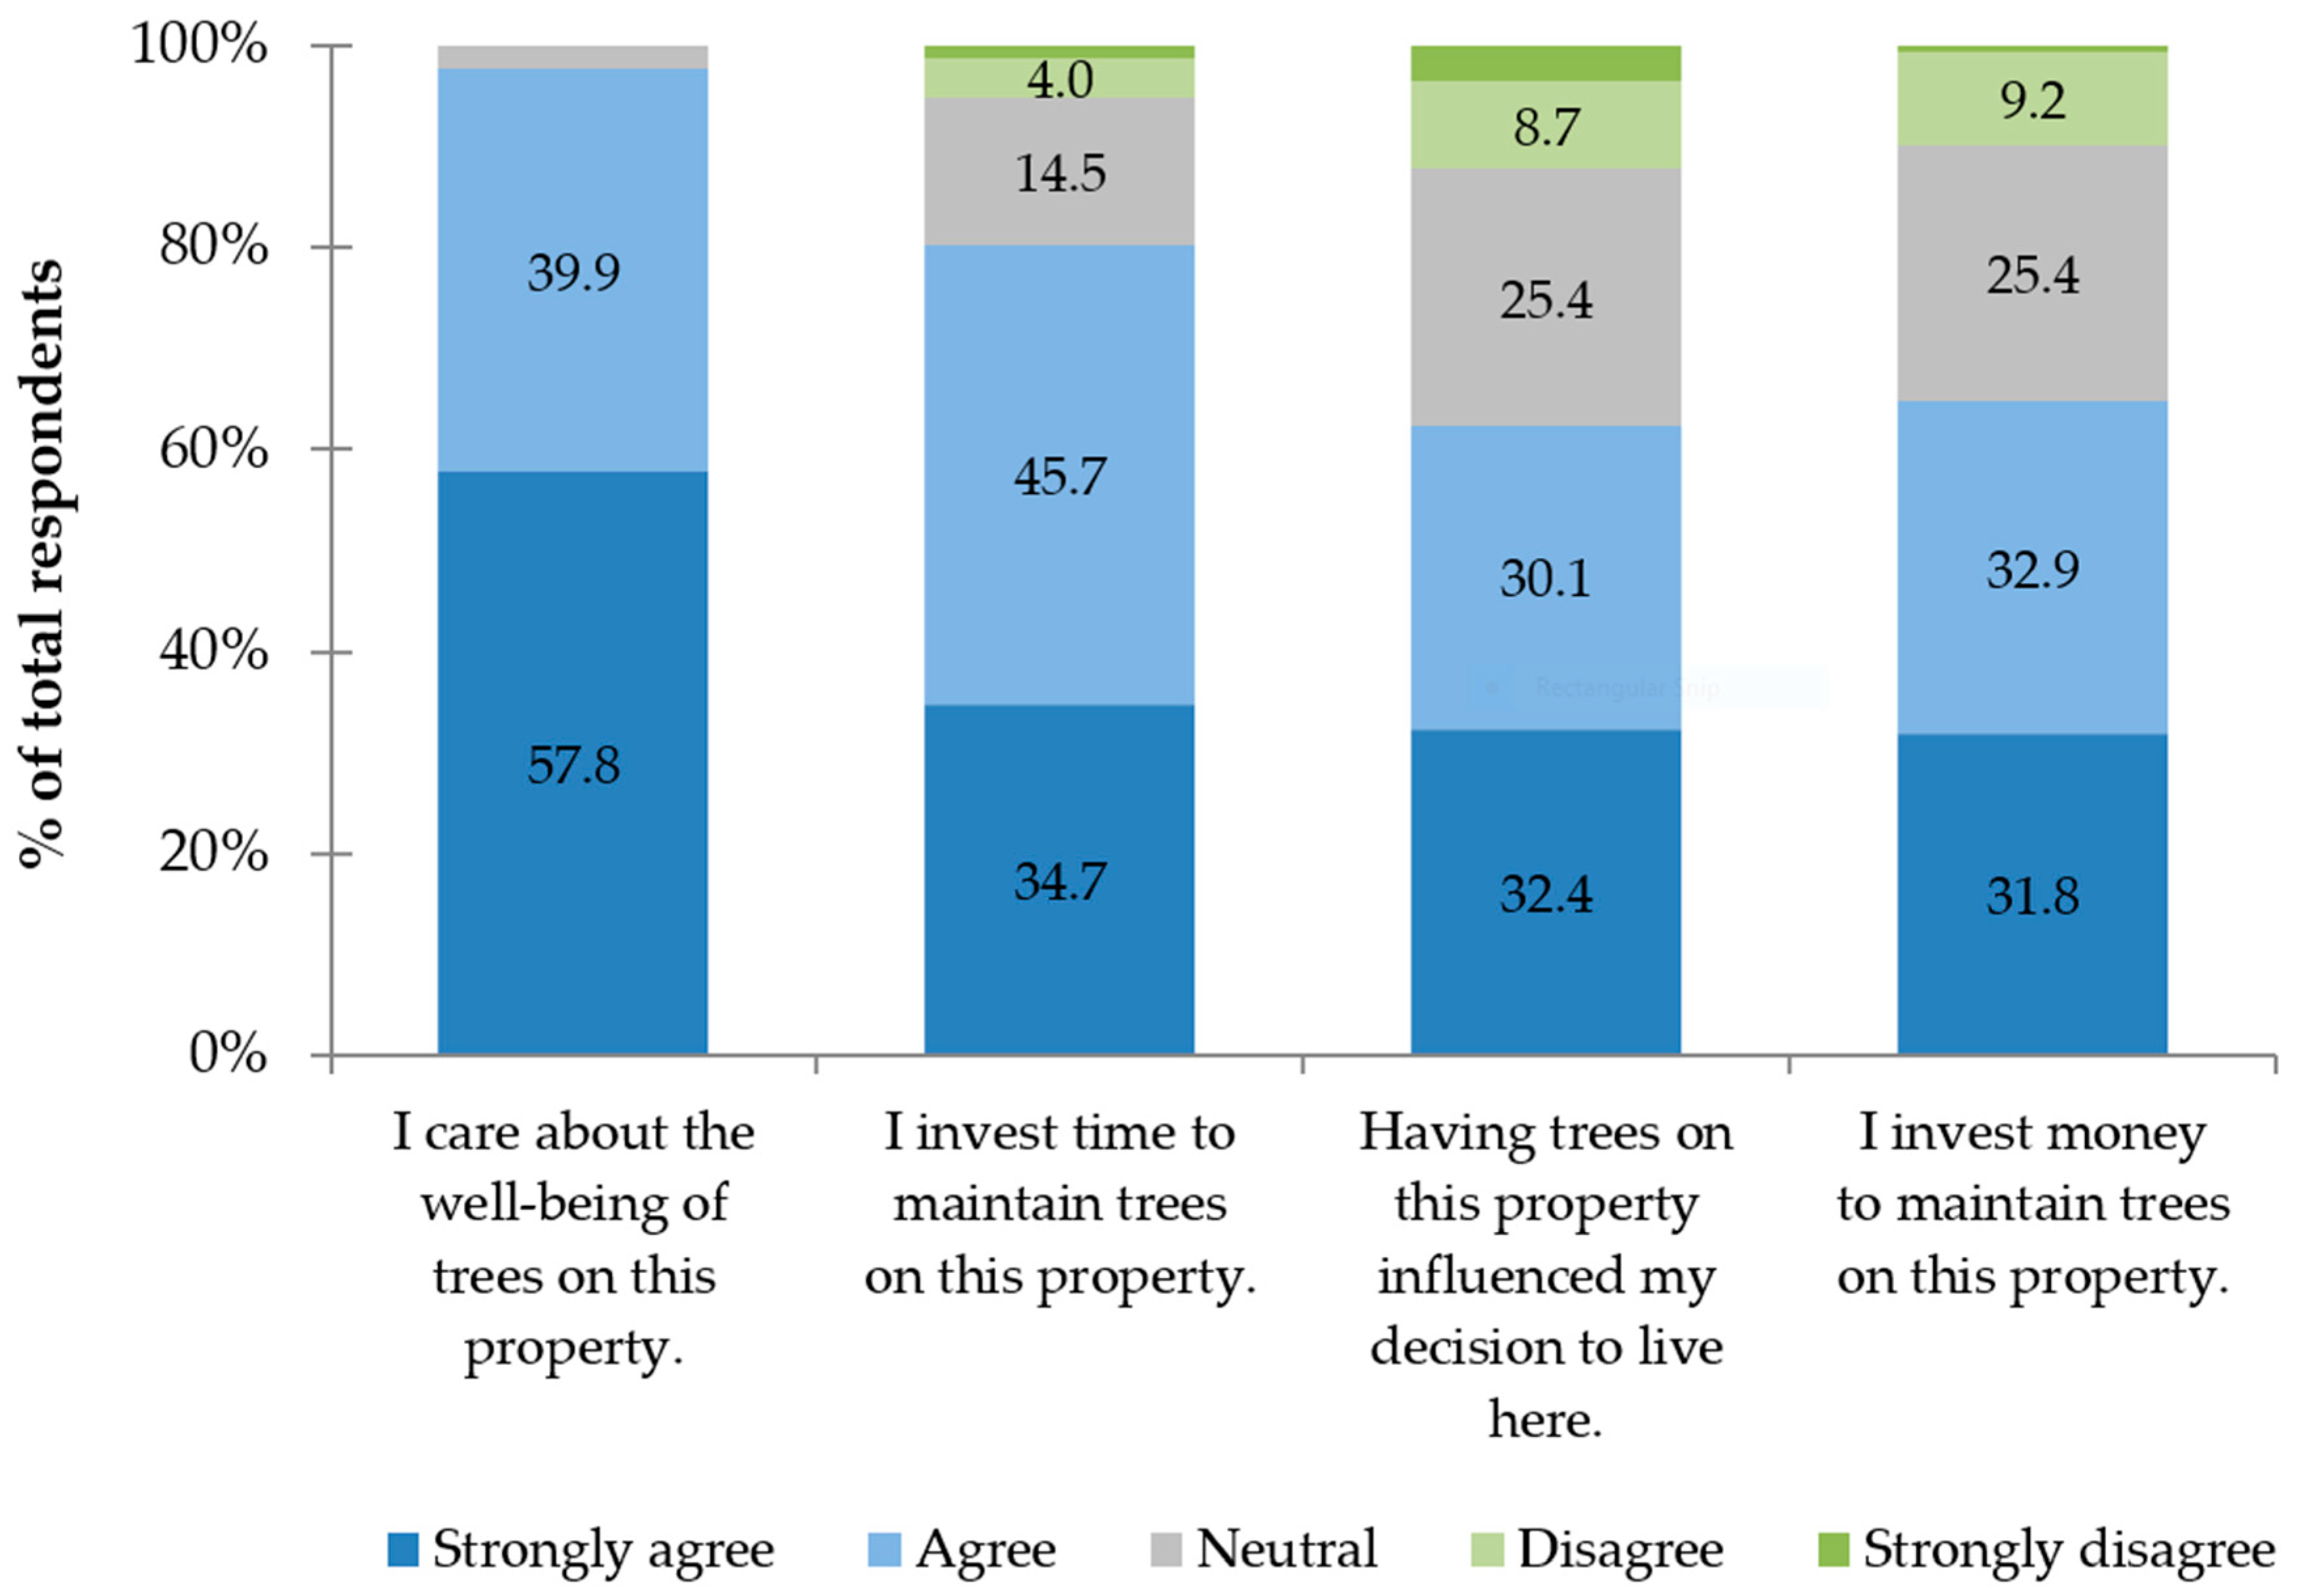
TSI was computed to assess respondents’ attitudes toward trees on their property and their willingness to invest in tree maintenance. Calculation of the TSI was based on the degree to which respondents agreed with the following four statements: (1) having trees on this property influenced my decision to live here, (2) I care about the well-being of the trees on this property, (3) I invest time to maintain trees on this property, and (4) I invest money to maintain trees on this property. The same scoring system was used for the TSI as previously described for the GMI, with resulting TSI scores that ranged from 0 to 16.
Following descriptive analyses, we identified a list of 11 variables that we hypothesized could be important determinants of a household’s future wood recycling intentions (see
Table 1 for variable descriptions). These variables include five demographic variables (age, gender, education, income, length of time at residence), five property-level variables (parcel size, age of home or property, number of yard trees, number of woodlot trees, number of trees previously removed), and an index of household recycling habits and participation in general recycling (GBI). We were as inclusive as possible in generating a list of variables that could be important determinants of future recycling intentions. There have been several past studies examining determinants of general recycling behaviors. A good review is provided by [
39], which suggests that divergent and sometimes contradictory associations have been found between demographic characteristics and recycling behavior. No work, to our knowledge, has examined such relationships specific to urban wood recycling. With that said, we hypothesized that demographic variables would be less important in predicting future recycling intentions than property-level variables. In particular, households with prior experience of removing trees, more yard and woodlot trees, and a greater parcel size were hypothesized to be more likely to indicate future intentions to recycle wood than those with fewer trees, smaller parcel sizes, and less experience of removing trees.
A binomial logistic model was used to explore the relationships between future wood recycling intentions and property, demographic, and past recycling behavior variables. Given the large number of independent variables and the exploratory nature of the analysis, we used a backward stepwise binomial regression to eliminate variables of least importance. Variables were removed based on the
F-test, with the cut-off value set at a
p-value of 0.10. The remaining explanatory variables were then input into a forward entry model. The dependent variable for the model was the household’s stated intentions to recycle wood if trees were removed in the future (
Table 1). The response categories included “likely”, “uncertain”, and “unlikely”, with the latter two categories combined due to limited responses (n < 10) for the “unlikely” category. We present the coefficients (B) of each explanatory variable, which measures the effect of this variable on the relative likelihood that the household would participate in future wood recycling efforts. The total n for the binomial model equaled 104 (from a total sample size of 189 households). The reduced n is largely attributed to respondents who “did not wish to disclose” demographic information. For all tests, results were considered significant at
p-value ≤ 0.05 and marginal when 0.05 <
p ≤ 0.10.
Concurrent with modeling future recycling intentions, we assessed potential response biases by comparing respondent demographic characteristics to those of non-respondents. Chi-square tests of independence were used for all categorical variables (age, race/ethnicity, education, household income). This statistical test is generally robust to unequal variances and non-normal data distributions. An independent sample t-test was used to examine differences in mean parcel size between the respondents and non-respondents.
3. Results and Discussion
3.1. Respondent Characteristics and Assessment of Non-Response Bias
After closing the survey, 189 completed surveys were obtained from the initial sample of 1000 households. Accounting for undeliverable addresses (14), households that declined participation (2), and households that submitted incomplete responses (5), the adjusted response rate was 19.3% based on an adjusted sample of 979 households [
34]. Of those who responded, 58% chose the paper survey and 42% chose the online survey. Our response rate was lower than we expected, particularly given our mixed-mode survey approach; however, recent national and international trends corroborate steadily declining household survey response rates [
40].
The majority of respondents were 55 years of age or older (55.3%) and had completed a four-year or higher college degree (76.1%). Males constituted a larger percentage of respondents (57.9%) than females (41.0%), and the vast majority of respondents identified their race and ethnicity as non-Hispanic white (91.4%). Of those respondents who disclosed their annual household income, the majority earned between
$50,001 and
$75,000 (24.5%) or greater than
$100,001 (31.8%). A summary of respondent demographic data is shown in
Supplementary File S2.
When compared to non-respondents, survey respondents had a higher household income (χ2(4) = 13.184, p = 0.01) and were less diverse (χ2(5) = 19.514, p = 0.002). There was no statistical difference in the age of respondents and non-respondents (χ2(4) = 3.910, p = 0.418) or the education level of the two groups (χ2(3) = 5.902, p = 0.116). In addition, there was no statistical difference in the mean parcel size of respondents and non-respondents (t = −0.722, p = 0.471), with mean lot sizes equaling 0.129 hectares and 0.117 hectares for respondents and non-respondents, respectively.
3.2. Respondent Recycling Attitudes and Behaviors
There was a strong sentiment toward recycling overall, with nearly all respondents agreeing that recycling is “good for the environment” (98.4%) and that recycling is “important to me” (93.1%) (
Figure 1). A large percentage also agreed with the importance of having a municipal recycling program (96.8%), although purchasing recycled products was not an overwhelming priority. Given the favorable perceptions of recycling, we expected to see high participation in recycling. Though the majority of respondents indicated always or often recycling household items (71.9%), when separated into the 12 household items that were used to create the GBI, there were some notable differences in recycling rates. Items most commonly recycled included metal cans (71.2% always or often), plastic containers (67.4%), glass containers (65.9%), cardboard boxes (57.6%), and paper (53.9%). The least frequently recycled items included food waste (57.9% rarely or never) and wood from tree removals (47.3% rarely or never). Responses were combined for the 12 household items to create the Green Behavior Index (see
Table 2 for summary statistics).
Correlation analyses showed a moderately positive relationship between GMI (indicator of perception) and GBI (indicator of action) at the 0.01 level (Spearman’s ρ = 0.250,
p < 0.01). However, examination of the relationship using scatter diagrams revealed a weak correlation that was particularly impacted by wide variability in households with high GMI scores. Such households expressed strong support for recycling, but their actions ranged from “always” recycling to “never” recycling. In contrast, households with lower GMI values tended to have lower GBI values as well. The survey did not further investigate the GMI–GBI relationship, but potential explanations for the disconnect between environmental perceptions and recycling actions could be poor access to recycling services, objections to recycling due to cost or convenience, or belief that recycling does not appreciably help the environment [
41]. Furthermore, the survey instrument was distributed to households soon after dramatic shifts were announced in trade policies between the U.S. and China for recycled materials. As a result, Harrisonburg’s curbside recycling program was under transition, which likely generated uncertainty among recycling participants. Such uncertainty may have contributed to the observed variability and weak relationship.
3.3. Property Characteristics and Attitudes toward Residential Trees
Properties of survey respondents varied in age and size, which likely influenced the number and size of trees reportedly occupying the properties. Using the Virginia Parcel geodatabase, parcel sizes of responding households ranged from 0.016 to 0.631 hectares. The decade of construction for respondents’ homes were as follows: 1950s or earlier (34.4%), 1960s to 1970s (25.9%), 1980s to 1990s (21.1%), and 2000s to present (17.5%). It is worth noting that the composition and abundance of trees on residential properties are known to differ across parcel vintages and even fluctuate through time [
42], which could have implications for not only the quantity and quality of urban wood available for recycling but also the types of tree recycling practices that might be preferred or feasible for the parcel.
Residential properties that were surveyed were diverse in their number and location of existing trees. The majority of respondents (92.6%) indicated the presence of trees on their property, while a small number (7.4%) reported the complete absence of trees, though this latter designation does not mean that trees were always absent from the property as removal of trees in the past was also reported. Respondents were asked to differentiate between yard trees (those in maintained landscapes close to the dwelling) and woodlot trees (those in naturalized landscapes away from the dwelling) because these tree populations may elicit different attitudes about stewardship and recycling. The number and location of trees varied extensively among respondents, with most reporting one to five yard trees (49.1%), though many households also indicated having six to 10 trees (23.1%), and greater than 10 trees (24.9%). Just over one-third of respondents (36.4%) indicated the presence of woodlot trees; the remaining respondents indicated the absence of woodlot trees (53.8%) or uncertainty about yard versus woodlot trees (9.8%).
A strong sentiment for trees and commitment to investing in their care was evident from responses to the four statements comprising the Tree Stewardship Index (TSI) (
Figure 2). Of particular note were responses to the statement “I care about the well-being of trees on this property”, as 97.7% of respondents expressed agreement or strong agreement, and no household indicated disagreement. While this might seem like a socially normative statement, respondents backed up this sentiment with tangible stewardship action. Maintaining trees by investing time and money in their care was noted by 80.4% and 64.7% of respondents, respectively.
3.4. Tree Removal Practices
The majority of respondents (62.6%) indicated that one or more trees had been removed during their time living on the property. Past tree removals could have occurred on multiple occasions, comprising a mix of hardwood, evergreen, and ornamental trees. Removed in nearly equal frequency were hardwood trees (60.6%) and evergreen trees (55.6%). Ornamental trees were removed the least frequently (39.4%). This mix of tree types suggests that a variety of recycled wood products might be obtained, with hardwoods typically desired for firewood and furnishings, evergreens for dimensional lumber and flooring, and ornamentals for artisanal wood crafts. In most cases, five or fewer trees, regardless of tree type, had been removed from properties. Whether these were removed all at once or individually over time was not ascertained. Likewise, information about the sizes of trees was not obtained. However, this points to a potential challenge of urban wood recovery by individual sawmill operators contracting with individual property owners. A single property is unlikely to generate a large amount of wood, making contract sawing economically difficult. This points to the need for a coordinated wood sourcing system, either in the private or municipal sector.
Residential property trees were removed for a variety of reasons. Tree death was the most frequent removal reason (47.9%), followed by undesired tree effects on property (43.6%), storm damage (39.3%), presence of diseases or pests (31.6%), danger to people or property (29.1%), and invasiveness of trees (18.8%). The circumstances of tree removal may influence both wood quality and the feasibility of wood recovery. For example, trees that have been dead for extended periods or killed by certain diseases or pests may have degraded wood quality, making them unfit for manufacturing durable wood products. Likewise, trees that are storm-damaged or in close proximity to structures may not be feasible for removal in a manner that salvages marketable wood [
26]. Having information pertaining to the reasons for which trees are removed may facilitate greater coordination of community-wide wood recovery operations. For example, an extreme weather event or encroaching pest outbreak may lead to large quantities of high-value wood that might be salvaged efficiently and cost-effectively through coordinated efforts.
When tree removals are necessary, the question of who performs the work can have substantial influence on how the debris is disposed of or potentially utilized. The task of tree removal is strenuous, technical, and dangerous work often beyond the capability of typical homeowners. Therefore, tree removal performed by a contractor was the most frequent survey response (65.8%). However, respondents reporting past tree removals had frequently removed them on their own (49.6%) or with the help of a friend/neighbor (17.1%). A small frequency of removals were performed by a utility company along a utility right-of-way (5.1%) or by the municipality along the street right-of-way (1.7%), which was to be expected given the small land area occupied by rights-of-way. The high frequency of tree removals by professionals bodes well for residential tree debris utilization. If these contractors see potential value in wood, they are likely to seek upcycling opportunities for the financial benefit of them or their clients [
25]. Since professionals are also more likely to be contracted for large tree removals beyond the capability of homeowners, these trees would likely possess a larger quantity of marketable wood. Our survey could not clearly ascertain the number, size, or quality of trees removed by property owners on their own. Although this pool of urban wood waste may have less value potential (if it is a limited number of small trees), it could still represent a large wood resource in the aggregate that might not be reaching its most valuable end use depending on homeowner disposal practices.
3.5. Fate of Removed Trees
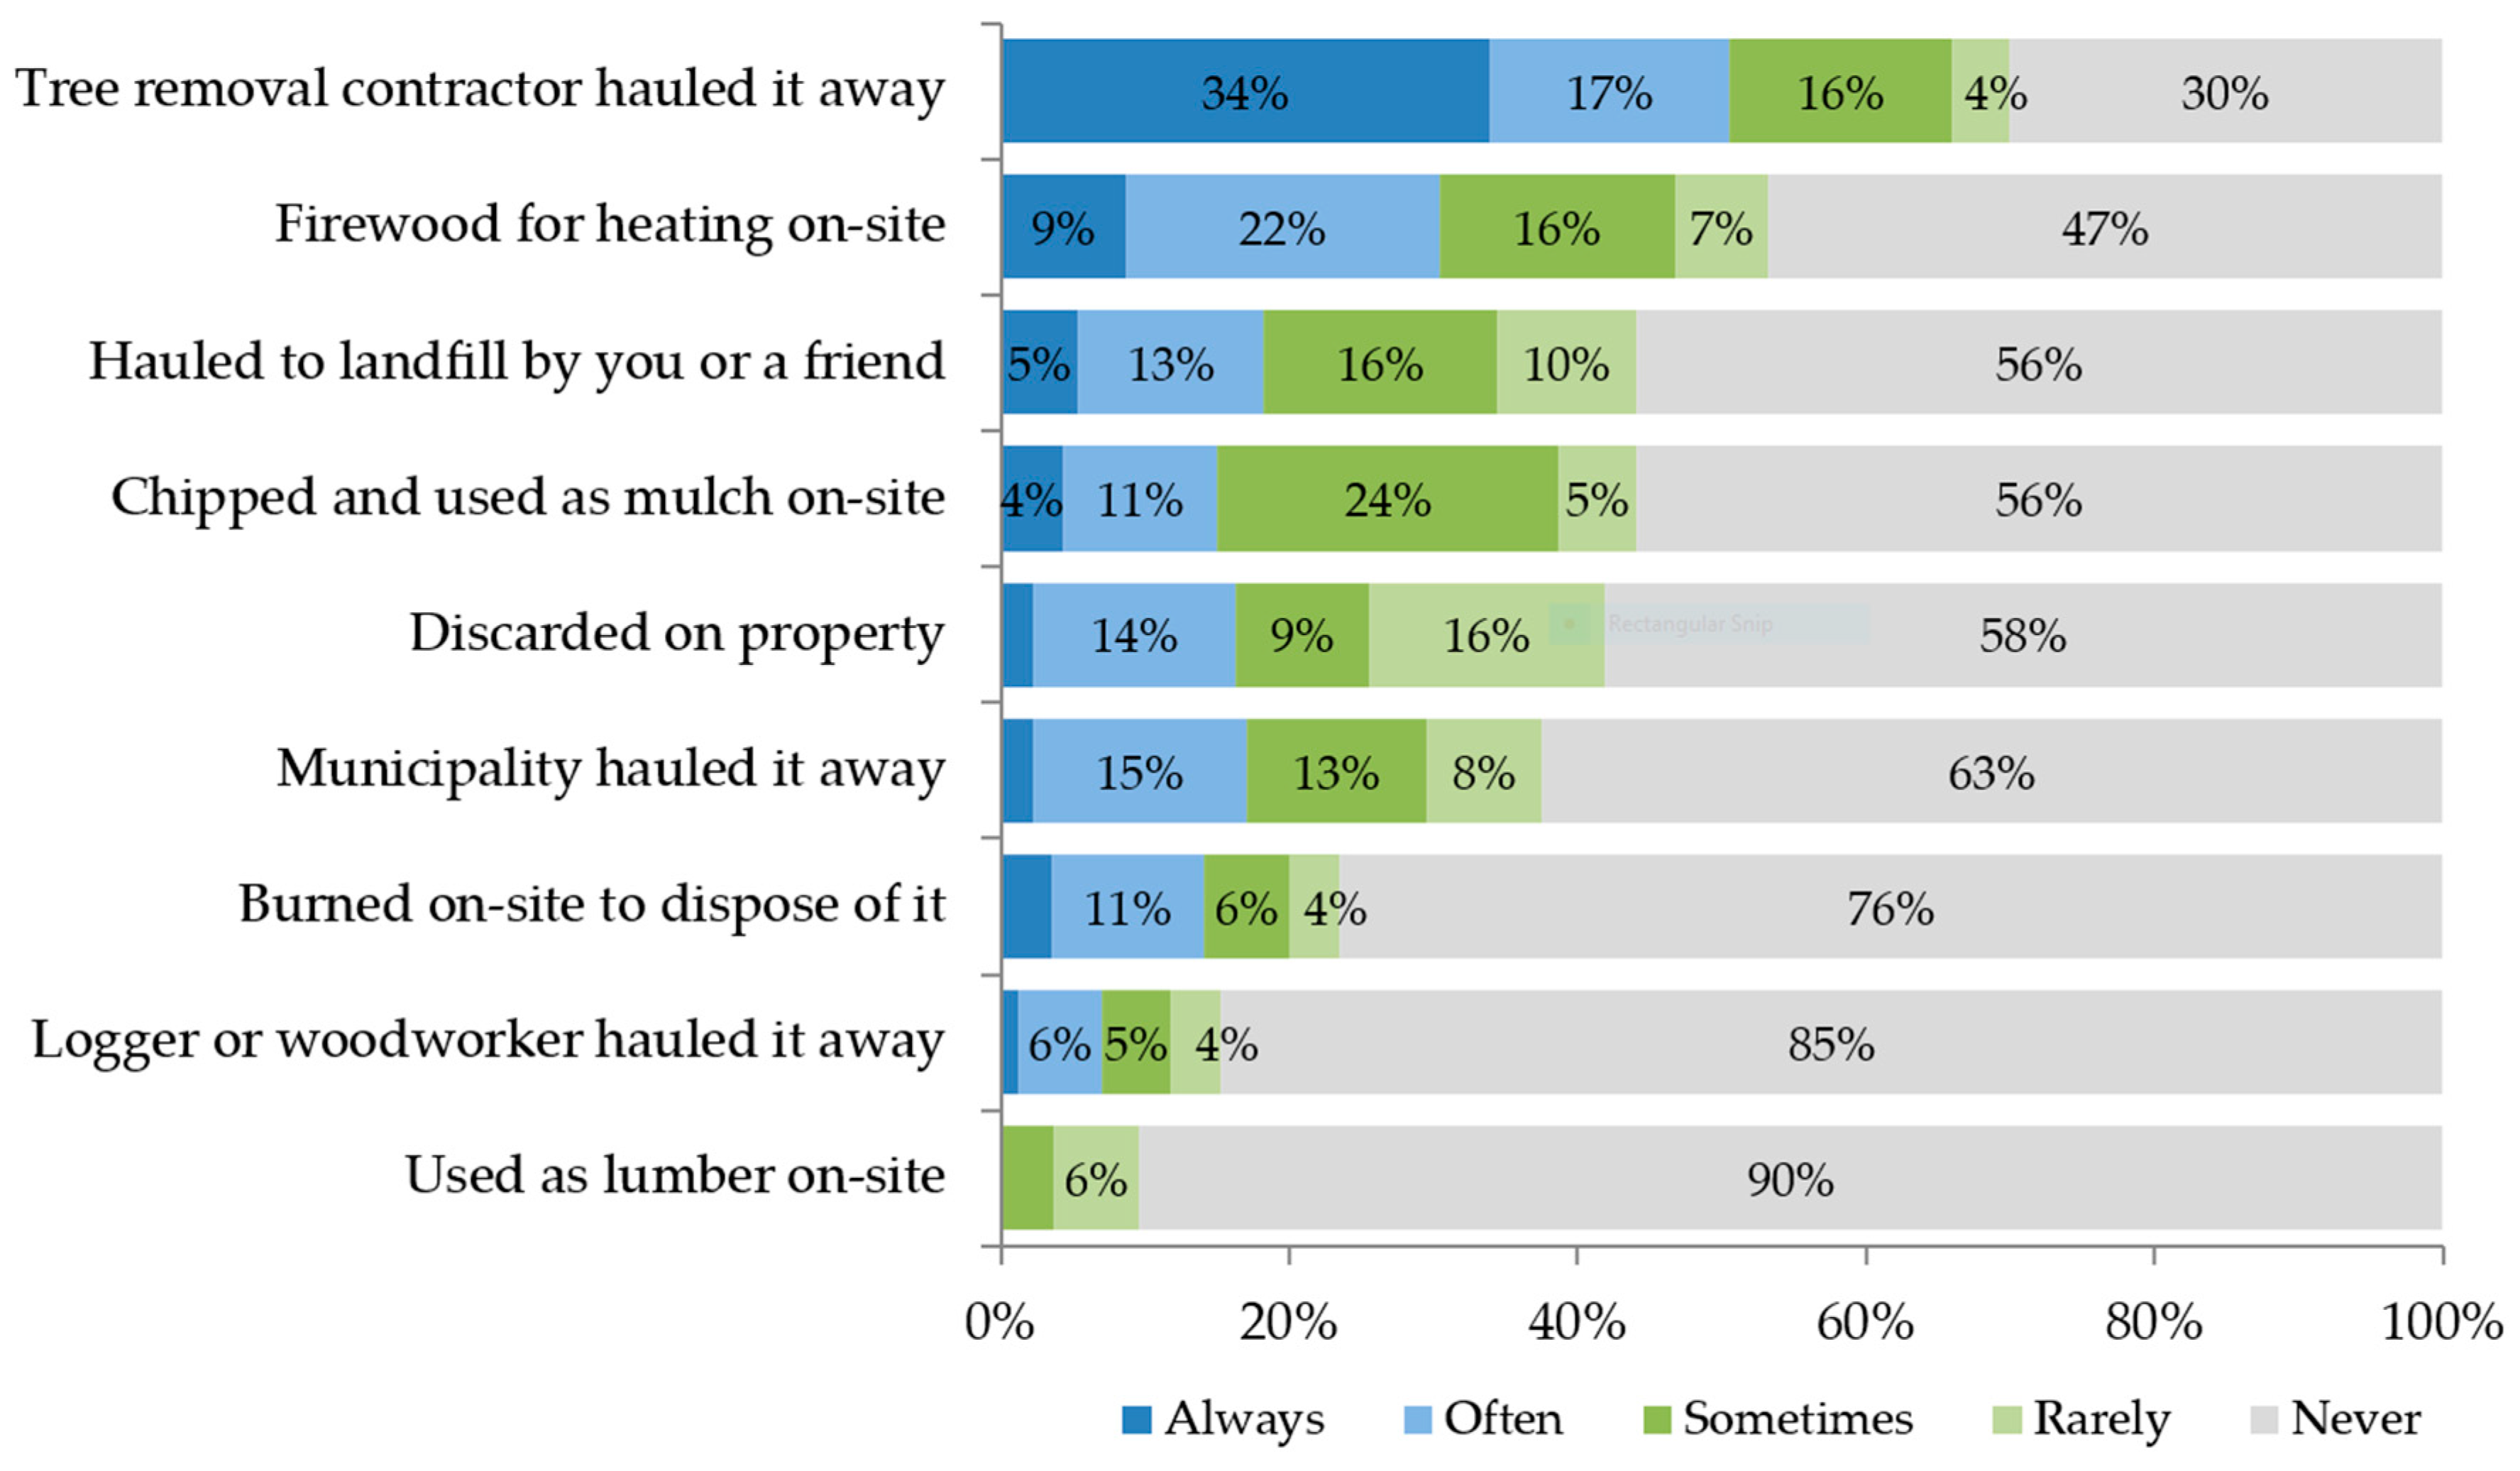
Following removal, tree debris can end up in many different places for disposal or recycling (termed “fate” here), and these endpoints may or may not result in utilization of the debris. In this survey, respondents were asked to report the frequency with which wood ended up at various endpoints (
Figure 3). Three of these fates likely resulted in no or limited wood utilization: (1) hauled to a landfill by landowner or friend, (2) discarded on property, and (3) burned on-site to dispose of it. Two other endpoints had untraceable utilization: (1) a tree removal contractor hauled it away and (2) the municipality hauled it away. Moreover, four of these endpoints likely resulted in utilization: (1) firewood for heating on-site, (2) chipped and used as mulch on-site, (3) used as lumber on-site, and (4) logger or woodworker hauled it away.
The most common fate of woody tree debris was a tree removal contractor hauling it away, with two-thirds of households reporting this fate for trees at least some of the time (
Figure 3). What ultimately happens to such material cannot be determined from this survey, but a previous study of southeastern states suggests that a substantial share of hauled debris is recycled into various products [
16]. An encouraging finding from this survey was that over half of respondents (53.3%) utilized trees on-site as firewood for heating, and nearly half (44.1%) chipped and used wood waste as mulch on-site. While firewood releases carbon stored in removed trees, it also offsets the carbon footprint of hauling for off-site disposal and avoids fossil fuel combustion that would otherwise occur for household heating. Mulch decomposition likewise releases carbon, but a portion of this carbon becomes sequestered in soil, and mulching has the ancillary benefit of promoting vegetation growth, which has a positive feedback on future carbon storage [
43].
Hauling tree debris to the landfill, either by the property owner or municipality, never occurred in over half of residential tree removals (although contractors may also haul debris to the landfill without the owner’s knowledge). This is a favorable circumstance for recycling, particularly when coupled with recognition that hauling tree debris to the landfill may not necessarily result in landfilling if the municipal solid waste facility diverts tree debris for mulch or firewood upon arrival. For example, the city of Harrisonburg encourages city staff to stockpile and grind tree debris that enters the municipal solid waste facility, with wood chips then used to mulch parks and other greenspace areas.
Explicit use of wood waste for durable wood products (e.g., lumber) by either the property owner or a logger/woodworker was the least common fate of residential tree debris. Less than 15% of tree removals were known to have been routed to durable wood products, although contractors who hauled away debris undoubtedly had some level of lumber recovery too. We cannot ascertain whether this level of utilization reflects favorably on upcycling in this local market or whether higher rates of upcycling might be achievable depending on wood quality and local demand for wood products. It is apparent that trees are infrequently used as lumber on-site, which suggests that the vast majority of upcycling occurs through an intermediary and the goods are destined for a third-party consumer.
Multiple contextual factors can influence a tree debris disposal decision by a residential property owner. Respondents were asked which factors were most seriously considered during recent tree removals, and the most frequently cited factors were convenience (indicated by 76.4% of respondents), cost of disposal (57.1%), environmental impact (51.4%), and having the means to handle or transport the wood (50.0%). Less important were the recycling options of the municipality (25.5%), availability of a logger or woodworker to process the wood (21.0%), and potential income-generating possibilities (11.3%). While respondents are concerned about the environmental implications of their disposal decisions, this is outweighed by convenience and cost. Furthermore, low concern about municipal options, logger availability, and income generation suggests that property owners may not understand the connection between these factors and the potential alleviation of convenience, cost, and environmental concerns. Information and outreach might help in this regard.
3.6. Perceptions of Urban Wood Recycling
Several survey questions focused on tree debris recycling efforts and interest in neighborhood or municipal wood recycling programs. In reviewing these questions collectively, two general themes are evident. Firstly, many households do not currently recycle debris (for a variety of reasons), but secondly, many households might consider participating in a wood recycling program. Below are responses to a subset of survey questions that support these themes.
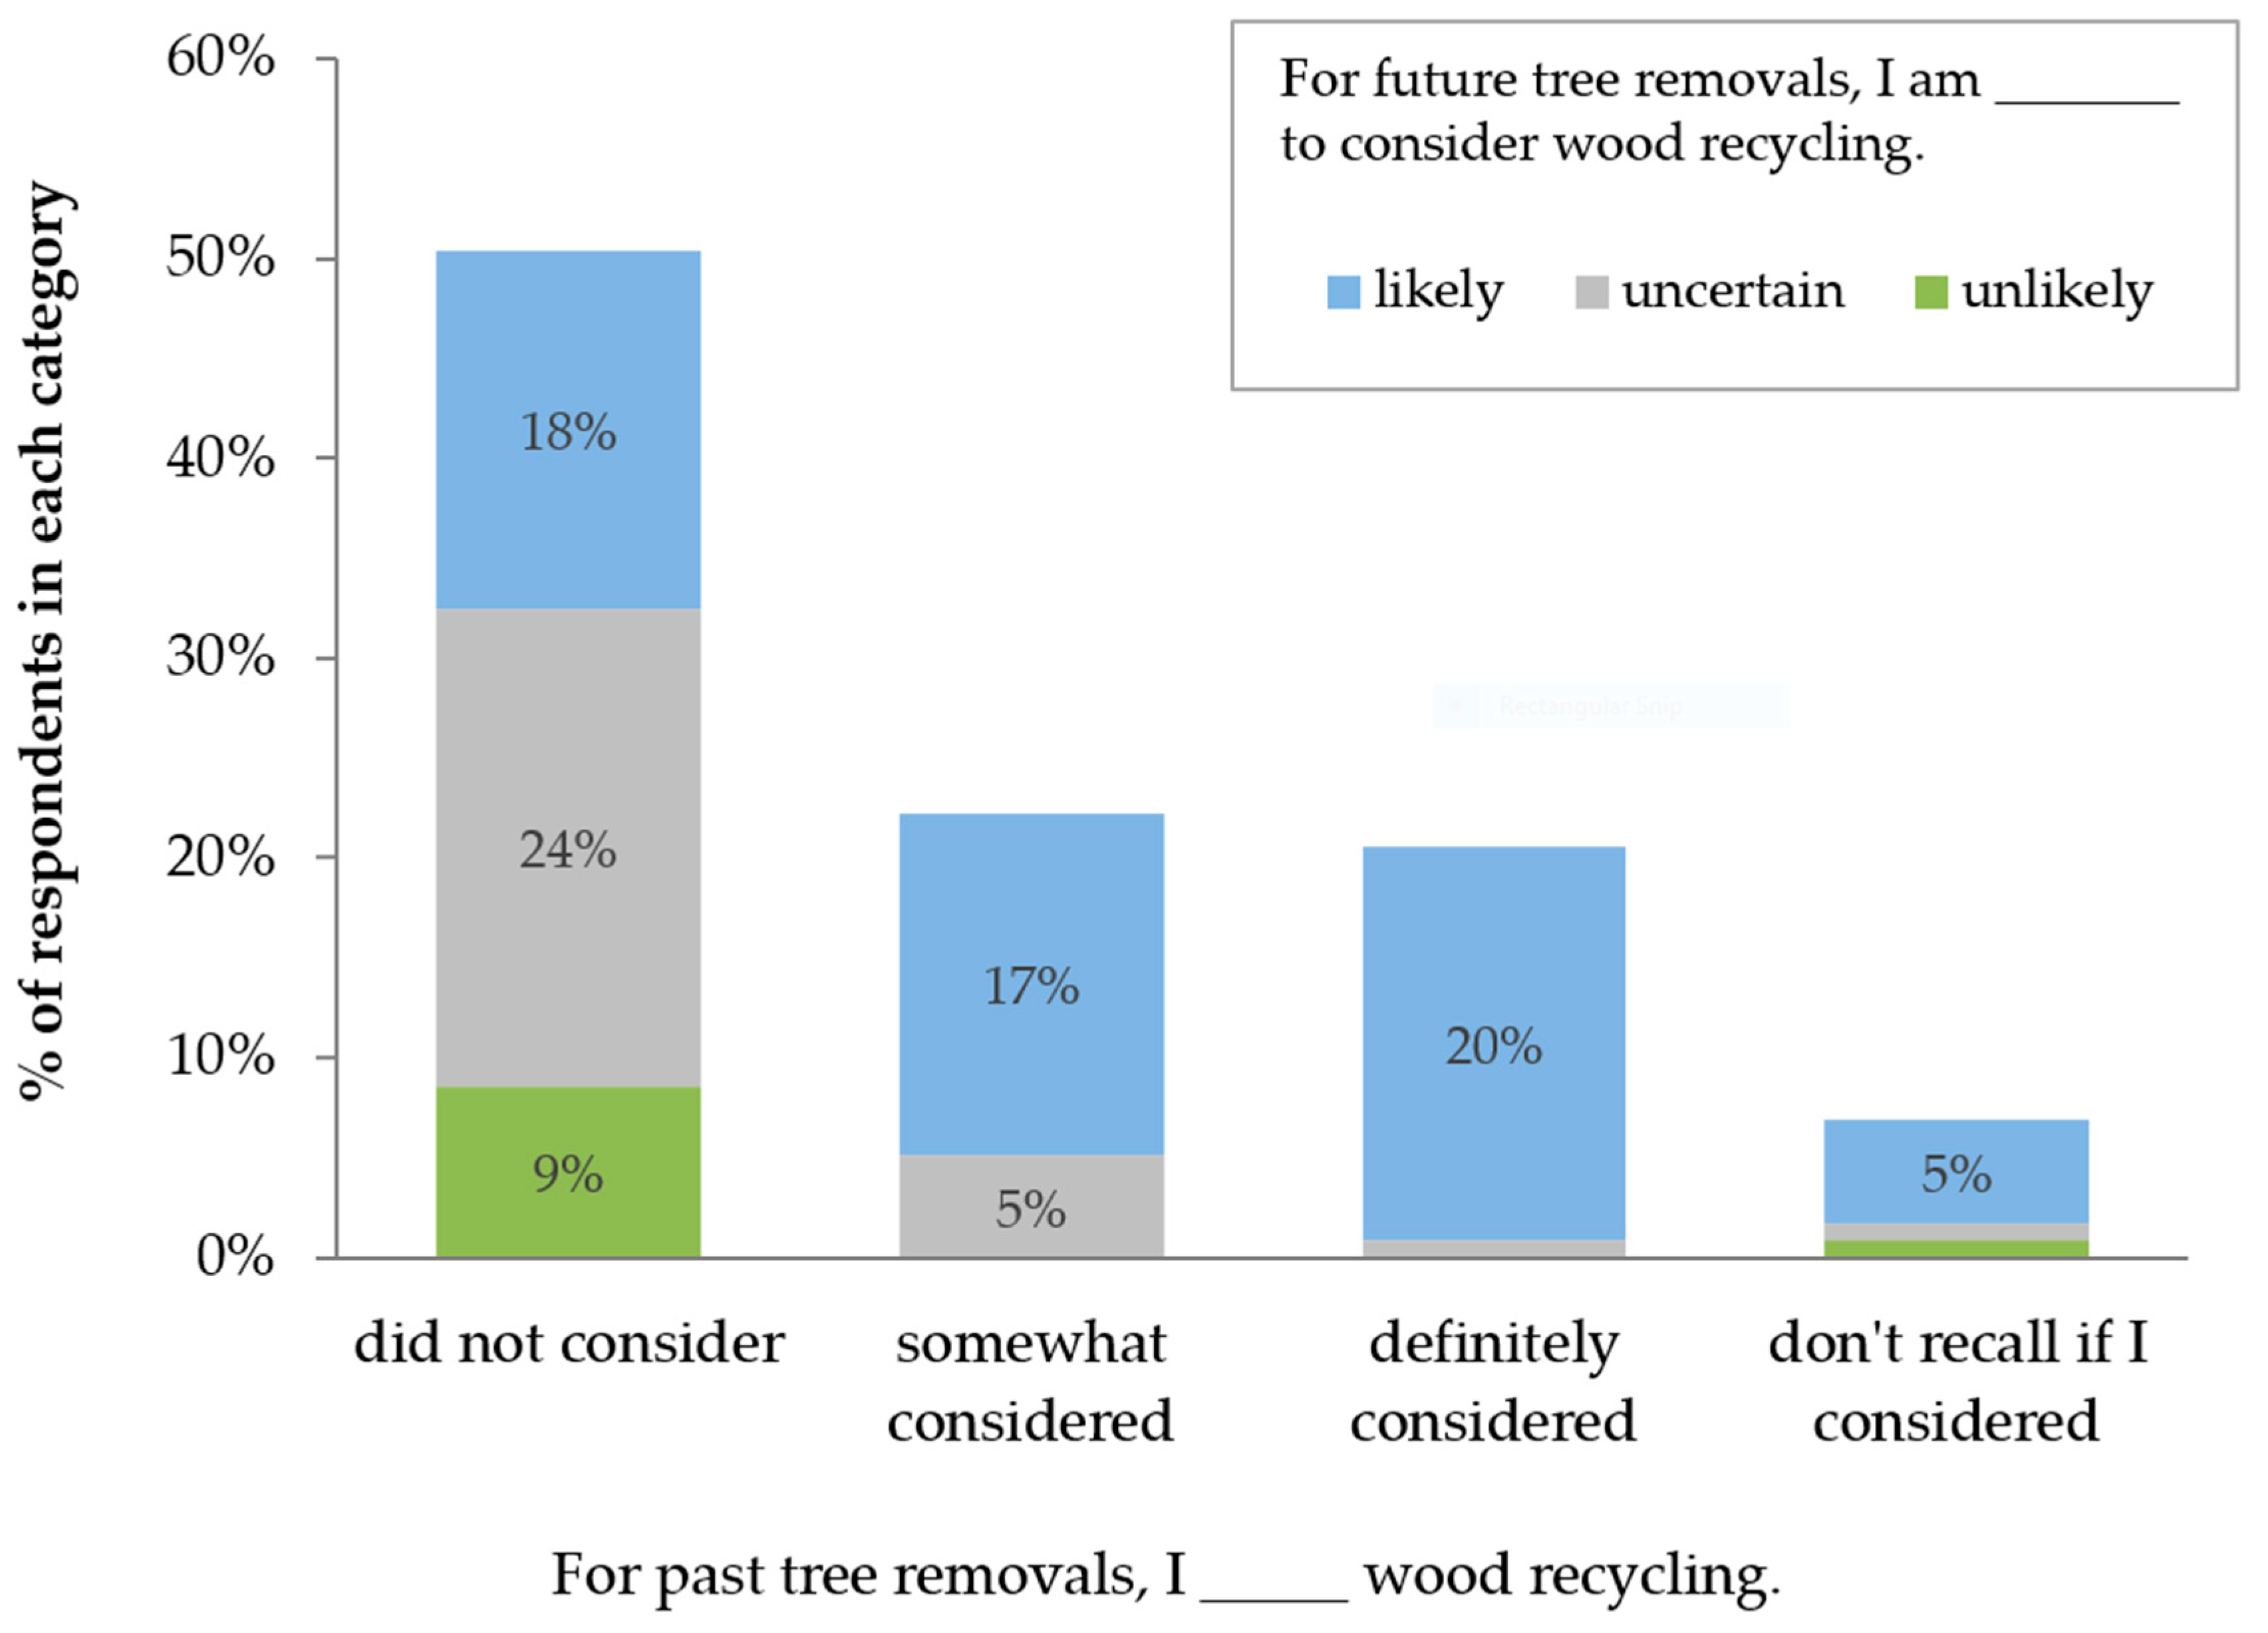
To the question, “At the time that trees were removed from this property, did you consider recycling the wood?”, half of respondents said that they did not consider it (50.4%), while nearly equal percentages somewhat (22.2%) or definitely (20.5%) considered it (
Figure 4). These results correlate with respondents’ self-identified recycling habits, as 47% of respondents reported rarely or never recycling wood from tree removals (see
Section 3.2). Along with food waste, wood waste was the least recycled item among the 12 household items included in the survey. The majority of those who reported never recycling wood identified a lack of awareness of utilization options (72.0%), while the remaining respondents indicated that they were uninterested (20.0%) or it was cost prohibitive (8.0%). This points to the need for outreach to either make people aware of their local recycling options or to share information about the economic and environmental benefits of urban wood utilization.
Though many of the surveyed households reported no past recycling, when asked “If there were trees on this property that needed to be removed in the future, how likely would you be to seek out recycling of the wood?”, the majority (61.5%) indicated that they would be likely to recycle the wood. A much smaller percentage (7.5%) indicated that they would be unlikely to pursue recycling. While this result bodes well for future promotion of wood utilization, there is still a significant degree of uncertainty among respondents (31.0%). In particular, uncertainty regarding future participation is high among respondents who do not currently recycle (
Figure 4). While there are numerous financial and logistical considerations for tree debris recycling, this uncertainty further points to the need for outreach to empower good decision-making and to break down barriers to participation in recycling programs.
Financial, technical, and logistical factors are commonly cited as barriers to increasing urban wood utilization in commercial and municipal sectors [
16,
23,
24]. Residential property owners likely perceive similar impediments, which may temper their participation in tree debris recycling. Identifying these impediments could improve commercial and municipal utilization services for households while also informing outreach or technical assistance aimed at increasing household recycling. Respondents were presented in the survey with a list of factors that might influence future recycling participation (
Figure 5). The two factors most frequently selected as important or very important were timely removal of the wood (85.6%) and free curbside pick-up of the wood (79.6%), similar to the convenience and cost considerations deemed important for past tree removals. For these types of urban/suburban households, it is clear that getting rid of the tree debris quickly and not being inconvenienced by the process are key considerations.
These concerns mesh closely with the logistical barriers identified by the commercial and municipal sectors [
16]. Handling and transporting urban wood is labor- and equipment-intensive, requiring careful logistical planning for economic feasibility. Commercial tree care firms often forgo specialized equipment or staff expertise needed to recover merchantable sawlogs, instead partnering with a logger or sawyer to haul wood from residential properties. This may result in undesirable time lags in removing wood from clients’ properties. A similar problem may arise if tree debris is moved to the curbside for municipal pick-up and recycling. While the household trash service typically operates on a weekly schedule, yard waste pick-up may only occur monthly or seasonally, resulting in objectionable wait times for property owners. Logistical and networking systems that reduce the downtime between tree felling and debris recovery might ease concerns about debris residence time and increase the economic feasibility of utilization. A networking tool has already been deployed nationwide in the form of a smartphone app that connects tree care firms generating wood chips with individuals who use wood chips as mulch or compost [
44]. Similar technologies could be developed in the commercial or municipal sectors to coordinate curbside pick-up of tree debris with residential property owners.
Since residential tree removals reported in our survey were frequently performed by property owners, it was intuited that the majority of respondents (77.6%) indicated that knowing who to contact to handle the wood was also important to future recycling participation (
Figure 5). A lack of connection between wood waste generators and processors has been previously identified as a barrier to utilization [
16,
24,
25]. In an effort to facilitate such contact, business directories have been created by the Virginia Urban Wood Group and Southeast Urban Wood Exchange. What seems less important (or less certain) to respondents is having either a direct benefit from the recycling (either through compensation or a share of the goods) or an indirect benefit by supporting a local wood product industry. Instead, these respondents were more strongly motivated to participate in recycling by their desire to keep wood out of the landfill, which was cited as being important by 71.1% of respondents (
Figure 5). This property owner sentiment likely contributes to motivations for urban wood utilization by commercial tree care firms, which have cited environmental sustainability of the community among their main motivations [
16]. Overall, this suggests that outreach to residential property owners should continue to highlight the environmental benefits of recycling wood and clarify expectations about economic benefits and costs for individuals and the community. Our survey further revealed that information and messaging about wood recycling should be readily available on the internet and perhaps directly communicated through the municipality.
Support for a municipal program that recycles wood from street trees, park trees, and other neighborhood trees was viewed positively by nearly all respondents (91.9%). This indicates that there is a sentimentality toward not wanting to see trees “go to waste” and that people might support public–private partnerships or municipal programs aimed at increasing wood recycling. Furthermore, the majority of respondents expressed interest in purchasing products made from community trees, particularly mulch (81%), artisanal pieces (62%), and furniture (56%). With that said, data on program support and purchasing intentions should be interpreted with caution as they represent idealistic and perhaps abstract statements with little indication of practical or financial constraints. These survey respondents also represent only one stakeholder perspective in an entire municipality, albeit one that would likely be a major contributor to the viability of a program through its tree debris generation and purchasing power for wood products.
3.7. Determinants of Future Wood Recycling Intentions
Results of the binary logistic regression of future wood recycling intentions are provided in
Supplementary File S2. Using backward elimination techniques, two of the 11 variables that were hypothesized to be important determinants of future recycling intentions were removed from the regression. These variables included household income and gender. The remaining nine explanatory variables were input into a forward entry model. The resulting model was significant at the 0.05 level (χ
2(25) = 40.005,
p = 0.029), explaining 43.9% (Nagelkerke R
2) of the variance in future recycling intentions. The percentage of cases that were correctly classified equaled 77%, with respondents who were “likely” to participate in future wood recycling classified correctly 87% of the time; respondents who were “uncertain or unlikely” were classified correctly 60% of the time. The Hosmer–Lemeshow goodness-of-fit test statistic suggests that the model is a good fit to the data as
p = 0.191 (>0.05).
Which variables contributed the strongest signals to the model? In this exploratory model, the number of existing yard trees (
B = 0.210,
p = 0.059) and the number of trees removed in the past (
B = 0.136,
p = 0.077) on the parcel played a significant role in predicting future recycling intentions. In other words, households with prior experience of removing trees and a higher number of trees on their parcel were more likely to indicate future intention to recycle tree debris. Respondents’ current recycling habits and their commitment to recycling (as measured by the GBI) were also significant predictors (
B = 0.103,
p = 0.003) of future wood recycling intentions. Our analyses demonstrated demographic variables, including income, education, gender, race, and age, to be unimportant in determining future recycling intentions. This finding was not unexpected given the divergent and sometimes contradictory findings that have been shown between demographic characteristics and general recycling behavior [
41]. Furthermore, respondents in this study represent a relatively narrow demographic group, characterized by an aging population that is predominantly white, middle-class, and well-educated. While perhaps not uncommon in small urbanizing enclaves, the population of this study is quite different from the population of single-family homeowners in large metropolitan areas in the Southeast U.S. The relative importance of socio-demographic variables in one geographic location may differ from another, thus warranting further research in this area. Such work should control or account for differences in parcel characteristics, including the number of trees on the parcel, as evidenced by these findings.
4. Conclusions
Within typical urban areas of the U.S., the character and management of trees on residential properties may be the least understood but perhaps the most important determinant of urban forest sustainability, as the majority of trees and planting spaces in the urban forest are typically located on private residential property. A small but growing area of research examines the ecology of residential urban forests [
45,
46] and the care and management of residential trees, including residents’ motivations and rationales for planting and removing trees [
37,
47,
48]. However, much less research has examined the fate of removed trees from residential property and the interest of homeowners in wood recycling and utilization programs. As urbanization expands, the amount of debris generated from displaced trees and forested areas will increase [
13], further justifying the need for more research on the disposal and utilization of debris from tree removals [
9].
Results of this case study indicate that most single-family households do not consider recycling tree debris at the time of removal, although some of this debris may be recycled without their participation when debris is hauled away by a contractor or the municipality. Of those who do recycle directly, most utilize tree debris as firewood or mulch. The emphasis on these lower-value products parallels the survey work conducted by the authors of [
16,
24] in many Southeastern U.S. municipalities and may be a function of insufficient resources to sort and process wood for high-value products or insufficient information about community demand for high-value products. In this survey study, many households indicated their potential participation in recycling if given appropriate information and services to guide their decisions and facilitate debris removal. Getting rid of tree debris quickly and not being inconvenienced by the process are important factors influencing willingness to participate in a recycling program.
In many localities, it is unlikely that a single property will generate a large enough volume of wood to make contract sawing economically feasible, so programs should focus on a neighborhood scale or larger. A large volume of wood coming from properties collectively could make a municipal scale recovery operation viable. With that said, while community buy-in and support for a municipal program is a key factor when initiating a wood recovery program, much more needs to be learned about the quantity and quality of wood supplied from residential properties in order to evaluate the economic viability of a program. Such work would ideally be coupled with research examining homeowners’ willingness-to-pay for various wood products derived from neighborhood trees and, separately, the fate of residential wood removed by contractors. Nearly two-thirds of households in this study reported that contractors hauled wood away from their property; however, our study did not ascertain what happens to wood after a contractor hauls it away. Work by the authors of [
15,
16] similarly report gaps in understanding exactly how wood waste is processed after removal by a contractor.
Taken collectively, research that explores the dynamics of urban wood quantity and quality and homeowners’ interest in recycled wood products could be used to inform municipal-scale wood recovery programs. Finding economically viable strategies to recycle the large amounts of tree debris flowing from urban forests annually, particularly into finished wood products that keep sequestered carbon stored, is an important step toward meeting sustainable urban forest management goals.


