Inequalities and the Impact of Job Insecurity on Health Indicators in the Spanish Workforce


Abstract
1. Introduction
2. Materials and Methods
2.1. Sample and Study Population
2.2. Dependent, Independent and Covariant Adjustment Variables
2.3. Statistical Analysis
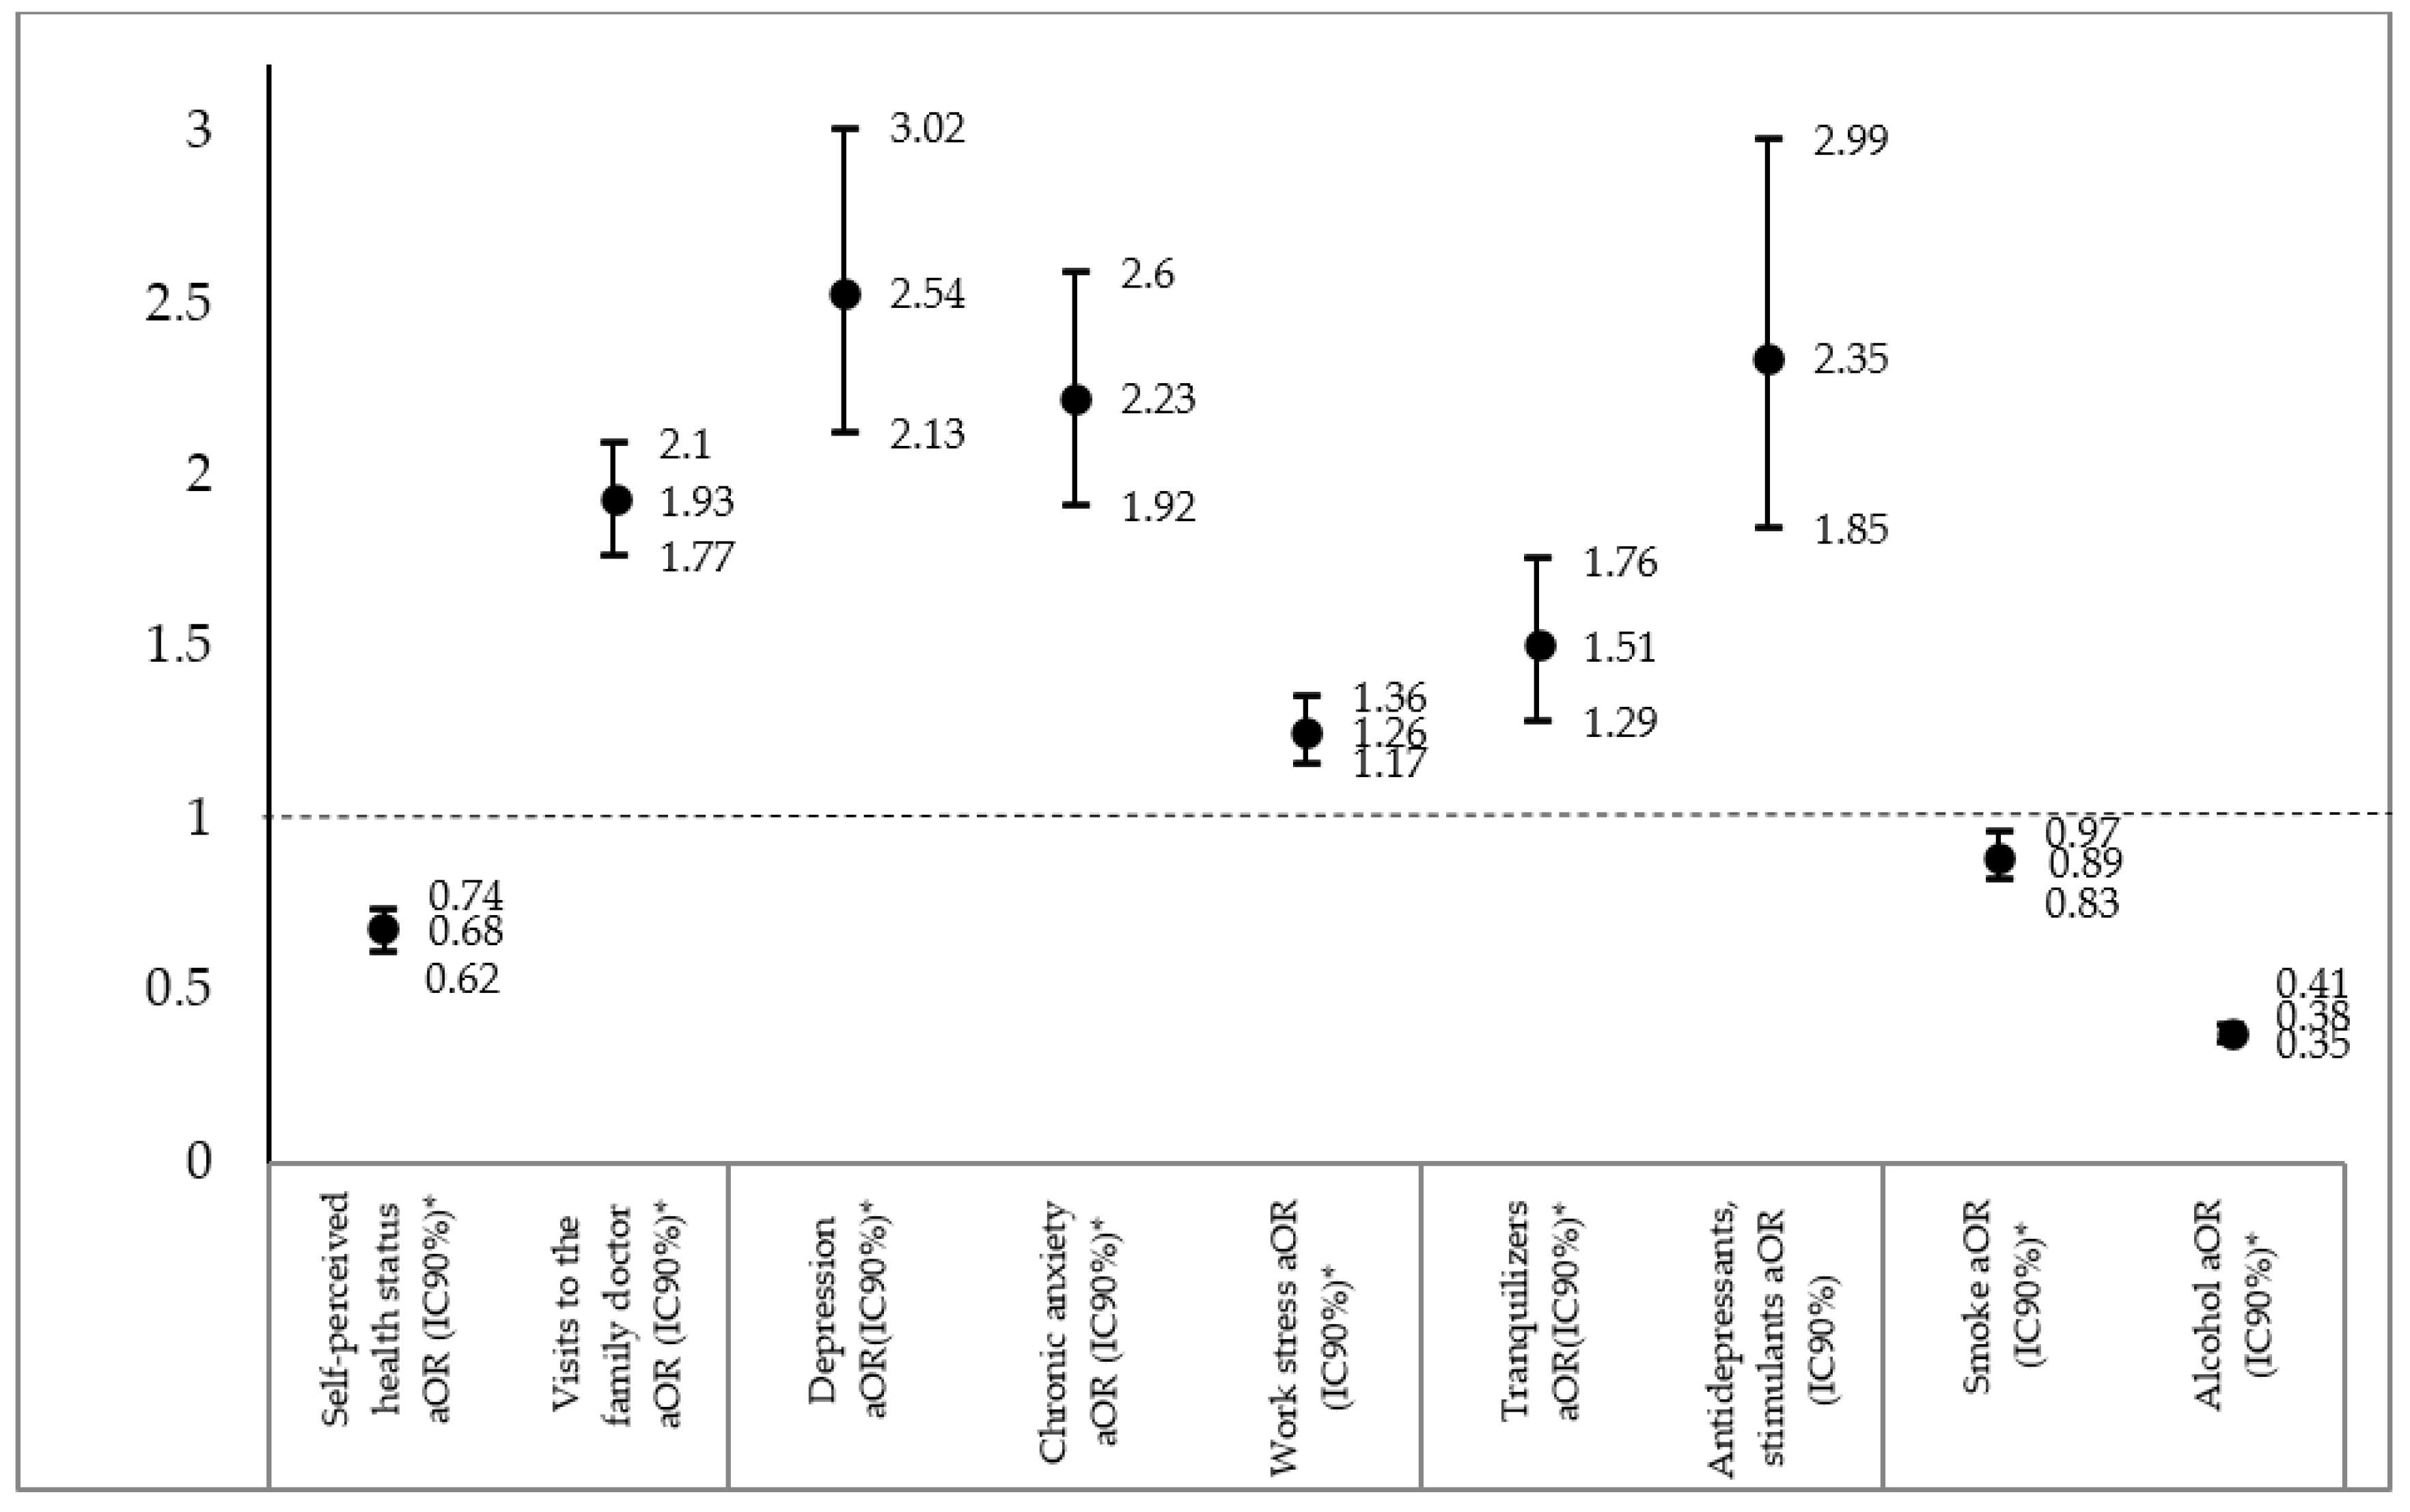
3. Results
3.1. Relationships between Socio-Labour Characteristics and Consumption Indicators in the Male Labour Force
3.2. Relationships between Socio-Labour Characteristics and Consumption Indicators in the Female Labour Force
4. Discussion
Limitations
5. Conclusions
Author Contributions
Funding
Acknowledgments
Conflicts of Interest
Appendix A

| Pathologies | Self-Perceived Ill Health Nº (%) a | Good Self-Perceived Health Nº (%) a | p–Value b |
|---|---|---|---|
| High blood pressure | 6047 (32) | 313 (7.5) | 0.000 |
| Myocardial infarction | 529 (2.8) | 17 (0.4) | 0.000 |
| Angina pectoris | 504 (2.7) | 11 (0.3) | 0.000 |
| Other heart diseases | 1535 (8.1) | 51 (1.2) | 0.000 |
| Varicose veins in the legs | 3298 (17.5) | 219 (5.2) | 0.000 |
| Arthrosis | 5304 (28.2) | 155 (3.7) | 0.000 |
| Back pain (cervical) | 4007 (21.2) | 130 (3.1) | 0.000 |
| Back pain (lumbar) | 5199 (27.5) | 190 (4.5) | 0.000 |
| Chronic allergy | 3447 (18.3) | 469 (11.2) | 0.000 |
| Asthma | 1280 (6.8) | 139 (3.3) | 0.000 |
| Bronchitis | 1152 (6.1) | 34 (0.8) | 0.000 |
| Diabetes | 2214 (11.7) | 61 (1.5) | 0.000 |
| Stomach ulcer | 1040 (5.5) | 42 (1) | 0.000 |
| Urinary incontinence | 1422 (7.5) | 43 (1) | 0.000 |
| High cholesterol | 5207 (27.6) | 323 (5.8) | 0.000 |
| Cataracts | 2881 (15.3) | 126 (3) | 0.000 |
| Skin problems | 1371 (7.3) | 126 (3) | 0.000 |
| Chronic constipation | 1123 (5.9) | 33 (0.8) | 0.000 |
| Liver dysfunction | 336 (1.8) | 12 (0.3) | 0.000 |
| Ictus | 498 (2.6) | 10 (0.2) | 0.000 |
| Frequent headaches | 2450 (13) | 166 (6.3) | 0.000 |
| Hemorrhoids | 1830 (9.7) | 136 (3.2) | 0.000 |
| Malignant tumors | 1130 (6) | 53 (1.3) | 0.000 |
| Osteoporosis | 1177 (6.2) | 40 (1) | 0.000 |
| Thyroid problems | (1526 (8.1) | 122 (2.9) | 0.000 |
| Kidney problems | 1145 (6.1) | 35 (0.8) | 0.000 |
| Dependent Variables | |||||||||
|---|---|---|---|---|---|---|---|---|---|
| Selection Regressors | Self-Perceived Health Status | Visits to the Family Doctor | Depression | Chronic Anxiety | Work Stress | TRANQUILIZERS | Antidepressants, Stimulants | Smoking | Alcohol |
| Selection Variable: Labor Market Participation Reference Category = Participates | |||||||||
| Coefficients (Standard Errors) | |||||||||
| Const | 0.580308 *** (0.144644) | 0.58030 *** (0.144644) | 0.58663 *** 0.144724 | 0.57940 *** (0.144529) | 0.55839 *** (0.149458) | −0.0696068 (0.162769) | −0.0605752 (0.163026) | 0.59434 *** (0.143625) | 0.5837 *** 0.144749 |
| Age | −0.127013 *** (0.0181994) | −0.1270 *** (0.018199) | −0.1279 *** 0.0182110 | −0.1232 *** (0.018443) | −0.1216 *** (0.020210) | −0.04986 ** (0.020718) | −0.0517226 ** (0.0207184) | −0.1272 *** (0.018069) | −0.1275 *** 0.0182146 |
| Nationality | 0.0539992 (0.0521977) | 0.0539992 (0.052197) | 0.0505017 (0.052265) | 0.0388518 (0.052780) | 0.0587547 (0.052681) | 0.0539741 (0.057980) | 0.0474748 (0.0585688) | 0.032670 (0.052608) | 0.0568324 0.0208021 |
| Marital status | 0.0560410 *** (0.0207951) | 0.05604 *** (0.020795) | 0.05636 *** 0.0207978 | 0.05985 *** (0.020785) | 0.05703 *** (0.020811) | 0.07197 *** (0.022819) | 0.0745274 *** (0.0231137) | 0.06513 *** (0.020811) | −0.5189 *** 0.0320898 |
| Education level | 0.168384 (0.0513444) | −0.5175 *** (0.032069) | −0.5178 *** 0.0320754 | −0.5217 *** (0.032004) | −0.5183 *** (0.032044) | 0.47523 *** (0.035425) | −0.472219 *** (0.0356332) | −0.5169 *** (0.032019) | −0.5189 *** 0.0320898 |
| Type of family life | −0.095654 *** (0.0269741) | −0.0956 *** (0.026974) | −0.0960 ** 0.0269798 | −0.0946 *** (0.026908) | −0.0970 0.0270509 | −0.0805 *** (0.029962) | −0.0868289 *** (0.0303375) | −0.0996 *** (0.026802) | −0.0952 *** 0.0269854 |
| Family care work | 0.168384 *** (0.0513444) | 0.16838 *** (0.051344) | 0.16905 *** 0.0513490 | 0.17170 *** (0.051159) | 0.16852 *** (0.051284) | 0.18299 *** (0.055725) | 0.186160 *** (0.0557636) | 0.16628 *** (0.051045) | 0.1694 *** 0.0513535 |
| Rho | 0.061416 | −0.024296 | 0.0190499 | −0.014888 | 0.077386 | −0.026900 | −0.022732 | −0.024091 | −0.017310 |
References
- Rigby, M.; García-Calavia, M.Á. Institutional resources as a source of trade union power in Southern Europe. Eur. J. Ind. Relat. 2018, 24, 129–143. [Google Scholar] [CrossRef]
- Barranco, O.; Molina, Ó. Sindicalismo y crisis económica: Amenazas, retos y oportunidades. Kultur Rev. Interdisc. Sobre Cult. Ciutat 2014, 1, 171–194. [Google Scholar] [CrossRef]
- Benner, M. Before and Beyond the Global Economic Crisis; Edward Elgar: Cheltenham, UK, 2013. [Google Scholar]
- Gago, A. Crisis, cambio en la UE y estrategias sindicales: El impacto de la condicionalidad en el repertorio estratégico de los sindicatos españoles durante la crisis de la eurozona. Rev. Esp. Cienc. Polít. 2016, 42, 45–68. [Google Scholar] [CrossRef]
- Beneyto, P.J.; Alós, R.; Jódar, P.; Vidal, S. La afiliación sindical en la crisis Estructura, evolución y trayectorias. Sociol. Trab. 2016, 87, 25–44. [Google Scholar]
- Lehndorff, S. Acting in different worlds. Challenges to transnational trade union cooperation in the eurozone crisis. Transf. Eur. Rev. Labour Res. 2015, 21, 157–170. [Google Scholar] [CrossRef]
- Stuckler, D.; Basu, S.; Suhrcke, M.; Coutts, A.; McKee, M. The public health effect of economic crises and alternative policy responses in Europe: An empirical analysis. Lancet 2009, 374, 315–323. [Google Scholar] [CrossRef]
- Stuckler, D.; King, L.; McKee, M. Mass Privatisation and the Post-Communist Mortality Crisis: A Cross-National Analysis. Lancet 2009, 373, 399–407. [Google Scholar] [CrossRef]
- Bacigalupe, A.; Martín, U.; Font, R.; González-Rábago, Y.; Bergantiños, N. Austeridad y privatización sanitaria en época de crisis: ¿existen diferencias entre las comunidades autónomas? Gac. Sanit. 2016, 30, 47–51. [Google Scholar] [CrossRef]
- Cabrera-León, A.; Codina, A.D.; Mateo, I.; Arroyo-Borrell, E.; Bartoll, X.; Bravo, M.J.; Domínguez-Berjón, M.F.; Renart, G.; Álvarez-Dardet, C.; Marí-Dell’Olmo, M.; et al. Indicadores contextuales para evaluar los determinantes sociales de la salud y la crisis económica española. Gac. Sanit. 2017, 31, 194–203. [Google Scholar] [CrossRef]
- Del Pozo-Rubio, R.; Pardo-García, I.; Escribano-Sotos, F. El copago de dependencia en España a partir de la reforma estructural de 2012. Gac. Sanit. 2017, 31, 23–29. [Google Scholar] [CrossRef]
- Ferrando, J.; Palència, L.; Gotsens, M.; Puig-Barrachina, V.; Marí-Dell’Olmo, M.; Rodríguez-Sanz, M.; Bartoll, X.; Borrell, C. Trends in cancer mortality in Spain: The influence of the financial crisis. Gac. Sanit. 2019, 33, 229–234. [Google Scholar] [CrossRef] [PubMed]
- Porthé, V.; Vargas, I.; Ronda, E.; Malmusi, D.; Bosch, L.; Vázquez, M.L. Has the quality of health care for the immigrant population changed during the economic crisis in Catalonia (Spain)? Opinions of health professionals and immigrant users. Gac. Sanit. 2018, 32, 425–432. [Google Scholar] [CrossRef] [PubMed]
- Benavides, F.G.; Delclós, J.; Serra, C. Estado de bienestar y salud pública: El papel de la salud laboral. Gac. Sanit. 2018, 32, 377–380. [Google Scholar] [CrossRef]
- Sverke, M.; Hellgren, J.; Näswall, K. No Security: A Meta-Analysis and Review of Job Insecurity and Its Consequences. J. Occup. Health Psychol. 2002, 7, 242–264. [Google Scholar] [CrossRef] [PubMed]
- Valenzuela, H.C. Precariedad, precarización y trabajo precario. Polis 2015, 40, 313–329. [Google Scholar]
- Shoss, M.K. Job insecurity: An integrative review and agenda for future research. J. Manag. 2017, 43, 1911–1939. [Google Scholar] [CrossRef]
- Green, F. Demanding Work: The Paradox of Job Quality in the Affluent Economy; Princeton University Press: Oxford, UK, 2006. [Google Scholar]
- Büssing, A. Can Control at Work and Social Support Moderate Psychological Consequences of Job Insecurity? Results from a Quasi-experimental Study in the Steel Industry. Eur. J. Work. Organ. Psychol. 1999, 8, 219–242. [Google Scholar] [CrossRef]
- Green, F. Unpacking the misery multiplier: How employability modifies the impacts of unemployment and job insecurity on life satisfaction and mental health. J. Health Econ. 2011, 30, 265–276. [Google Scholar] [CrossRef]
- Green, F.; Mostafa, T. Trends in Job Quality in Europe; Publications Office of the European Union: Luxembourg, 2012. [Google Scholar]
- Greenhalgh, L.; Rosenblatt, Z. Job Insecurity: Toward Conceptual Clarity. Acad. Manag. Rev. 1984, 9, 438. [Google Scholar] [CrossRef]
- Stock, R. Socio-Economic Security, Justice and the Psychology of Social Relationships; International Labour Office: Geneva, Switzerland, 2001. [Google Scholar]
- Klandermans, B.; Hesselink, J.K.; van Vuuren, T. Employment status and job insecurity: On the subjective appraisal of an objective status. Econ. Ind. Democr. 2010, 31, 557–577. [Google Scholar] [CrossRef]
- De Witte, H.; Näswall, K. “Objective” vs “Subjective” Job Insecurity: Consequences of Temporary Work for Job Satisfaction and Organizational Commitment in Four European Countries. Econ. Ind. Democr. 2003, 24, 149–188. [Google Scholar] [CrossRef]
- Benach, J.; Vives, A.; Amable, M.; Vanroelen, C.; Tarafa, G.; Muntaner, C. Precarious Employment: Understanding an Emerging Social Determinant of Health. Annu. Rev. Public Health 2014, 35, 229–253. [Google Scholar] [CrossRef] [PubMed]
- Ferrie, J.E.; Westerlund, H.; Virtanen, M.; Vahtera, J.; Kivimäki, M. Flexible labor markets and employee health. SJWEH 2008, 6, 98–110. [Google Scholar]
- Dickerson, A.; Green, F. Fears and realisations of employment insecurity. Labour Econ. 2012, 19, 198–210. [Google Scholar] [CrossRef]
- Chung, H. Dualization and subjective employment insecurity: Explaining the subjective employment insecurity divide between permanent and temporary workers across 23 European countries. Econ. Ind. Democr. 2016, 40, 700–729. [Google Scholar] [CrossRef]
- De Cuyper, N.; De Witte, H. Temporary Employment and Perceived Employability: Mediation by Impression Management. J. Career Dev. 2010, 37, 635–652. [Google Scholar] [CrossRef]
- Heponiemi, T.; Elovainio, M.; Pentti, J.; Virtanen, M.; Westerlund, H.; Virtanen, P.; Oksanen, T.; Kivimäki, M.; Vahtera, J. Association of Contractual and Subjective Job Insecurity with Sickness Presenteeism Among Public Sector Employees. J. Occup. Environ. Med. 2010, 52, 830–835. [Google Scholar] [CrossRef]
- Virtanen, M.; Kivimäki, M.; Elovainio, M.; Vahtera, J.; Ferrie, J. From insecure to secure employment: Changes in work, health, health related behaviours, and sickness absence. Occup. Environ. Med. 2003, 60, 948–953. [Google Scholar] [CrossRef]
- López-Gómez, M.A.; Durán, X.; Zaballa, E.; Sanchez-Niubo, A.; Delclos, G.L.; Benavides, F.G. Cohort profile: The Spanish WORKing life Social Security (WORKss) cohort study. BMJ Open 2016, 6, e8555. [Google Scholar] [CrossRef][Green Version]
- Serra, L.; López-Gómez, M.A.; Sanchez-Niubo, A.; Delclos, G.L.; Benavides, F.G. Application of latent growth modeling to identify different working life trajectories: The case of the Spanish WORKss cohort. Scand. J. Work. Environ. Health 2016, 43, 42–49. [Google Scholar] [CrossRef]
- Kivimäki, M.; Vahtera, J.; Pentti, J.; Ferrie, J. Factors underlying the effect of organisational downsizing on health of employees: Longitudinal cohort study. BMJ 2000, 320, 971–975. [Google Scholar] [CrossRef] [PubMed]
- Vahtera, J.; Kivimäki, M.; Pentti, J.; Linna, A.; Virtanen, M.; Virtanen, P.; Ferrie, J. Organisational downsizing, sickness absence, and mortality: 10-town prospective cohort study. BMJ Clin. Res. Ed. 2004, 328, 555. [Google Scholar] [CrossRef]
- Marler, J.H.; Woodard-Barringer, M.; Milkovich, G.T. Boundaryless and traditional contingent employees: Worlds apart. J. Organ. Behav. 2002, 23, 425–453. [Google Scholar] [CrossRef]
- Cano, E. La extensión de la precariedad laboral como norma social. Soc. Y Utopía Rev. De Cienc. Soc. 2007, 29, 117–138. [Google Scholar]
- Katz, L.F.; Krueger, A.B. The Rise and Nature of Alternative Work Arrangements in the United States, 1995–2015. ILR Rev. 2018, 72, 382–416. [Google Scholar] [CrossRef]
- Aronsson, G.; Gustafsson, K.; Dallner, M. Work environment and health in different types of temporary jobs. Eur. J. Work. Organ. Psychol. 2002, 11, 151–175. [Google Scholar] [CrossRef]
- Fiori, F.; Rinesi, F.; Spizzichino, D.; Di Giorgio, G. Employment insecurity and mental health during the economic recession: An analysis of the young adult labour force in Italy. Soc. Sci. Med. 2016, 153, 90–98. [Google Scholar] [CrossRef]
- Hammarström, A. Health consequences of youth unemployment—Review from a gender perspective. Soc. Sci. Med. 1994, 38, 699–709. [Google Scholar] [CrossRef]
- Granado, A.E. Crisis económica, políticas, desempleo y salud (mental). Rev. Asoc. Española Neuropsiquiatría 2014, 34, 385–404. [Google Scholar] [CrossRef]
- Serrano-Rosa, M.A.; Baena, S.; Molins-Correa, F. Diferencias entre empleabilidad, inseguridad laboral y salud en trabajadores y desempleados. Acción Psicológica 2018, 15, 87–102. [Google Scholar] [CrossRef]
- Berntson, E.; Marklund, S. The Relationship Between Perceived Employability and Subsequent Health. Work Stress 2007, 21, 279–292. [Google Scholar] [CrossRef]
- Vanhercke, D.; De Cuyper, N.; Peeters, E.; De Witte, H. Defining Perceived Employability: A Psychological Approach. Pers. Rev. 2014, 43, 592–605. [Google Scholar] [CrossRef]
- de Grip, A.; van Loo, J.; Sanders, J. The Industry Employability Index: Taking Account of Supply and Demand Characteristics. Int. Labour Rev. 2004, 143, 211–233. [Google Scholar] [CrossRef]
- Allebeck, P. Health Effects of the Crisis: Challenges for Science and Policy. Eur. J. Public Health 2013, 23, 721. [Google Scholar] [CrossRef] [PubMed][Green Version]
- Bernal, J.L.; Gasparrini, A.; Artundo, C.M.; McKee, M. The Effect of the Late 2000s Financial Crisis on Suicides in Spain: An Interrupted Time-Series Analysis. Eur. J. Public Health 2013, 23, 732–736. [Google Scholar] [CrossRef]
- Salvador-Carulla, L.; Roca, M. Mental Health Impact of the Economic Crisis in Spain. Int. J. Psychiatry 2013, 10, 8–10. [Google Scholar]
- Urbanos-Garrido, R.; López-Valcárcel, B.G. The influence of the economic crisis on the association between unemployment and health: An empirical analysis for Spain. Eur. J. Health Econ. 2014, 16, 175–184. [Google Scholar] [CrossRef]
- Bartoll, X.; Palència, L.; Malmusi, D.; Suhrcke, M.; Borrell, C. The evolution of mental health in Spain during the economic crisis. Eur. J. Public Health 2013, 24, 415–418. [Google Scholar] [CrossRef]
- Sirviö, A.; Ek, E.; Jokelainen, J.; Koiranen, M.; Järvikoski, T.; Taanila, A. Precariousness and discontinuous work history in association with health. Scand. J. Public Health 2012, 40, 360–367. [Google Scholar] [CrossRef]
- Benavides, F.G.; Ruiz-Forès, N.; Delclós, G.; Domingo-Salvany, A. Consumo de alcohol y otras drogas en el medio laboral en España. Gac. Sanit. 2013, 27, 248–253. [Google Scholar] [CrossRef][Green Version]
- Arias-Uriona, A.M.; Ordóñez, J.C. Factores de precariedad laboral y su relación con la salud de trabajadores en Bolivia. Rev. Panam. Salud Pública 2018, 42, e98. [Google Scholar] [CrossRef] [PubMed]
- García-Díaz, V.; Fernández-Feito, A.; Arias, L.; Lana, A. Consumo de tabaco y alcohol según la jornada laboral en España. Gac. Sanit. 2015, 29, 364–369. [Google Scholar] [CrossRef] [PubMed][Green Version]
- Colell, E.; Sanchez-Niubo, A.; Benavides, F.G.; Delclos, G.L.; Domingo-Salvany, A. Work-related stress factors associated with problem drinking: A study of the Spanish working population. Am. J. Ind. Med. 2014, 57, 837–846. [Google Scholar] [CrossRef] [PubMed]
- Colell, E.; Sanchez-Niubo, A.; Ferrer, M.; Domingo-Salvany, A. Gender differences in the use of alcohol and prescription drugs in relation to job insecurity. Testing a model of mediating factors. Int. J. Drug Policy 2016, 37, 21–30. [Google Scholar] [CrossRef] [PubMed][Green Version]
- Colell, E.; Sánchez-Niubò, A.; Domingo-Salvany, A.; Delclos, G.; Benavides, F.G. Prevalencia de consumo de hipnosedantes en población ocupada y factores de estrés laboral asociados. Gac. Sanit. 2014, 28, 369–375. [Google Scholar] [CrossRef]
- Arias de la Torre, J.; Molina, A.J.; Fernández-Villa, T.; Artazcoz, L.; Martín, V. Mental health, family roles and employment status inside and outside the household in Spain. Gac. Sanit. 2019, 33, 235–241. [Google Scholar] [CrossRef]
- Virtanen, M.; Honkonen, T.; Kivimäki, M.; Ahola, K.; Vahtera, J.; Aromaa, A.; Lönnqvist, J. Work stress, mental health and antidepressant medication findings from the Health 2000 Study. J. Affect. Disord. 2007, 98, 189–197. [Google Scholar] [CrossRef]
- Wang, J. Work stress as a risk factor for major depressive episode(s). Psychol. Med. 2004, 35, 865–871. [Google Scholar] [CrossRef]
- Romelsjö, A.; Stenbacka, M.; Lundberg, M.; Upmark, M. A population study of the association between hospitalization for alcoholism among employees in different socio-economic classes and the risk of mobility out of, or within, the workforce. Eur. J. Public Health 2004, 14, 53–57. [Google Scholar] [CrossRef]
- Artazcoz, L.; Cortès, I.; Borrell, C.; Escribà-Agüir, V.; Cascant, L. Social inequalities in the association between partner/marital status and health among workers in Spain. Soc. Sci. Med. 2011, 72, 600–607. [Google Scholar] [CrossRef]
- Arcas, M.M.; Novoa, A.M.; Artazcoz, L. Gender inequalities in the association between demands of family and domestic life and health in Spanish workers. Eur. J. Public Health 2012, 23, 883–888. [Google Scholar] [CrossRef] [PubMed]
- Krieger, N. Genders, sexes, and health: what are the connections—And why does it matter? Int. J. Epidemiol. 2003, 32, 652–657. [Google Scholar] [CrossRef] [PubMed]
- Messing, K.; Mager Stellman, J. Sex, gender and women’s occupational health: The importance of considering mechanism. Environ. Res. 2006, 101, 149–162. [Google Scholar] [CrossRef]
- Hankivsky, O.; Christoffersen, A. Intersectionality and the determinants of health: A Canadian perspective. Crit. Public Health 2008, 18, 271–283. [Google Scholar] [CrossRef]
- Hankivsky, O. Women’s health, men’s health, and gender and health: Implications of intersectionality. Soc. Sci. Med. 2012, 74, 1712–1720. [Google Scholar] [CrossRef]
- Ministerio De Sanidad Consumo Y Bienestar Social. Encuesta Nacional de Salud 2017. ENSE 2017 Metodología. 2017. Available online: https://www.ine.es/metodologia/t15/t153041917.pdf11 (accessed on 24 March 2020).
- Henares-Montiel, J.; Ruiz-Pérez, I.; Sordo, L. Salud mental en España y diferencias por sexo y por comunidades autónomas. Gac. Sanit. 2020, 34, 114–119. [Google Scholar] [CrossRef]
- Beneyto, P.J.; Payá, R. Mercado de trabajo y estructura ocupacional. In Estructura Social Contemporánea; Perelló, S., Ed.; Tirant lo Blanch: Valencia, Spain, 2019; pp. 169–204. [Google Scholar]
- Croezen, S.; Burdorf, A.; Van Lenthe, F.J. Self-perceived health in older Europeans: Does the choice of survey matter? Eur. J. Public Health 2016, 26, 686–692. [Google Scholar] [CrossRef]
- Gumà, J.; Arpino, B.; Solé-Auró, A. Determinantes sociales de la salud de distintos niveles por género: Educación y hogar en España. Gac. Sanit. 2019, 33, 127–133. [Google Scholar] [CrossRef]
- De Bruin, A.; Picavet, H.S.J.; Nossikov, A. Health Interview Surveys. Towards Interna-Tional Harmonization of Methods and Instruments; WHO Regional Office for Europe: Copenhagen, Denmark, 1996. [Google Scholar]
- Simó-Noguera, C.; Hernández-Monleón, A.; Muñoz-Rodríguez, D.; González-Sanjuán, M.E. El efecto del estado civil y de la convivencia en pareja en la salud. Rev. Española Investig. Sociológicas 2015, 151, 141–166. [Google Scholar] [CrossRef]
- Teixidó-Compañó, E.; Espelt, A.; Sordo, L.; Bravo, M.J.; Sarasa-Renedo, A.; Indave, B.I.; Bosque-Prous, M.; Brugal, M.T. Differences between men and women in substance use: The role of educational level and employment status. Gac. Sanit. 2018, 32, 41–47. [Google Scholar] [CrossRef]
- Wittchen, H.U.; Jacobi, F.; Rehm, J.; Gustavsson, A.; Svensson, M.; Jönsson, B.; Olesen, J.; Allgulander, C.; Alonso, J.; Faravelli, C.; et al. The size and burden of mental disorders and other disorders of the brain in Europe 2010. Eur. Neuropsychopharmacol. 2011, 21, 655–679. [Google Scholar] [CrossRef] [PubMed]
- Bosque-Prous, M.; Espelt, A.; Borrell, C.; Bartroli, M.; Guitart, A.M.; Villalbi, J.R.; Brugal, T. Gender differences in hazardous drinking among middle-aged in Europe: The role of social context and women’s empowerment. Eur. J. Public Health 2015, 25, 698–705. [Google Scholar] [CrossRef] [PubMed]
- Mäkelä, P.; Gmel, G.; Grittner, U.; Kuendig, H.; Kuntsche, S.; Bloomfield, K.; Room, R. Drinking patterns and their gender differences in Europe. Alcohol Alcohol. Suppl. 2006, 41, i8–i18. [Google Scholar] [CrossRef] [PubMed]
- Eurofound. European Working Conditions Survey 2015. Available online: https://www.eurofound.europa.eu/data/european-working-conditions-survey (accessed on 1 April 2020).
- Barros, A.R.R.; Griep, R.H.; Rotenberg, L. Self-medication among nursing workers from public hospitals. Rev. Latinoam. Enferm. 2010, 17, 1015–1022. [Google Scholar] [CrossRef]
- Sobradiel, N.; García-Vicent, V. Consumo de tabaco y patología psiquiátrica. Trastor. Adict. 2007, 9, 31–38. [Google Scholar] [CrossRef]
- Benavides, F.G.; Benach, J.; Román, C. Tipos de empleo y salud: Análisis de la segunda Encuesta Europea de Condiciones de Trabajo. Gac. Sanit. 1999, 13, 425–430. [Google Scholar] [CrossRef]
- Castillo, J.J.Y.; Agulló, I. Trabajo y Vida en la Sociedad de la Información. Un Distrito Tecnológico en el Norte de Madrid; La Catarata: Madrid, Spain, 2012. [Google Scholar]
- Sánchez, A.L. La participación de los trabajadores en la calidad total: Nuevos dispositivos disciplinarios de organización del trabajo. Rev. Española Investig. Sociológicas 2004, 106, 63. [Google Scholar] [CrossRef]
- Pérez-Zapata, O.; Alvarez-Hernández, G.; Castaño-Collado, C.; Lahera-Sánchez, A. Sostenibilidad y calidad del trabajo en riesgo: La intensificación del trabajo del conocimiento. Rev. Minist. Empl. Y Segur. Soc. 2015, 116, 175–214. [Google Scholar]
- Pinilla, J. La intensificación del esfuerzo de trabajo en España. Cuad. Relac. Labor. 2004, 22, 117–135. [Google Scholar]
- García, F.J.P.; López-Peláez, A. La intensificación del trabajo en España (2007–2011): Trabajo en equipo y flexibilidad. Rev. Española Investig. Sociológicas 2017, 160, 79–94. [Google Scholar] [CrossRef]
- Schieman, S.; Whitestone, Y.K.; van Gundy, K. The Nature of Work and the Stress of Higher Status. J. Health Soc. Behav. 2006, 47, 242–257. [Google Scholar] [CrossRef] [PubMed]
- Bøggild, H.; Knutsson, A. Shift work, risk factors and cardiovascular disease. Scand. J. Work. Environ. Health 1999, 25, 85–99. [Google Scholar] [CrossRef] [PubMed]

| Variables | Men (n = 6299; 51.4%) | Women (n = 5961; 48.6%) | p-Value b |
|---|---|---|---|
| n (%) a | n (%) a | ||
| Self-perceived health status | <0.001 | ||
| Bad | 1168 (18.5) | 1486 (24.9) | |
| Good | 5131 (81.5) | 4475 (75.1) | |
| Visits to the family doctor | <0.001 | ||
| No | 1902 (30.2) | 1069 (17.9) | |
| Yes | 4397 (69.8) | 4892 (82.1) | |
| Depression | <0.001 | ||
| No | 6012 (95.5) | 5391 (90.4) | |
| Yes | 285 (4.5) | 566 (9.5) | |
| DK/DA | 2 (0.0) | 4 (0.1) | |
| Chronic anxiety | <0.001 | ||
| No | 5960 (94.6) | 5302 (89.0) | |
| Yes | 334 (5.3) | 651 (10.9) | |
| DK/DA | 5 (0.1) | 8 (0.1) | |
| Stress | <0.001 | ||
| No | 2670 (51.7) | 2209 (48.1) | |
| Yes | 2484 (48.1) | 2388 (51.8) | |
| DK/DA | 9 (0.2) | 3 (0.1) | |
| Tranquilizers, relaxants, sleeping pills | <0.001 | ||
| No | 2840 (45.0) | 3137 (52.6) | |
| Yes | 369 (5.9) | 601 (10.1) | |
| DK/DA | 3090 (49.1) | 2223 (37.3) | |
| Antidepressants, stimulants | <0.001 | ||
| No | 3072 (48.7) | 3431 (57.6) | |
| Yes | 137 (2.2) | 307 (5.1) | |
| DK/DA | 3090 (49.1) | 2223 (37.3) | |
| Smoke | <0.001 | ||
| No | 4148 (65.9) | 4205 (70.6) | |
| Yes | 2144 (34.1) | 1753 (29.4) | |
| DK/DA | 7 (0.1) | 3 (0.0) | |
| Alcohol | <0.001 | ||
| No | 2102 (33.4) | 3384 (56.8) | |
| Yes | 4192 (66.6) | 2573 (43.2) | |
| DK/DA | 5 (0.1) | 4 (0.1) | |
| Type of contract or employment situation | <0.001 | ||
| Entrepreneur | 370 (5.9) | 182 (3.1) | |
| Official | 505 (8.0) | 607 (10.2) | |
| Indefinite salaried | 2754 (43.7) | 2517 (42.2) | |
| Temporary employee | 769 (12.2) | 788 (13.2) | |
| Autonomous | 742 (11.8) | 460 (7.7) | |
| Without contract | 23 (0.4) | 56 (0.9) | |
| Unemployed | 1136 (18%) | 1351 (22.7) | |
| Occupational Category | <0.001 | ||
| Managers with more than 10 workers | 732 (11.6) | 759 (12.8) | |
| Managers with fewer than 10 workers | 525 (8.3) | 584 (9.8) | |
| Intermediate technicians | 1190 (18.9) | 1270 (21.4) | |
| Qualified supervisors | 957 (15.2) | 582 (9.8) | |
| Qualified manual technicians | 2045 (32.5) | 1808 (30.3) | |
| Unqualified manual technicians | 809 (12.8) | 924 (15.5) | |
| DK/DA | 41 (0.7) | 34 (0.6) | |
| Working time | <0.001 | ||
| Full time | 4894 (94.8) | 3616 (78.5) | |
| Part time | 268 (5.2) | 987 (21.4) | |
| DK/DA | 1 (0.0) | 7 (0.1) | |
| Type of working day | <0.001 | ||
| Split shift | 2105 (40.8) | 1379 (29.9) | |
| Continue in the morning | 1383 (26.8) | 1638 (35.9) | |
| Continue in the afternoon | 117 (2.3) | 201 (4.4) | |
| Continue through the night | 68 (1.3) | 37 (0.8) | |
| Shifts | 39 (0.8) | 183 (4) | |
| Irregular or variable day according to the days | 757 (14.8) | 616 (13.4) | |
| Other types | 637 (12.5) | 506 (10.9) | |
| DK/DA | 57 (1.1) | 50 (1.0) | |
| Age | 0.006 | ||
| 16–24 | 230 (3.7) | 200 (3.4) | |
| 25–34 | 946 (15.0) | 1022 (17.1) | |
| 35–44 | 1924 (30.5) | 1844 (30.9) | |
| 45–54 | 1851 (29.4) | 1851 (29.0) | |
| ≥55 | 1348 (21.4) | 1168 (19.6) | |
| Nationality | 0.014 | ||
| Spanish | 5516 (87.6) | 5131 (86.1) | |
| Foreigner | 783 (12.4) | 830 (13.9) | |
| Marital status | <0.001 | ||
| Single | 1937 (30.7) | 1667 (28.0) | |
| Married | 3840 (61) | 3310 (55.7) | |
| Widower | 54 (0.9) | 181 (3.0) | |
| Divorced | 463 (7.4) | 789 (13.3) | |
| DK/DA | 5 (0.1) | 14 (0.2) | |
| Education level | <0.001 | ||
| Primary | 860 (13.7) | 604 (10.1) | |
| Secondary | 4077 (64.7) | 3501 (58.7) | |
| Tertiary | 1362 (21.6) | 1856 (31.1) | |
| Type of family life | <0.001 | ||
| Married | 3597 (57.1) | 2813 (47.2) | |
| Domestic partner | 189 (3.0) | 137 (2.3) | |
| Do not live together | 2513 (39.9) | 3010 (50.5) | |
| Family care work | <0.001 | ||
| No | 5706 (90.6) | 5216 (87.5) | |
| Yes | 592 (9.4) | 745 (12.5) | |
| Monthly household income | 0.781 | ||
| Less than 1050 euros per month | 1983 (31.5) | 5216 (87.5) | |
| From 1050 to less than 2200 euros | 2739 (43.5) | 745 (12.5) | |
| From 2200 to less than 4500 euros | 1540 (24.4) | 1465 (24.6) | |
| More than 4500 euros per month | 37 (0.6) | 26 (0.5) |
| Health Status Last 12 Months | You Have Suffered from Mental Disorders in the Last 12 Months | Consumption of Sedative Hypnotics in the Last 12 Months | Use of Addictive Substances in the Last 12 Months | ||||||
|---|---|---|---|---|---|---|---|---|---|
| Self-Perceived Health Status aOR (IC90%) a | Visits to the Family Doctor aOR (IC90%) a | Depression aOR (IC90%) a | Chronic Anxiety aOR (IC90%) a | Work Stress aOR (IC90%) a | Tranquilizers aOR (IC90%) a | Antidepressants, Stimulants aOR (IC90%) a | Smoking aOR (IC90%) a | Alcohol aOR (IC90%) a | |
| Entrepreneurs | 1 b | 1 b | 1 b | 1 b | 1 b | 1 b | 1 b | 1 b | 1 b |
| Officials | 1.57 (1.27–1.90) g | 0.58 (0.4–0.69) g | 1.44 (1.06–1.9) f | 1.68 (1.28–2.2) g | 1.04 (0.90–1.21) | 1.52 (1.17–1.9) g | 1.67 (1.14–2.44) f | 0.70 (0.59–0.83) g | 0.41 (0.3–0.47) g |
| Indefinite wage earners | 1.72 (1.55–1.90) g | 0.53 (0.4–0.58) g | 1.78 (1.52–2.0) g | 1.85 (1.59–2.1) g | 1.30 (1.19–1.4) g | 1.36 (1.17–1.58) g | 1.46 (1.16–1.84) g | 0.84 (0.77–0.92) g | 0.40 (0.3–0.44) g |
| Temporary employees | 1.54 (1.30–1.83) g | 0.54 (0.4–0.63) g | 2.33 (1.84–2.9) g | 1.94 (1.65–2.4) g | 0.80 (0.7–0.91) f | 1.06 (0.81–1.39) | 2.06 (1.48–2.89) g | 0.86 (0.75–0.98) e | 0.39 (0.3–0.45) g |
| Freelancers | 1.65 (1.40–1.96) g | 0.39 (0.3–0.45) g | 1.70 (1.27–2.33) g | 1.57 (1.17–2.1) g | 0.96 (0.81–1.12) | 1.42 (1.06–1.89) f | 1.58 (1.05–2.3) f | 0.67 (0.55–0.81) g | 0.39 (0.3–0.46) g |
| Without contract | 1.85 (0.73–4.66) | 0.49 (0.24–1.06) | 4.03 (2.22–7.3) g | 3.96 (2.2–7.0) g | 0.58 (0.3–0.95) e | 1.71 (0.87–3.41) | 4.01 (1.92–8.3) g | 0.35 (0.20–0.64) g | 0.26 (0.1–0.44) g |
| Unemployed | 1.03 (0.91–1.17) | 0.56 (0.49–0.64) g | 3.19 (2.71–3.2) g | 3.15 (2.69–3.6) g | - d | 1.96 (1.65–2.31) g | 2.95 (2.36–3.69) g | 0.89 (0.79–0.99) e | 0.27 (0.2–0.30) g |
| Managers with more than 10 employees | 1 b | 1 b | 1 b | 1 b | 1 b | 1 b | 1 b | 1 b | 1 b |
| Managers with fewer than 10 employees | 0.97 (0.84–1.12) | 1.34 (1.16–1.5) g | 1.48 (1.2–1.82) g | 1.42 (1.15–1.7) g | 0.90 (0.76–1.05) | 1.38 (1.14–1.67) f | 1.72 (1.33–2.22) g | 0.70 (0.61–0.81) g | 0.50 (0.4–0.56) g |
| Intermediate technicians | 0.81 (0.74–0.88) g | 1.69 (1.51–1.8) g | 1.74 (1.5–1.97) g | 1.97 (1.74–2.2) g | 1.14 (1.02–1.2) e | 1.68 (1.50–1.88) g | 1.72 (1.47–2.02) g | 0.75 (0.69–0.82) g | 0.44 (0.4–0.48) g |
| Qualified supervisors | 0.68 (0.62–0.75) g | 2.32 (2.0–2.69) g | 2.03 (1.7–2.32) g | 2.23 (1.94–2.5) g | 0.86 (0.74–1.02) | 2.01 (1.78–2.27) g | 2.02 (1.71–2.39) g | 0.70 (0.63–0.79) g | 0.29 (0.2–0.32) g |
| Qualified manual technicians | 0.64 (0.60–0.69) g | 1.99 (1.81–2.1) g | 2.45 (2.23–2.6) g | 2.27 (2.05–2.5) g | 1.14 (1.03–1.2) e | 1.95 (1.78–2.13) g | 2.29 (2.03–2.59) g | 0.75 (0.69–0.80) g | 0.28 (0.2–0.30) g |
| Unqualified manual technicians | 0.59 (0.54–0.65) g | 2.18 (1.91–2.5) g | 2.43 (2.1–2.73) g | 2.45 (2.16–2.7) g | 0.91 (0.79–1.06) | 1.95 (1.74–2.18) g | 2.22 (1.90–2.59) g | 0.72 (0.65–0.80) g | 0.24 (0.2–0.26) g |
| Health Status Last 12 Months | You Have Suffered from Mental Disorders in the Last 12 Months | Consumption of Sedative-Hypnotics in the Last 12 Months | Use of Addictive Substances in the last 12 Months | ||||||
|---|---|---|---|---|---|---|---|---|---|
| Self-Perceived Health Status aOR (IC90%) a | Visits to the Family Doctor aOR (IC90%) a | Depression aOR (IC90%) a | Chronic Anxiety aOR (IC90%) a | Work Stress aOR (IC90%) a | Tranquilizers aOR (IC90%) a | Antidepressants, Stimulants aOR (IC90%) a | Smoke aOR (IC90%) a | Alcohol aOR (IC90%) a | |
| Entrepreneurs | 1 b | 1 b | 1 b | 1 b | 1 b | 1 b | 1 b | 1 b | 1 b |
| Officials | 1.04 (0.77–1.41) | 1.04 (0.81–1.34) | 1.67 (0.87–3.21) | 1.84 (0.97–3.47) | 0.60 (0.47–0.7) g | 1.60 (0.96–2.66) | 3.33 (1.11–9.91) | 0.71 (0.55–0.92) f | 0.85 (0.66–1.11) |
| Indefinite wage earners | 1.07 (0.84–1.36) | 1.01 (0.84–1.26) | 1.01 (0.57–1.77) | 1.57 (0.90–2.73) | 0.78 (0.6–0.94) f | 1.13 (0.73–1.74) | 1.85 (0.68–5.03) | 0.94 (0.77–1.16) | 0.86 (0.69–1.05) |
| Temporary employees | 0.91 (0.69–1.21) | 1.13 (0.89–1.44) | 1.52 (0.81–2.87) | 1.63 (0.88–3.03) | 0.55 (0.4–0.68) g | 0.89 (0.53–1.52) | 3.43 (1.19–9.93) f | 1.27 (1.01–1.60) f | 0.81 (0.64–1.03) |
| Freelancers | 1.04 (0.79–1.36) | 0.75 (0.59–0.9) e | 1.18 (0.63–2.22) | 1.83 (1.01–3.3) e | 0.47 (0.2–1.03) | 0.92 (0.55–1.53) | 2.67 (0.93–7.67) | 0.91 (0.77–1.14) | 0.92 (0.73–1.17) |
| Without contract | 1.07 (0.41–2.79) | 1.07 (0.49–2.33) | 3.44 (0.87–13.5) | - c | 0.64 (0.5–0.79) f | - c | 5.53 (0.75–40.74) | 1.59 (0.77–3.31) | 0.56 (0.27–1.16) |
| Unemployed | 0.57 (0.38–0.89) g | 1.15 (0.83–1.60) | 5.53 (2.4–12.2) g | 5.92 (2.8–12,4) g | - d | 3.09 (1.60–5.95) g | 6.75 (1.91–23.83) g | 1.75 (1.28–2.41) g | 0.51 (0.3–0.71) g |
| Managers with more than 10 employees | 1 b | 1 b | 1 b | 1 b | 1 b | 1 b | 1 b | 1 b | 1 b |
| Managers with fewer than 10 employees | 0.89 (0.73–1.10) | 1.27 (1.06–1.5) e | 1.54 (0.98–2.31) | 1.44 (0.98–2.11) | 0.89 (0.73–1.09) | 1.63 (1.21–2.20) f | 1.43 (0.83–2.48) | 1.36 (1.12–1.64) g | 0.93 (0.78–1.10) |
| Intermediate technicians | 0.80 (0.67–1.00) | 1.24 (1.06–1.4) e | 2.10 (1.5–2.95) g | 1.60 (1.16–2.2) f | 0.87 (0.74–1.04) | 1.34 (1.0–1.79) | 1.75 (1.11–2.75) e | 1.41 (1.20–1.66) g | 0.87 (0.75–1.05) |
| Qualified supervisors | 0.76 (0.64–0.91) f | 1.39 (1.18–1.6) e | 1.78 (1.25–2.5) f | 1.59 (1.13–2.2) f | 0.84 (0.69–1.02) | 1.48 (1.13–1.94) f | 1.89 (1.19–3.01) f | 1.81 (1.53–2.14) g | 1.01 (0.86–1.17) |
| Qualified manual technicians | 0.69 (0.58–0.82) g | 1.24 (0.99–1.65) | 2.22 (1.58–3.1) g | 1.76 (1.27–2.4) g | 0.63 (0.5–0.76) g | 1.36 (1.00–1.77) | 1.77 (1.13–2.77) f | 2.07 (1.76–2.42) g | 0.88 (0.76–1.01) |
| Unqualified manual technicians | 0.57 (0.48–0.69) g | 1.20 (0.96-1.44) | 2.39 (1.67–3.4) g | 2.40 (1.71–3.4) g | 0.51 (0.40–0.6) g | 1.92 (1.44–2.56) g | 2.30 (1.42–3.71) g | 2.62 (2.19–3.13) g | 0.68 (0.58–0.8) g |
| Full-time | 1 b | 1 b | 1 b | 1 b | 1 b | 1 b | 1 b | 1 b | 1 b |
| Part-time | 0.87 (0.67–1.17) | 1.09 (0.87–1.37) | 1.64 (0.98–2.74) | 1.48 (0.94–2.35) | 0.60 (0.49–0.7) g | 1.54 (1.01–2.34) e | 1.64 (0.83–3.24) | 1.23 (0.99–1.53) | 0.85 (0.68–1.05) |
| Split shift | 1 b | 1 b | 1 b | 1 b | 1 b | 1 b | 1 b | 1 b | 1 b |
| Continues in the morning | 0.95 (0.81–1.11) | 1.11 (0.98–1.26) | 1.38 (1.00–1.91) | 1.18 (0.88–1.58) | 0.70 (0.6–0.79) g | 1.18 (0.90–1.56) | 0.92 (0.58–1.48) | 1.15 (1.02–1.31) | 0.87 (0.77–1.00) |
| Continues in the afternoon | 0.77 (0.51–1.15) | 1.23 (0.87–1.74) | 1.59 (0.72–3.52) | 2.04 (1.08–3.8) e | 0.79 (0.58–1.10) | 1.71 (0.92–3.18) | 0.93 (0.27–3.17) | 0.97 (0.69–1.37) | 0.75 (0.54–1.05) |
| Continues in the evening | 0.73 (0.45–1.19) | 1.09 (0.70–1.70) | 1.02 (0.31–3.40) | 0.40 (0.07–2.10) | 0.72 (0.47–1.09) | 1.05 (0.35–2.88) | 2.98 (1.04–8.53) e | 1.11 (0.72–1.71) | 0.80 (0.52–1.22) |
| Shifts | 0.82 (0.52–0.99) e | 1.25 (1.07–1,4) f | 1.37 (0.93–2.02) | 1.67 (1.21–2.3) g | 1.01 (0.87–1.16) | 1.36 (0.99–1.87) | 1.27 (0.76–2.13) | 1.01 (0.86–1.17) | 0.81 (0.7–0.94) f |
| Irregular | 1.16 (0.94–1.43) | 0.90 (0.77–1.05) | 0.54 (0.3–0.96) e | 1.06 (0.72–1.57) | 1.05 (0.90–1.22) | 0.88 (0.60–1.30) | 0.37 (0.16–0.90) e | 1.09 (0.92–1.28) | 0.89 (0.76–1.04) |
| Health Status Last 12 Months | You Have Suffered from Mental Disorders in the Last 12 Months | Consumption of Sedative Hypnotics in the Last 12 Months | Use of Addictive Substances in the Last 12 Months | ||||||
|---|---|---|---|---|---|---|---|---|---|
| Self-Perceived Health Status aOR (IC90%) a | Visits to the Family Doctor aOR (IC90%) a | Depression aOR (IC90%) a | Chronic Anxiety aOR (IC90%) a | Work Stress aOR (IC90%) a | Tranquilizers aOR (IC90%) a | Antidepressants, Stimulants aOR (IC90%) a | Smoke aOR (IC90%) a | Alcohol aOR(IC90%) a | |
| Businesswomen | 1 b | 1 b | 1 b | 1 b | 1 b | 1 b | 1 b | 1 b | 1 b |
| Officials | 1.04 (0.74–1.46) | 1.08 (0.75–1.54) | 0.84 (0.49–1.43) | 0.91 (0.56–1.47) | 0.88 (0.66–1.17) | 1.52 (0.89–2.59) | 1.00 (0.50–2.02) | 0.69 (0.50-1.05) | 0.86 (0.65–1.15) |
| Indefinite salaried | 1.08 (0.79–1.45) | 1.09 (0.79–1.51) | 0.95 (0.60–1.53) | 0.97 (0.63–1.49) | 1.18 (0.91–1.53) | 1.27 (0.78–2.08) | 0.91 (0.48–1.73) | 0.91 (0.69–1.21) | 0.85 (0.66–1.11) |
| Temporary salaried | 1.04 (0.74–1.44) | 1.06 (0.75–1.51) | 1.20 (0.72–1.99) | 1.00 (0.62–1.59) | 0.76 (0.57–1.01) | 1.00 (0.58–1.73) | 1.33 (0.67–2.65) | 1.00 (0.74–1.35) | 0.80 (0.60–1.06) |
| Autonomous | 1.05 (0.75–1.48) | 0.92 (0.64–1.33) | 0.96 (0.56–1.63) | 0.84 (0.51–1.38) | 0.81 (0.60–1.08) | 1.32 (0.76–2.29) | 0.97 (0.47–1.99) | 0.72 (0.52–1.00) | 0.85 (0.63–1.14) |
| Without contract | 0.97 (0.54–1.74) | 1.20 (0.59–2.45) | 1.92 (1.12–4.1) f | 1.96 (0.96–4.00) | 0.62 (0.36–0.8) f | 1.42 (0.61–3.29) | 2.58 (0.99–6.76) | 2.60 (1.01–6.7) e | 0.56 (0.3–0.98) f |
| Unemployed | 0.56 (0.39–0.79) f | 1.34 (0.91–1.96) | 2.70 (1.59–4.5) f | 2.00 (1.23–3.26) e | - d | 2.29 (1.30–4.00) f | 1.87 (0.89–3.82) | 1.92 (1.03–3.61) e | 0.52 (0.38–0.7) g |
| Directives with more than 10 employees | 1 b | 1 b | 1 b | 1 b | 1 b | 1 b | 1 b | 1 b | 1 b |
| Directives with fewer than 10 employees | 1.03 (0.86–1.24) | 0.88 (0.73–1.07) | 1.07 (0.82–1.40) | 1.00 (0.76–1.30) | 0.69 (0.5–0.84) g | 1.09 (0.85–1.39) | 1.20 (0.86–1.70) | 1.34 (1.11–1.61) g | 0.96 (0.83–1.12) |
| Intermediate technicians | 0.86 (0.74–1.01) | 1.08 (0.92–1.27) | 1.27 (1.02–1.5) e | 1.40 (1.13–1.7) f | 0.85 (0.7–0.99) e | 1.31 (1.08–1.60) f | 1.25 (0.95–1.64) | 1.68 (1.43–1.96) g | 0.93 (0.82–1.05) |
| Qualified supervisors | 0.74 (0.63–0.87) g | 1.44 (1.18–1.7) g | 1.43 (1.14–1.8) f | 1.53 (1.22–1.9) g | 0.67 (0.5–0.83) g | 1.48 (1.20–1.82) g | 1.43 (1.07–1.90) f | 1.76 (1.47–2.10) g | 0.67 (0.5–0.78) g |
| Qualified manual technicians | 0.69 (0.60–0.79) g | 1.22 (1.04–1.4) e | 1.78 (1.45–2.1) g | 1.59 (1.29–1.9) g | 0.86 (0.7–0.98) f | 1.48 (1.22–1.79) g | 1.68 (1.30–2.19) g | 1.92 (1.64–2.25) g | 0.61 (0.5–0.69) g |
| Unqualified manual technicians | 0.62 (0.53–0.72) g | 1.34 (1.10–1.6) f | 1.82 (1.46–2.2) g | 1.76 (1.49–2.2) g | 0.72 (0.5–0.89) g | 1.52 (1.24–1.87) g | 1.69 (1.28–2.23) g | 1.96 (1.64–2.33) g | 0.50 (0.4–0.57) g |
| Full-time | 1 b | 1 b | 1 b | 1 b | 1 b | 1 b | 1 b | 1 b | 1 b |
| Part-time | 0.87 (0.76–1.00) | 1.03 (0.88–1.20) | 1.50 (1.22–1.8) g | 1.21 (1.00–1.47) | 0.59 (0.4–0.61) g | 1.16 (0.93–1.43) | 0.96 (0.71–1.30) | 0.99 (0.87–1.36) | 0.91 (0.81–1.03) |
| Split shift | 1 b | 1 b | 1 b | 1 b | 1 b | 1 b | 1 b | 1 b | 1 b |
| Continues in the morning | 0.83 (0.7–0.96) f | 0.96 (0.82–1.12) | 1.32 (1.03–1,6) f | 1.18 (0.94–1.46) | 0.88 (0.78–1.00) | 1.41 (1.11–1.7) f | 1.14 (0.82–1.58) | 1.05 (0.92–1.21) | 0.93 (0.82–1.06) |
| Continues in the afternoon | 0.64 (0.48–0.84) g | 0.91 (0.66–1.25) | 2.38 (1.63–3.4) g | 1.95 (1.35–2.8) e | 0.67 (0.5–0.86) g | 1.32 (0.86–2.03) | 1.12 (0.63–2.00) | 0.93 (0.70–1.24) | 0.79 (0.61–1.02) |
| Continues in the evening | 1.14 (0.57–2.26) | 1.03 (0.49–2.18) | 1.59 (0.63–3.97) | 0.93 (0.33–2.56) | 1.54 (0.87–2.74) | 0.82 (0.29–2.34) | 1.08 (0.31–3.75) | 1.32 (0.72–2.41) | 0.65 (0.35–1.18) |
| Shifts | 1.07 (0.86–1.31) | 0.91 (0.74–1.13) | 1.13 (0.82–1.56) | 0.93 (0.69–1.26) | 1.34 (1.13–1.5) g | 1.54 (1.13–2.0) f | 1.19 (0.80–1.81) | 1.31 (1.09–1.5) f | 0.92 (0.78–1.09) |
| Irregular | 0.87 (0.70–1.07) | 1.14 (0.91–1.45) | 1.56 (1.14–2.1) g | 1.35 (1.01–1.8) e | 1.02 (0.86–1.22) | 1.59 (1.16–2.1) g | 1.27 (0.82–1.95) | 1.15 (0.96–1.37) | 1.15 (0.96–1.37) |
© 2020 by the authors. Licensee MDPI, Basel, Switzerland. This article is an open access article distributed under the terms and conditions of the Creative Commons Attribution (CC BY) license (http://creativecommons.org/licenses/by/4.0/).
Share and Cite
Payá Castiblanque, R.; Beneyto Calatayud, P.J. Inequalities and the Impact of Job Insecurity on Health Indicators in the Spanish Workforce. Sustainability 2020, 12, 6425. https://doi.org/10.3390/su12166425
Payá Castiblanque R, Beneyto Calatayud PJ. Inequalities and the Impact of Job Insecurity on Health Indicators in the Spanish Workforce. Sustainability. 2020; 12(16):6425. https://doi.org/10.3390/su12166425
Chicago/Turabian StylePayá Castiblanque, Raúl, and Pere J. Beneyto Calatayud. 2020. "Inequalities and the Impact of Job Insecurity on Health Indicators in the Spanish Workforce" Sustainability 12, no. 16: 6425. https://doi.org/10.3390/su12166425
APA StylePayá Castiblanque, R., & Beneyto Calatayud, P. J. (2020). Inequalities and the Impact of Job Insecurity on Health Indicators in the Spanish Workforce. Sustainability, 12(16), 6425. https://doi.org/10.3390/su12166425