Article

Conservation Agriculture and Integrated Pest Management Practices Improve Yield and Income while Reducing Labor, Pests, Diseases and Chemical Pesticide Use in Smallholder Vegetable Farms in Nepal

1
International Development Enterprises (iDE), Lalitpur 44600, Nepal
2
Center for Environmental and Agricultural Policy Research, Extension, and Development (CEAPRED), Lalitpur 44600, Nepal
3
Sustainable Intensification Innovation Lab, Kansas State University, Manhattan, KS 66506, USA
*
Author to whom correspondence should be addressed.
Sustainability 2020, 12(16), 6418; https://doi.org/10.3390/su12166418
Submission received: 19 July 2020 / Revised: 6 August 2020 / Accepted: 7 August 2020 / Published: 10 August 2020
(This article belongs to the Special Issue Suitable Agronomic Techniques for Sustainable Agriculture)

Abstract

:
Improving smallholder vegetable farms are critical for improving food security and livelihoods of people in low-income countries. Vegetable production is labor intensive and prone to pests and diseases. Conservation agriculture (CA) and integrated pest management (IPM) practices provide options to increase yields and minimize the use of chemical pesticides. We compared integration of CA and IPM practices (improved alternative system) with farmers’ traditional practice (conventional system) under replicated on-farm tests in four different locations (Lalitpur, Banke, Surkhet, and Dadeldhura) in Nepal. Data on yield, benefit–cost ratio (B:C), labor requirement, insect and disease infestation, and pesticide sprays on five major vegetable crops (tomato, cucumber, bitter gourd, cabbage, cauliflower) were measured. In tomatoes, cucumbers, and bitter gourds, the improved alternative system produced a significantly higher yield, greater benefit-cost ratio, reduced labor, decreased the infestation of pests and diseases, and required fewer pesticidal sprays. Average yield and net income were superior in cabbages and cauliflowers, but nonsignificant. Improved alternative system for all the vegetables were sprayed significantly fewer times than the conventional system. Overall, the improved alternative system for vegetable crops contributed not only to the improved income and livelihoods of people, but also can improve environment and human health due to the reduced use of pesticides. Further research on scaling these improved alternative practices through appropriate farmer organizations, and government and non-government actors can enhance the adoption of CA and IPM practices by smallholder vegetable producers.

1. Introduction

Vegetable production plays an important role in improving the livelihood and nutrition of small holder farmers [1,2]. In Nepal, vegetables are key to reducing rural poverty and unemployment as they provide almost 5 to 10 times higher economic returns per hectare than the traditional cereals [3]. The vegetable production sector, however, lacks appropriate technologies such as proper soil management strategies [4] and pest management alternatives to chemical pesticides [5,6] impending its growth. Due to crop intensification and intensive tillage practices, depletion of soil organic matter and soil loss due to soil erosion are growing in Nepal; in hilly regions alone, a soil loss of 2 to 105 t/ha is estimated annually [5]. Similarly, there is a rapid increase in the use of chemical fertilizers and pesticides among vegetable farmers without proper safe handling practices, increasing the risk to human health and the environment [5,7].
As soil fertility and pest management interact closely [8,9], evaluation and adoption of improved practices such as conservation agriculture (CA) and integrated pest management (IPM) could enable income diversification and crop intensification with minimal external input to build sustainable and resilient opportunities for smallholder farmers [10,11,12,13,14].
CA promotes the use of agricultural practices addressing the issues of soil degradation and soil health. It is based on three fundamental principles of minimum soil disturbance, continuous mulch, and diversification in cropping patterns [15,16]. The use of CA practices such as no-tillage, minimum tillage, and mulching results in minimum soil disturbances with a higher water use efficiency, increased soil quality, and enhanced yield [17,18,19]. Improvement of soil quality using organic mulches reduces the infestation of pests and diseases [9,20]. Similarly, the use of drip irrigation, a popular water conservation technology in vegetable production, has been demonstrated to conserve water and reduce labor while increasing yield [21,22,23]. While not explicitly highlighted in the literature, the macro objectives of drip irrigation closely match with that of CA [24]. Drip irrigation also reduces the drudgery and workload for women (for water lifting and water transport) and marginal farmers [25,26].
IPM uses ecological-based principles to manage pests and diseases and addresses growing concern of indiscriminate use of chemical pesticides as well as related environmental and health issues [11,27]. As the use of pesticides in vegetables in Nepal continue to rise [28], using IPM practices and technologies (e.g., cultural pest management, biological pesticides, judicial use of chemicals as pesticides) can significantly reduce the negative impacts to human health and the environment [5,29].
Previous studies have largely focused on independent comparisons of either CA or IPM with the conventional systems [19,30,31,32]. There is limited or no knowledge on the combined impacts of the CA and IPM on vegetable production systems in Nepal. Improved understanding of these combined systems is critical to document any negative or positive trade-offs or synergies that might influence the acceptability by the vegetable producers in the region. Therefore, the current research was undertaken in farmers’ field in the key vegetable production regions of Nepal. Using multi-location trials, the present study is one of the first to compare the integration of CA and IPM with conventional farmers’ practices and evaluate the impacts on yield, net-return, labor, pest infestation and pesticide use in five vegetable crops viz. tomato (Solanum lycopersicum), cabbage (Brassica oleracea var. capitata), cauliflower (Brassica oleracea var. botrytis), bitter gourd (Momordica charantia), and cucumber (Cucumis sativus), solely in the smallholder vegetable production systems.

2. Materials and Methods

2.1. On-Farm Experiments

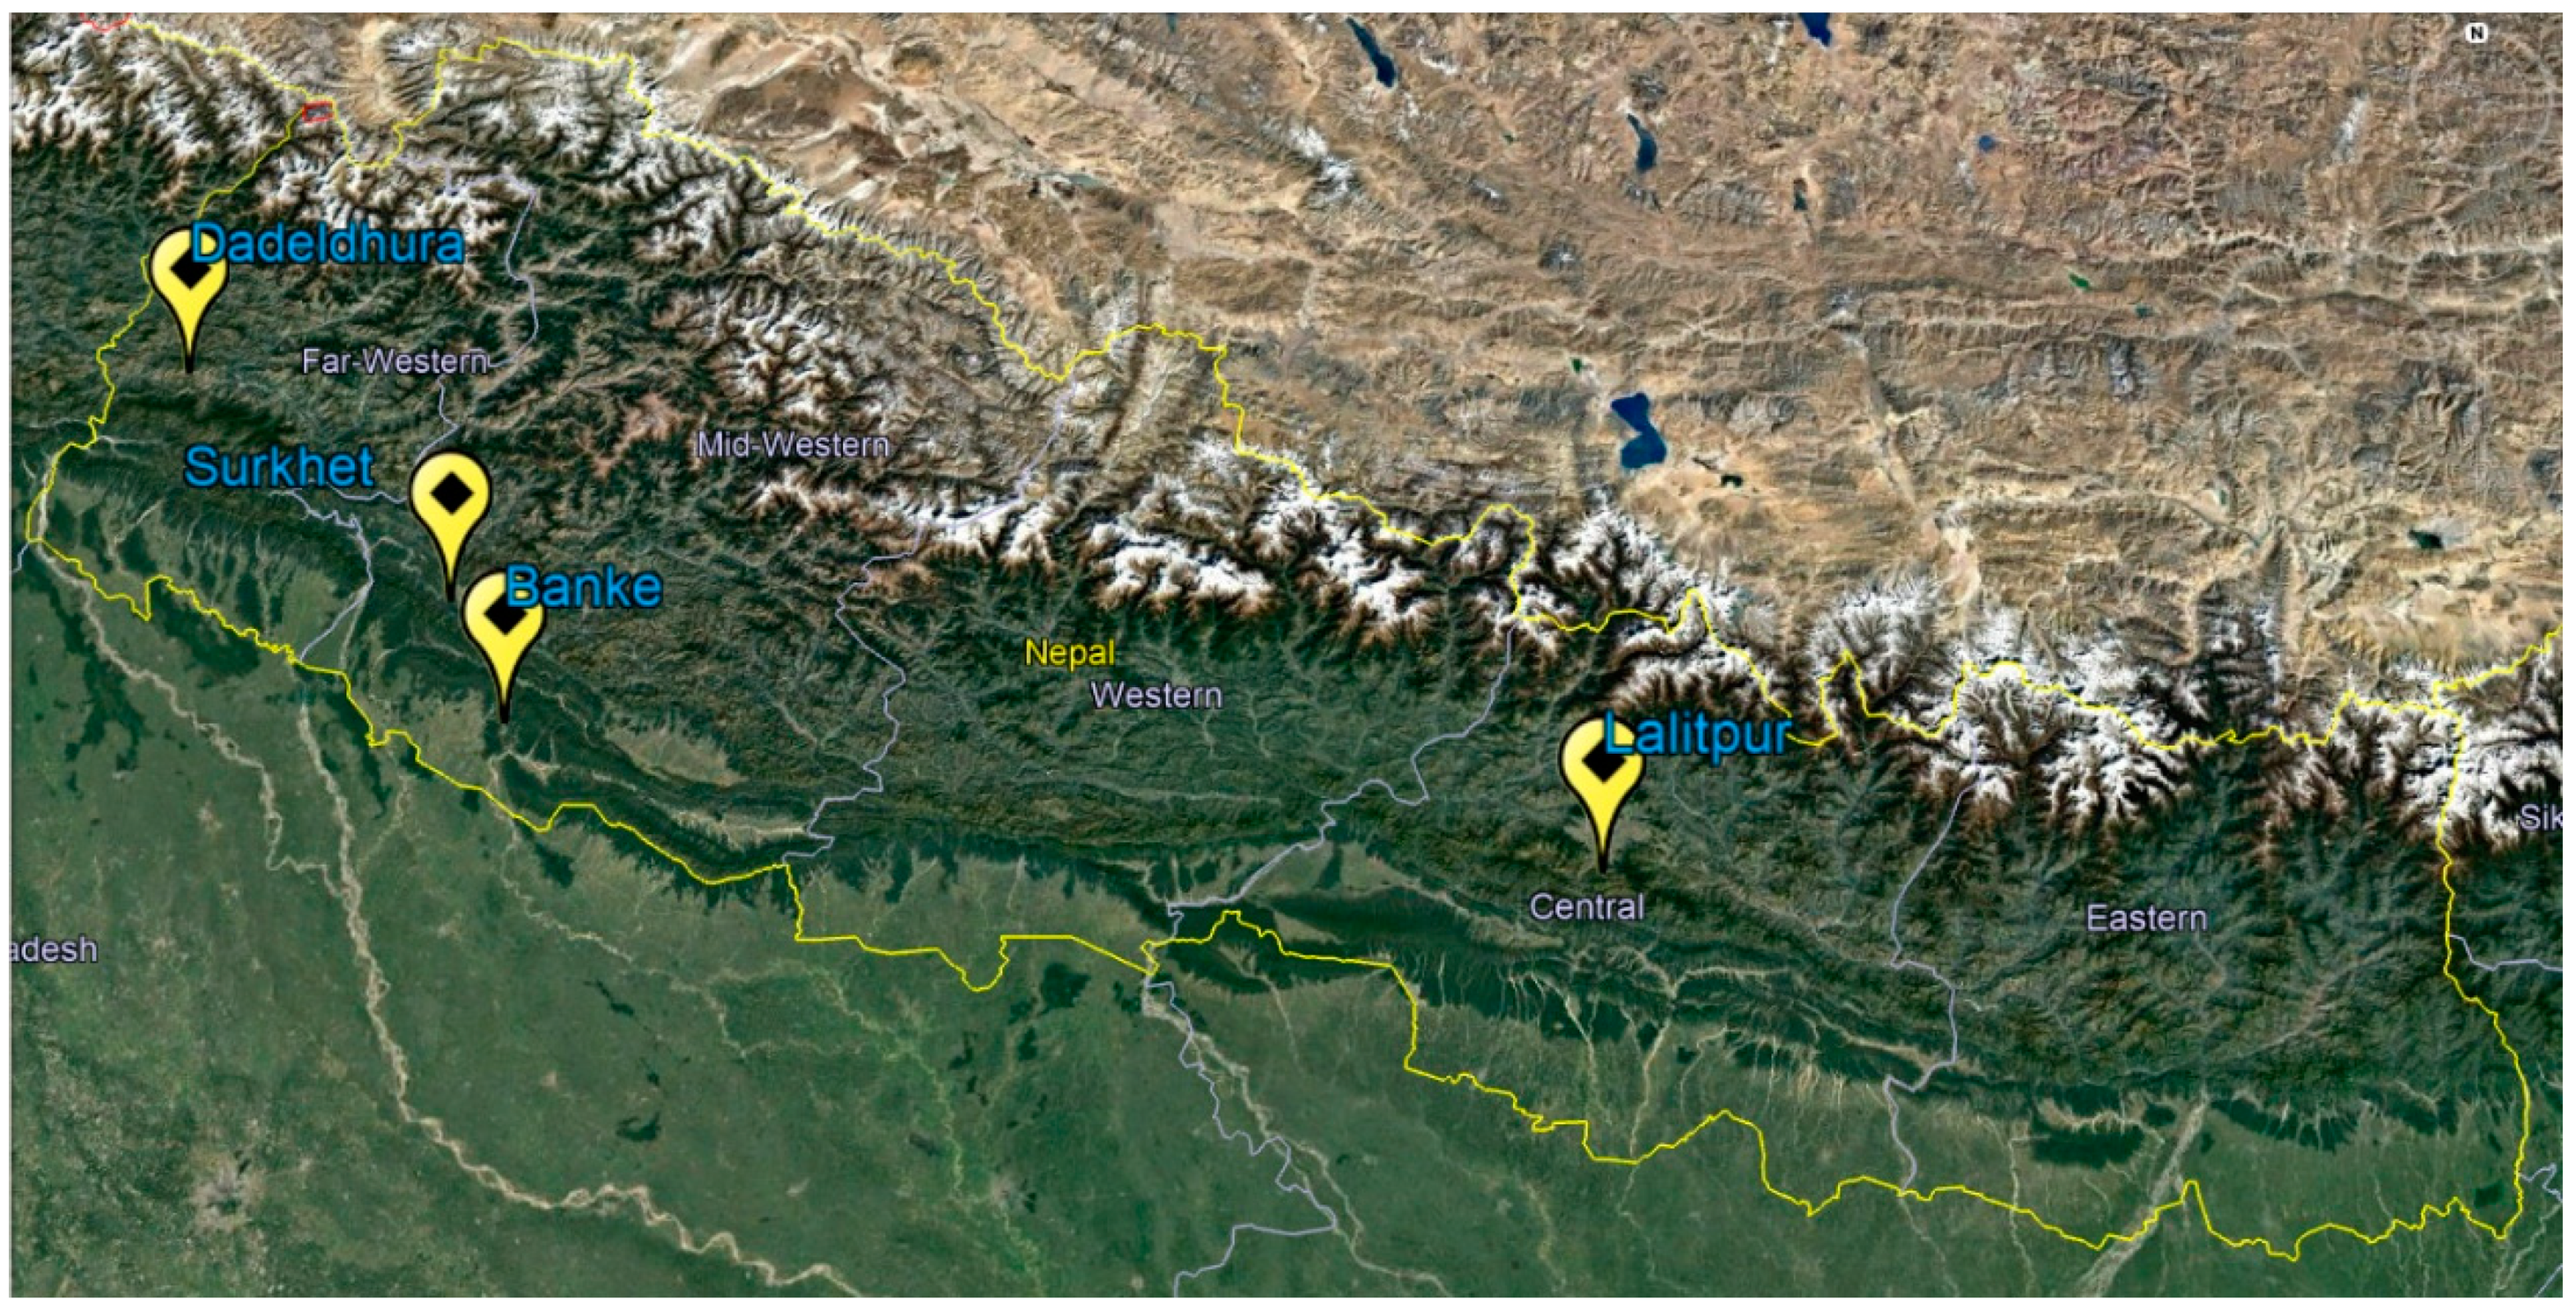
The study was conducted in four districts of Nepal viz. Lalitpur (Lele Ranagaun: 85°18′55.94″ E 27°34′14.59″ N) Banke (Naubasta-3: 28°15′26.10″ N 81°40′18.81″ E), Surkhet (Chhincu-4: 81°42′24.36″ E 28°24′37.24″ N) and Dadeldhura (Samaiji-8: 80°34′57.41″ E 29°21′2.37″ N) (Figure 1). General characteristics of the field sites including elevation, average temperature and rainfall, and soil characteristics are provided in Table 1. Seeds of five economically important vegetable crops in Nepal were procured commercially (tomato cv. Srijana, cabbage cv. Green Coronet, cauliflower cv. Snow Mystique, bitter gourd cv. Palee F1, cucumber cv. Bhaktapur Local). The following crop sequence was used: tomato–cabbage/cauliflower–bitter gourd/cucumber. Seedlings were raised under a plastic tunnel house before transplanting to the main field. Six replicate plots (each plot of 50 m2 area was a farm with all plots within a 500 m radius) were established per district per crop. Farms with similar growing condition and pest problem were selected. Trials were repeated for two crop seasons (2015 and 2016). Each on-field trial consists of two treatments: (a) conservation agriculture (CA) + integrated pest management (IPM) (herein referred as the “improved alternative system” (T1)) and (b) conventional farmers’ practice (T2).
In the improved system (T1), tillage was not repeated after the first crop production. Dried mulches (rice straw, 15–20 cm) were placed on the entire field area including furrows between beds. Rice is still the major staple crop in Nepal; therefore, rice straw is widely available. Mulches were regularly replaced as the signs of mulch degradation were observed. Low-cost drip irrigation kits (Sital Thopa Sichai Prabidhi Udhyog, Lalitpur Nepal) were used for irrigation and weeds were removed manually. The next vegetable crop was planted before harvesting the current crop. Residues from the previous crop were retained as surface mulch. Holes were made using a locally designed hoe to plant seedlings during subsequent crop seasons. The timing and type of pest management practices were decided based on IPM packages developed by IPM Innovation Lab of the United States Agency for International Development [5]. Briefly, crops were continuously monitored for any signs of insects and diseases using pheromone traps and regular scouting. If pest populations were higher than economically tolerable limits, locally available neem (Azadirachtin indica) extracts and biopesticides (e.g., Metarhizium, Beauveria, Trichoderma) were used. Chemical pesticides were considered as the last option if other strategies failed to manage pest and disease populations. Farms used for improved alternative system were under conventional management system for at least 5 years.
In conventional farmers’ practice (T2), the soil was continuously tilled (about 20-cm depth) using moldboard plow (animal- or tractor-drawn); plots were furrow irrigated and chemical pesticides were used in regular intervals as the only pest management practice. Farmers normally use chloropyrifos, cypermethrin, imidacloprid, and emamectin as insecticides against insects whereas carbendazim was used against diseases. Weeds as well as the residues from the previous crop were removed manually and used for animal grazing or making compost.

2.2. Crop Management

General vegetable crop management practices (except for the treatments) are shown in Table 2. These include agronomic practices that are common to both treatments.

2.3. Data Collection

To measure total yield (t/ha), marketable fruits were harvested every 2–3 days by hand and weighed. Net benefit per plot was calculated subtracting all the fixed and operating costs (e.g., farm rental, time (hours) for intercultural operations, seeds, fertilizers, staking) from the total revenue generated (based on retail prices). Record of the work input (hours) made by each family member in individual treatments were collected for intercultural operations (e.g., tillage, irrigation, weeding, pesticide application, and harvesting) and expressed as hours/plot/season [33]. Labor costs were estimated based on the minimum fair income in that region. The benefit–cost ratio (B:C ratio) for each treatment was calculated based on methods described by Romero [33]. Both fixed and variable costs were included. The number of applications of chemical pesticides (using knapsack sprayer) per crop season were also recorded for each treatment.
Six-week old plants (n = 8/treatment/region) were used to estimate percentage (%) leaf damage from insect herbivores and diseases in all the five crops. Total leaves from a plant were counted and the per cent (%) damage was calculated by counting number of damaged leaves to the total number of leaves [34]. Characteristic damage by leaf miners, beetles, and caterpillars were recorded as percent of leaves damaged [35]. Leaf spots, blights, and mildews on leaves were recorded as percentage disease infestation.

2.4. Statistical Analysis

Using a completely randomized block design, data for yield (kg/ha), B:C ratio and labor (hours) were analyzed using a general linear model (GLM) with ‘treatments’ (conventional practice vs. improved alternative system) as the main effects and ‘region’ as the random effect. Data for per cent (%) leaf damage from herbivory and diseases were arcsine square root transformed for analysis; data were back transformed onto the original scale for graphical presentation. Frequency of chemical sprays were analyzed via Poisson regression aided with analysis of variance (ANOVA) [36]. All the data were analyzed through Minitab software [37].

3. Results

3.1. Yield

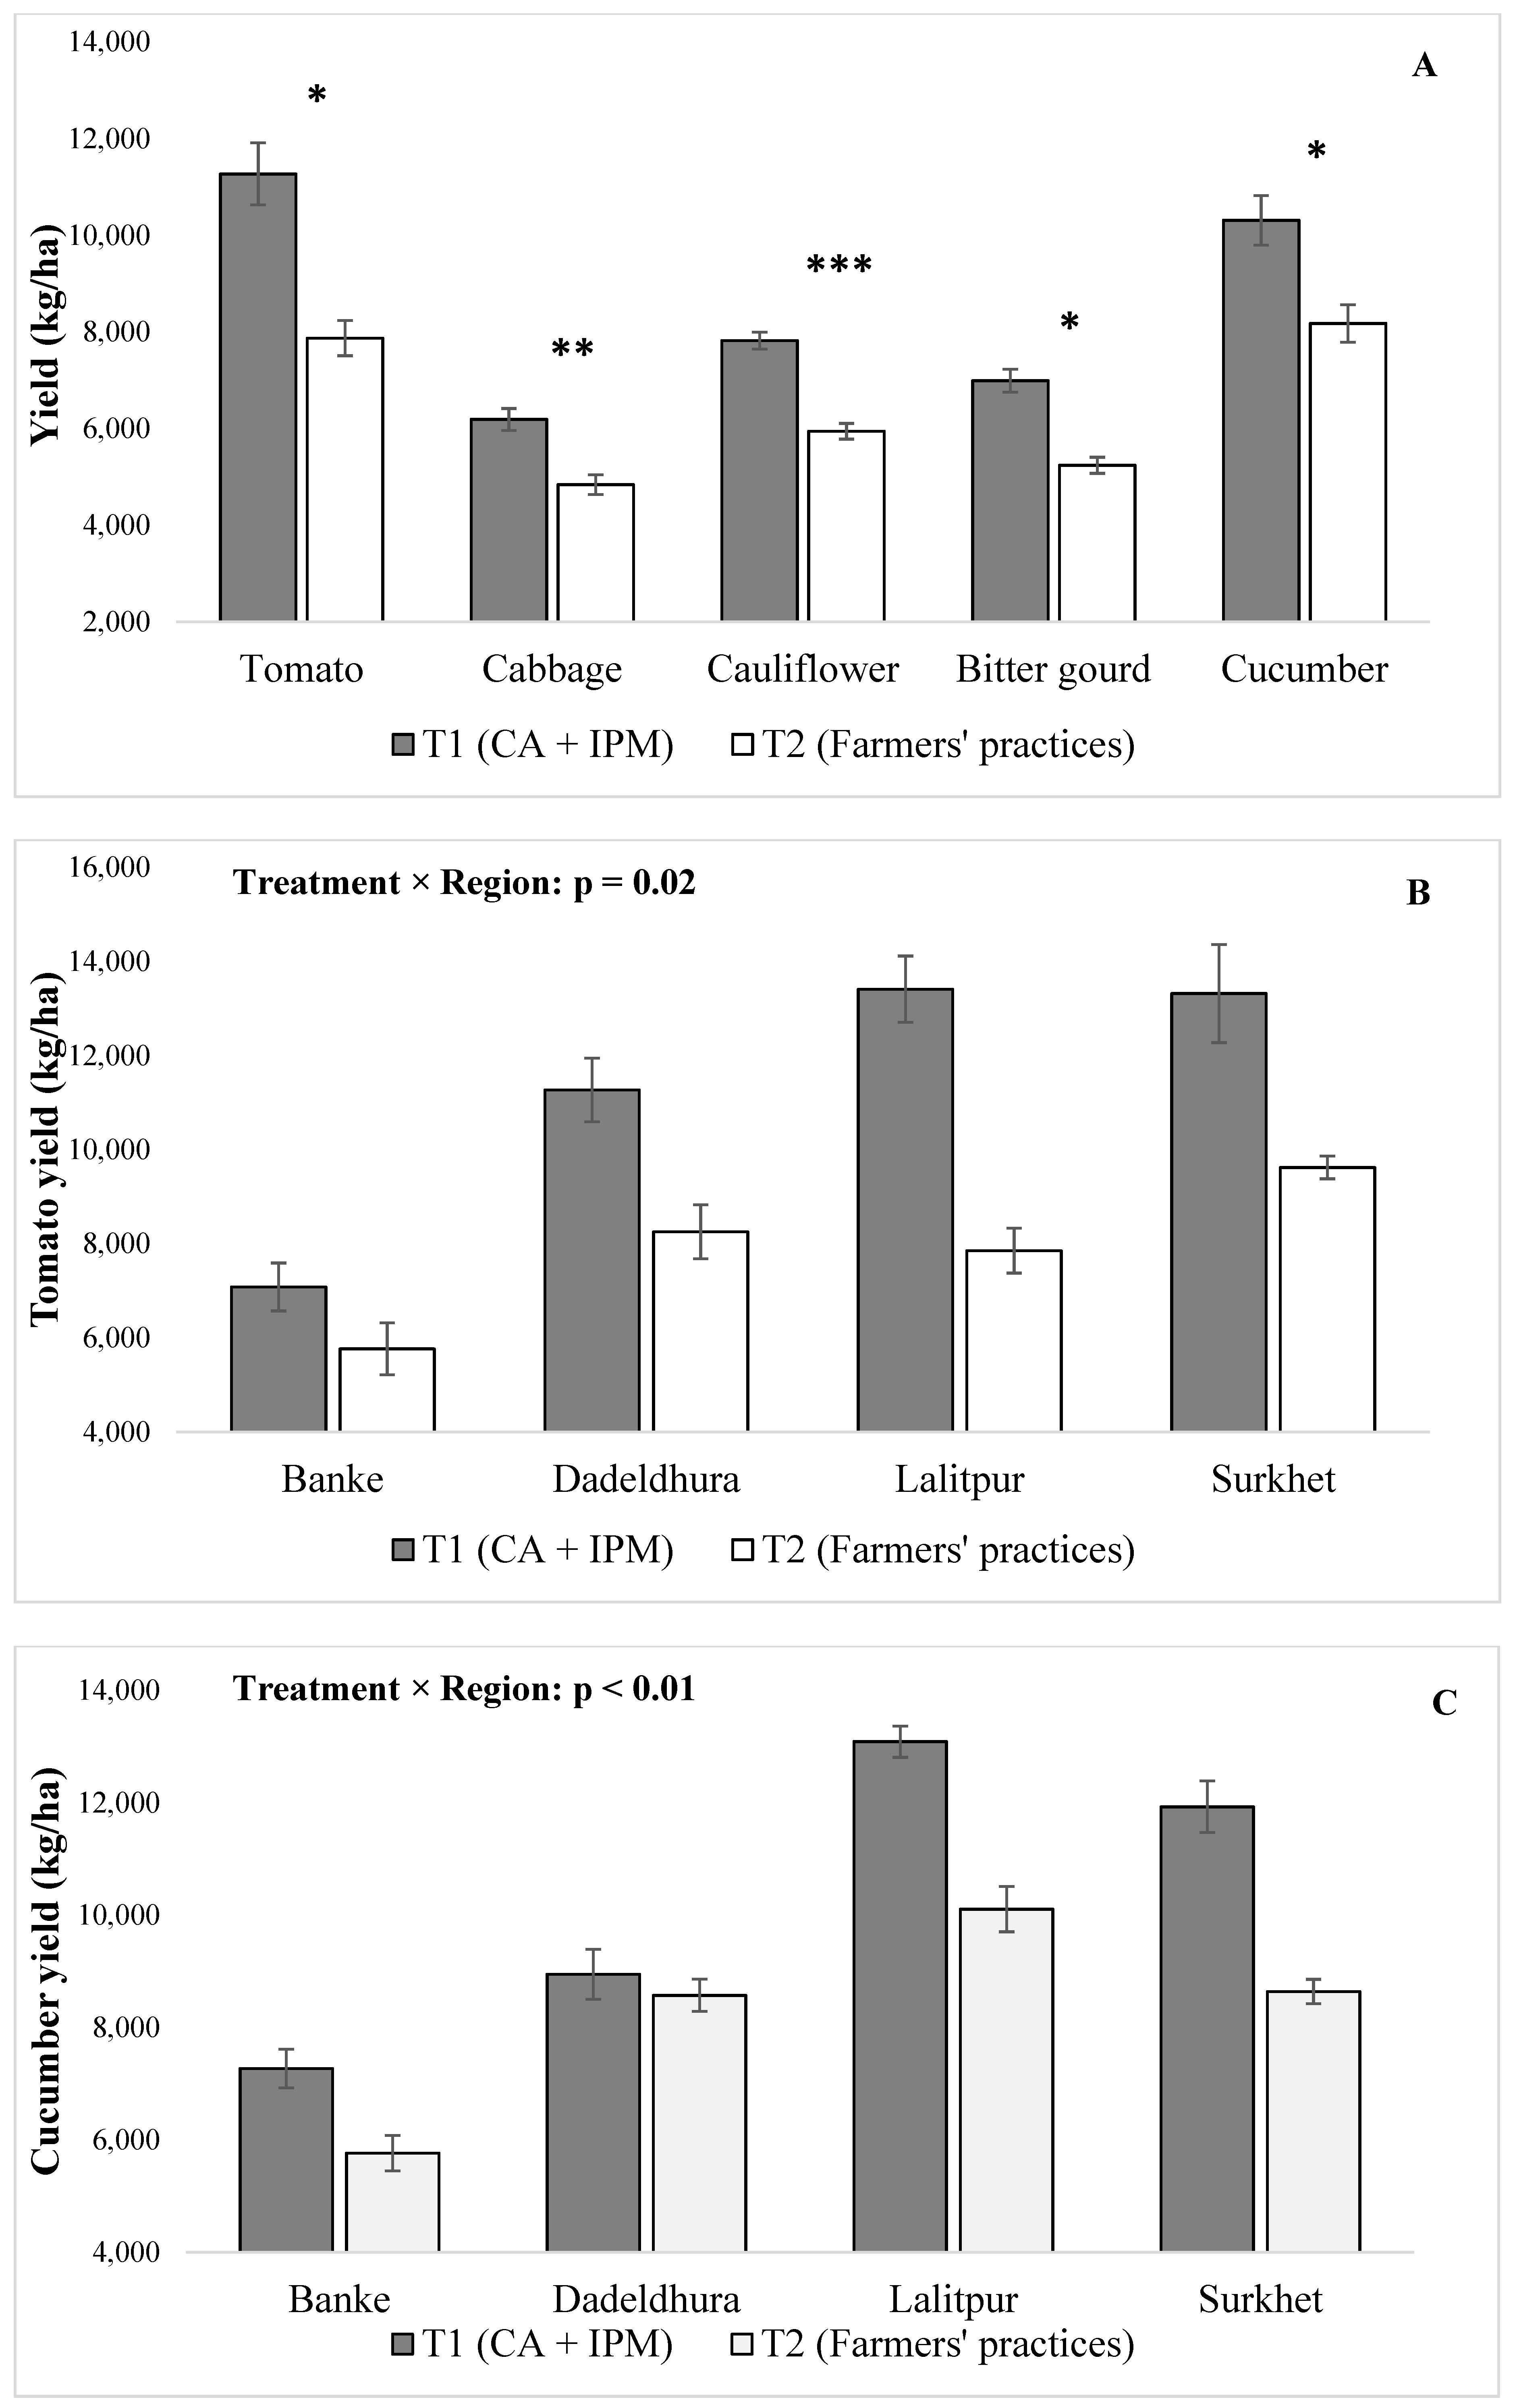
The yields for all the vegetable crops in the improved alternative system (tomato: F (1,40) = 14.97, p = 0.03, cabbage: F (1,40) = 35.05, p = 0.01, cauliflower: F (1,40) = 169.44, p < 0.01, bitter gourd F (1,40) = 31.14, p = 0.01, and cucumber: F (1,40) = 10.55, p = 0.05) were significantly superior to the conventional farmers’ practice (Table 3). On average, yield was 43.20%, 27.90%, 31.50%, 33.40%, and 26.10% higher in tomato, cabbage, cauliflower, bitter gourd, and cucumber, respectively, in the improved alternative system compared to the conventional practice (Figure 2A). The “region” effect was only significant for cucumber (F (3,40) = 11.88, p = 0.36) (Table 3).
Interactive effects of the treatment and the region were only significant for tomatoes (F (3,40) = 3.82, p = 0.02) and cucumbers (F (3,40) = 6.94, p < 0.01) (Table 3). Compared with Surkhet, tomato yields in the improved alternative system were significantly lower in Banke (Coefficient: −1043, p < 0.01), lower but not significant in Dadeldhura (Coefficient: −190, p < 0.01), and significantly higher in Lalitpur (Coefficient: 1082, p < 0.01) (Figure 2B). Similarly, cucumber yields under the improved alternative system compared to Surkhet were lower but nonsignificant in Banke (Coefficient: −118, p = 0.58), significantly lower in Dadeldhura (Coefficient: −879, p < 0.01), and higher but nonsignificant in Lalitpur (Coefficient: 421, p = 0.06) (Figure 2C).

3.2. Benefit–Cost Ratio (B:C Ratio)

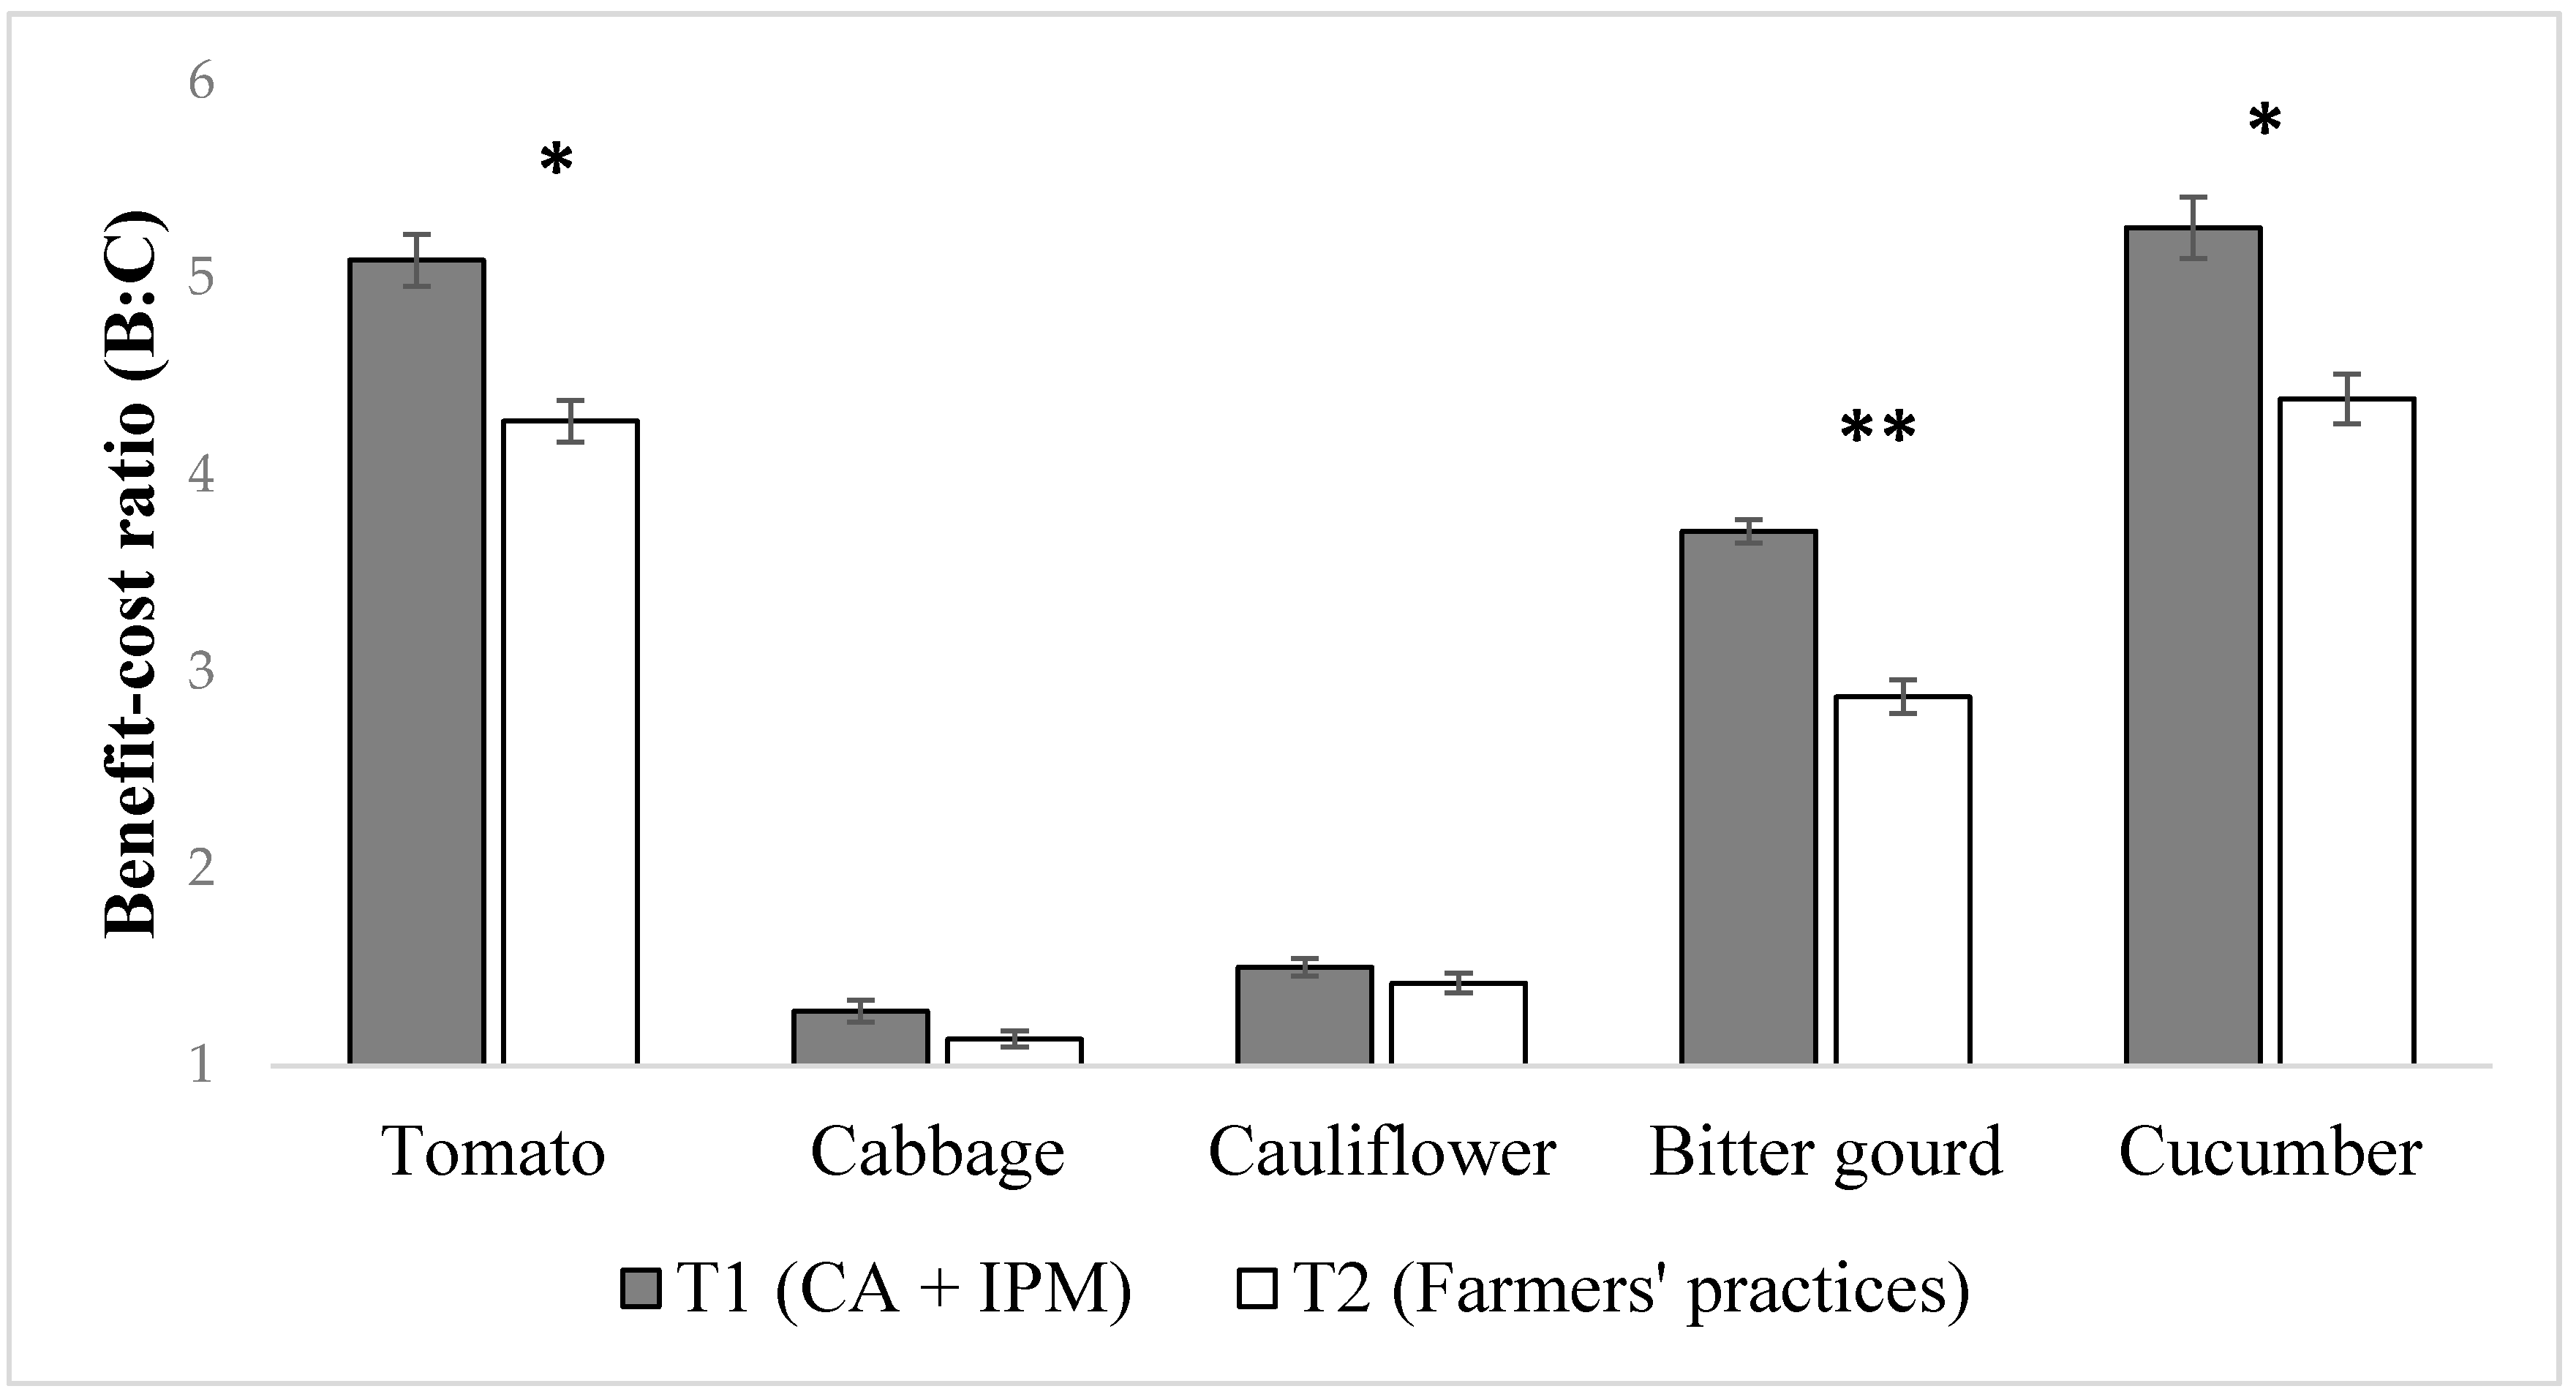
The B:C ratios for tomatoes, bitter gourds, and cucumbers in the improved alternative system were significantly higher than in the conventional system (tomato: F (1,40) = 43.64, p < 0.01, bitter gourd F (1,40) = 75.49, p < 0.01, and cucumber: F (1,40) = 12.59, p = 0.04) (Table 4). While there were no significant differences in cabbage (F (1,40) = 3.8, p = 0.01) and cauliflower (F (1,40) = 169.44, p < 0.01), B:C ratios from the alternative system in cabbage and cauliflower were 12.50% and 5.70% higher on average than in the conventional system (Figure 3). The independent effect of the region was only significant for tomatoes (F (3,40) = 9.31, p = 0.05) and interactive effects of the treatment and the region for all the vegetable crops were nonsignificant (Table 4).

3.3. Labor

There were significant differences in labor demand in tomatoes, bitter gourds, and cucumbers between two treatments (tomato: F (1,40) = 14.3, p = 0.03, bitter gourd F (1,40) = 10.94, p = 0.04, and cucumber: F (1,40) = 78.3, p < 0.01) (Table 5). On average, farmers spend 36.30%, 33.90%, and 31.80% less time on tomatoes, bitter gourds, and cucumbers, respectively, under alternative systems compared to the conventional plots (Figure 4A). No significant differences were recorded with cabbage (F (1,40) = 3.25, p = 0.17) and cauliflower (F (1,40) = 2.54, p = 0.21). The “region” effect was nonsignificant for all the vegetables (Table 5).
Interactive effects of treatment and region were only significant for tomatoes (F (3,40) = 5.29, p < 0.01) and bitter gourd (F (3,40) = 3.62, p = 0.02) (Table 5). Compared with Surkhet, labor demands on tomatoes under the improved alternative system were significantly higher in Banke (Coefficient: 3.22, p < 0.01), significantly lower in Dadeldhura (Coefficient: −2.54, p = 0.01), and higher but not significant in Lalitpur (Coefficient: 0.97, p = 0.33) (Figure 4B). Similarly, compared to Surkhet the labor demands on bitter gourds under the improved alternative system were significantly lower in Banke (Coefficient: −2.22, p = 0.02), significantly higher in Dadeldhura (Coefficient: 2.12, p = 0.02), and higher but not significant in Lalitpur (Coefficient: 0.88, p = 0.26) (Figure 4C).

3.4. Chemical Pesticide Spray Frequency

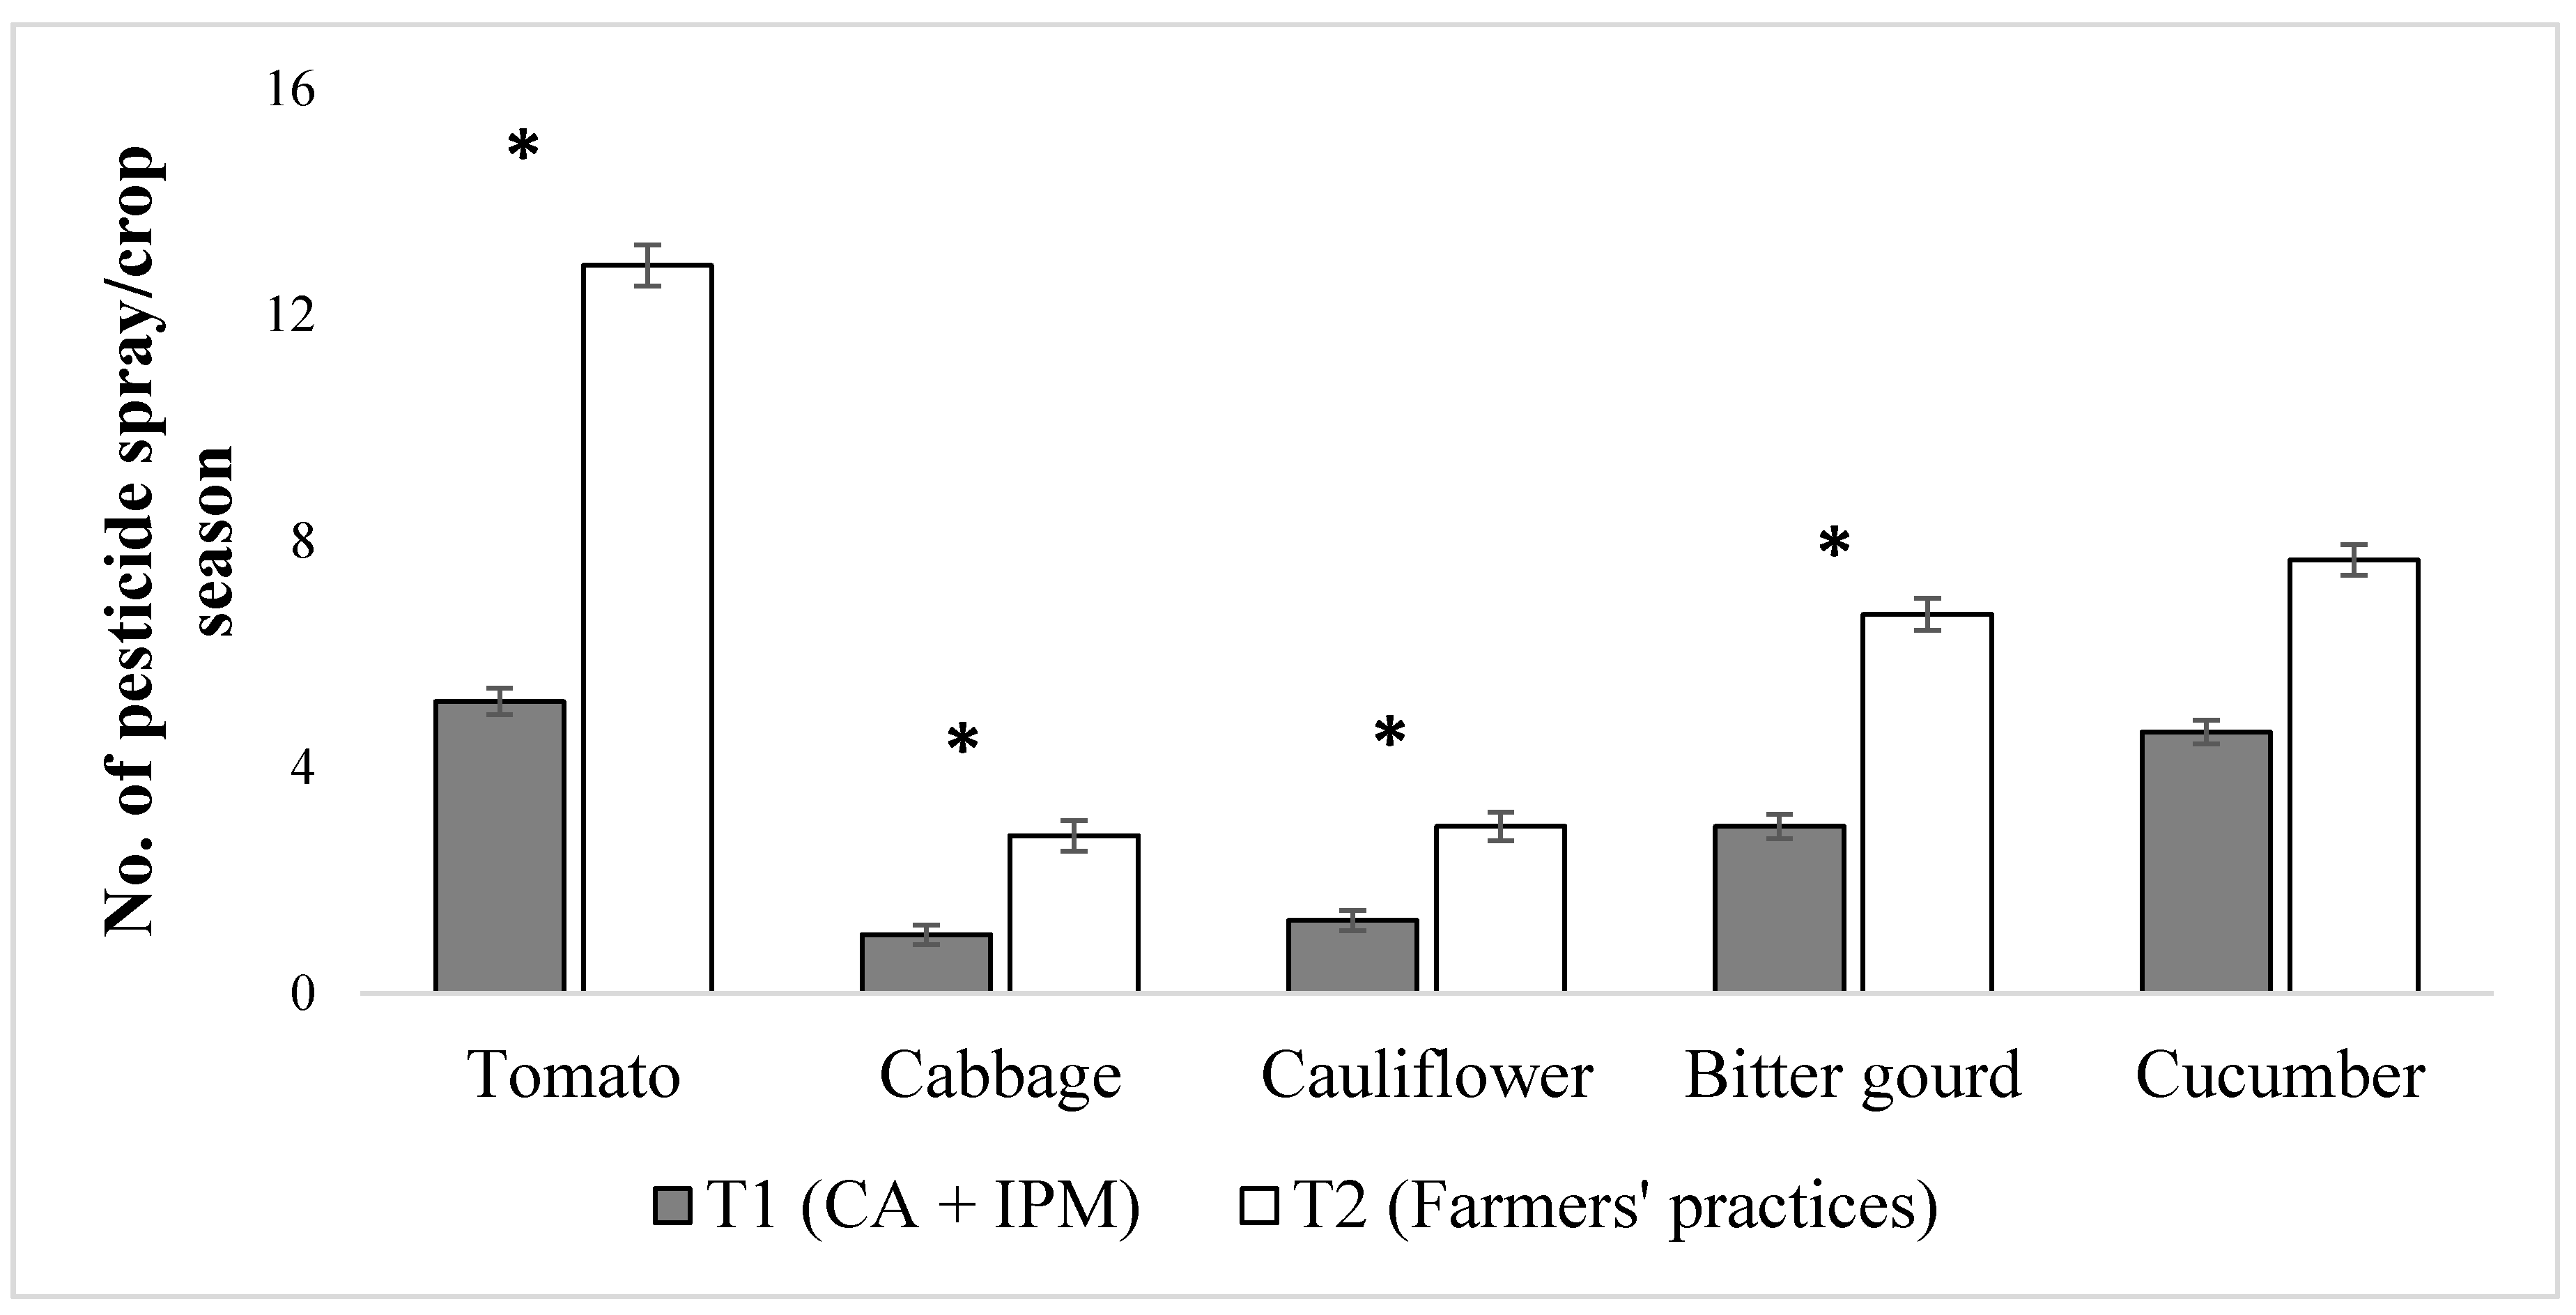
The alternative plots received a significantly lower amount of chemical pesticide spray in all the vegetable crops (tomato: χ² (1,7) = 13.00, p < 0.01, cabbage χ² (1,7) = 8.64, p < 0.01, cauliflower: χ² (1,7) = 5.79, p = 0.02, and bitter gourd: χ² (1,7) = 10.21, p < 0.01) besides cucumber (χ² (1,7) = 3.12, p = 0.08) (Table 6). On average, the spray frequency was 2.5-, 2.7-, 2.3-, 2.3-, and 1.7-fold higher in tomato, cabbage, cauliflower, bitter gourd, and cucumber, respectively, in the conventional system compared to the improved alternative system (Figure 5). Independent effect of region and interactive effects of treatment and region for all the vegetable crops were nonsignificant (Table 6).

3.5. Disease Infestation

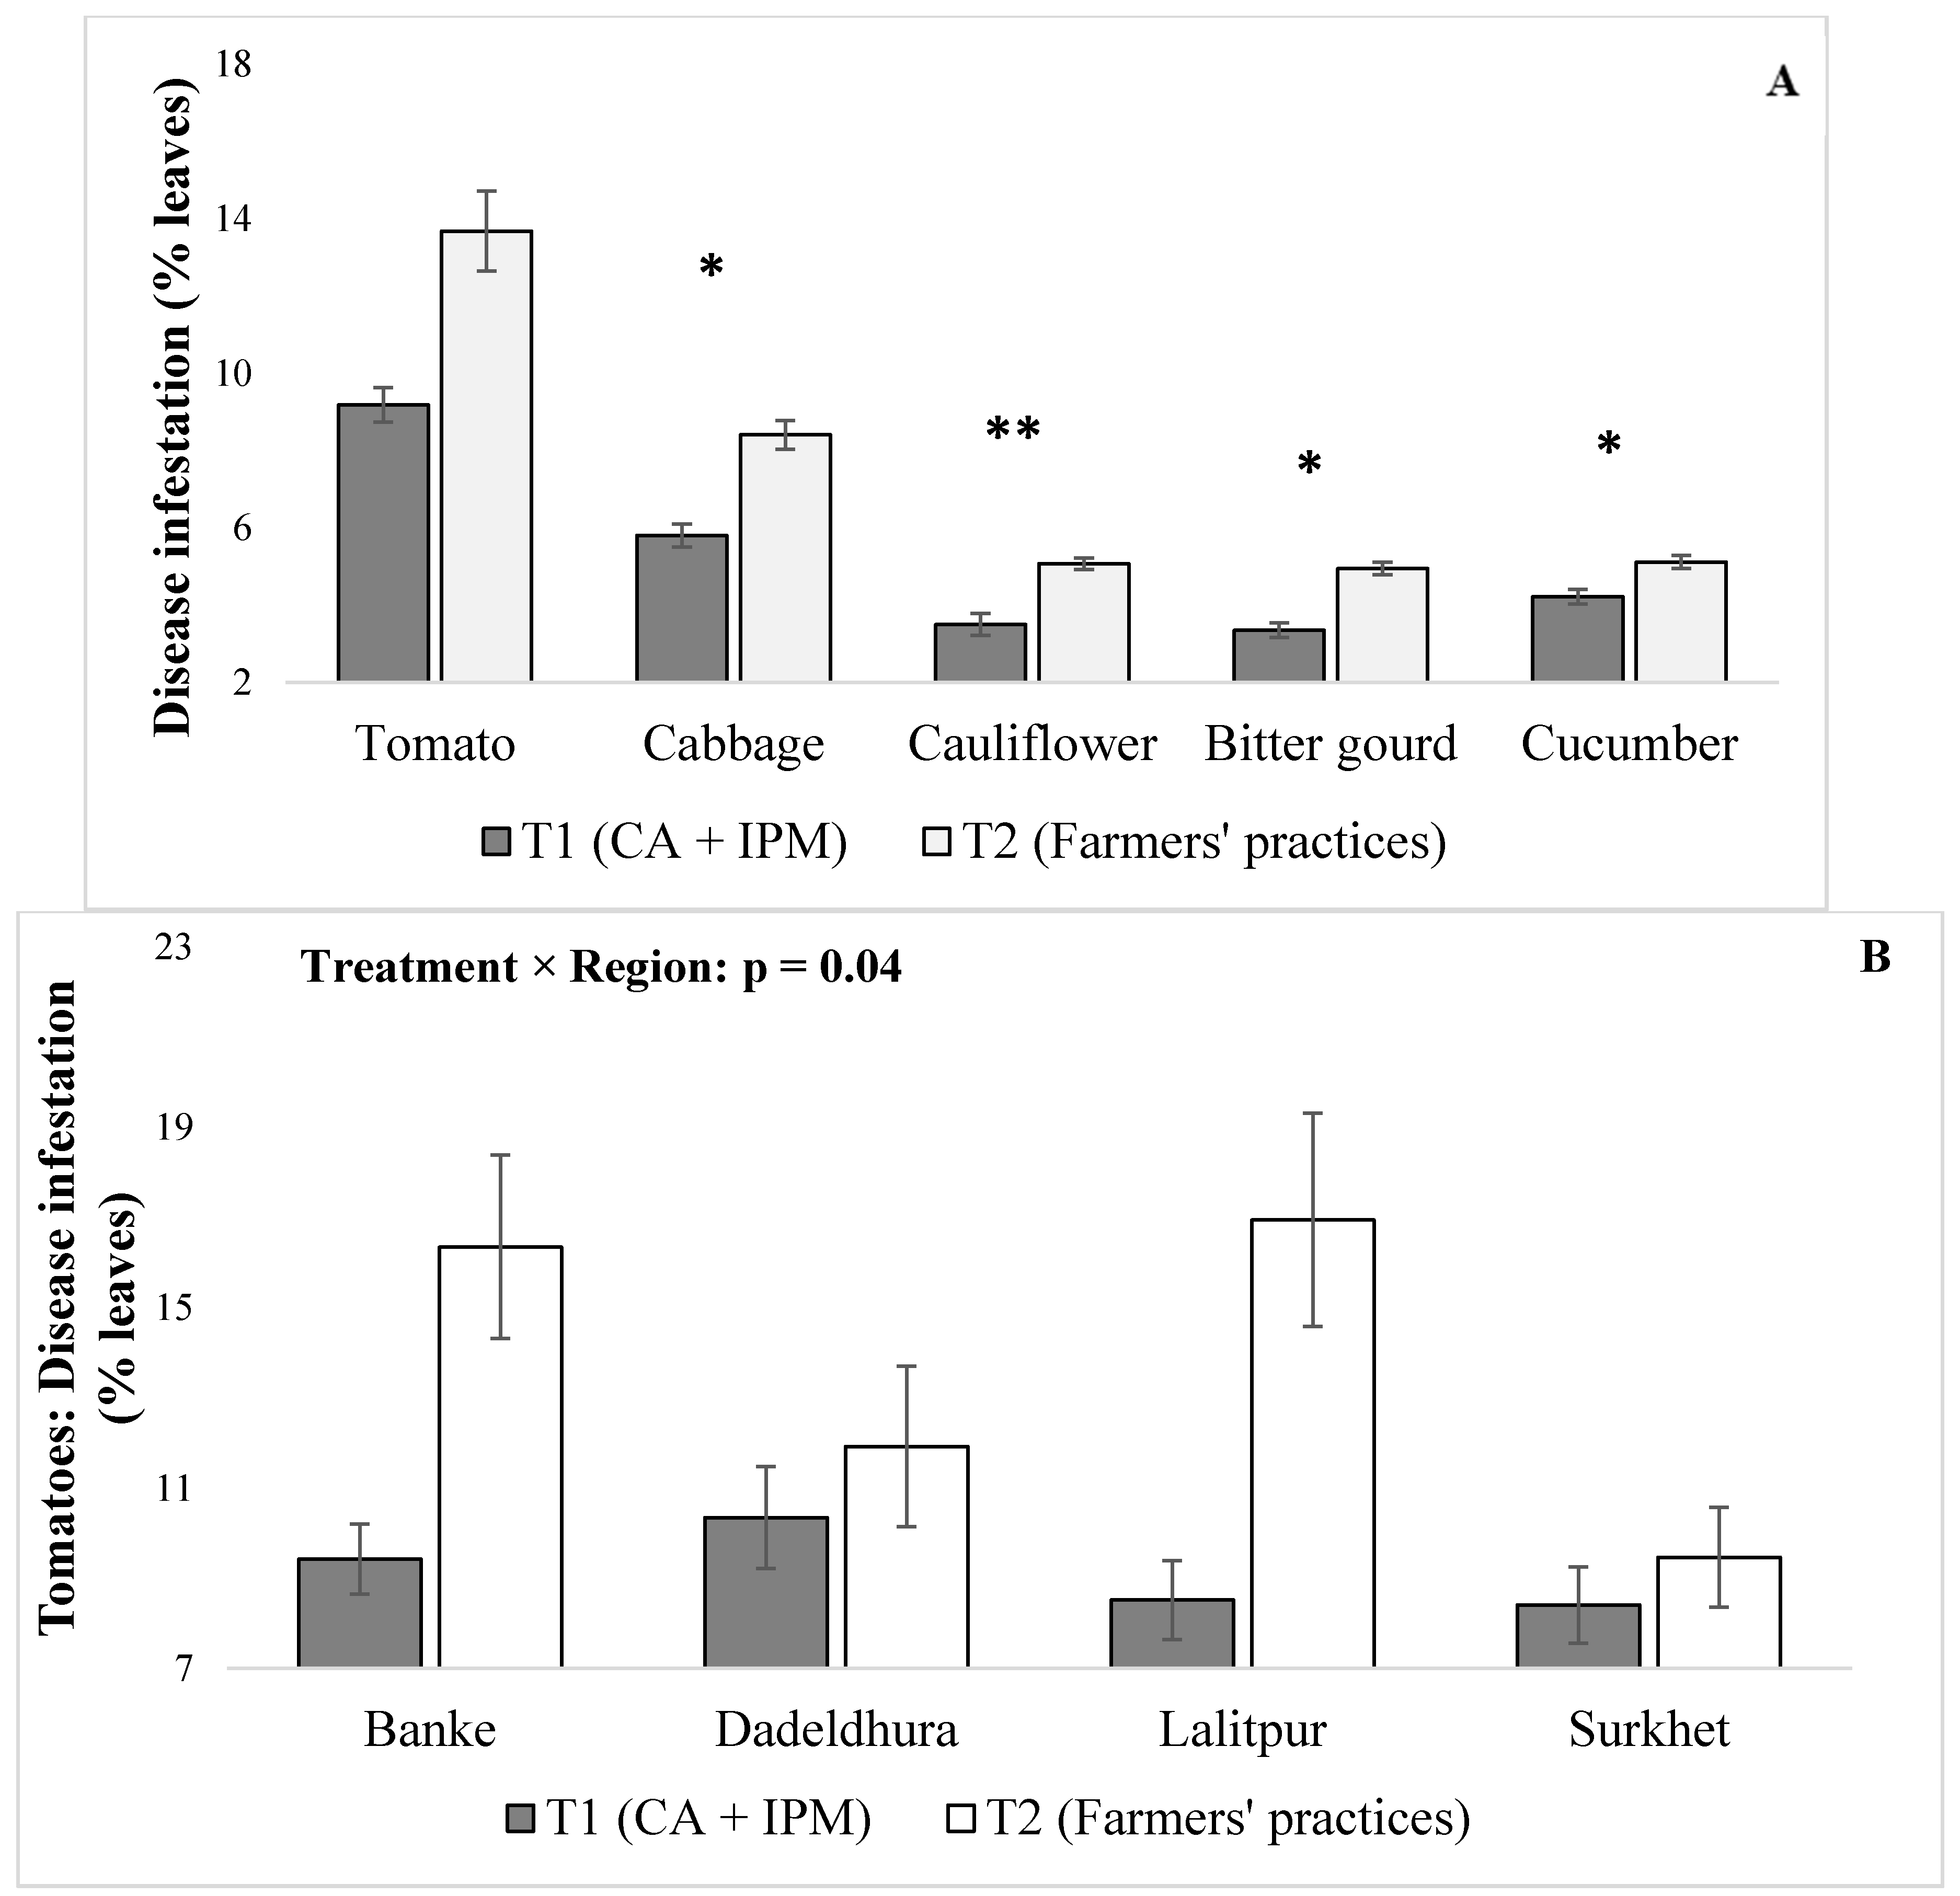
In general, the disease infestations on plant leaves grown under the conventional system were higher compared to the improved alternative system. Major leaf diseases identified were late blight (Phytophthora infestans) and septoria leaf spot (Septoria lycopersici) in tomatoes, alternaria leaf spot (Alternaria brassicicola) and powdery mildew (Golovinomyces cichoracearum) in cabbages and cauliflowers, and powdery mildew (Golovinomyces cichoracearum) and downy mildew (Pseudoperonospora cubensis) in bitter gourds and cucumbers. A significant higher disease infestation on plants under conventional system was observed in all the vegetable crops (cabbage: F (1,56) = 15.41, p = 0.03, cauliflower: F (1,56) = 114.87, p < 0.01, bitter gourd F (1,56) = 14.56, p = 0.03, and cucumber: F (1,56) = 27.53, p = 0.01); but for tomatoes (F (1,56) = 5.59, p = 0.10) (Table 7 and Figure 6A).
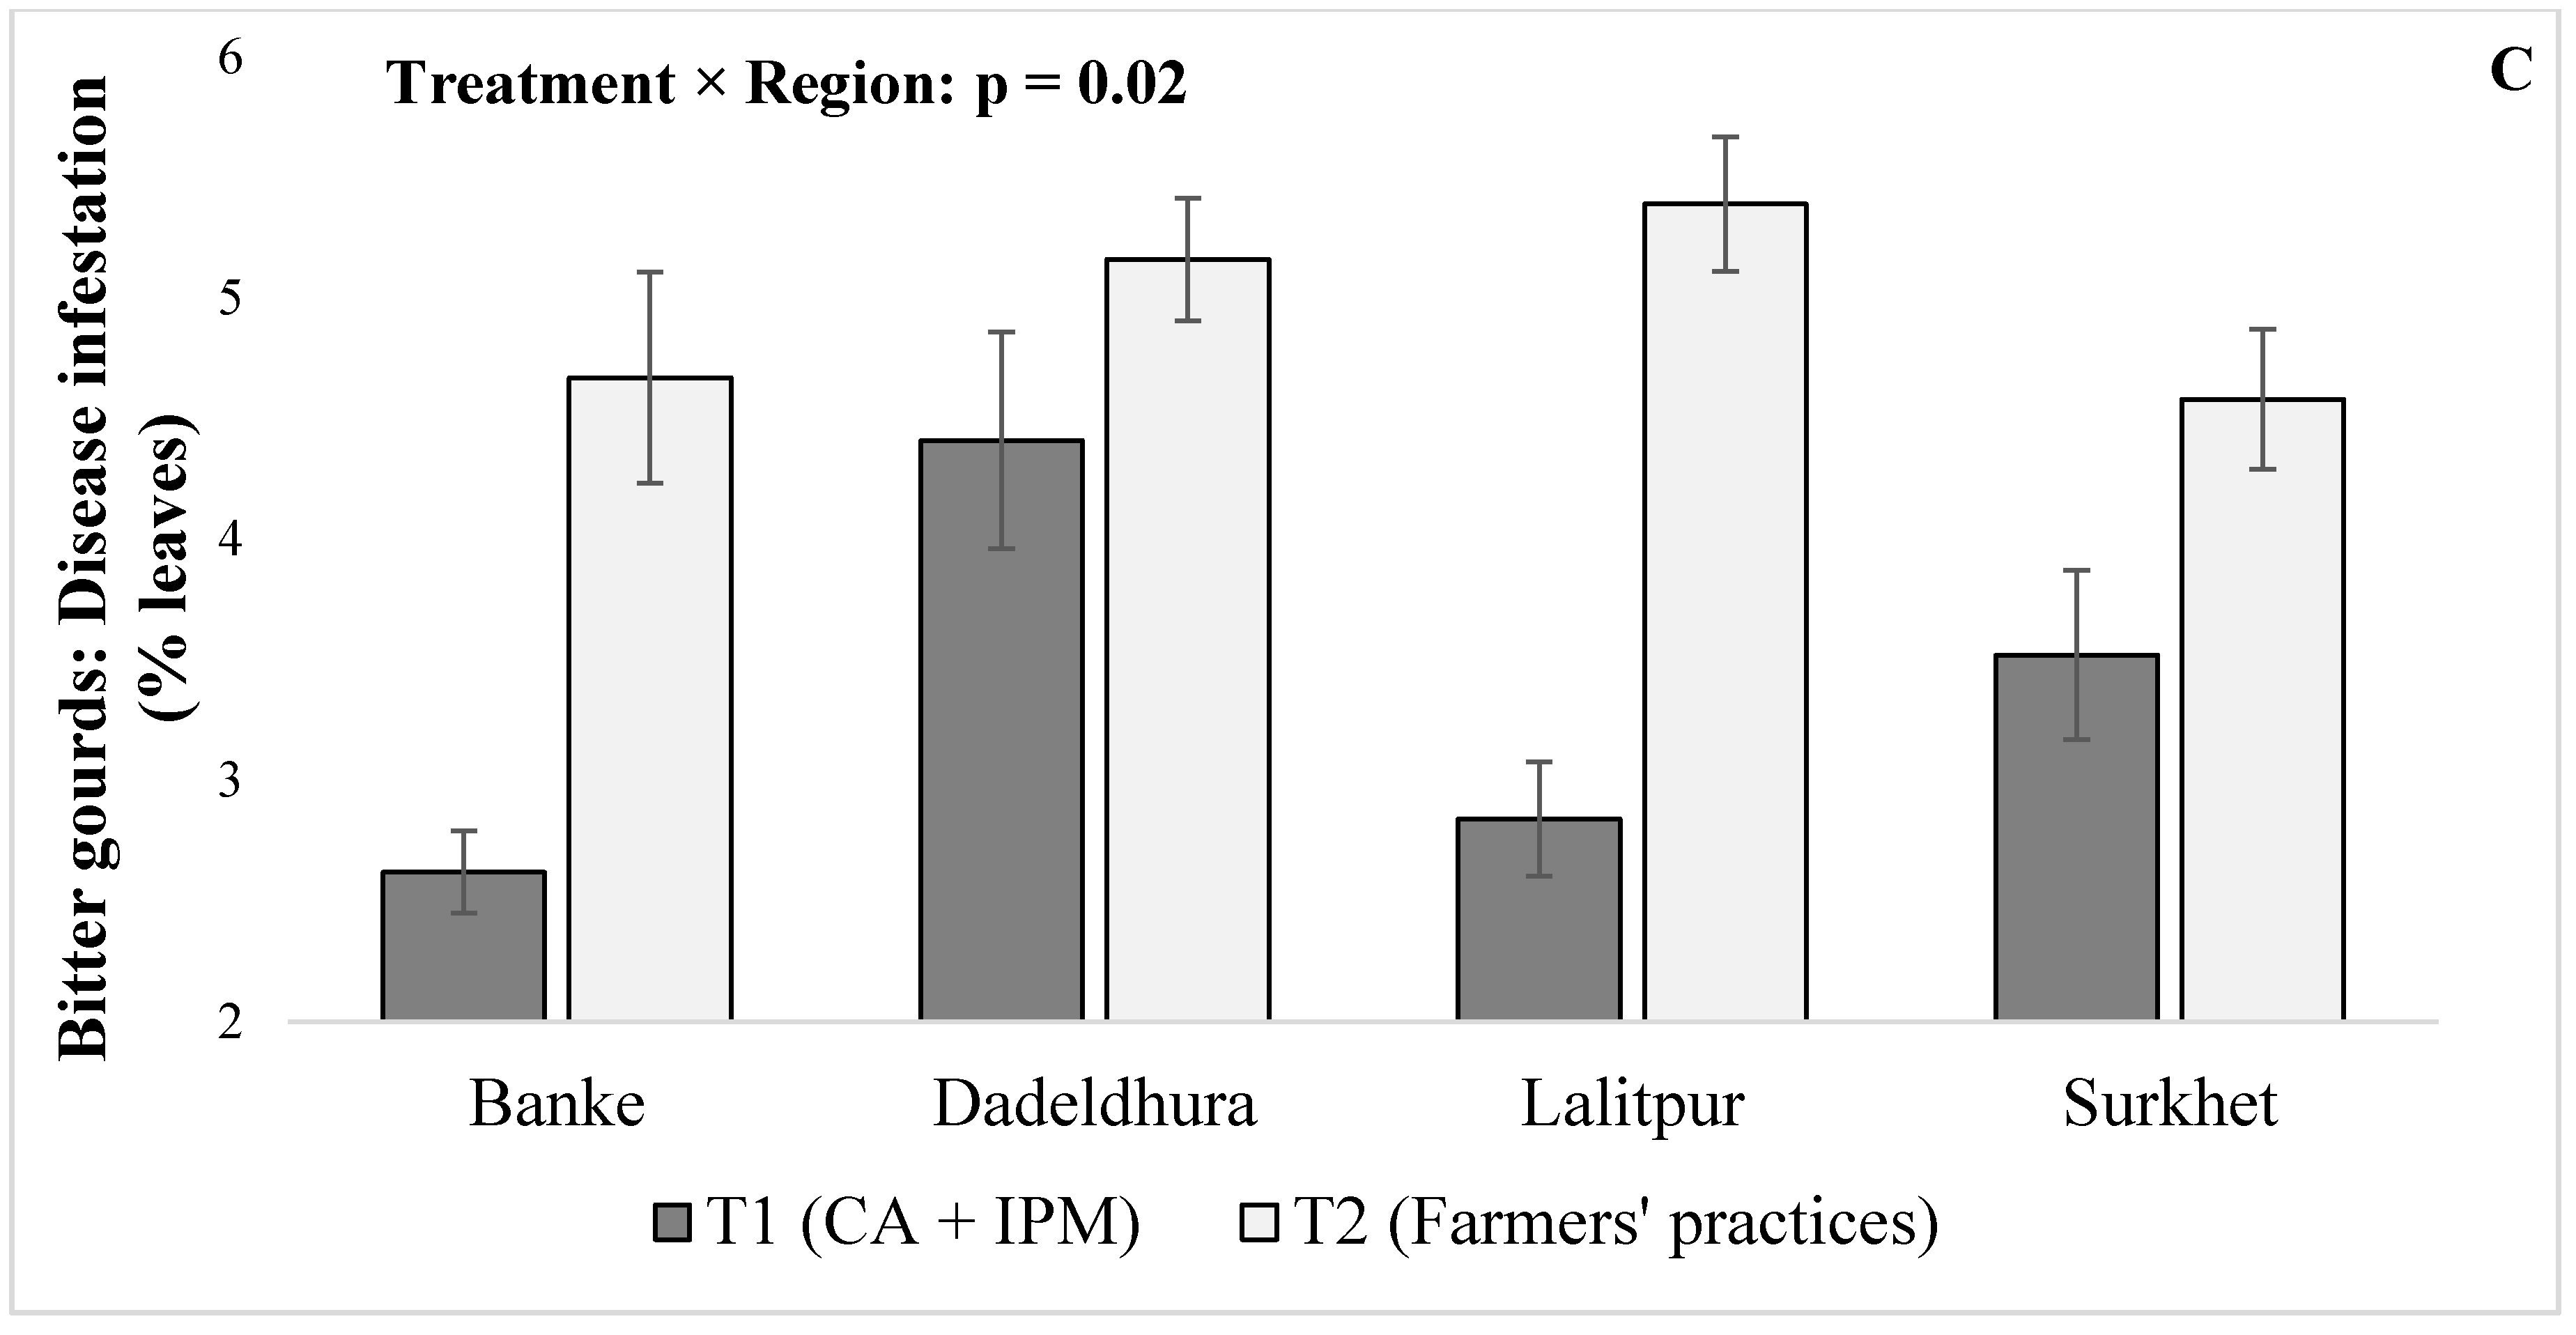
While region effect was nonsignificant for all the vegetables, significant interactive effects of the region and treatments were observed in tomatoes (F (3,56) = 3.01, p = 0.04) and bitter gourds (F (3,56) = 3.67, p = 0.02) (Table 7). Compared with Surkhet, disease infestations in tomatoes under the improved alternative system were lower but not significant in Banke (Coefficient: 0.02, p = 0.20), higher but not significant in Dadeldhura (Coefficient: 0.02, p = 0.10), and significantly lower in Lalitpur (Coefficient: −0.03, p = 0.04) (Figure 6B). Similarly, compared to Surkhet disease infestation in bitter gourds under the improved alternative system were lower but not significant in Banke (Coefficient: −0.006, p = 0.22), significantly higher in Dadeldhura (Coefficient: 0.01, p = 0.02), and significantly lower in Lalitpur (Coefficient: −0.01, p = 0.02) (Figure 6C).

3.6. Herbivory Damage

In general, leaf damage from insect herbivores was higher in plants grown under the conventional system compared to the improved alternative system. The most common insect herbivores observed on leaves were tomato fruit worm (Helicoverpa armigera) and tobacco cutworm (Spodoptera litura) in tomatoes, diamondback moth (Plutella xylostella), and cabbage butterfly (Pieris rapae) in cabbages and cauliflowers, and red pumpkin beetle (Aulacophora foveicollis) in bitter gourds and cucumbers. Significant differences between treatments were only observed on cauliflower and cucumber (tomato: F (1,56) = 4.09, p = 0.14, cabbage: F (1,56) = 1.6, p = 0.30, cauliflower: F (1,56) = 10.59, p = 0.05, bitter gourd: F (1,56) = 7.12, p = 0.08, and cucumber: F (1,56) = 21.83, p = 0.02) (Table 8 and Figure 7). Independent effect of region as well as the interactive effects of region and treatments on herbivory damage were not significant (Table 8).

4. Discussion

The improved alternative system with CA and IPM practices produced a higher yield compared to the conventional system in all the vegetables tested, i.e., tomato, cabbage, cauliflower, bitter gourd, and cucumber. Similar increase in yield (40.90% higher than the conventional systems) in the IPM system was reported evaluating 85 IPM projects (including vegetables) from Asia and Africa [11]. CA technologies has also resulted increase in yield in vegetables in parts of Africa and Southeast Asia [17,18]. While we did not directly measure nutrients level in the soil, the use of organic mulches usually improves soil nitrogen level and consequently the yield [17,18], which may have impacted the yield in our experiments.
A lower level of insect and disease infestation in the improved alternative system may be attributable to a superior growth and yield in vegetable crops in the study [38,39,40]. In India, IPM practices resulted in significantly lower incidence of insect pests in cauliflower with reduction in crop protection cost by 45.00% and, consequently, a higher return [41]. Reduction in the use of chemical pesticides with IPM technologies and CA practices (e.g., conservation tillage, mulches, cover crops) also strengthen natural enemy populations of insect pests by enhancing environmental diversity [42,43,44]. Similarly, a higher soil nitrogen content from the use of organic mulches are positively correlated with the level of secondary metabolites like alkaloids in plants, leading to enhanced plants resistance against both insects and diseases [9,45,46].
Higher yield in tomatoes, bitter gourds, and cucumbers paralleled with a significantly higher B:C ratio in the alternative system indicating a higher return on investments. Similar results were also reported by [5,41] in vegetables using IPM approaches in Nepal and India, respectively. B:C ratios for cabbage and cauliflower, however, were not significantly different between treatments. Cabbages and cauliflowers are just harvested once (one head/production cycle), which may have resulted in a lower B:C ratio [5]. Tomatoes, bitter gourds, and cucumbers, in contrast, are harvested multiple times; therefore, they are economically more viable for small holder farmers adopting an alternative system. However, the vegetables produced under improved alternative systems were sprayed significantly fewer times compared to those in the conventional systems [38,39]. IPM practices in tomatoes reduced the pesticide application by 3-4-fold in the United States [47]. Similar reductions in the frequency of pesticide applications were also reported from India in cucumber [41] and in several vegetable crops including tomato, cucumber, bitter gourd, country bean (Phaseolus vulgaris), and eggplant (Solanum melongena) in Bangladesh [31]. Reduction in the use of chemical pesticides not only benefit human health and the environment, but also substantially reduce the cost of production [41,48,49]. The reduced frequency of pesticide application in the alternative system observed in our study may help address the remarkable increase in the over and misuse of chemical pesticides in Nepal in the recent times [7,50].
The conventional system in our study required significantly higher labor compared to the improved alternative system. The results can be discussed considering a couple of points. First, drip irrigation systems are proven to require substantially less labor compared to manual irrigation and fertigation commonly used in conventional systems [26,27]. Second, manual removal of weeds in the conventional system is very labor-intensive compared to the improved alternative system where mulching and no-tillage practices are used. These improved practices substantially reduce weeds in general [8,17,18,19] but for a few exceptions [51]. Third, reduced chemical spray frequency in the improved alternative system requires less labor [32,40]. Labor is an important consideration in adoption of new improved practices and approaches [52,53] especially in the current Nepalese context where labor-shortage is a huge challenge in agriculture with rapid out-migration of youths [54].
In addition to the main treatment effects (conventional system vs improved alternative system), independent effects of the region, as well as interactive effects of the region and treatment, were significant in a few instances. Differences in climatic conditions and physical characteristics among the field sites may have possibly affected the interactive responses of treatments and regions [55,56]. For example, the average annual temperature (Lalitpur: 18.1 °C, Banke: 27.0 °C, Surkhet: 24. 5 °C, Dadeldhura: 16.1 °C) and rainfall (Lalitpur: 1505 mm, Banke: 1312 mm, Surkhet: 765 mm, Dadeldhura: 1398 mm) vary greatly among the investigated regions [57].
In summary, this multilocation study conducted in Nepal compared yield, B:C ratios, labor, pesticides spray frequency, and insect and disease infestation between conventional and improved alternative (CA + IPM) systems under on-farm conditions. Overall, the improved alternative system was more productive and profitable. Higher yields in the improved alternative system were complemented by the significant reduction in labor use, insect pests and diseases infestation, and chemical pesticide applications. Results suggested that adoption of CA and IPM practices may be useful in increasing productivity of vegetables while reducing inputs and labor, as well as protecting environment and human health. Governmental and non-governmental organizations should encourage and support farmers to adopt these improved practices through strengthening existing research, extension, and information delivery mechanisms. Future research should focus on improvement and further evaluation of both CA and IPM practices on a site- and season-specific basis and at larger scale. Research on methods of scaling these innovations will be important to have a wider impact on food and the nutritional security of smallholder vegetable producers in Nepal.

Author Contributions

S.P. and M.R.R. conceived the study, participated in its design and coordination; S.P. performed the statistical analysis and drafted the manuscript; L.P.S., V.P. and M.D. helped with data collection and analysis; P.V.V.P. helped with manuscript preparation and editing. All authors discussed the results and contributed to the final manuscript. All authors have read and agreed to the published version of the manuscript.

Funding

This research and publication are made possible by the generous support of the American people through support by the United States Agency for International Development to the Feed the Future Innovation Labs for Collaborative Research on Horticulture (Cooperative Agreement No. EPP-A-00-09-00004, University of California, Davis) and Sustainable Intensification (Cooperative Agreement No. AID-OAA-L-14-00006, Kansas State University). Contribution number 21-013-J from Kansas Agriculture Experiment Station.

Acknowledgments

We thank Chakra Rai and Padam Khadka for their continuous assistance in carrying out the study.

Conflicts of Interest

The authors declare no conflict of interest.

References

  1. Schreinemachers, P.; Simmons, E.B.; Wopereis, M.C. Tapping the economic and nutritional power of vegetables. Glob. Food Secur. 2018, 16, 36–45. [Google Scholar] [CrossRef]
  2. Sedani, S.R.; Pardeshi, I.L.; Bhad, R.G.; Nimkarde, P.G. Vegetables: A boon to human healthy life. J. Ready Eat Food 2018, 5, 22–30. [Google Scholar]
  3. Gurung, B.; Thapa, R.B.; Gautam, D.M.; Karki, K.B.; Regmi, P.P. Commercial vegetable farming: An approach for poverty reduction in Nepal. Agron. J. Nepal 2016, 4, 92–106. [Google Scholar] [CrossRef] [Green Version]
  4. Tripathi, B.P. Sustainable soil fertility management practices in Nepal. Acta Sci. Agric. 2019, 3, 112–113. [Google Scholar]
  5. Paudel, S.; Sah, L.P.; Pradhan, K.; Colavito, L.A.; Upadhyay, B.P.; Rajotte, E.G.; Muniappan, R. Development and Dissemination of Vegetable IPM Practices and Packages in Nepal. In Integrated Pest Management of Tropical Vegetable Crops; Springer: Dordrecht, The Netherlands, 2016; pp. 251–269. [Google Scholar]
  6. Rasul, G.; Saboor, A.; Tiwari, P.C.; Hussain, A.; Ghosh, N.; Chettri, G.B. Food and nutrition security in the Hindu Kush Himalaya: Unique challenges and niche opportunities. In Hindu Kush Himalaya Assess; Springer: Cham, Germany, 2019; pp. 301–338. [Google Scholar]
  7. Sharma, D.R.; Thapa, R.B.; Manandhar, H.K.; Shrestha, S.M.; Pradhan, S.B. Use of pesticides in Nepal and impacts on human health and environment. J. Food. Agric. Environ. 2012, 13, 67–74. [Google Scholar] [CrossRef] [Green Version]
  8. Clark, M.S.; Ferris, H.; Klonsky, K.; Lanini, W.T.; Van Bruggen, A.H.C.; Zalom, F.G. Agronomic, economic, and environmental comparison of pest management in conventional and alternative tomato and corn systems in northern California. Agric. Ecosyst. Environ. 1998, 68, 51–71. [Google Scholar] [CrossRef]
  9. Altieri, M.A.; Nicholls, C.I. Soil fertility management and insect pests: Harmonizing soil and plant health in agroecosystems. Soil Till. Res. 2003, 72, 203–211. [Google Scholar] [CrossRef]
  10. Stevenson, J.R.; Serraj, R.; Cassman, K.G. Evaluating conservation agriculture for small-scale farmers in Sub-Saharan Africa and South Asia. Agric. Ecosyst. Environ. 2014, 187, 1–10. [Google Scholar] [CrossRef]
  11. Pretty, J.; Bharucha, Z.P. Integrated pest management for sustainable intensification of agriculture in Asia and Africa. Insects 2015, 6, 152–182. [Google Scholar] [CrossRef]
  12. Pretty, J.; Benton, T.G.; Bharucha, Z.P.; Dicks, L.V.; Flora, C.B.; Godfray, H.C.J.; Goulson, D.; Hartley, S.; Lampkin, N.; Morris, C.; et al. Global assessment of agricultural system redesign for sustainable intensification. Nat. Sustain. 2018, 1, 441–446. [Google Scholar] [CrossRef]
  13. Kassam, A.; Friedrich, T.; Derpsch, R. Global spread of conservation agriculture. Int. J. Environ. Sci. 2019, 76, 29–51. [Google Scholar] [CrossRef]
  14. Heeb, L.; Jenner, E.; Cock, M.J. Climate-smart pest management: Building resilience of farms and landscapes to changing pest threats. J. Pest. Sci. 2019, 92, 951–969. [Google Scholar] [CrossRef]
  15. Mulvaney, M.J.; Reyes, M.R.; Chan-Halbrendt, C.; Boulakia, S.; Jumpa, K.; Sukvibool, C.; Sombatpanit, S. Conservation Agriculture in Southeast Asia and Beyond. In Proceedings of the 2nd International Agriculture Workshop and Conference in Southeast Asia, Phnom Penhn, Cambodia, 4–7 July 2011. [Google Scholar]
  16. Gibbon, D. Save and grow: A Policymaker’s Guide to the Sustainable Intensification of Smallholder Crop Production. Exp. Agric. 2012, 48, 154. [Google Scholar] [CrossRef]
  17. Naab, J.B.; Mahama, G.Y.; Yahaya, I.; Prasad, P.V.V. Conservation agriculture improves soil quality, crop yield, and incomes of smallholder farmers in North Western Ghana. Front. Plant Sci. 2017, 8, 1–15. [Google Scholar] [CrossRef] [Green Version]
  18. Ghaley, B.; Rusu, T.; Sandén, T.; Spiegel, H.; Menta, C.; Visioli, G.; Vrebos, D. Assessment of benefits of conservation agriculture on soil functions in arable production systems in Europe. Sustainability 2018, 10, 794. [Google Scholar] [CrossRef] [Green Version]
  19. Assefa, T.; Jha, M.; Reyes, M.; Worqlul, A.W.; Doro, L.; Tilahun, S. Conservation agriculture with drip irrigation: Effects on soil quality and crop yield in sub-Saharan Africa. J. Soil Water Conserv. 2020, 75, 209–217. [Google Scholar] [CrossRef]
  20. Rashid, M.; Chung, Y.R. Induction of systemic resistance against insect herbivores in plants by beneficial soil microbes. Front. Plant Sci. 2017, 8, 1816. [Google Scholar] [CrossRef] [Green Version]
  21. Ella, V.B.; Reyes, M.R.; Yoder, R. Effect of hydraulic head and slope on water distribution uniformity of a low-cost drip irrigation system. Appl. Eng. Agric. 2009, 25, 349–356. [Google Scholar] [CrossRef] [Green Version]
  22. Palada, M.C.; Bhattarai, S.P.; Roberts, M.S.; Bhattarai, M.; Baxter, N.; Kimsan, R.; Wu, D.L. Improving smallholder dry season vegetable production through increased water productivity with low cost drip irrigation technology in Cambodia. Acta Hortic. 2010, 922, 133–140. [Google Scholar] [CrossRef]
  23. Assefa, T.; Jha, M.; Reyes, M.; Worqlul, A.W. Modeling the impacts of conservation agriculture with a drip irrigation system on the hydrology and water management in sub-Saharan Africa. Sustainability 2018, 10, 4763. [Google Scholar] [CrossRef] [Green Version]
  24. Narayanamoorthy, A. Can drip method of irrigation be used to achieve the macro objectives of conservation agriculture? Indian J. Agric. Econ. 2010, 65, 428–438. [Google Scholar]
  25. Upadhyay, B. Gender aspects of smallholder irrigation technology: Insights from Nepal. J. App. Irrig. Sci. 2004, 39, 315–327. [Google Scholar]
  26. Khatri-Chhetri, A.; Regmi, P.P.; Chanana, N.; Aggarwal, P.K. Potential of climate-smart agriculture in reducing women farmers’ drudgery in high climatic risk areas. Clim. Chang. 2020, 158, 29–42. [Google Scholar] [CrossRef] [Green Version]
  27. Muniappan, R.; Heinrichs, E.A. Integrated Pest Management of Tropical Vegetable Crops; Springer: Dordrecht, The Netherlands, 2016. [Google Scholar]
  28. Dhital, S.; Rupakheti, D.; Tripathee, L.; Sigdel, S.R. A review on status of pesticides use in Nepal. Res. J. Agric. Sci. 2015, 3, 26–29. [Google Scholar]
  29. Kafle, B.K.; Pokhrel, B.; Shrestha, S.; Raut, R.; Dahal, B.M. Determination of pesticide residues in water and soil samples from Ansikhola watershed, Kavre, Nepal. Int. J. Earth Sci. 2015, 5, 119–127. [Google Scholar]
  30. Norris, C.E.; Congreves, K.A. Alternative management practices improve soil health indices in intensive vegetable cropping systems: A review. Front. Environ. Sci. 2018, 6, 1–18. [Google Scholar] [CrossRef]
  31. Rahman, M.S.; Norton, G.W.; Rashid, M.H.A. Economic impacts of integrated pest management on vegetables production in Bangladesh. J. Crop Prot. 2018, 113, 6–14. [Google Scholar] [CrossRef]
  32. Owusu, V.; Abdulai, A. Examining the economic impacts of integrated pest management among vegetable farmers in Southern Ghana. J. Environ. Plan. Manag. 2019, 62, 1886–1907. [Google Scholar] [CrossRef]
  33. Romero, E.A. Cost-benefit Analysis of an Agricultural Project Involving a Smallholder Production System. Ph.D. Thesis, McGill University, Montreal, QC, Canada, 2014. [Google Scholar]
  34. Kanhar, K.A.; Sahito, H.A.; Kanher, F.M.; Tunio, S.A.; Awan, R.R.H. Damage percent and biological parameters of leaf miner Acrocercops syngramma (Meyrick) on different mango varieties. J. Emtomol. Zool. Stud. 2016, 4, 541–546. [Google Scholar]
  35. Pest Management Guidelines. Available online: https://www2.ipm.ucanr.edu/agriculture/tomato/ (accessed on 14 January 2015).
  36. Demétrio, C.G.; Hinde, J.; Moral, R.A. Models for overdispersed data in entomology. In Ecological Modelling Applied to Entomology; Springer: Cham, Germany, 2014; pp. 219–259. [Google Scholar]
  37. Minitab (Version 18). Available online: http://www.minitab.com/en-US/products/minitab/default.aspx (accessed on 22 October 2019).
  38. Acharya, R.; Paudel, S.; Rajbhandari, B.P. Growth, yield formation, fruit quality and economics of tomato production under IPM package vs. conventional practice in Surkhet district. J. Nep. Agric. Sci. 2015, 123–133. [Google Scholar]
  39. Midingoyi, S.K.G.; Kassie, M.; Muriithi, B.; Diiro, G.; Ekesi, S. Do farmers and the environment benefit from adopting integrated pest management practices? Evidence from Kenya. J. Agric. Econ. 2019, 70, 452–470. [Google Scholar] [CrossRef]
  40. Ahuja, D.B.; Ahuja, U.R.; Singh, S.K.; Singh, N. Comparison of integrated pest management approaches and conventional (non-IPM) practices in late-winter-season cauliflower in Northern India. J. Crop Prot. 2015, 78, 232–238. [Google Scholar] [CrossRef]
  41. Ahuja, D.B.; Ahuja, U.R.; Srinivas, P.; Singh, R.V.; Malik, M.; Sharma, P.; Bamawale, O.M. Development of farmer-led integrated management of major pests of cauliflower cultivated in rainy season in India. J. Agric. Sci. 2012, 4, 79. [Google Scholar] [CrossRef]
  42. Leake, A.R. Integrated pest management for conservation agriculture. In Conservation Agriculture; Springer: Dordrecht, The Netherlands, 2003; pp. 271–279. [Google Scholar]
  43. Fanadzo, M.; Dalicuba, M.; Dube, E. Application of conservation agriculture principles for the management of field crops pests. In Sustainable Agriculture Reviews; Springer: Cham, Germany, 2018; pp. 125–152. [Google Scholar]
  44. Scaccini, D.; Panini, M.; Chiesa, O.; Nicoli, A.R.; Tabaglio, V.; Mazzoni, E. Slug monitoring and impacts on the ground beetle community in the frame of sustainable pest control in conventional and conservation agroecosystems. Insects 2020, 11, 380. [Google Scholar] [CrossRef] [PubMed]
  45. War, A.R.; Paulraj, M.G.; Ahmad, T.; Buhroo, A.A.; Hussain, B.; Ignacimuthu, S.; Sharma, H.C. Mechanisms of plant defense against insect herbivores. Plant Signal Behav. 2012, 7, 1306–1320. [Google Scholar] [CrossRef] [Green Version]
  46. Mur, L.A.; Simpson, C.; Kumari, A.; Gupta, A.K.; Gupta, K.J. Moving nitrogen to the centre of plant defence against pathogens. Ann. Bot. 2017, 119, 703–709. [Google Scholar] [CrossRef] [Green Version]
  47. Picanço, M.C.; Bacci, L.; Crespo, A.L.B.; Miranda, M.M.M.; Martins, J.C. Effect of integrated pest management practices on tomato production and conservation of natural enemies. Agric. For. Entomol. 2007, 9, 327–335. [Google Scholar] [CrossRef]
  48. Cuyno, L.C.; Norton, G.W.; Rola, A. Economic analysis of environmental benefits of integrated pest management: A Philippine case study. Agric. Econ. 2001, 25, 227–233. [Google Scholar] [CrossRef]
  49. Mancini, F.; Jiggins, J.L.; O’Malley, M. Reducing the incidence of acute pesticide poisoning by educating farmers on integrated pest management in South India. Int. J. Occup. Environ. Health 2009, 15, 143–151. [Google Scholar] [CrossRef]
  50. Shrestha, P.; Koirala, P.; Tamrakar, A.S. Knowledge, practice and use of pesticides among commercial vegetable growers of Dhading district, Nepal. J. Food Agric. Environ. 2010, 11, 95–100. [Google Scholar] [CrossRef]
  51. Nichols, V.; Verhulst, N.; Cox, R.; Govaerts, B. Weed dynamics and conservation agriculture principles: A review. Field Crops Res. 2015, 183, 56–68. [Google Scholar] [CrossRef] [Green Version]
  52. White, D.S.; Labarta, R.A.; Leguía, E.J. Technology adoption by resource-poor farmers: Considering the implications of peak-season labor costs. Agric. Syst. 2005, 85, 183–201. [Google Scholar] [CrossRef]
  53. Moser, C.M.; Barrett, C.B. The complex dynamics of smallholder technology adoption: The case of SRI in Madagascar. Agric. Econ. 2006, 35, 373–388. [Google Scholar] [CrossRef]
  54. Tuladhar, R.; Sapkota, C.; Adhikari, N. Effects of migration and remittance income on Nepal’s agriculture yield. In Asian Development Bank South Asia Working Paper Series; Asian Development Bank: Manila, Philippines, 2014; pp. 1–17. [Google Scholar]
  55. Rosenzweig, C.; Iglesius, A.; Yang, X.B.; Epstein, P.R.; Chivian, E. Climate change and extreme weather events—Implications for food production, plant diseases, and pests. NASA Publ. 2001, 2, 90–104. [Google Scholar]
  56. Aggarwal, P.K.; Kalra, N.; Chander, S.; Pathak, H. A dynamic simulation model for the assessment of crop yields, losses due to pests, and environmental impact of agro-ecosystems in tropical environments. I. Model description. Agric. Syst. 2006, 89, 1–25. [Google Scholar] [CrossRef]
  57. World Weather Online. Available online: http://www.worldweatheronline.com/ (accessed on 21 June 2020).
Figure 1. Map showing investigated areas of on-farm experiments in Nepal.
Sustainability 12 06418 g001
Figure 2. Differences in vegetable crop yields in T1 (improved alternative system; solid bars) vs. T2 (conventional system; open bars) (A) Average yield (kg/ha) for five vegetable crops: tomato, cabbage, cauliflower, bitter gourd, and cucumber in T1 vs. T2. Bars are mean ± standard errors, and means with *, **, ***, are statistically different at probability values of p ≤ 0.05, ≤ 0.01, and ≤ 0.001, respectively. Differences are between “T1” and “T2” within each crop species. (B) Yield differences in tomatoes segregated by four regions: Banke, Dadeldhura, Lalitpur, and Surkhet. Bars are mean ± SEM with significant treatment and region interactions. (C) Yield differences in cucumbers segregated by four regions: Banke, Dadeldhura, Lalitpur, and Surkhet. Bars are mean ± SEM with significant treatment and region interactions.
Sustainability 12 06418 g002
Figure 3. Average benefit–cost ratios (B:C ratio) for five vegetable crops: tomato, cabbage, cauliflower, bitter gourd, and cucumber in T1 (improved alternative system; solid bars) vs. T2 (conventional system; open bars). Bars are mean ± standard errors, and means with *, **, are statistically different at probability values of p ≤ 0.05, ≤ 0.01, and ≤ 0.001, respectively. Differences are between “T1” and “T2” within each crop species.
Sustainability 12 06418 g003
Figure 4. Differences in labor requirement for vegetable crops in T1 (improved alternative system; solid bars) vs. T2 (conventional system; open bars) (A) Average hours of labor/season to manage five vegetable crops: tomato, cabbage, cauliflower, bitter gourd, and cucumber in T1 (improved alternative system; solid bars) vs. T2 (conventional system; open bars). Bars are mean ± standard errors, and means with *, ** are statistically different at probability values of p ≤ 0.05 and ≤ 0.01 respectively. Differences are between “T1” and “T2” within each crop species. (B) Average hours of labor/season in tomatoes segregated by four regions: Banke, Dadeldhura, Lalitpur, and Surkhet. Bars are mean ± SEM with significant treatment and region interactions. (C) Average hours of labor/season in bitter gourds segregated by four regions: Banke, Dadeldhura, Lalitpur, and Surkhet. Bars are mean ± SEM with significant treatment and region interactions.
Sustainability 12 06418 g004aSustainability 12 06418 g004b
Figure 5. Average chemical pesticide spray/season on five vegetable crops: tomato, cabbage, cauliflower, bitter gourd, and cucumber in T1 (improved alternative system; solid bars) vs. T2 (conventional system; open bars). Bars are mean ± standard errors and means with * are statistically different at probability values of p ≤ 0.05, respectively. Differences are between “T1” and “T2” within each crop species.
Sustainability 12 06418 g005
Figure 6. Differences in disease infestation in vegetable crops in T1 (improved alternative system; solid bars) vs. T2 (conventional system; open bars) (A) Percentage of disease infestation on leaves of five vegetable crops: tomato, cabbage, cauliflower, bitter gourd, and cucumber in T1 (improved alternative system; solid bars) vs. T2 (conventional system; open bars). Bars are mean ± standard errors, and means with *, ** are statistically different at probability values of p ≤ 0.05 and ≤ 0.01, respectively. Differences are between “T1” and “T2” within each crop species. (B) Percentage of disease infestation on tomato leaves segregated by four regions: Banke, Dadeldhura, Lalitpur, and Surkhet. Bars are mean ± SEM with significant treatment and region interactions. (C) Percentage of disease infestation on bitter gourd leaves segregated by four regions: Banke, Dadeldhura, Lalitpur, and Surkhet. Bars are mean ± SEM with significant treatment and region interactions.
Sustainability 12 06418 g006aSustainability 12 06418 g006b
Figure 7. Percentage of herbivory damage on leaves of five vegetable crops: tomato, cabbage, cauliflower, bitter gourd, and cucumber in T1 (improved alternative system; solid bars) vs. T2 (conventional system; open bars). Bars are mean ± standard errors, and means with *, **, ***, are statistically different at probability values of p ≤ 0.05 and ≤ 0.01 respectively. Data were arcsine square root transformed before analysis. Differences are between “T1” and “T2” within each crop species.
Sustainability 12 06418 g007
Table 1. Physical characteristics of the investigated sites including elevation, average temperature and rainfall, soil characteristics, and cropping pattern for previous years.
LocationElevation (m)Avg. Annual Temp. (°C)Avg. Annual Rainfall (mm)Soil CharacteristicsCropping Pattern (Previous Years)
TexturepH
Lalitpur179618.101505Sandy loamSlightly alkaline (7.35 to 7.45)Tomato-Cole crops-Chilly/Cole crops/leafy vegetables
Banke16927.001312Clayey loamNeutral to slightly alkaline (7.00 to 7.40)Tomato-Cole crops-Cucurbits
Surkhet94324.50765Sandy loamNeutral to slightly alkaline (7.00 to 7.40)Tomato-Cole crops/Wheat-Cucurbits/Leafy vegetables
Dadeldhura153316.101399Silty claySlightyl alkaline (7.35 to 7.45)Tomato-Maize-Fallow
Table 2. Common crop management practices used for both the improved alternative system (T1) and conventional farmers’ practice (T2). Organic manure was prepared locally using farm wastes and crop residues.
CropPlanting DatesSpacing (Rows × Plants)Nutrient Application (Chemical Fertilizers)Organic Manure
TomatoApril–May75 × 60 cmUrea, Diammonium phosphate (DAP) and Murate of potash (MOP) at the rate of (@) 200:140:140 kg/ha; 50% of Urea and 100% of DAP and MOP before planting during land preparation; two split doses of remaining Urea after 20 days of transplanting and at the time of fruiting30,000 kg/ha
CabbageAugust–September50 × 45 cmUrea, DAP and MOP @ 100:140:100 kg/ha; 50% of Urea and 100% of DAP and MOP before planting during land preparation; two split doses of remaining Urea after 25 and 50 days of transplanting25,000 kg/ha
CauliflowerAugust–September60 × 45 cmUrea, DAP and MOP @ 100:140:100 kg/ha; 50% of Urea and 100% of DAP and MOP before planting during land preparation; two split doses of remaining Urea after 25 and 50 days of transplanting25,000 kg/ha
CucumberMarch–April1 × 1.2 mUrea, DAP and MOP @ 100:100:100 kg/ha; 50% of Urea and 100% of DAP and MOP before planting during land preparation; two split doses of remaining Urea after 20 and 50 days of transplanting20,000 kg/ha
Bitter gourdMarch–April1.5 × 1 mUrea, DAP and MOP @ 60:100:80 kg/ha; 50% of Urea and 100% of DAP and MOP before planting during land preparation; two split doses of remaining Urea after 20 and 50 days of transplanting20,000 kg/ha
Table 3. Analysis of variance (ANOVA) table for “yield”; values with asterisk *, **, ***, are statistically different at probability values of p ≤ 0.05, ≤ 0.01 and ≤ 0.001, respectively.
CropTreatmentRegionTreatment × Region
Tomato0.03 *0.080.02 *
Cabbage0.01 **0.050.52
Cauliflower0.001 ***0.140.78
Bitter gourd0.01 *0.090.11
Cucumber0.05 *0.04*0.001 ***
Table 4. Analysis of variance (ANOVA) table for “benefit—cost ratio (B:C)”; values with *, **, are statistically different at probability values of p ≤ 0.05, ≤ 0.01, and ≤ 0.001, respectively.
CropTreatmentRegionTreatment × Region
Tomato0.00 **0.050.54
Cabbage0.150.170.26
Cauliflower0.370.720.28
Bitter gourd0.00 **0.370.46
Cucumber0.04 *0.500.20
Table 5. Analysis of variance (ANOVA) for “labor”; values with asterisk *, ** are statistically different at probability values of p ≤ 0.05, ≤ 0.01, and ≤ 0.001, respectively.
CropTreatmentRegionTreatment × Region
Tomato0.03 *0.110.00 **
Cabbage0.170.220.08
Cauliflower0.210.260.69
Bitter gourd0.04 *0.380.02 *
Cucumber0.00 **0.460.42
Table 6. Analysis of variance (ANOVA) table for “spray frequency”; values with *, are statistically different at probability values of p ≤ 0.05, ≤ 0.01, and ≤ 0.001, respectively.
CropTreatmentRegionTreatment × Region
Tomato0.00 *0.750.78
Cabbage0.00 *0.710.53
Cauliflower0.02 *0.280.45
Bitter gourd0.00 *0.790.78
Cucumber0.070.960.87
Table 7. Analysis of variance (ANOVA) table summary with p-values for disease infestation; Values with *, ** are statistically different at probability values of p ≤ 0.05, ≤ 0.01, and ≤ 0.001, respectively.
CropTreatmentRegionTreatment × Region
Tomato0.100.500.04 *
Cabbage0.03 *0.820.13
Cauliflower0.00 **0.840.87
Bitter gourd0.03 *0.410.02 *
Cucumber0.01*0.120.70
Table 8. Analysis of variance (ANOVA) table summary with p-values for herbivory damage; Values with *, ** are statistically different at probability values of p ≤ 0.05, ≤ 0.01, and ≤ 0.001, respectively.
CropTreatmentRegionTreatment × Region
Tomato0.140.120.88
Cabbage0.300.760.25
Cauliflower0.05 *0.800.10
Bitter gourd0.080.280.39
Cucumber0.02 **0.400.39