2. Methodology
The study in Burundi consisted of VAs at two spatial scales. They were implemented sequentially: First, the national-level assessment conducted between November 2013 and May 2014 was targeted at identifying those regions in Burundi that are most vulnerable to the impacts of climate change. Second, based on the results of the national assessment, an in-depth local assessment was conducted on the level of communities between June and September 2014. The first step targeted predominantly at the identification of ‘hotspot areas’ whilst the second step aimed at achieving a contextualized understanding of the local drivers of vulnerabilities and at deriving potential adaptation measures to reduce adverse consequences of climate change at the local level.
The applied methodology for the vulnerability assessment at the national scale followed the modular approach of the ‘Vulnerability Sourcebook’, which was developed based on previous research on climate change vulnerabilities in the Alps [
13,
25,
35]. This assessment approach has been applied successfully as a conceptual framework in various contexts and countries [
36,
37,
38]. It is based on the understanding of climate change vulnerability as proposed by the Fourth Assessment Report (AR4) of the IPCC [
9] (see
Section 1 and
Section 2.2) and is strictly oriented towards information and knowledge generation as a basis for adaptation planning decisions.
The ‘Vulnerability Sourcebook’ approach represents an operational framework to assess vulnerability following a structure that is provided by context-specific impact chains and respective indicators. It allows for a certain degree of flexibility concerning the depth or intensity of the analysis and in the selection of tools to be exploited for the assessment results according to the availability of data, technical capacities as well as financial and time resources. That is, it permits the integration of data stemming from various methodological approaches and sources such as measurements, models, surveys and expert interviews as well as participatory appraisals. At the same time, this approach calls for transparency towards those who might be influenced or affected by the study results and it demands continuous stakeholder engagement throughout the whole assessment process.
The ‘Vulnerability Sourcebook’ proposes a modular approach composed by eight main steps during which the assessment is prepared, carried out and its results are visualized as well as presented (see
Table 1). For this study at the national level of Burundi study, all eight steps were carried out with the aim to identify vulnerability hotspots within the country.
At the local scale, an-depth analysis was carried out in three of the hotspot areas identified by the national scale analysis. The aim of the local study differs from the national scale assessment and aimed at collecting local knowledge about climate change, at identifying past extreme weather events, sensitivity and adaptive capacity indicators and most appropriate climate change adaptation measures. Therefore, at the second lowest administrative level, the so called ‘commune’, a detailed and predominantly qualitative study was conducted. Due to the difference in the envisaged outcome in combination with a severe lack of available data at this very local scale, the approach taken at this level did not follow the Vulnerability Sourcebook modules. Nevertheless, the respective activities and their results are explained here (see
Section 2.7) to underline the importance to consider local specificities, knowledge and experience for possible solutions when working at the local scale, in addition to the structured and mostly at least semi-quantitative approach of the Vulnerability Sourcebook.
The following chapters first elaborate on how we engaged stakeholders during the whole course of the study and subsequently describe the three key working step of Vulnerability Sourcebook approach for the spatially explicit assessment at the national scale, namely Step 2 “Developing Impact Chains”, Step 3 “Identifying and Selecting Indicators” and Step 8 “Presenting the Outcomes of your VA” in detail. Following, the physical modeling components of the vulnerability assessment at the national scale are shortly described, namely the climate and hydrological modeling and the modeling of erosion risk using the RUSLE (Revised Universal Soil Loss Equation, s.
Section 2.6) model. Finally, the methodology applied at the local scale in three communities is explained.
2.1. The Engagement of Stakeholders
The study implementation was supported by a number of experts and stakeholders who engaged to a various degree and in different moments throughout the course of the study. At the very beginning a core group of 12 experts was created composed by GIZ project staff as well as local technical professionals and consulting academics—all with expertise in the field of climate change impacts, vulnerability assessment and/or natural resource management as well as agriculture in Burundi. This core group was responsible for managing the work of the study, ensuring a smooth course of the implementation of the various working steps and for the final outputs. The major decisions required to be taken by this core group with respect to methodological questions were based on discussions and participatory exercises during various workshops, with a larger group of stakeholders representing scientists and practitioners with additional technical expertise in Burundi as well as policy and decision makers from Ministries and NGOs. We called this group the local expert group, which consisted of 30 persons. We carried out four workshops between November 2013 and September 2014, to which the 30 members of the local expert group were invited (see
Table 2). To the last of these four workshops, during which the results were presented, additional actors and high-level representatives from the public administration were invited. The time in-between these events were used by the core group/the project team to integrate the results in the study work and to carry out the tedious work of data acquisition and data processing.
At the local level, information about knowledge, perspectives and opinions of the rural population, mainly consisting of farmers, was acquired for three ‘communes’. This was carried out by means of qualitative methods applying the tools of key informants, focus group discussions, village workshops and transect walks. More details are given in
Section 2.7.
2.2. Vulnerability Concept and the Development of Climate Impact Chains
The conceptual backbone of the VA in Burundi is the beforementioned Vulnerability Sourcebook [
13] and climate impact chains reflecting the underlying factors and cause-effect relationships of climate change vulnerabilities. Impact chains help understanding and assessing the processes that drive vulnerability. Climate impact chains are conceptually grounded within the IPCC AR4 definition of climate vulnerability, defining vulnerability as a function of its components exposure, sensitivity and adaptive capacity [
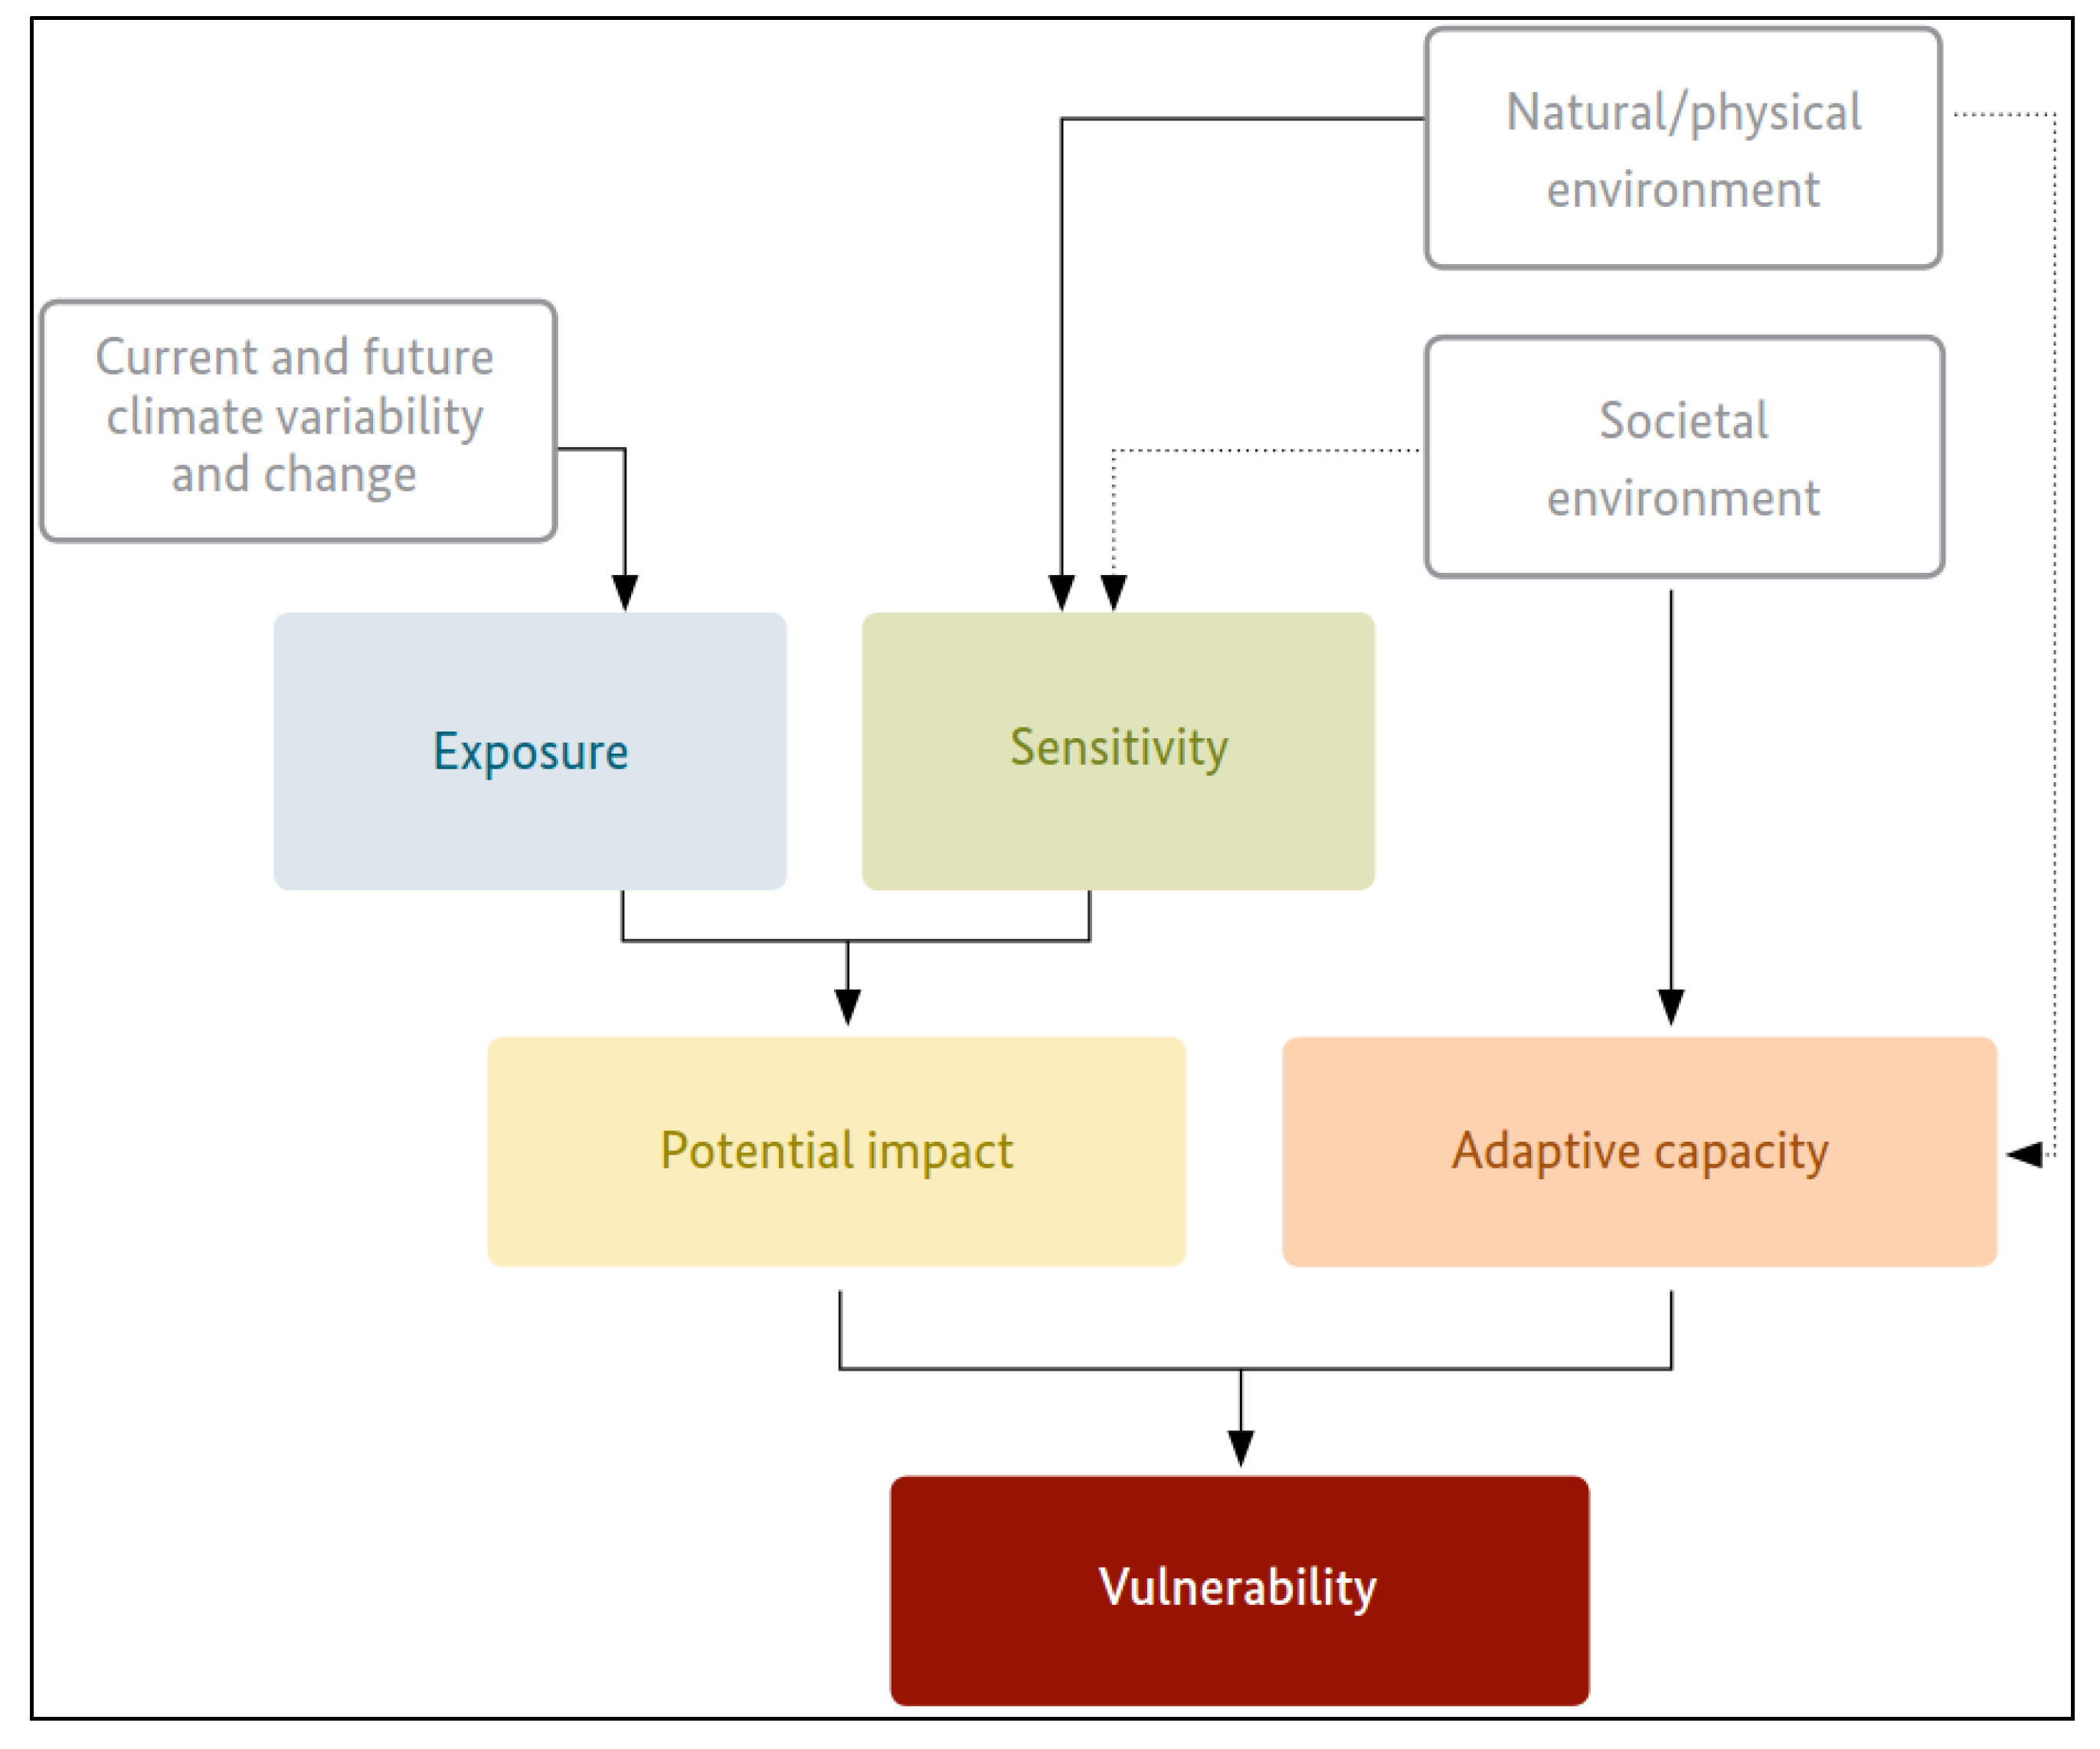
9]. We adapted this definition for a pragmatic interpretation and understand vulnerability as a function of the exposure and sensitivity of a system (indicating the potential climate impact) and lessened by its adaptive capacity. A conceptual impact chain depicting the IPCC concept is provided in
Figure 1.
Exposure represents the climate signal leading to a specific climate vulnerability. Exposure is expressed by elements of current and future climate variability and change, i.e., temperature, precipitation or extreme events and is dependent on the character, magnitude and rate of climate variation and change. The sensitivity of the system characterizes the degree to which a system would be affected by a given climate variability or change without adaptation and depends mainly on its current state of natural or physical environment, represented for example in current land use, vegetation cover, topography, agricultural systems and practices, housing properties, etc. The adaptive capacity represents the societal environment of the system with the abilities to adapt to expected climate changes and to reduce adverse effects of future harm. In general terms, it reflects the population’s resources and capacities to cope with the adverse effects of climate change.
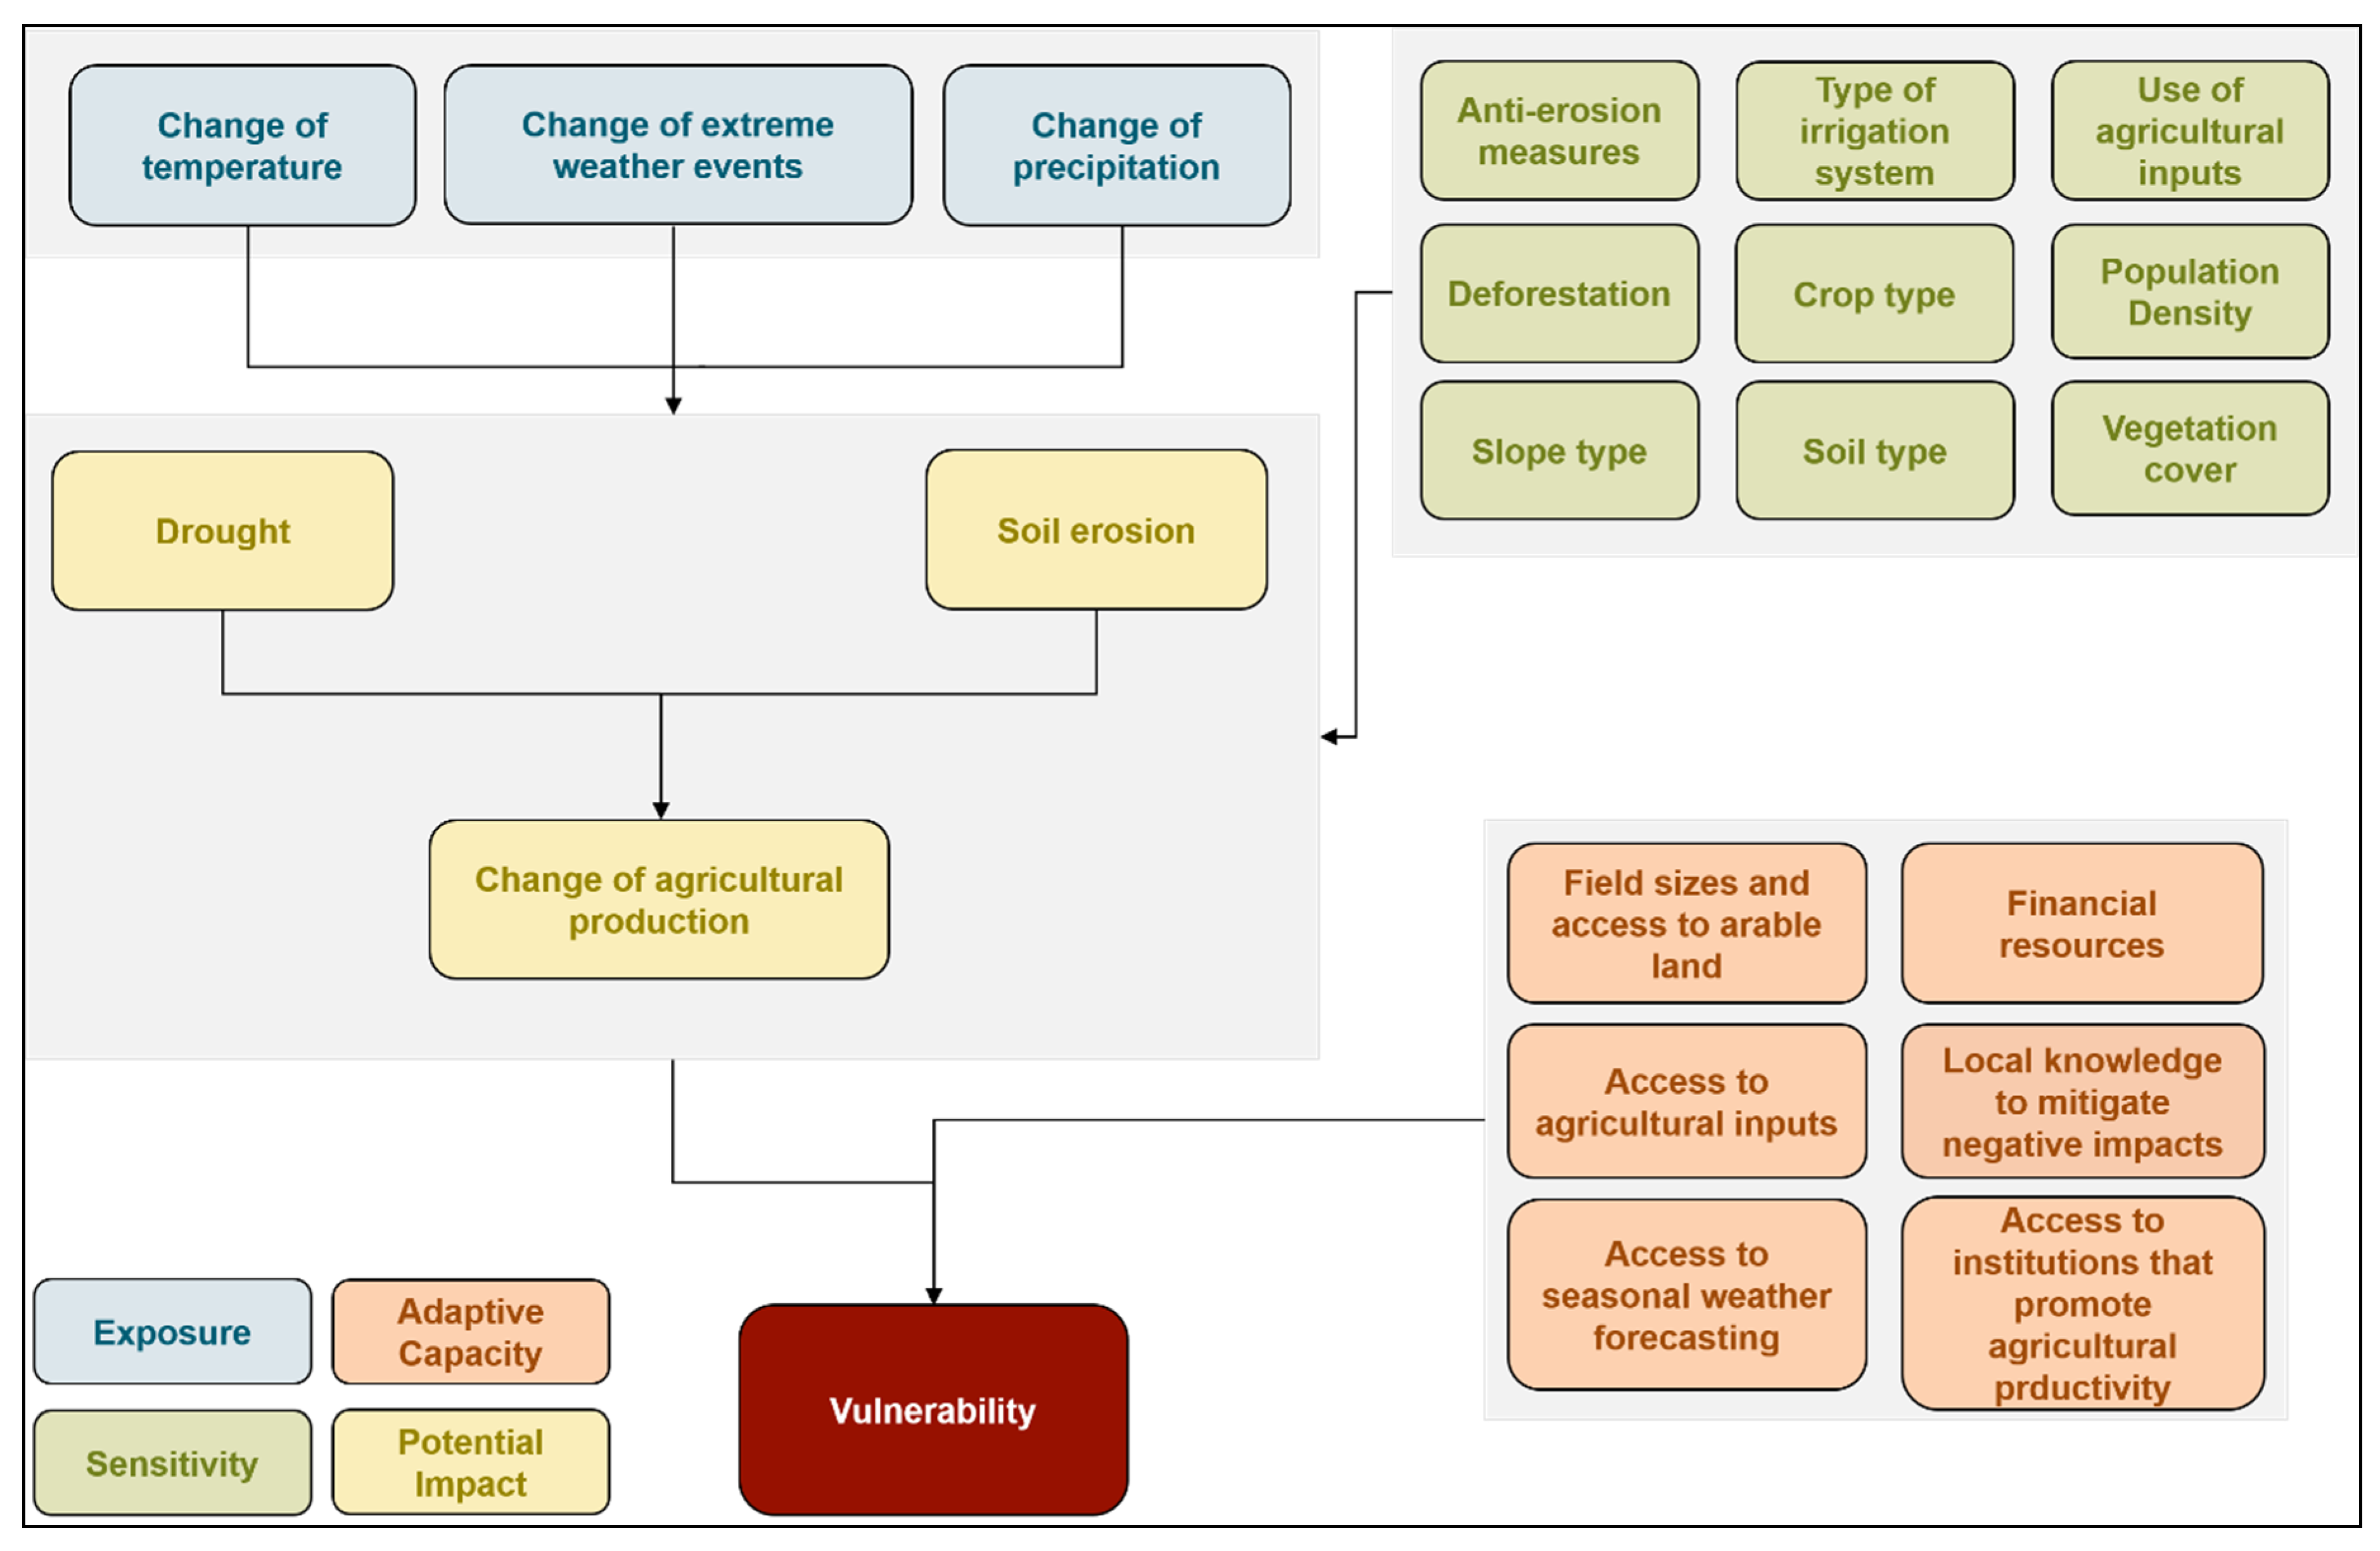
In the case of the VA in Burundi, impact chains were developed for the three potential impacts drought, soil erosion and malaria prevalence. These impacts had been selected as being most crucial during a first stakeholder workshop at which experts from public administration, NGOs and academia (from the core group and the local expert group) participated (see
Table 1). During this workshop, a brainstorming session resulted in a general overview of possible climate change related impacts in the various economic sectors in Burundi. A succeeding prioritization session identified the impacts linked to soil erosion, droughts as well as malaria prevalence as being most relevant.
Within the context of the second workshop, the contributing factors for the exposure, sensitivity and adaptive capacity components of the impact chains were elaborated on in detail. Due to the large overlap of the chains representing the factors that lead to the two former impacts drought and soil erosion, both were summarized into one common chain leading to the potential impact ‘change of agricultural production’ (see
Figure 2). The following elaborations will focus on this potential impact ‘change of agricultural production’ and the related vulnerability maps ‘soil erosion’ and ‘drought’.
2.3. Selection of Vulnerability Indicators
The developed climate impact chains together with the output of the climate and hydrological models (see
Section 2.5) served as the basis for the discussion on possible indicators to allow the assessment of the identified vulnerability factors in a quantitative or semi-quantitative way. Brainstorming, discussion and pre-selection of indicators took place at the second workshop and resulted in a list of specific possible indicators linked to potential data sources. Following this workshop, the list of indicators was further elaborated on by the core team by taking into consideration the criteria relevance, analytical soundness, timeliness, accessibility and clarity as proposed by [
39]. It turned out that data availability (in the sense of completeness, reliability and quality) represented a major limiting factor and reduced our list of possible indicators significantly. From this remaining list, those indicators were picked that best reflected the parameters identified in the impact chains. For some aspects, that process was straightforward, for example ‘Average field size per household in ha’ as an indicator to represent ‘Field sizes and access to arable land’. For other aspects, that process was less unambiguous, for example, the indicator ‘% of alphabetized women’ for the aspects ‘Local knowledge to mitigate negative impacts’ was selected after a longer discussion during which female representatives convinced the team of the particular relevance of women’s education in this local context.
The established final list of indicators is a result of a consensus following intensive discussions within the study’s core team. It covers the majority but not all vulnerability parameters of the impact chain and represents a compromise between the disadvantage of vulnerability parameters not being represented and the necessity to fulfil a substantial level of data quality. The three exposure indicators ‘amount of rainfall’, ‘amount of groundwater recharge rate’ and ‘climatic water balance’ were fed by the result of a climate and hydrological modeling work described in
Section 2.5. Additional to those climate-related indicators, the only indicator for which data of future projections were available was ‘number of inhabitants per km
2’. For the elaboration of the potential impact ‘soil erosion’, we calculated the potential amount of lost soil by applying the RUSLE model (see
Section 2.6). The RUSLE model was fed by indicators representing both exposure factors (namely ‘amount of rainfall’ and ‘climatic water balance’) as well as sensitivity factors, namely ‘slope type and length’, ‘land cover’ and ‘soil type’.
Table 3 shows details of the final list of indicators for the potential impact ‘change of agricultural production’.
Each indicator was described in a detailed indicator factsheet containing metadata information, as well as a description of the underlying indication hypothesis, the methodology, classification and constraints of the indicator. The selected indicator data were collected from a variety of national to global sources. The majority of indicators were referenced to administrative units, since most data sets were sourced from existing statistical data, such as the national Burundian census [
40], the national agricultural survey [
41] or the demographic and health survey. For those indicators for which future scenarios were available, such as the exposure indicators derived from climate modeling, as well as the population density indicator (sensitivity indicator) future projections were used.
2.4. Presentation of VA Results—Classification, Aggregation and Mapping of Indicators
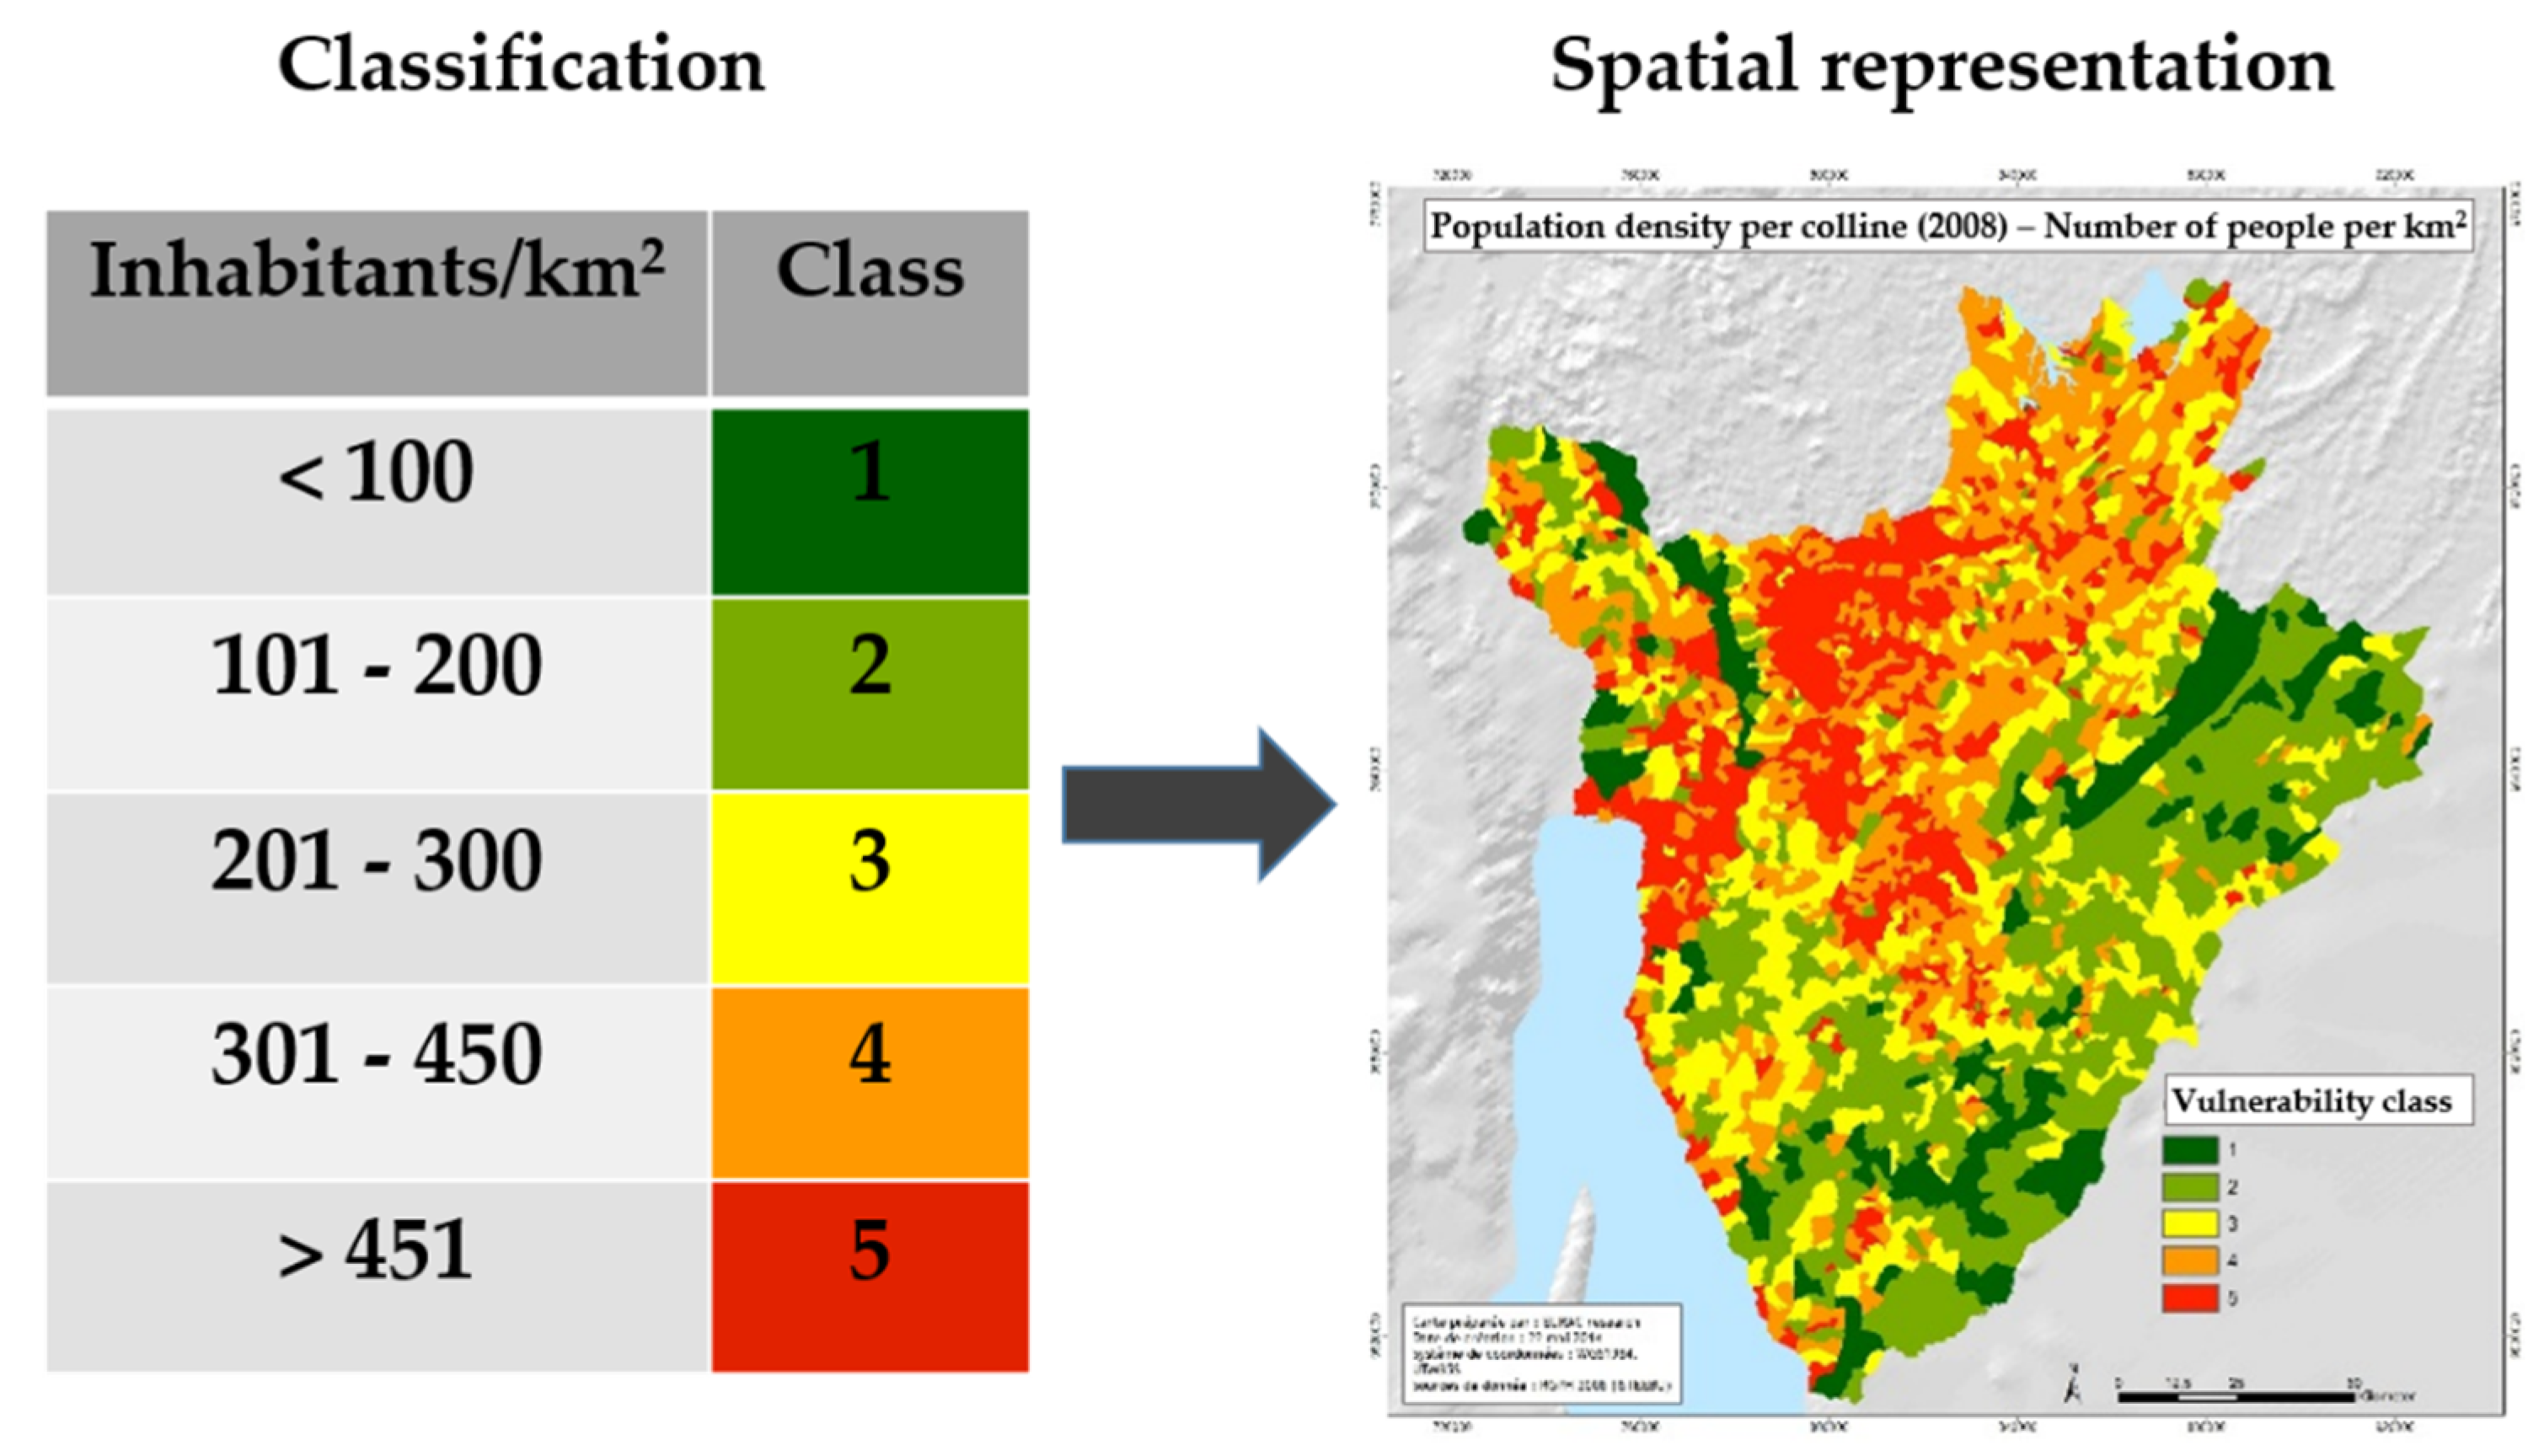
For the aggregation of the various indicators values into data that represent the vulnerability to the respective potential impact, it is necessary to transform all indicator values into a common unit-less scheme. At a technical level, this means that the values of the various indicators are normalized in order to allow for comparison and mathematical calculation to generate abstract indices. For this study we used a 5 classes approach, with each class representing a specific level of vulnerability. At a conceptual level this means to determine class borders and thresholds that allocate meaning of criticalness with respect to vulnerability to indicators values [
13]. That is, data stemming from measurements or statistics such as rainfall or population density were transformed into a specific class value by using an explicit connotation of vulnerability with respect to a certain impact.
Figure 3 shows the exemplary transformation of the values of the indicator ‘number of population/km
2’ into 5 classes and the respective results mapped at the national scale.
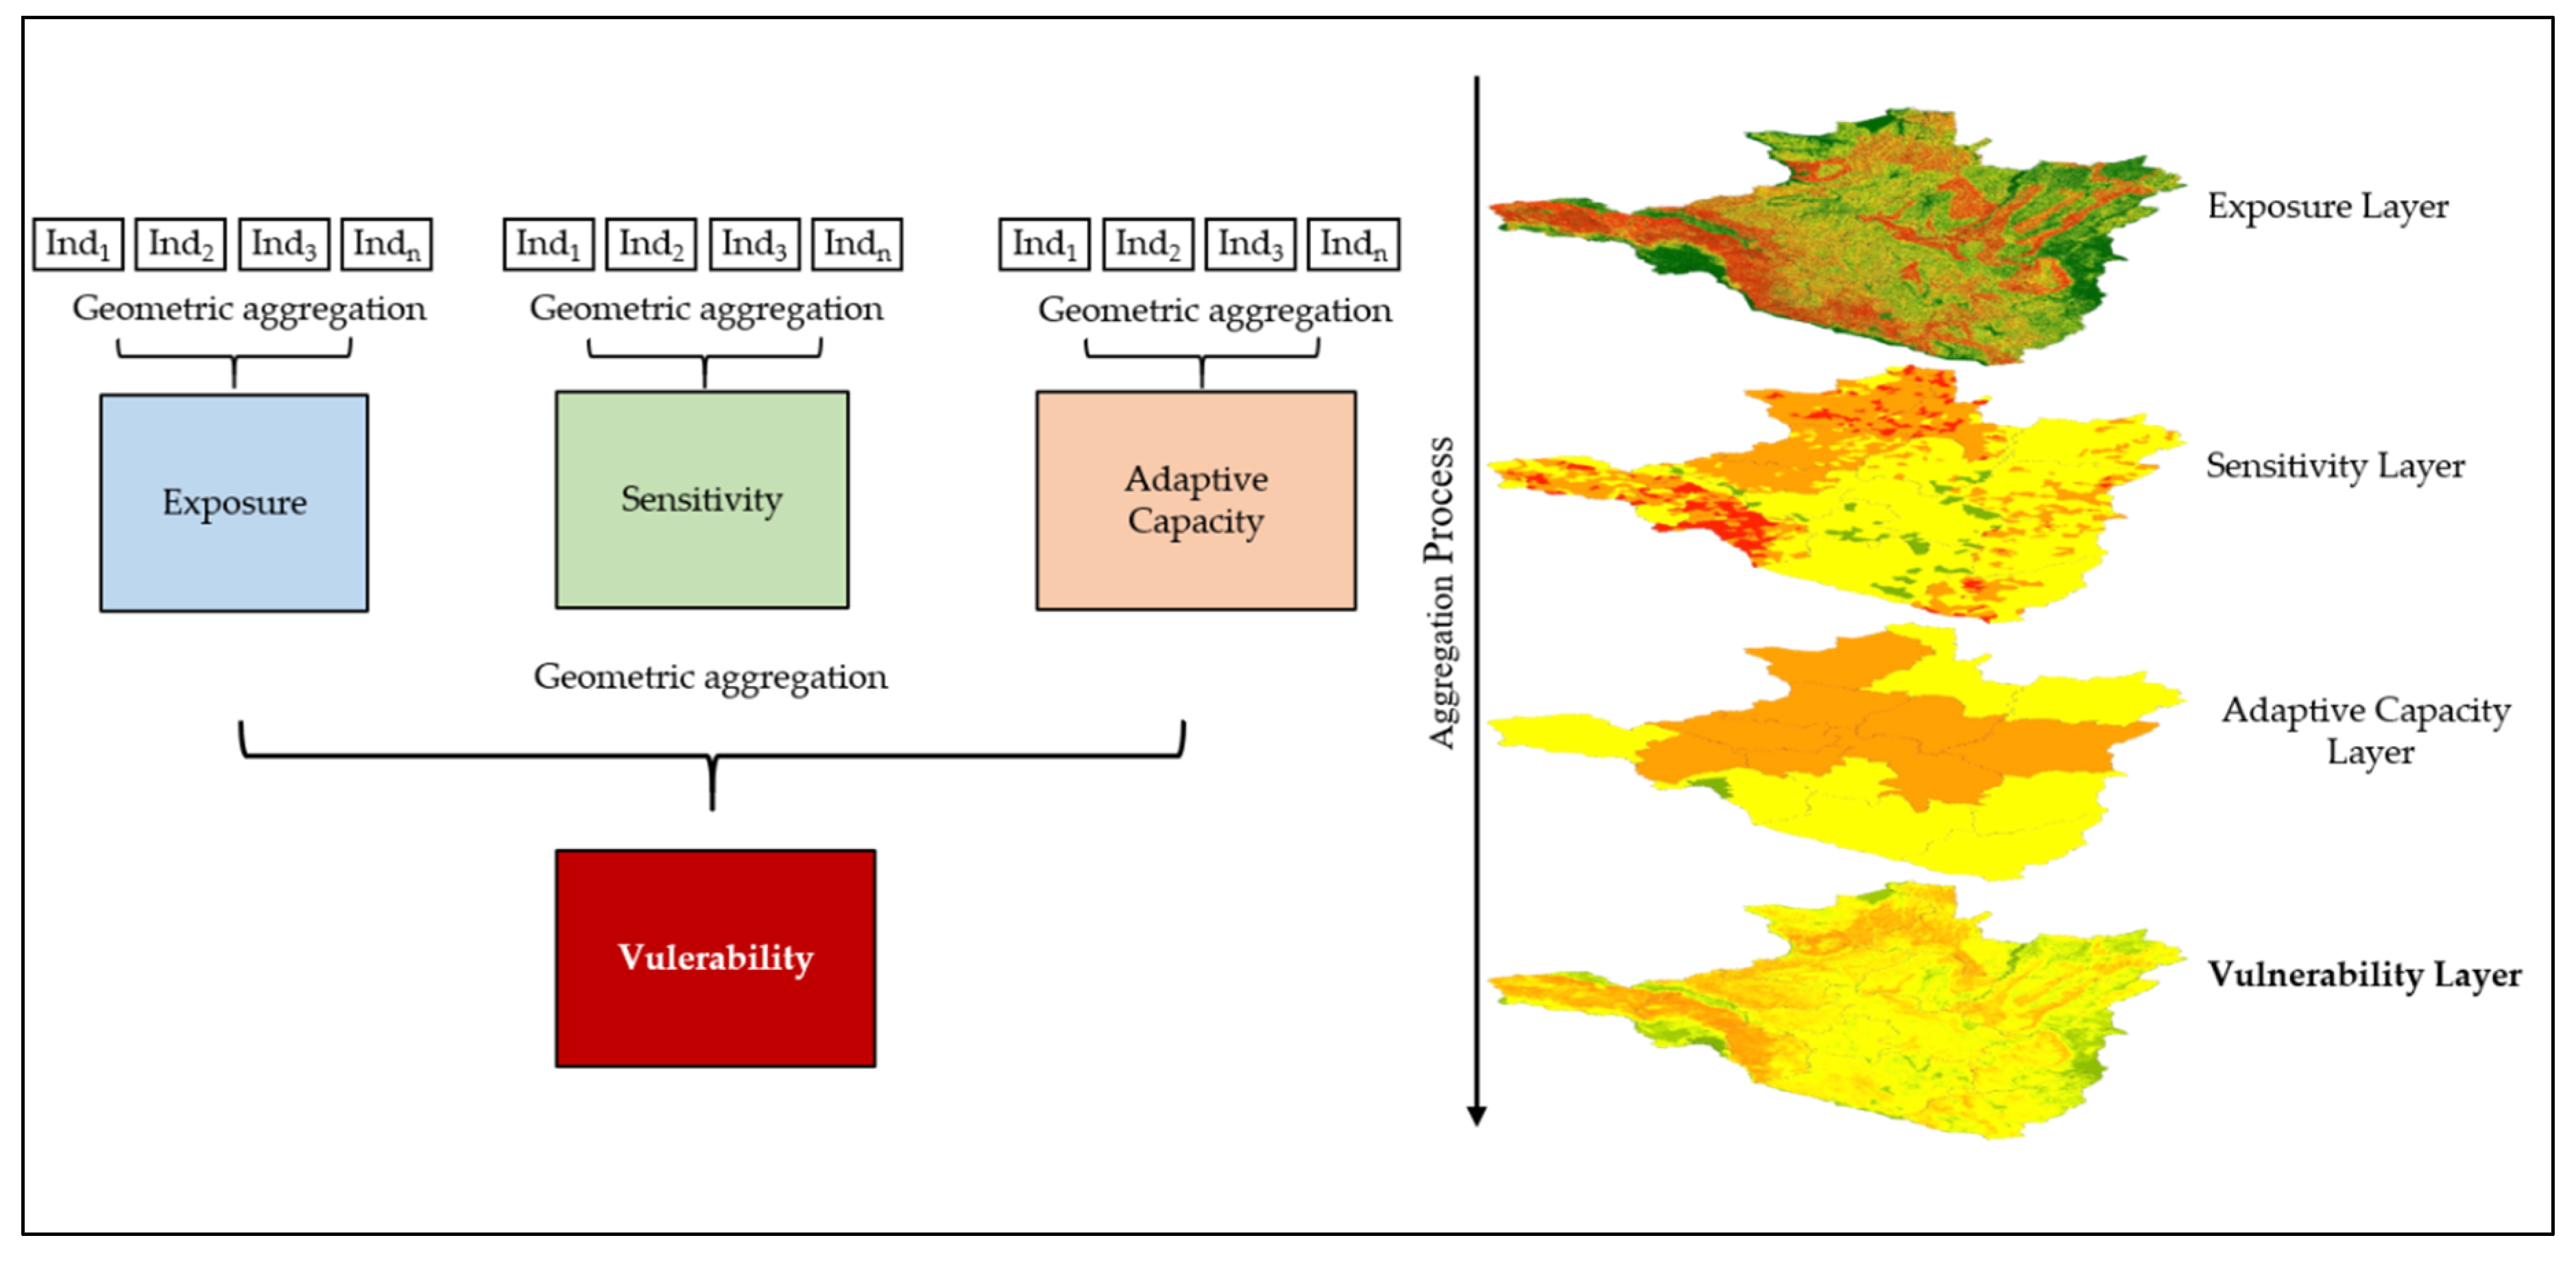
Classes and respective threshold values were prepared for all indicators in participative processes during workshop two and workshop three together with the local expert group and subsequently finalized within the core team. Following this classification step, the classified indicator values were aggregated in order to create vulnerability indices. We chose the geometric aggregation method and equal weights in order to ensure an adequate representation of all contributing factors [
39].
For the spatial representation of the vulnerability and its underlying components, we processed all data sets in such a way that they were compatible (raster format, aligned grid, resolution and coordinate system) and of sufficient quality (acceptable amount of data gaps and quality of the data set). Prior to spatial aggregating, all indicator data sets were converted in a raster format and resampled to a cell size of 100 m. The geometric aggregation of the resulting pixels was conducted in two steps: 1. Aggregation of the indicators within each of the three vulnerability components, i.e., exposure, sensitivity or adaptive capacity; 2. Aggregation of the three vulnerability components to the overall vulnerability. For both aggregation steps, we applied an equal weight to all indicators, since no evidence for choosing a weaker or stronger representation of indicators was available. For the second aggregation step, we used the original values of the components ‘exposure’ and ‘sensitivity’ and aggregated them with the reversed value of the ‘adaptive capacity’ component, since a higher adaptive capacity reduces vulnerability (in contrast to exposure and sensitivity where high values result in high vulnerability).
The final aggregation result was a raster data set with vulnerability classes ranging between one and five for each potential impact and for each of the three time periods under consideration.
Figure 4 visualizes the aggregation scheme that was carried out for each potential impact.
2.5. Climate and Hydrological Modeling
The estimation on climate change until 2100 was generated based on an ensemble of nine different regional climate model (RCM) realizations from the Coordinated Regional Downscaling Experiment (CORDEX Africa). The climate simulations were based on a combination of three RCMs and seven Global Circulation Models (GCMs). Two RCMs (DMI-HIRHAM5 and KNMI-RACMO22T) were driven by the GCM ICHEC-EC-EARTH and one RCM (SMHI-RCA4) by seven GCMs (CCCma-CanRCM4, CNRM-CERFACS-CNRM-CM5, EC-EARTH, GFDL-ESM2M, MIROC-MIROC5, MPI-ESM-LR, NorESM1-M). All impact assessments were based on the multi-model mean of all 9 GCM/RCM combinations. The spatial resolution was 0.44°, which corresponds to approximately 50 × 50 km at the equator. Given this resolution, the whole of Burundi was covered by 4 × 5 grid cells.
To account for a range of future projections, we used the following two radiative forcing scenarios: Representative Concentration Pathway (RCP) 4.5 as the medium stabilization scenario and RCP 8.5 representing a high emissions scenario [
42]. Climate change in terms of temperature and precipitation development and its impacts on hydrology was assessed for two future periods (2031–2060 and 2071–2100) relative to the reference period 1970–1999. The absolute and relative changes reported hereafter are based on the ensemble mean between the future and reference period.
The semi-distributed, eco-hydrological model SWIM (Soil and Water Integrated Model), developed by [
43], was used to assess the impacts of RCM climate projections on river discharge, surface runoff, evapotranspiration, soil water index and groundwater recharge in the three major river basins covering Burundi (Kagera, Malagarasi, and the tributaries to Lake Tanganyika). These variables served as input to the vulnerability assessment.
We found that set of CORDEX models used for this study were able to represent higher average annual rainfall amounts in the north of Burundi but could not capture the lower rainfall in the Lake Tanganyika region. Despite these limitations, the models are good at representing seasonal patterns in the east and west of the country, as it was proved in other studies where it has been shown that CORDEX represent the characteristics of rainfall patterns at different scales over East Africa as well as the influence of the large-scale climate circulation patterns on regional rainfall [
44,
45].
2.6. Erosion Modeling Based on the Model RUSLE Model
Soil erosion is known as one of the major soil degradation processes, significantly affecting soil use and productivity. Accelerated soil erosion may well determine a net loss of yield and profit, especially in thin tropical soils, where the topsoil is typically the layer conveying most or even all of the fertility [
46]. Hence, we decided to quantitatively assess potential soil loss and selected the well-established RUSLE model due to its robustness and ability to deal with limited available datasets.
The Revised Universal Soil Loss Equation (RUSLE) model is an empirical model for assessing superficial (rill and interrill) soil erosion by water (rain and runoff) and quantifying the loss of material from the upper horizons of terrain. RUSLE is based on the original Universal Soil Loss Equation (RUSLE) by Wischmeier and Smith, published in 1978 in the United States Department of Agriculture Handbook No. 537) [
47]. Subsequently, it was improved by integrating additional factors of relevance for the determination of soil erosion such as isoerodent maps, a time-varying approach for soil erodibility factor, a subfactor approach for evaluating the cover-management factor; a new equation to reflect slope length and steepness as well as new conservation-practice values. A new Agriculture Handbook (No. 703) which describes RUSLE in great detail was published in 1997 by the U.S. Department of Agriculture [
48]. The model is well established in the scientific community because it provides for a multitude of application possibilities in different domains, at various scales and in diverse geographical regions.
The RUSLE equation is composed of five major factors, synthetically representing the physics underlying the model. The main agents involved are briefly:
rain and superficial runoff serve as active agents in erosion, and have an erosivity related to their kinetic energy
soil characteristics (such as the content of organic matter) provide an inherent resistance factor to erosivity, hereby referred to as erodibility
the geometric factor, given by the local topography: slope length and declivity.
As in any empirical model, RUSLE utilizes rather simplified numeric relations between variables, yet was strongly verified through a large number of observations in tests and does not elaborate on the real-world physical interaction between the factors (e.g., how the slope affects the speed of runoff flow).
Each factor is the numerical approximation of a specific condition that determines the severity of soil erosion at a particular location. The erosion values reflected by these factors can vary considerably due to varying weather conditions. Consequently, RUSLE model results are representing real world values best when they are used to estimate long-term averages.
For the VA in Burundi, soil erosion risk modeling was developed at the national level for the three periods 2014, 2031–2060 and 2071–2100, and for the two RCPs scenarios 4.5 and 8.5. The equation on which the RUSLE model is built, and which was used for this study can be expressed by the equation:
The following list explains the factors and names the data sources used within this study:
A—the potential long-term average annual soil loss in tons per hectare (t ha-1 y-1)
R—a rainfall and runoff erosivity factor by geographic location (data source: the output of the study’s climate modeling, date of data generation 2014) (MJ mm h-1 ha-1 y-1)
K—the soil erodibility factor as a measure of the susceptibility of soil particles to detachment and transport by rainfall and runoff ([
49]) (t ha h ha-1 MJ-1 mm-1)
LS—is the slope length-gradient factor (Digital Terrain Model, Bureau de Centralisation Géomatique, Burundi, 2012) (adimensional)
C—the crop/vegetation and management factor (AfriCover, FAO, 1999/2002) (estimated, adimensional)
P—is the support practice factor reflecting measures that were taken to reduce erosion (also, protection factor; estimated, adimensional).
The factor “P” could not be taken into account due to a lack of required data.
2.7. Semi-Structured Interview, Focus Group Discussions and Village Workshops at Local Level
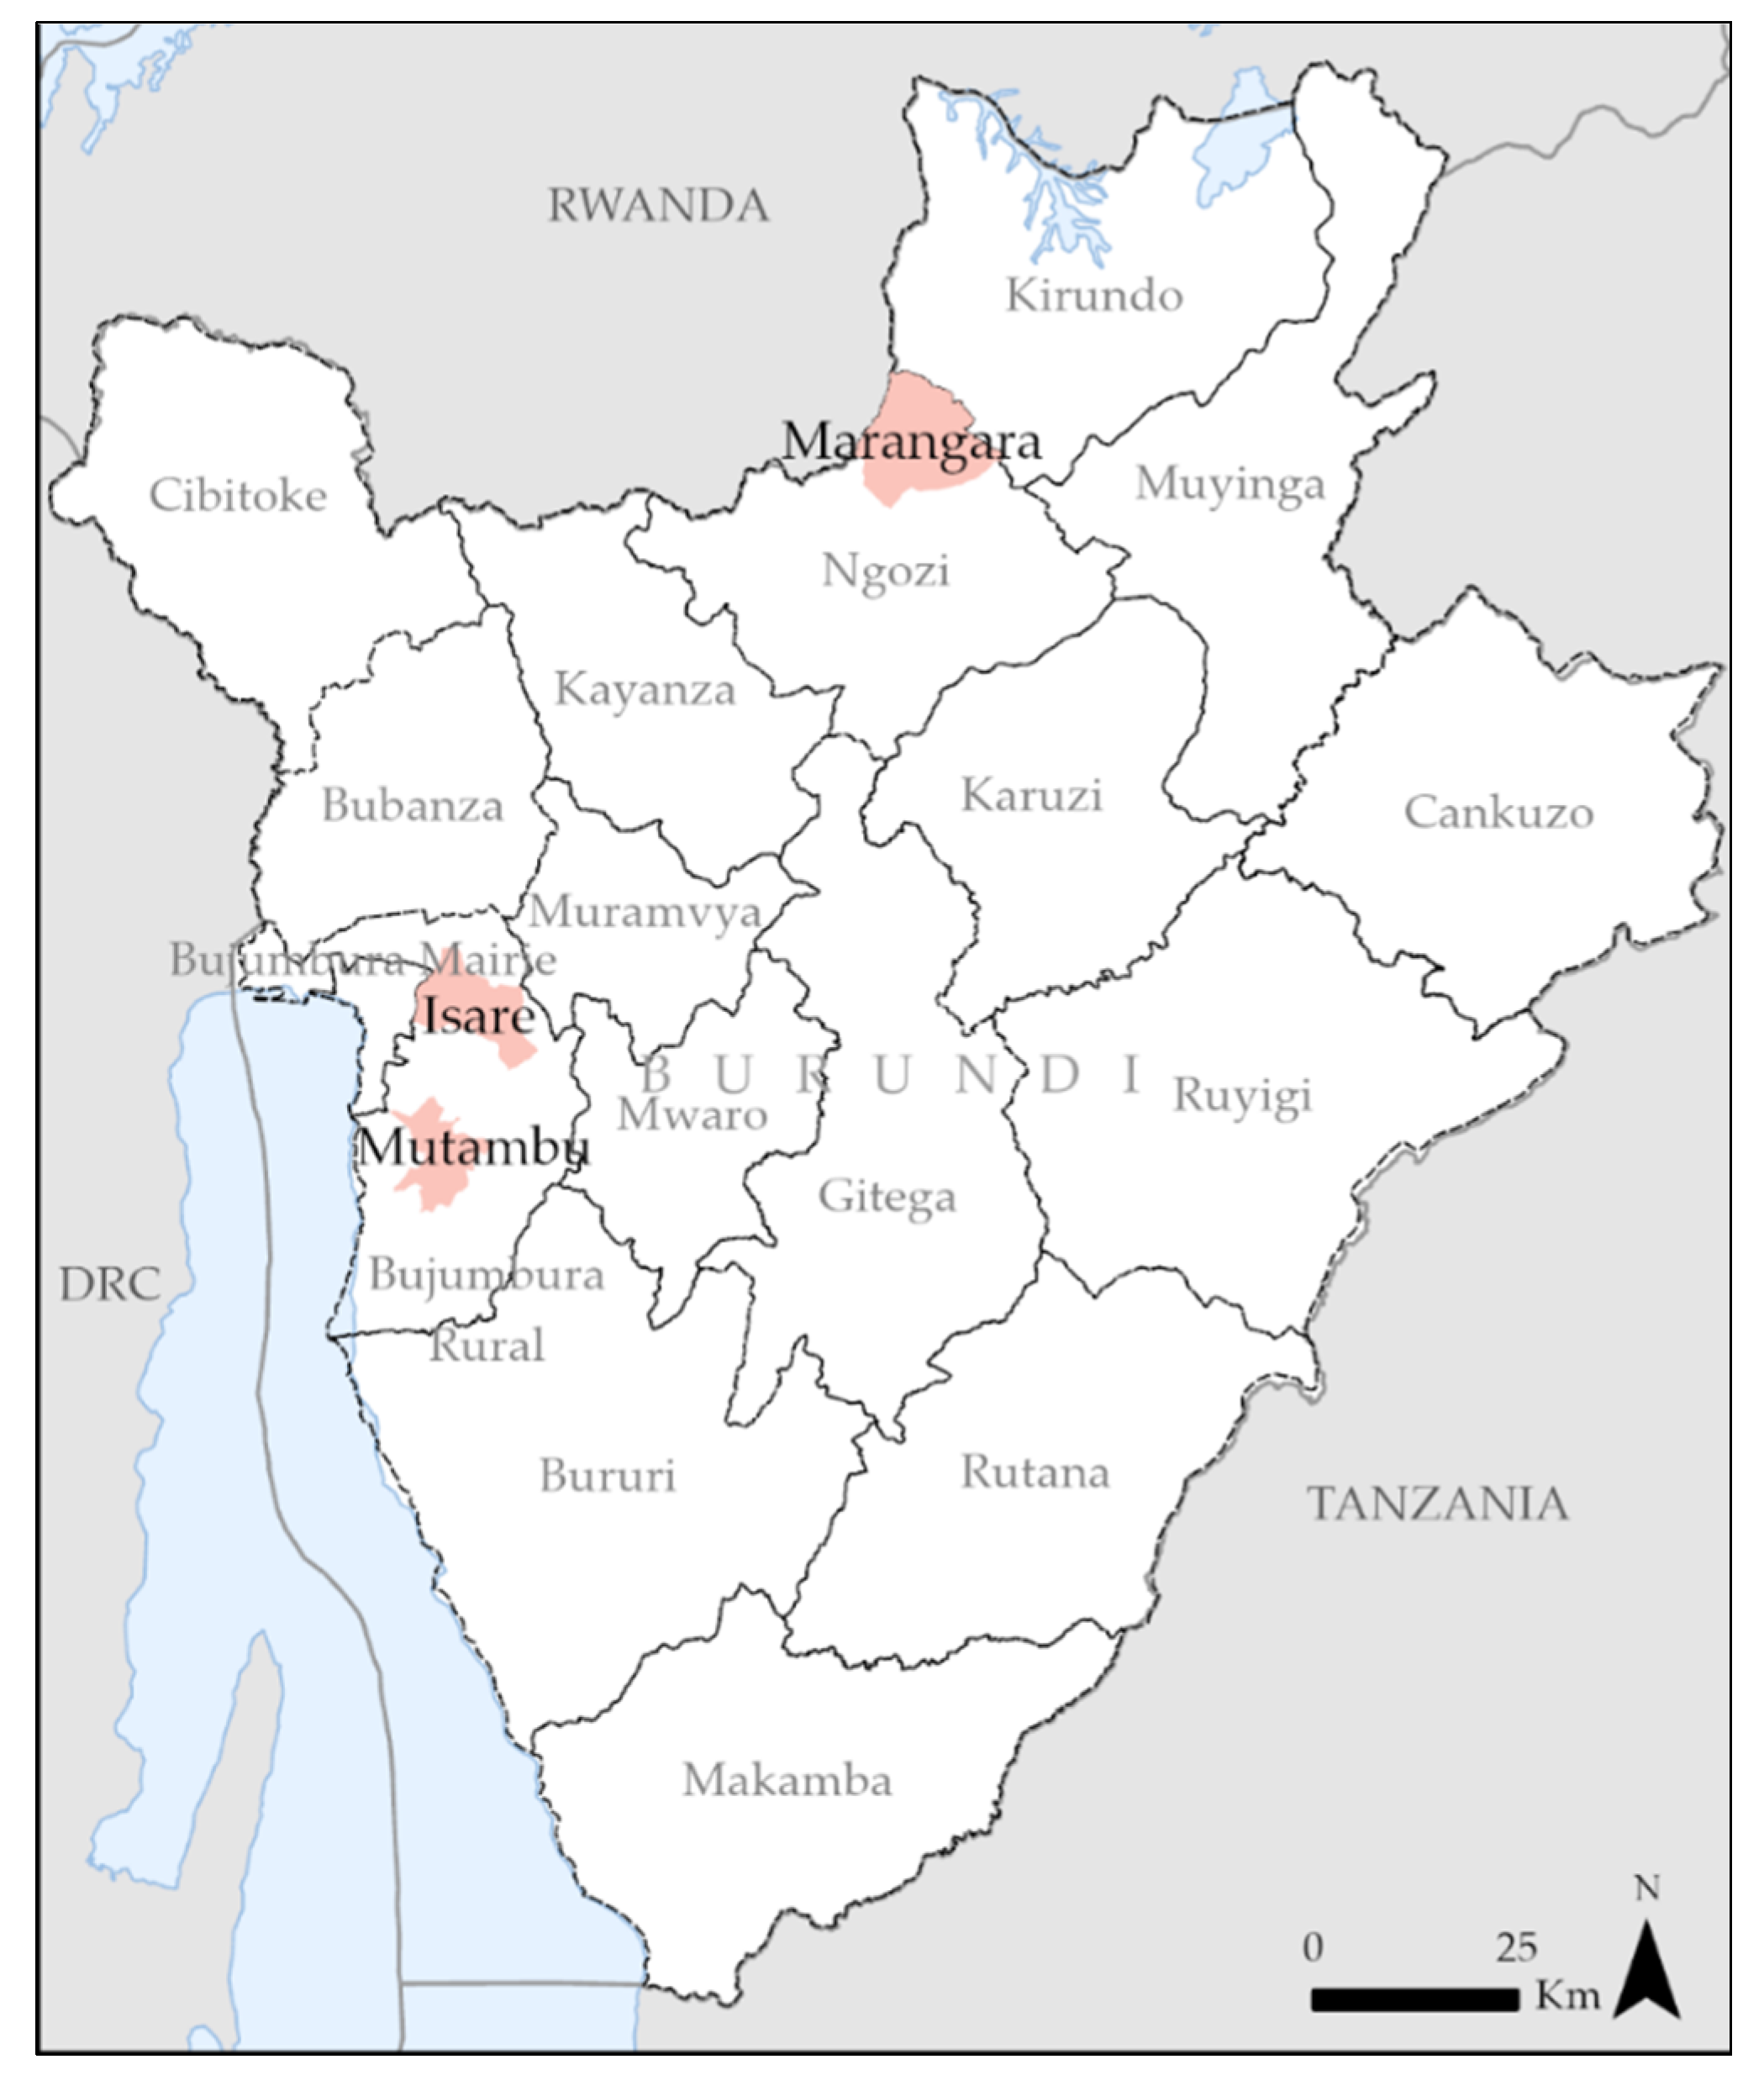
Based on the results of the VA at the national level and taking into consideration additional selection criteria, namely the absence of other development cooperation projects, security concerns and the idea to cover different regional areas within the country, three small catchment areas were selected for an in-depth assessment as preparation for the implementation of adaption measures at local scale: the ‘communes’ of Mutambu, Isare and Marangara. All three communities are located in rural areas, however, they show considerably differences with regard to the topography: while Mutambu and Isare in the north western province of Bujumbura are located in the mountains near the capital city of Bujumbura, the topography in Marangara in the north eastern province of Ngozi is less mountainous and is therefore less susceptible to mass movement processes such as landslides or mid flows than the other two. Marangara is located far away from any urban center. Consequently, its inhabitants have more difficulties to access markets and social services.
In all the three areas, we carried out a local study by applying different qualitative methods: interviews with key informants, focus group discussions, village workshops and transect walks. The aim of the local level assessment was to collect data from the local population and experts about (a) already observed climate change impacts, (b) experiences with past extreme weather events, (c) perceptions and opinions about future climate trends and possible impacts for the community. In a second step, the local assessment aimed at discussing and identify possible adaptation measures at the community level. The collected data were analyzed following a thematic approach and using qualitative data analysis methods.
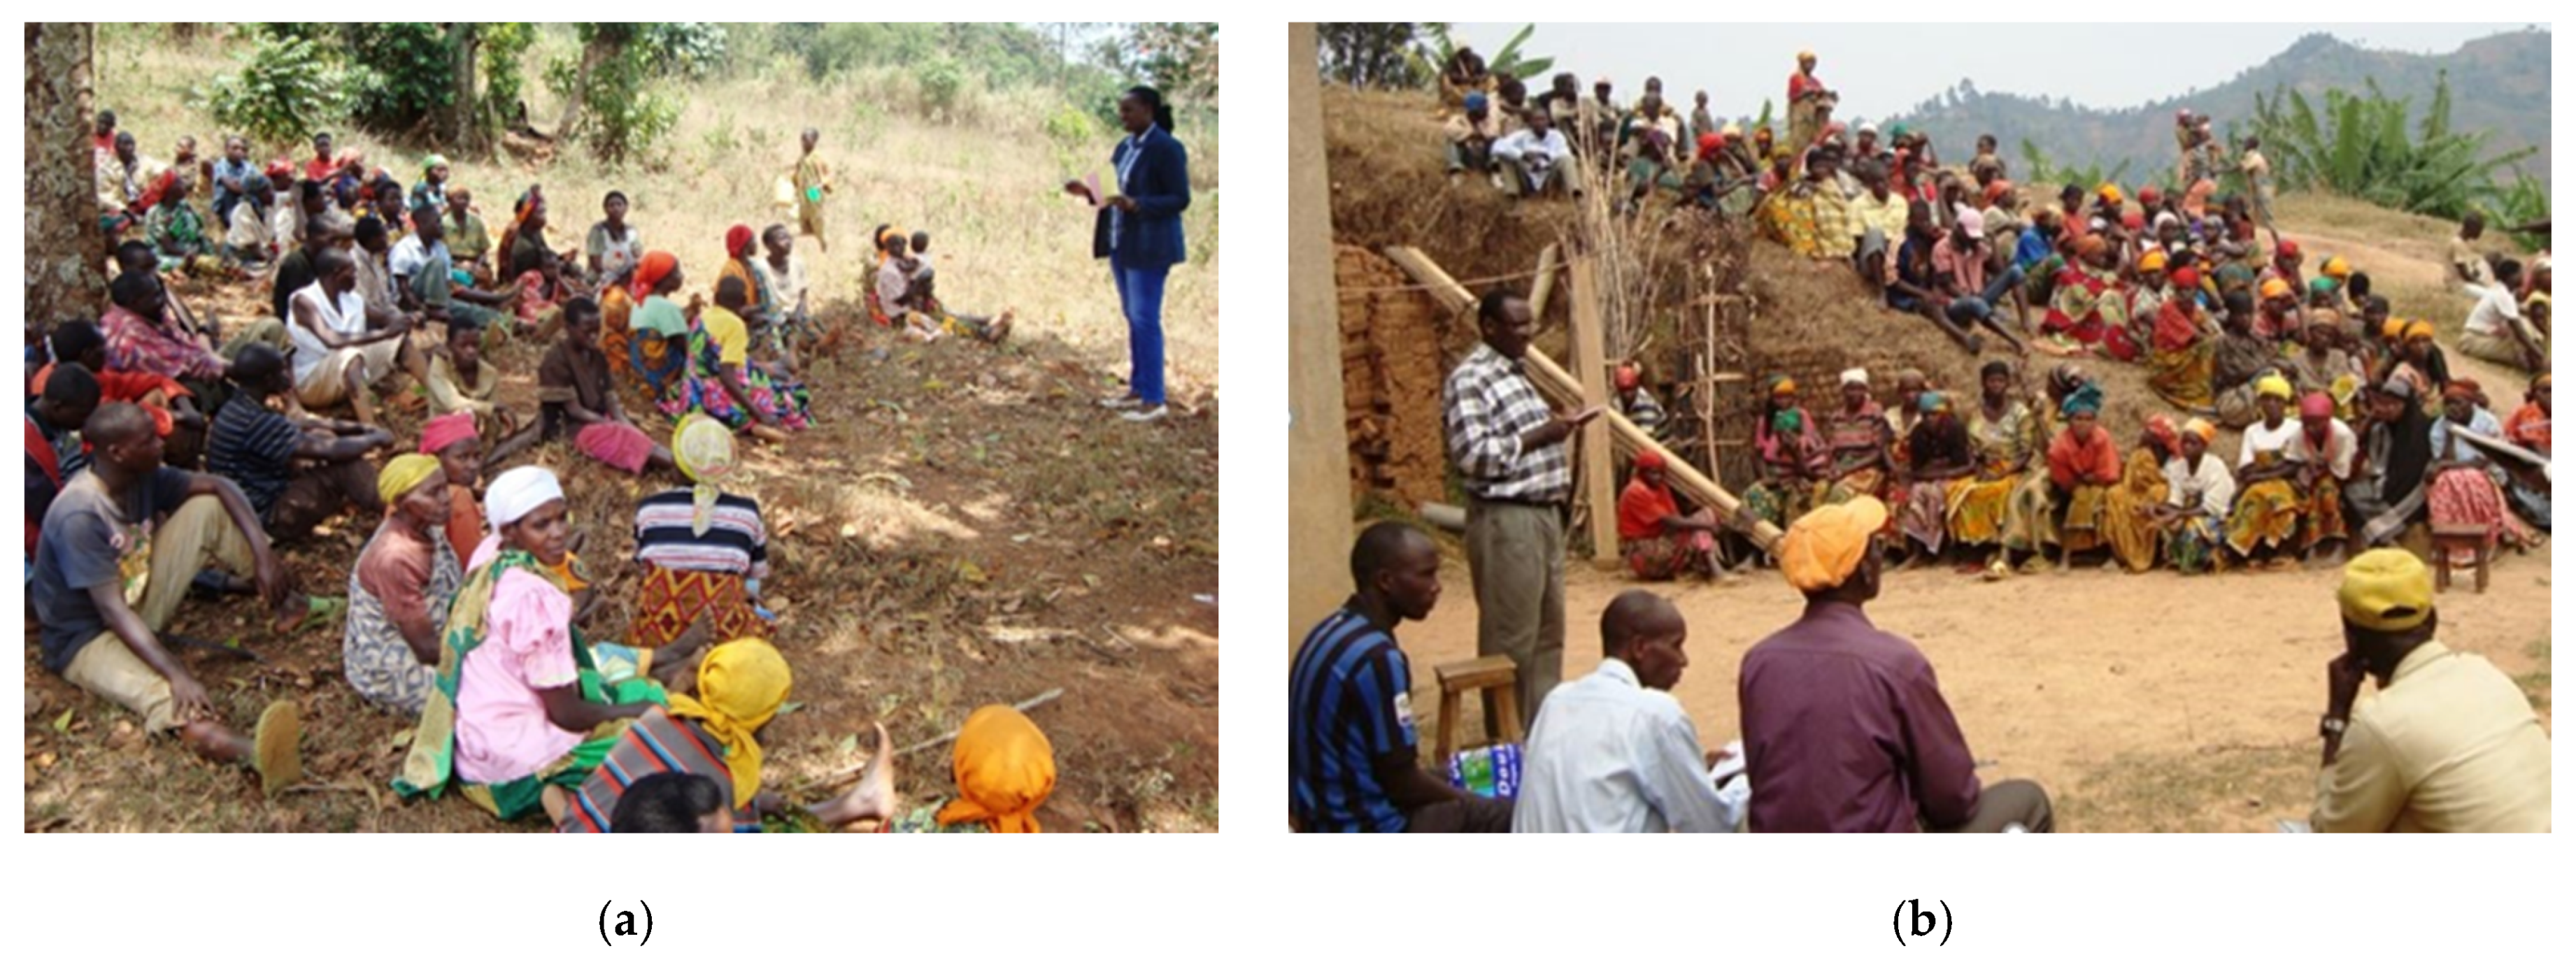
A local expert conducted semi-structured interviews in the local language with key persons at the level of Province and Commune, including for example local agricultural experts, the coordinator of the provincial office for disaster risk reduction, officials from local authorities and elected representatives at the community and province levels. In addition, three focus group discussions (one in each community) with up to 35 persons of the local population were carried out. Participants included mainly members of local NGOs, elected persons at the community level and local farmers. Finally, three open accessible village workshops (one in each community) with about 100 to 150 participants each were carried out (s.
Section 3.4) Participative methods, such as participatory risk mapping (to identify particularly vulnerable areas), seasonal calendars (to mark particularly disastrous extreme weather events in the past) and village transects (to better understand conditions, challenges and risks of local agriculture) benefitted the discussions. Moreover, we reviewed literature from previous studies and initiatives providing relevant information about climate change vulnerability in the studied communities.
The applied methods allowed us to integrate aspects of local (farmers’) knowledge into the assessment resulted into the identification as well as prioritization of key local causes and drivers of climate change vulnerability. Through the discussions with local rural population, we collected information about already experienced climate change impacts in the past and at the time of the study. In addition, we collected data about vulnerability factors that could not be populated with data in the national-level assessment, such as extreme weather events. Furthermore, the use of different participatory methods applied for the local scale assessment allowed us to identify potential measures of adaptation together with the local population that could either reduce sensitivity or enhance adaptive capacity (or both). We presented and validated the outcomes of the local-level assessment in a final stakeholder workshop in Bujumbura in September 2014.
3. Results
3.1. Climate Model Projections
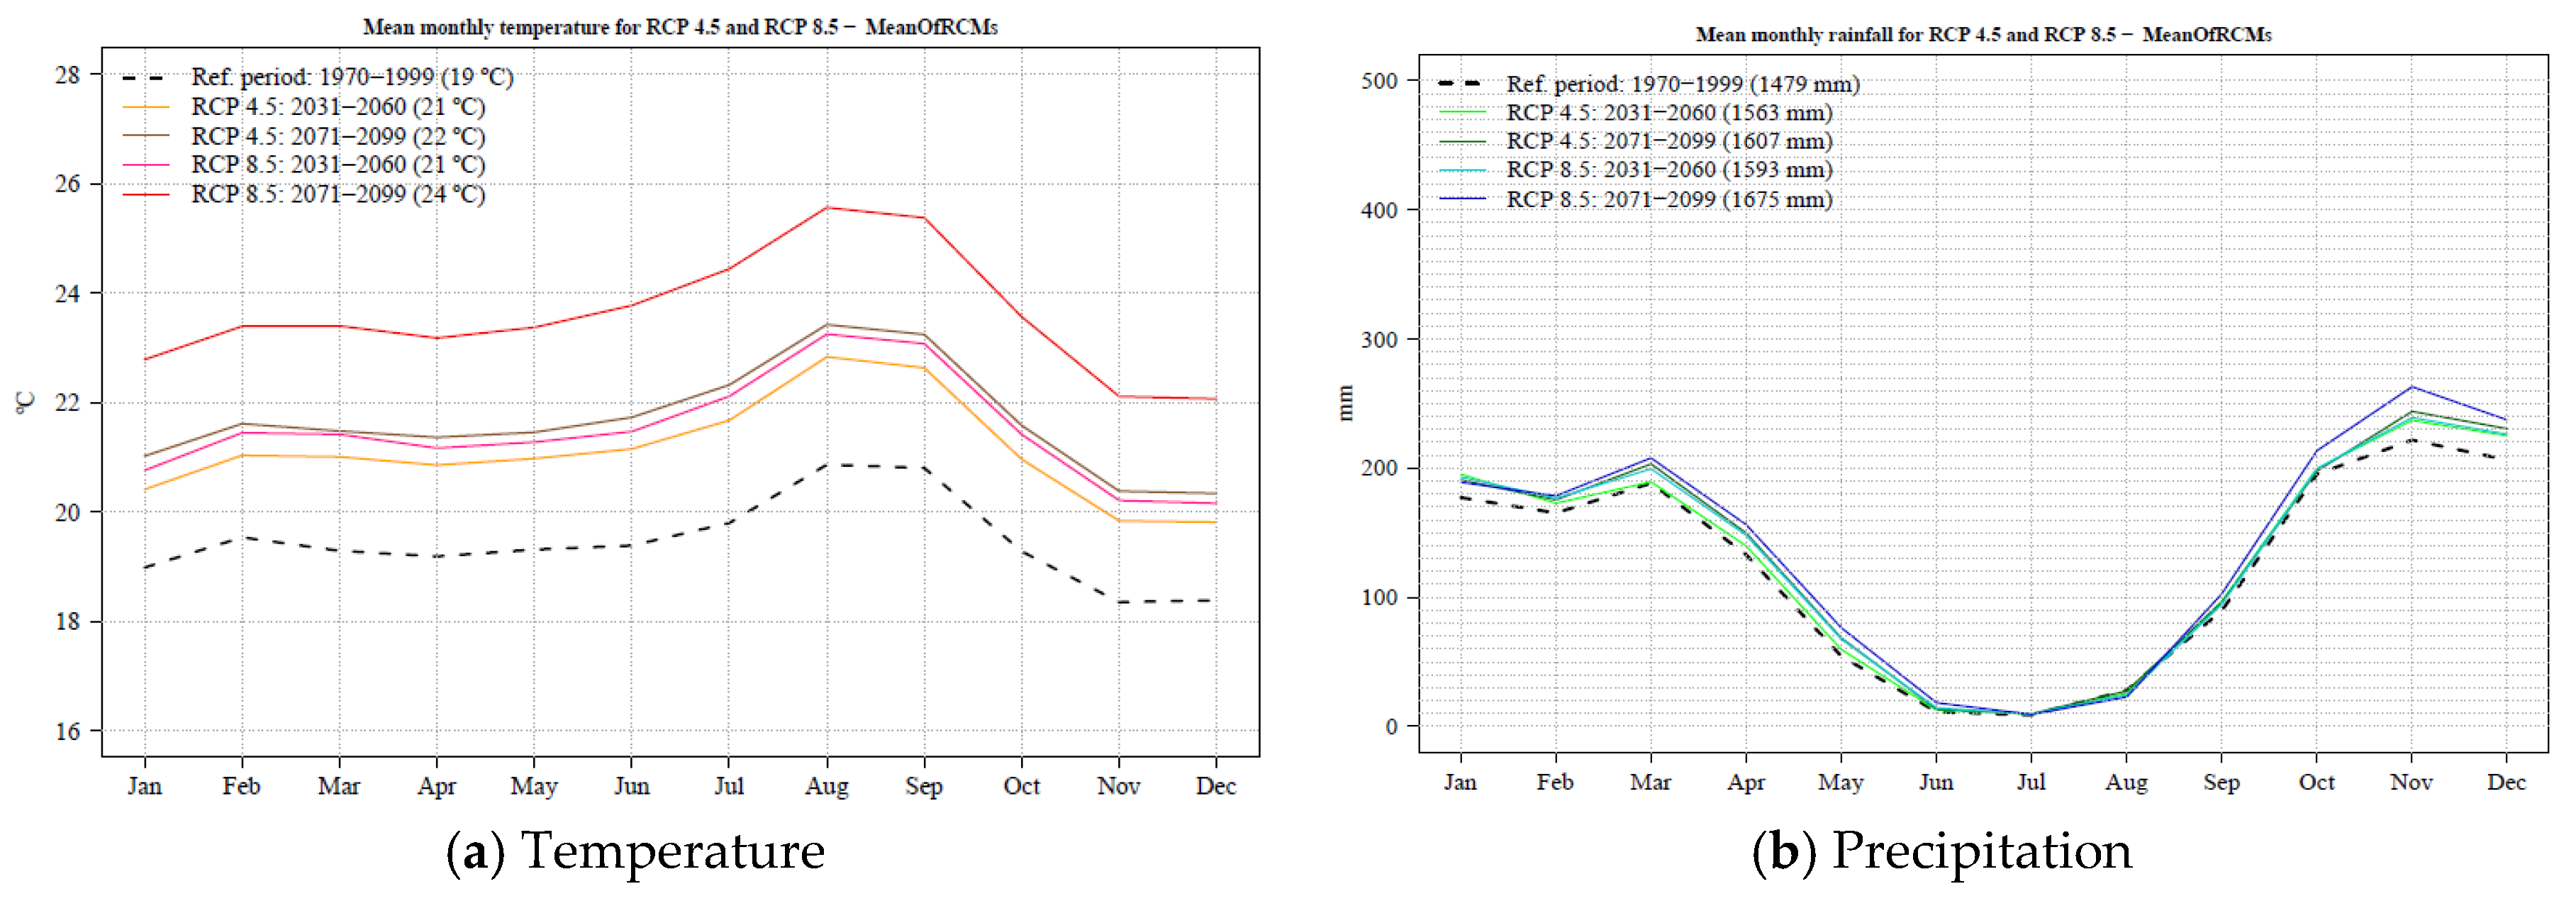
The multi-model means of the regional climate model ensemble projects an increasing trend of average air temperature and rainfall for both time periods 2031–2060 and 2071–2100 and for the entire country. As depicted in the following table, annual mean air temperature increases between 1.7 °C and 4.2 °C and annual precipitation increases between 5.6% and 13.2% compared to the reference period (1970–1999). The increase for both parameters is higher for the far future relative to the reference period and higher under RCP 8.5 conditions than under RCP 4.5 conditions (see
Table 4).
The seasonal pattern for temperature is not changing significantly. Temperature increase is slightly higher in the months of June to September during the dry season than in the rest of the year. Regarding mean monthly precipitation projections, major increases occur during the rainy season from October to March (particularly in the months November and December). The RCMs agree on a trend of reduction of precipitation in the previous months to the rainy season and its onset (August to October). This trend would indicate a prolongation of the dry season and thus would impact agricultural practices (see
Figure 5).
Regarding the uncertainties of the model projections, it must be noted that the CORDEX RCMs are good at representing seasonal patterns of temperature and precipitation, but do not adequately represent their spatial heterogeneity. For example, they are able to represent higher annual rainfall amounts in the north of Burundi but fail to capture the lower rainfall in the Lake Tanganyika region west of the mountain range. The coarse spatial resolution, Burundi is represented by 15 grid cells only, hinders a more accurate local application of the model outputs.
The SWIM model results show climatic water balance and groundwater recharge rate values increasing in all parts of the country. However, it is likely that the surplus of available water from rainfall might not always be an effective surplus. In other words, it might not always rain when it is most needed and increased precipitation might get lost as surface runoff during heavy rain events (which would increase the risk of soil erosion and landslides). Regarding the spatial heterogeneity, both datasets, the climatic water balance and the groundwater recharge rate, show a similar spatial pattern in Burundi: mountain crests and the central high plateau show the highest values, i.e., highest water availability, the eastern part (in particular the south-eastern part) show the lowest values. However, the hydrological model failed to represent adequately the water scarcity problems in north-eastern Burundi, as observed by local experts.
3.2. Spatially Explicit Vulnerabilities at National Scale
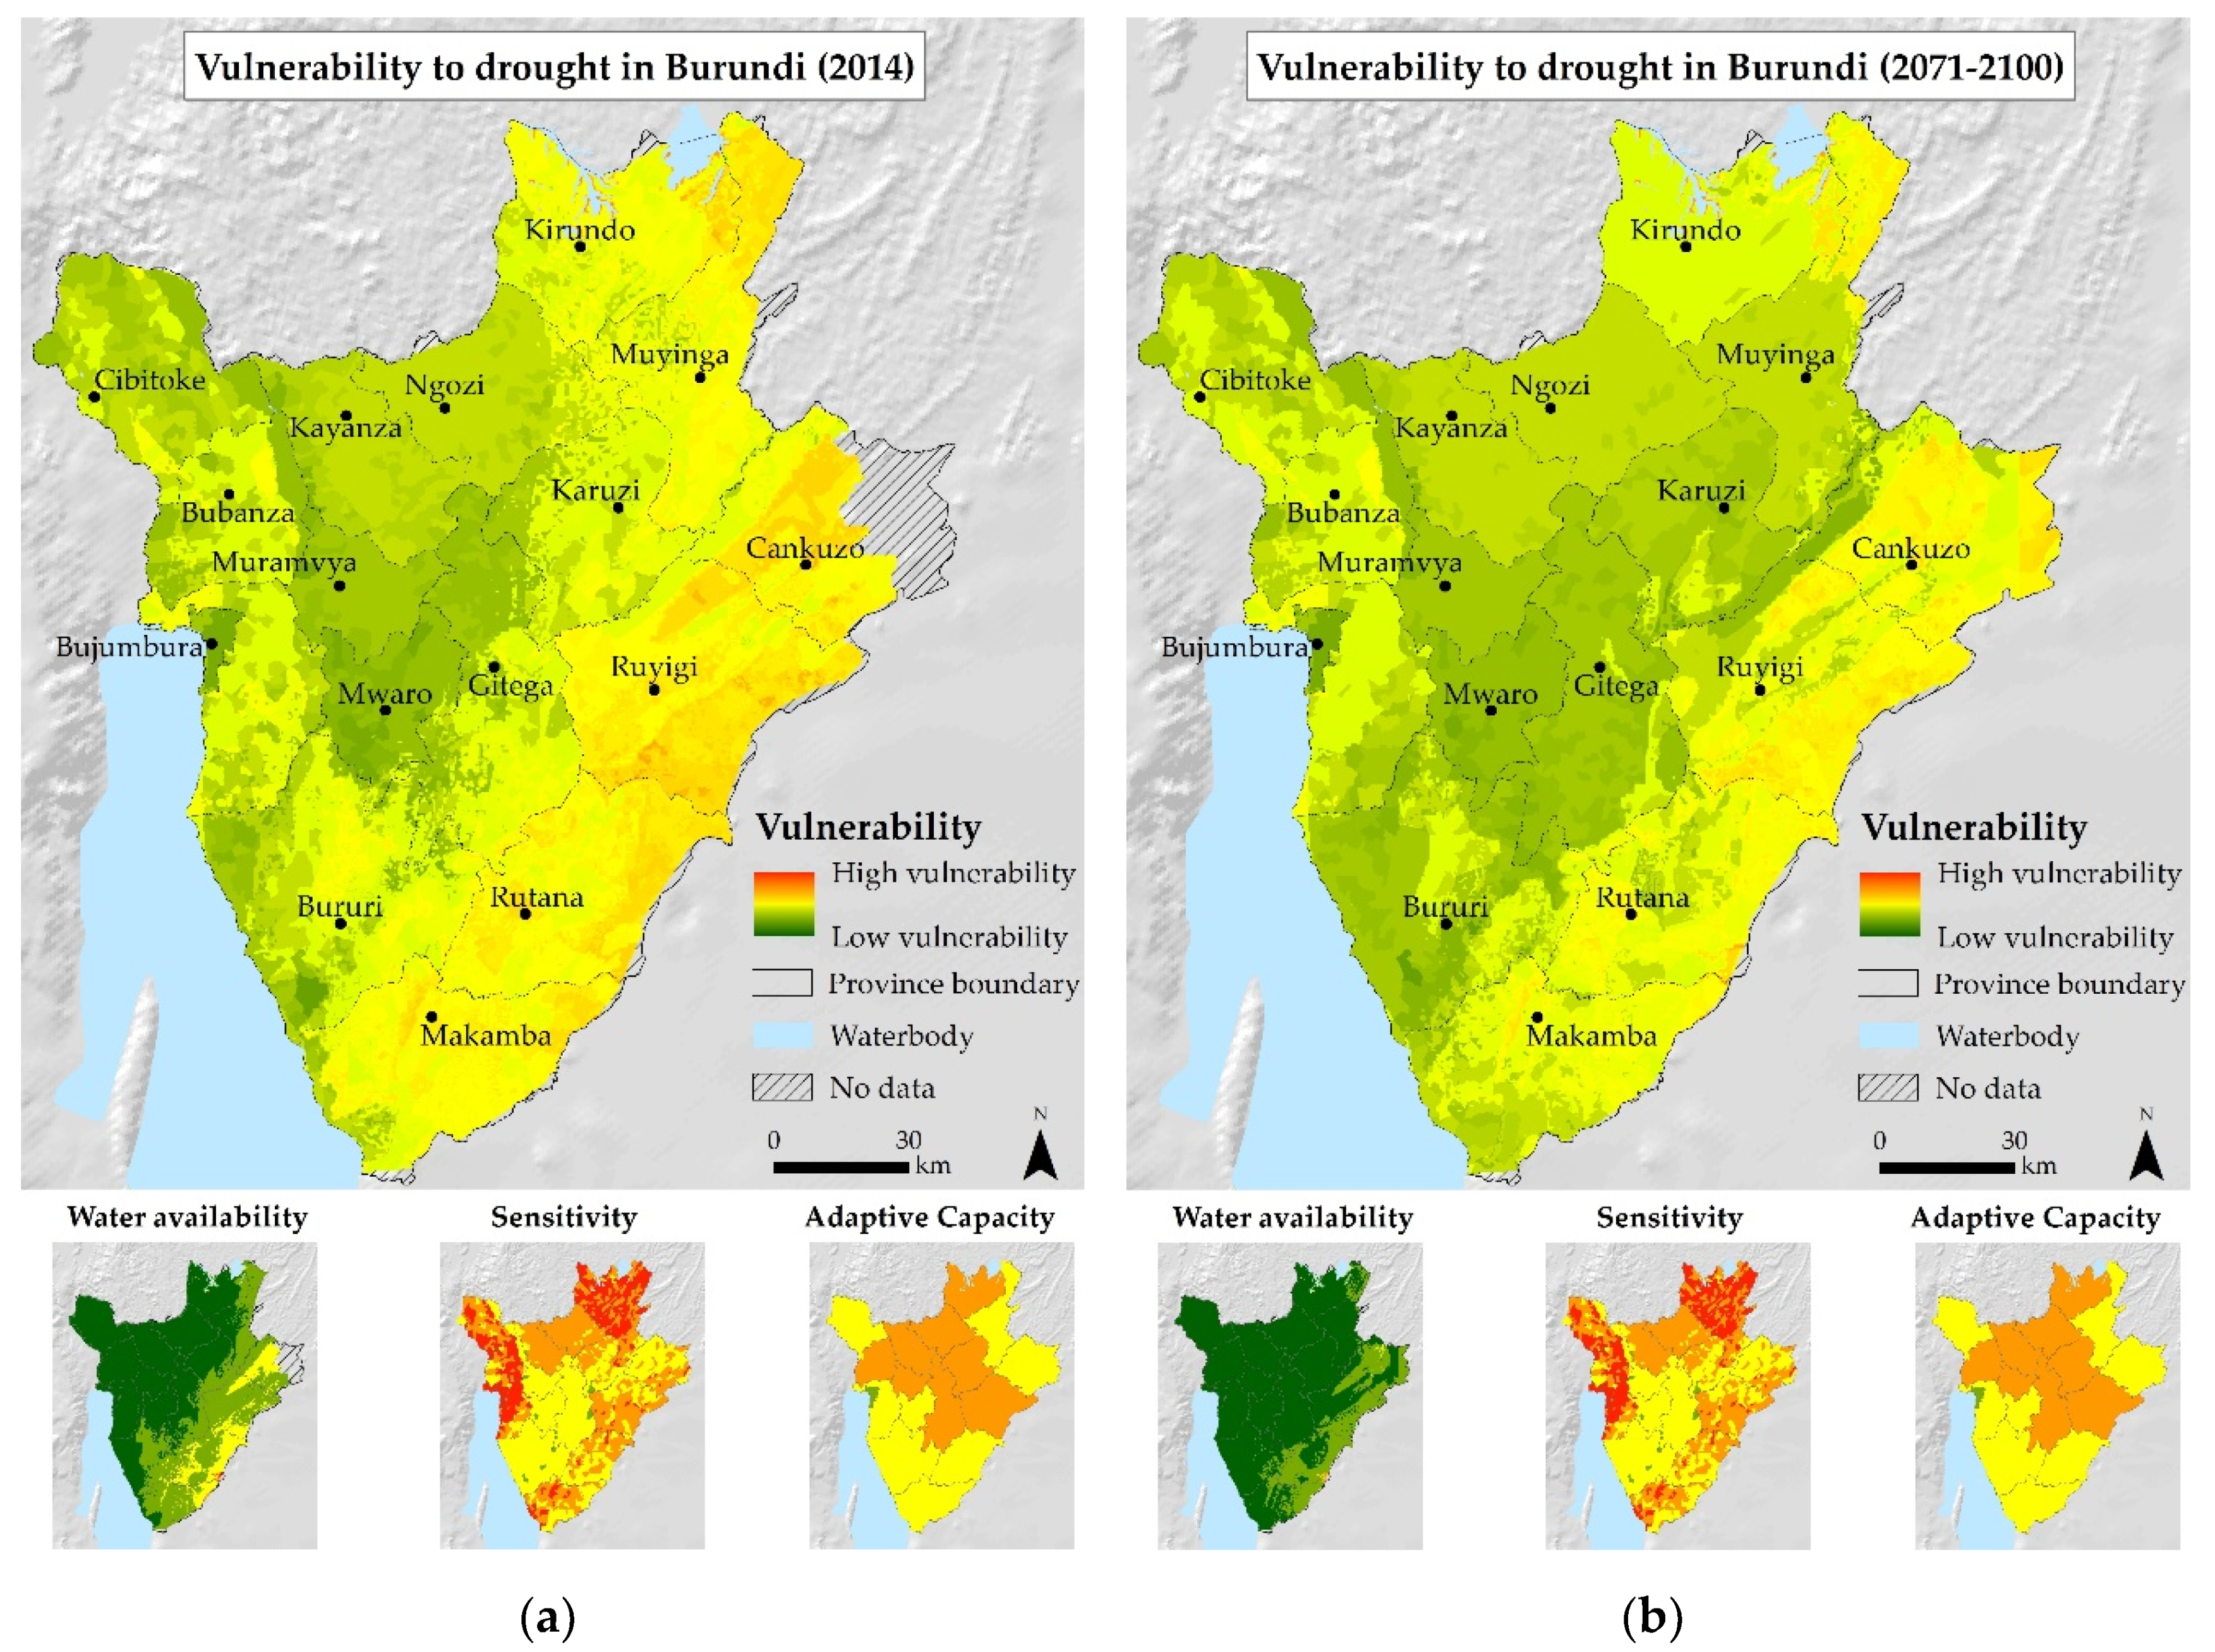
For each identified most relevant potential impact, the vulnerability was mapped at national scale in order to allow for spatially explicit representation. Exploiting the available datasets for future projections and due to our chosen methodology, five maps were generated for each impact. One map represents the current vulnerability (1970–1999) and four maps show the two projected future time periods (2031–2060 and 2071–2100), each of them for the two calculated RCPs. Each vulnerability map shows in the upper part, the final vulnerability map and at the bottom the three input maps representing exposure, sensitivity and adaptive capacity. That is, the three small maps at the bottom visualize the spatial results of the first aggregation step whilst the large maps on top show the spatial results of the second aggregation step, that is the overall aggregated vulnerability. In this paper, only the maps generated with the medium RCP 4.5 data for the two time slices ‘present’ and long-term future ‘2071–2100’ are shown. For all maps, that is the large as well as the small ones, the same legend has been applied representing the degree of vulnerability in a color range from green (rather positive situation) to red (rather negative situation). For the large maps, the colors represent vulnerability values, for the small maps they represent the respective component, for example adaptive capacity values.
The factors influencing the populations’ sensitivity and adaptive capacity have been identified as very similar for both the impacts of soil erosion and of droughts (see the impact chain in
Figure 3). Therefore, there is no difference in the indicators representing these two components for the respective final vulnerability maps. Since most of the indicator values have been taken from provincial statistics, the spatial resolution of the respective maps is accordingly low. Nevertheless, the results indicate higher vulnerabilities in the north eastern part of the country (see the small maps in the center and on the right on the bottom of
Figure 6 and in
Figure 7).
Figure 6 shows the three vulnerability maps for soil erosion. On these maps the erosion vulnerability hotspots are in the northern part of Burundi and in particular in the northwest. This result is strongly influenced by the high values of the components exposure and sensitivity since the north western part of the country is characterized by steep slopes, large proportions of degraded land and a high population density (in particular around Bujumbura). In addition, the adaptive capacity values are lowest in the north of the country, exacerbating people’s vulnerability in this region.
The time periods do not differ substantially from each other. This similarity of the mapped vulnerability of the present and the future is predominantly due to the lack of available scenarios for socio-economic parameters (except for population density). Based on those datasets, for which projected information is available, the vulnerability is increasing slightly in the north. The visible changes are almost exclusively related to the projected increase of population density. The changing precipitation values of the regional climate model do hardly affect the erosion values, since an increase in rainfall does not result necessarily in significant changes of the rainfall erosivity factor of the RUSLE model.
Figure 7 shows the final vulnerability maps for RCP 4.5 for the impact drought for all three periods. The maps demonstrate that the vulnerability to drought is not severe in most parts of Burundi and that it is particularly low in the central high plateau and parts of the mountain crest. This reflects the relatively positive picture provided by the exposure indicators, which indicate potentially low water scarcity, particularly for future periods. The highest vulnerability values appear in the northeast and southeast of the country.
According to these maps, the vulnerability for the potential impact drought is decreasing over time. In particular, the north eastern part is characterized by less vulnerability in the future. The increasing precipitation values provided by the regional climate model lead to an improved climatic water balance and higher groundwater recharge rates, which in the long term reduce water scarcity in the entire country.
The homogeneous picture of the exposure component of these maps compared to the exposure map representing soil erosion values is particularly noticeable. This is due to the facts that Burundi is a rather small country and the results stemming from the climate model have a relatively course resolution.
3.3. Presentation and Discussion of Results at National Level
The mapping work was carried out by the core group and the results were presented to the local expert group and additional politicians and other actors during the fourth workshop. In general, the workshop participants appreciated and verified the usefulness of the maps. Nevertheless, there were many comments and proposals for modifications of the maps pointing to local characteristics and specificities that were not reflected by the results of this national study. This is due to the constraint that the applied methodology represented many compromises in order to pursue a consistent approach for the whole country.
For the final selection of region to conduct the local study, both the vulnerability maps and the additional remarks of the participants of the fourth workshop were taken into consideration. Additional selection criteria (which are not discussed here) were safety/amount of conflicts in the region, accessibility to the area as well as other projects and interventions already present and working in the location. Based on all these criteria, the
core group selected the three areas Mutambu, Isare and Marangara for the local in-depth study (see
Section 3.4).
3.4. Results from the Local Study
The work within the three ‘communes’ supported by the engagement of the local population and experts revealed a variety of extreme weather events that occurred in the past. Among them are droughts (2013/2014 in Mutambu, 2014 in Isare, and both 2000 and 2014 in Marangara), heavy rainfalls (2009 in Mutambu, 2014 in Isare and both 2005 and 2006 in Marangara) and hail (2000 in Mutambu and Isare, 2003 in Marangara). Those events resulted in soil erosion, landslides, plant diseases, siltation of rice cultivations, crop losses or a lack of pasturage, thus affecting not only the local agricultural production, but also infrastructure, housing and the environment. According to the interviews and focus group discussions, local farmers perceive changing climate conditions and associated impacts. They claimed that the situation in agriculture is different compared to how they were 20–30 years ago (spreading of crop diseases, greater frequency of extreme weather events, disappearance of certain crop species, late and early rainfall, overlapping cropping seasons) and they conclude that “times have changed” (in Kirundi: “ibihe vyarahindutse”) without necessarily thinking of climate change as perceived by scientists. Concrete changes mentioned, which could be linked to climate change, include the observation that certain varieties of bananas (Ibisahira, Ibitsiri) no longer grow in the middle altitude areas and have migrated to higher altitude areas. The mid-altitude zones are currently occupied by other varieties of bananas (Mugomozi) which are currently in danger of extinction due to the threat of bacterial wilt (see
Figure 8). Moreover, there are several areas within the three ‘communes’ increasingly threatened by landslides following heavy rains and there is a movement of people leaving their land. Another observed change is a rise of diseases and pests for almost all crops (cassava mosaic, bacterial wilt for banana, pests for crops such as beans and sweet potato, disappearance of some crops such as colocase).
The expected future impacts of climate change are particularly related to: (i) the accentuation of the phenomenon of erosion followed by a drop in agricultural production resulting in growing food insecurity; (ii) the drop in agricultural production following prolonged droughts, the early onset and late return of rains; (iii) landslides causing the destruction of crops and socio-economic infrastructures; (iv) the excessive silting of the Mugere dam and the drop in its electricity production given that one ‘commune’ is a sub-basin of the Mugere river on which the dam is located.
According to the local experts and community members, currently no or just minor strategies to adapt to climate change are applied in the zones. Only a few farmers apply irrigation techniques or anti-erosion measures. Adaptation to drought is limited to only a few rudimentary schemes to irrigate small plots of market gardening crops during the dry season. Participants in the workshops in Mutambu indicated that access to chemical fertilizers is not assured for a sufficient part of the population, that is, fertilizers are available only to “the richest” people. Some households do not have the (financial) means to obtain fertilizers timely enough, as they have to pay the price of fertilizers in advance, that is, before the harvest has yielded any income. Also, the access to organic manure, that is used as a supplement to chemical fertilizers, is limited for many households. The main reason given for this problem is insufficient numbers of livestock and poor knowledge of how to set up and maintain compost bins.
One topic, which was raised several times during the village workshops, is the access to seasonal weather forecasts. The farmers receive seasonal weather forecasts through (a) radios, (b) the communal administration, (c) the communal agronomist who informs the agricultural monitors, who in turn inform the population. Seasonal weather forecasts for farmers are limited to a rough information about the amount of the expected rainfall (abundant, medium or low) and the expected duration of wet periods for the coming crop season, thus indicating the ideal sowing period. The communities pointed out that the seasonal weather information is not of reliable and that they would prefer to receive weather information more frequently. Additionally, it was pointed out that women have less opportunity to listen to the radio than men due to the multiple household chores they have to look after.
Figure 9 shows photos from two village workshops.
In general, the farmers have very limited access to agricultural guidance and consultation in order to cultivate crops that are most appropriate for their resources and technical capacities. In terms of risk prevention and disaster management, capacities to deal with extreme events are very fragile, due to the lack of supporting institutional structure at the provincial and communal levels. In fact, the Provincial Platform for Risk Prevention and Disaster Management that was set up in 2011 has never worked properly. These latter two points in particular increase the rural population’s vulnerability to the impacts of climate change.
During the focus group discussions potential measures of adaptation were identified. According to the participants’ opinion these measures are crucial to face the already observed and expected negative impacts of climate change. They can be grouped into three categories: measures of sustainable land management (e.g., marshland, river and streams), measures for integrated water resource management and adaptation measures in the field of agroforestry. In detail, identified measures in all three regions include anti-erosion plantations (trees, shrub, herbs, etc.) along contour lines and on degraded slopes, reforestation, the protection of steep banks along rivers, the use of drought resistant seeds and organic fertilizer, zero grazing policies, the increasing cultivation of forage crops, the resettlement of wildlife, rainwater harvesting and short-cycle cultivations. The local study provided a better understanding of data and information related to food insecurity, child malnutrition and low land productivity. For example, it was possible to understand that despite the government’s policy of disseminating mineral fertilizers, these are inaccessible to most farmers whose purchasing power is very low. The study showed that one of the reasons food insecurity and malnutrition persist is that people do not know how to use available water resources in a context of scarcity. The chronology of extreme weather events reconstructed during the focus groups shows that over the last 10–20 years, their frequency has been high. It is this analysis that showed the need to support communes to set up community organizations in charge of risk prevention and disaster management.
These results of the study at the local level directly fed into the planning work of the project ACCES, promoting the following adaptation techniques and measures:
The fight against soil erosion through training and sensitization of farmers to adopt techniques such as reforestation of bare ridges, construction of anti-erosion ditches and planting of fixative grasses on farms, crop mulching and rainwater harvesting on community infrastructures to limit rainwater erosion in a watershed.
The improvement of soil fertility through the promotion of agroforestry techniques, composting, the use of human waste as fertilizer with the adoption of ecological toilets and the use of green manure through the diffusion of fertilizing plants such as mucuna.
The improvement of food sovereignty through the distribution of crop varieties resistant to water deficit such as cassava, sweet potato and colocase. Kitchen gardens are also being promoted with the aim of supporting communities in improving their nutrition in small spaces in order to have regular access to vitamin-rich vegetables during all growing seasons. It also contributes to alleviating the problems of deficiency diseases observed in infants.
Integrated management of water resources through the dissemination of techniques for collecting and using rainwater, stabilization of ravines with bamboo planting and the development of fascines to limit runoff.
Strengthening the capacities of local communities through the dissemination of climate information (seasonal forecasts) and support to communes for the establishment of communal platforms for risk prevention and disaster management.
During the time of this publication (in 2020), respective activities to implement parts of this portfolio of measures are still ongoing.
4. Discussion and Conclusions
This study applied a modular VA approach to support adaptation planning. Its objectives were to identify hotspots of vulnerabilities to adverse climate change consequences and to support the identification of appropriate adaptation measures as described in
Section 3. In retrospect and given that the results of the study were picked up by further activities of the project ACCES (see
Section 3.4) and led to the implementation of several adaptation measures, the study aims were achieved successfully. However, there are a number of critical issues and lessons we learnt during the implementation of our study. The majority of these issues are not exclusively related to the setting in our test case Burundi and may hence be useful for future VAs pursuing similar objectives or being carried out in comparable contexts.
A focus of the Vulnerability Sourcebook applied here is the engagement of actors and local stakeholders during the whole process of the work; an aspect that we pursued also within the context of this study. The background for this imperative is: (i) the absolute requirement to base all of assessment steps and respective necessary methodological decisions on strong local knowledge and expertise; and (ii) that a vulnerability assessment should not only aim at yielding useful findings but should be seen as a process that builds capacity, creates awareness and supports populations to develop ownership in order to prepare as effectively as possible for future conditions. However, motivating actors to engage in our study often required the investment of financial incentives and the consistent cooperation with key experts was hard to achieve. When scrutinizing certain decisions, we sometimes faced a conflict of interest of the engaged experts and actors. This is linked to the fact that the assessment of vulnerabilities and the identification of related hot spots value—particularly within a least developed country such as Burundi—may lead or may not lead to future donor activities and related cooperation projects. Nevertheless, the workshops organized within the scope of our study proved to be a successful way of integrating local knowledge. The workshops served also to foster cross sectoral coordination and to trigger knowledge exchange and discussions between different levels of governance and public authorities.
The modular Vulnerability Sourcebook approach provided useful guidance and structure for a complex study such as the VA in Burundi. In particular the step of generating impact chains and the respective discussions turned out to be crucial for (i) the motivation of actors to get engaged, (ii) the comprehension of interrelationships amongst the drivers and factors contributing to vulnerability and (iii) the step leading from abstract discussion at the systemic level to concrete and tangible indicators to assess key aspects of vulnerability and its components. At the same time, we are aware of the constraints that impact chains only represent linear relations and do not allow for the consideration of feedback loops or synergies between different impacts.
The selection of indicators as basis for the semi-quantitative assessment and particularly the search for related appropriate data sources emerged to be very time-consuming. A lack of data sets that are consistently updated and provide the entire spatial coverage required represents a major constraint for VAs aiming at the generation of spatially explicit results. To fill this gap, the growing number of initiatives providing datasets worldwide of increasing quality such as WorldPop or the Copernicus Global Land Service play an important role.
A specific weakness of the VA in Burundi was the lack of projections or scenarios of future socio-economic developments. The maps showing the projected vulnerabilities of the future periods were hence strongly influenced by the very few indicators for which modeled future values were available. The respective results represent therefore mainly a possible future of the bio-physical conditions but do not sufficiently take into consideration potential socio-economic developments.
The Vulnerability Sourcebook approach pursues an indicator-based approach to allow for repeated assessment and monitoring. However, the normalization, classification and aggregation of indicator values implicates the loss of many details in the underlying datasets. Each of the data processing steps hence requires: (i) a very careful choice of the most adequate methodology; (ii) full recording and transparency of each single workings step; (iii) the communication of constraints and limitations associated with the processing steps when the results are presented.
This generation of useful results at national level were achieved based on existing datasets of sufficient quality and quantity that allowed us to apply an indicator-based methodology. The lack of similar available data at local level together with the different aim and expected outputs for the local level required us to modify our methodological approach and to set a focus on qualitative approaches as well as the application of participatory data gathering methods. This approach strongly differs from the rigidly structured set of Vulnerability Sourcebook modules. Consequently, the findings at the local level can barely be compared with the results at the national level but they do represent a complementary set of information that revealed to be very useful for adaptation planning. Hence, we can conclude that the findings of our approach to apply different methods at the two scales (national and local) has confirmed that the indicator-based methodology of the Vulnerability Sourcebook is particularly useful for obtaining an overview of climate related impacts, for a spatial comparison between regions and as backbone for possible future monitoring activities. The participatory predominantly qualitative assessment at local level in contrast, allowed us to reveal underlying driving forces for context-specific vulnerabilities, which are key for the planning of adaptation measures at this scale. In this way, the work at the national and local scale complemented each other in a fruitful way, though a direct link between the two levels was not established. That is, the hotspot identification of the national study was useful for the delineation of the local work but there was no upscaling or downscaling of indicator values. Provided a certain quantum of data were available, a third intermediate study scale—for example at the provincial level—could have been benefited the study by providing the bridge to close the conceptual and methodological gap between our two study scales.
Spatially explicit VAs face certain difficulties. Mapping vulnerability has the advantage of producing a visual, spatially differentiated result that can be grasped easily and instantly. However, the generation of the results is accompanied by several uncertainties and challenges. Those uncertainties lie in the heterogeneous data (data sources, scales, resolutions, reference units, qualities, etc.) that are exploited as well as the aggregation methodology applied. The final map of the aggregated indices bears the potential to be misinterpreted. For example, low-resolution data were artificially transformed into a higher resolution when integrated in high-resolution maps to allow for intersection and to avoid the loss of details of high-resolution datasets.
In order to avoid misconception, these maps hence need to be escorted by information explaining the input data sets, the aggregation process and a guideline on how to understand the granularity of the presented information.
Despite these constraints, the vulnerability maps turned out to be suitable for a preliminary analysis and a hotspot identification at national scale. However, the visualization of the highly aggregated results in map format requires additional information and knowledge to serve as decision criteria.

 ,
, 


