Hazard Duration Model with Panel Data for Daily Car Travel Distance: A Toyota City Case Study


Abstract
1. Introduction
2. Methodology
3. Data Description
4. Model Estimation Results
5. Conclusions
Author Contributions
Funding
Acknowledgments
Conflicts of Interest
References
- Washington, S.P.; Karlaftis, M.G.; Mannering, F.L. Statistical and Econometric Methods for Transportation Data Analysis, 2nd ed.; Chapman & Hall/CRC: Boca Raton, FL, USA, 2011. [Google Scholar]
- Hensher, D.A.; Mannering, F.L. Hazard-based duration models and their application to transport analysis. Transp. Rev. 1994, 14, 63–82. [Google Scholar] [CrossRef]
- Bhat, C.R.; Pinjari, A.R. Duration modeling. Handb. Transp. Model. 2000, 6, 91–111. [Google Scholar]
- Bhat, C.R.; Frusti, T.; Zhao, H.; Schönfelder, S.; Axhausen, K.W. Intershopping duration: An analysis using multiweek data. Transp. Res. Part B Methodol. 2004, 38, 39–60. [Google Scholar] [CrossRef]
- Bhat, C.R. A generalized multiple durations proportional hazard model with an application to activity behavior during the evening work-to-home commute. Transp. Res. Part B Methodol. 1996, 30, 465–480. [Google Scholar] [CrossRef]
- Niemeier, D.A.; Morita, J.G. Duration of trip-making activities by men and women. Transportation 1996, 23, 353–371. [Google Scholar] [CrossRef]
- Kharoufeh, J.P.; Goulias, K.G. Nonparametric identification of daily activity durations using kernel density estimators. Transp. Res. Part B Methodol. 2002, 36, 59–82. [Google Scholar] [CrossRef]
- Martchouk, M.; Mannering, F.; Bullock, D. Analysis of freeway travel time variability using Bluetooth detection. J. Transp. Eng. 2011, 137, 697–704. [Google Scholar] [CrossRef]
- Anastasopoulos, P.C.; Haddock, J.E.; Karlaftis, M.G.; Mannering, F.L. Analysis of urban travel times: Hazard-based approach to random parameters. Transp. Res. Rec. 2012, 2302, 121–129. [Google Scholar] [CrossRef]
- Guo, H.; Gao, Z.; Yang, X.; Zhao, X.; Wang, W. Modeling travel time under the influence of on-street parking. J. Transp. Eng. 2012, 138, 229–235. [Google Scholar] [CrossRef]
- Yu, Z.; Wood, J.S.; Gayah, V.V. Using survival models to estimate bus travel times and associated uncertainties. Transp. Res. Part C Emerg. Technol. 2017, 74, 366–382. [Google Scholar] [CrossRef]
- Bhat, C.R.; Steed, J.L. A continuous-time model of departure time choice for urban shopping trips. Transp. Res. Part B Methodol. 2012, 36, 207–224. [Google Scholar] [CrossRef]
- van den Berg, P.; Arentze, T.; Timmermans, H. A latent class accelerated hazard model of social activity duration. Transp. Res. Part A Policy Pract. 2012, 46, 12–21. [Google Scholar] [CrossRef]
- Hojati, A.T.; Ferreira, L.; Washington, S.; Charles, P. Hazard based models for freeway traffic incident duration. Accid. Anal. Prev. 2013, 52, 171–181. [Google Scholar] [CrossRef] [PubMed]
- Hasan, S.; Mesa-Arango, R.; Ukkusuri, S. A random-parameter hazard-based model to understand household evacuation timing behavior. Transp. Res. Part C Emerg. Technol. 2013, 27, 108–116. [Google Scholar] [CrossRef]
- Haque, M.M.; Washington, S. The impact of mobile phone distraction on the braking behaviour of young drivers: A hazard-based duration model. Transp. Res. part C Emerg. Technol. 2015, 50, 13–27. [Google Scholar] [CrossRef]
- Casals, L.C.; Martinez-Laserna, E.; García, B.A.; Nieto, N. Sustainability analysis of the electric vehicle use in Europe for CO2 emissions reduction. J. Clean. Prod. 2016, 127, 425–437. [Google Scholar] [CrossRef]
- Meinrenken, C.J.; Shou, Z.; Di, X. Using GPS-data to determine optimum electric vehicle ranges: A Michigan case study. Transp. Res. Part D Transp. Environ. 2020, 78, 102203. [Google Scholar] [CrossRef]
- Kempton, W.; Tomić, J. Vehicle-to-grid power fundamentals: Calculating capacity and net revenue. J. Power Sources 2005, 144, 268–279. [Google Scholar] [CrossRef]
- Guille, C.; Gross, G. A conceptual framework for the vehicle-to-grid (V2G) implementation. Energy Policy 2009, 37, 4379–4390. [Google Scholar] [CrossRef]
- Niklas, U.; von Behren, S.; Chlond, B.; Vortisch, P. Electric factor—A comparison of car usage profiles of electric and conventional vehicles by a probabilistic approach. World Electr. Veh. J. 2020, 11, 36. [Google Scholar] [CrossRef]
- Greene, D.L. Estimating daily vehicle usage distributions and the implications for limited-range vehicles. Transp. Res. Part B Methodol. 1985, 19, 347–358. [Google Scholar] [CrossRef]
- Lin, Z.; Dong, J.; Liu, C.; Greene, D. Estimation of energy use by plug-in hybrid electric vehicles: Validating gamma distribution for representing random daily driving distance. Transp. Res. Rec. 2012, 2287, 37–43. [Google Scholar] [CrossRef]
- Plötz, P.; Jakobsson, N.; Sprei, F. On the distribution of individual daily driving distances. Transp. Res. Part B Methodol. 2017, 101, 213–227. [Google Scholar] [CrossRef]
- Tamor, M.A.; Gearhart, C.; Soto, C. A statistical approach to estimating acceptance of electric vehicles and electrification of personal transportation. Transp. Res. Part C Emerg. Technol. 2013, 26, 125–134. [Google Scholar] [CrossRef]
- Li, Z.; Jiang, S.; Dong, J.; Wang, S.; Ming, Z.; Li, L. Battery capacity design for electric vehicles considering the diversity of daily vehicles miles traveled. Transp. Res. Part C Emerg. Technol. 2016, 72, 272–282. [Google Scholar] [CrossRef]
- He, J.; Yamamoto, T. Characterization of daily travel distance of a university car fleet for the purpose of replacing conventional vehicles with electric vehicles. Sustainability 2020, 12, 690. [Google Scholar] [CrossRef]
- Anastasopoulos, P.C.; Fountas, G.; Sarwar, M.T.; Karlaftis, M.G.; Sadek, A.W. Transport habits of travelers using new energy type modes: A random parameters hazard-based approach of travel distance. Transp. Res. Part C Emerg. Technol. 2017, 77, 516–528. [Google Scholar] [CrossRef]
- Ding, C.; Mishra, S.; Lu, G.; Yang, J.; Liu, C. Influences of built environment characteristics and individual factors on commuting distance: A multilevel mixture hazard modeling approach. Transp. Res. Part D Transp. Environ. 2017, 51, 314–325. [Google Scholar] [CrossRef]
- Jian, S.; Rashidi, T.H.; Wijayaratna, K.P.; Dixit, V.V. A Spatial Hazard-Based analysis for modelling vehicle selection in station-based carsharing systems. Transp. Res. Part C Emerg. Technol. 2016, 72, 130–142. [Google Scholar] [CrossRef]
- Krueger, R.; Rashidi, T. What Makes you cycle this far? An analysis of mandatory bicycle tour distances. an analysis of mandatory bicycle tour distances. SSRN Electron. J. 2017. [Google Scholar] [CrossRef]
- Anastasopoulos, P.C.; Islam, M.B.; Perperidou, D.; Karlaftis, M.G. Hazard-based analysis of travel distance in urban environments: Longitudinal data approach. J. Urban Plan. Dev. 2012, 138, 53–61. [Google Scholar] [CrossRef]
- Kleinbaum, D.G.; Klein, M. Survival Analysis; Springer: New York, NY, USA, 2010; Volume 3, pp. 35–36. [Google Scholar]
- Greene, W. Interpreting estimated parameters and measuring individual heterogeneity in random coefficient models. NYU Work. Pap. 2004. Available online: https://www.stern.nyu.edu/eco/wkpapers/workingpapers04/EC-04-08.pdf (accessed on 6 August 2020).
- Biørn, E.; Lindquist, K.G.; Skjerpen, T. Heterogeneity in returns to scale: A random coefficient analysis with unbalanced panel data. J. Product. Anal. 2002, 18, 39–57. [Google Scholar] [CrossRef]
- Kato, B.S.; Hoijtink, H. Testing homogeneity in a random intercept model using asymptotic, posterior predictive and plug-in p-values. Stat. Neerl. 2004, 58, 179–196. [Google Scholar] [CrossRef]
- Schmidheiny, K.; Basel, U. Panel data: Fixed and random effects. Short Guides Microeconometrics 2011, 7, 2–7. [Google Scholar]
- Abrevaya, J.; Shen, S. Estimation of censored panel-data models with slope heterogeneity. J. Appl. Econom. 2014, 29, 523–548. [Google Scholar] [CrossRef]
- Yang, J.; Kato, H.; Ando, R.; Nishihori, Y. Analyzing household vehicle ownership in the Japanese local city: Case study in Toyota city. J. Adv. Transp. 2018, 2020, 1–11. [Google Scholar] [CrossRef]
- von Behren, S.; Minster, C.; Esch, J.; Hunecke, M.; Vortisch, P.; Chlond, B. Assessing car dependence: Development of a comprehensive survey approach based on the concept of a travel skeleton. Transp. Res. Procedia 2018, 32, 607–616. [Google Scholar] [CrossRef]
- Yang, J.; Kato, H.; Ando, R. Comparative analysis of the household car ownership between Toyota city and Nagoya city. J. East. Asia Soc. Transp. Stud. 2015, 11, 626–639. [Google Scholar]
- Zhong, M.; Hunt, J.D.; Lu, X. Studying differences of household weekday and weekend activities: A duration perspective. Transp. Res. Rec. 2008, 2054, 28–36. [Google Scholar] [CrossRef]
- Jung, H.; Silva, R.; Han, M. Scaling trends of electric vehicle performance: Driving range, fuel economy, peak power output, and temperature effect. World Electr. Veh. J. 2018, 9, 46. [Google Scholar] [CrossRef]
- Ito, H. Toyota as an environmental model city: Is its eco-policy recognized? J. Sustain. Dev. 2014, 7, 70. [Google Scholar] [CrossRef][Green Version]
- Zanni, A.M.; Ryley, T.J. The impact of extreme weather conditions on long distance travel behaviour. Transp. Res. Part A Policy Pract. 2015, 77, 305–319. [Google Scholar] [CrossRef]
- Hidrue, M.K.; Parsons, G.R.; Kempton, W.; Gardner, M.P. Willingness to pay for electric vehicles and their attributes. Resour. Energy Econ. 2011, 33, 686–705. [Google Scholar] [CrossRef]
- Motte-Baumvol, B.; Massot, M.H.; Byrd, A.M. Escaping car dependence in the outer suburbs of Paris. Urban Stud. 2010, 47, 604–619. [Google Scholar] [CrossRef]
- Manaugh, K.; Miranda-Moreno, L.F.; El-Geneidy, A.M. The effect of neighbourhood characteristics, accessibility, home–work location, and demographics on commuting distances. Transportation 2010, 37, 627–646. [Google Scholar] [CrossRef]
- Van Acker, V.; Witlox, F. Commuting trips within tours: How is commuting related to land use? Transportation 2011, 38, 465–486. [Google Scholar] [CrossRef]


| Variables | Mean (or %) | Minimum | Maximum |
|---|---|---|---|
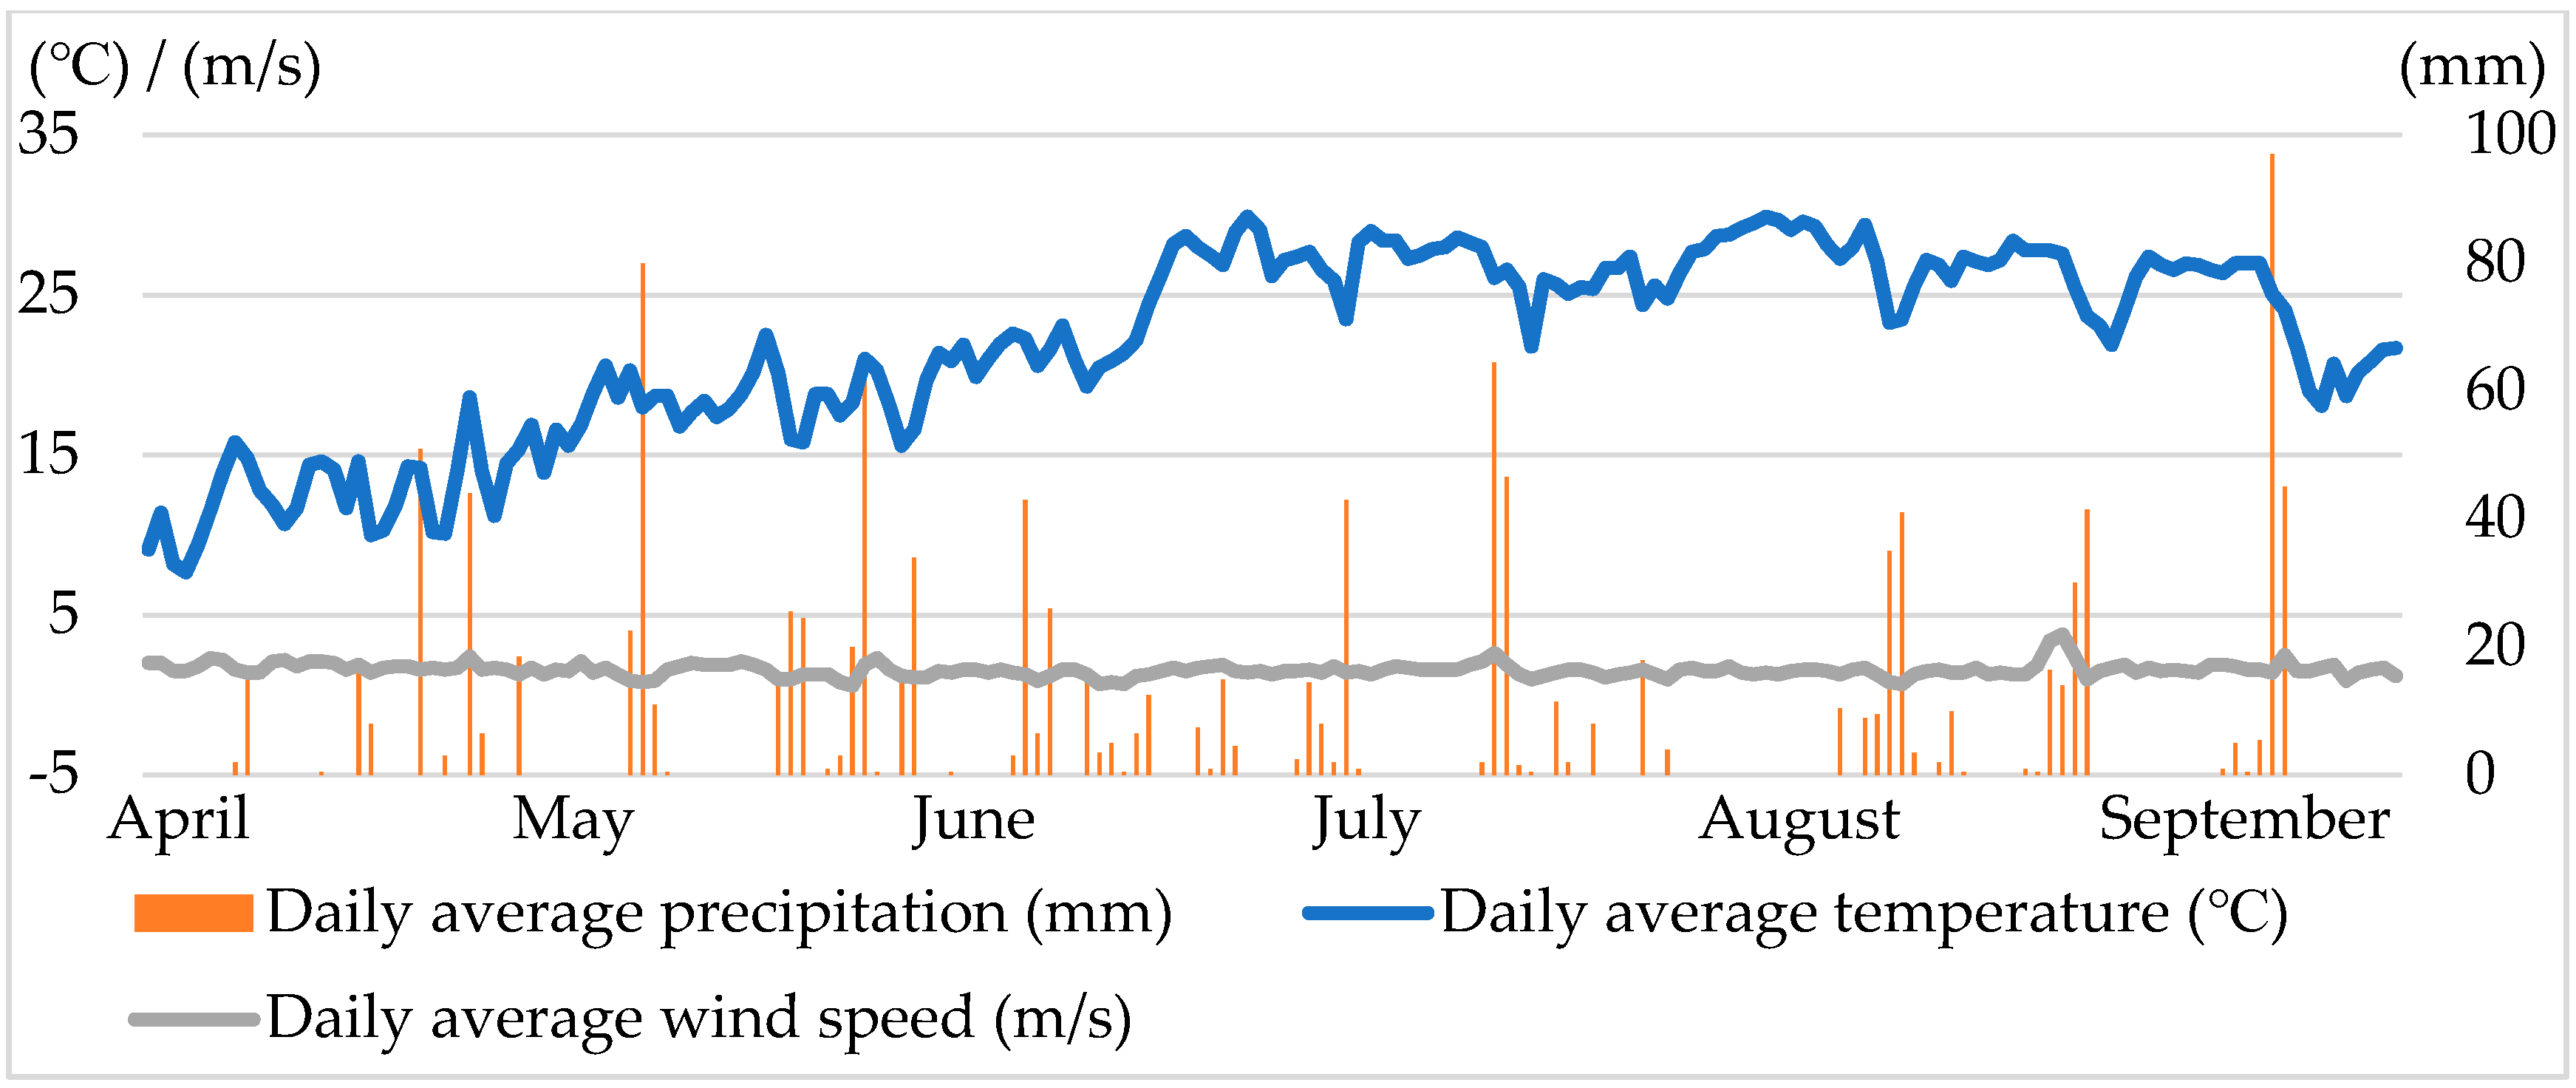
| Daily average temperature (°C) | 22.05 | 7.7 | 29.9 |
| Daily average precipitation (mm) | 6.78 | 0 | 97 |
| Daily average wind speed (m/s) | 1.56 | 0.6 | 3.8 |
| Weekday dummy (1 if weekday, 0 otherwise) | 69.95% | 0 | 1 |
| Engine size (100 cc) | 19.19 | 9.9 | 34.5 |
| Fuel efficiency (jc08-mode, km/L) | 18.53 | 8.8 | 29.6 |
| Price of vehicle (100,000 yen) | 23.42 | 10.6 | 33.5 |
| Vehicle type (1 if hybrid vehicle, 0 otherwise) | 32.37% | 0 | 1 |
| Driver’s age | 45.70 | 23 | 72 |
| Gender (1 if male, 0 otherwise) | 90.84% | 0 | 1 |
| Job description (1 if working in Toyota City government, 0 otherwise) | 53.35% | 0 | 1 |
| Job description (1 if working for car manufacturer, 0 otherwise) | 24.08% | 0 | 1 |
| Job description (1 if working for public facility, 0 otherwise) | 8.61% | 0 | 1 |
| Job description (1 if working as company staff, 0 otherwise) | 5.16% | 0 | 1 |
| Job description (1 if working for driving school, 0 otherwise) | 3.90% | 0 | 1 |
| Job description (1 if working as association staff, 0 otherwise) | 3.05% | 0 | 1 |
| Job description (1 if unemployed, 0 otherwise) | 1.85% | 0 | 1 |
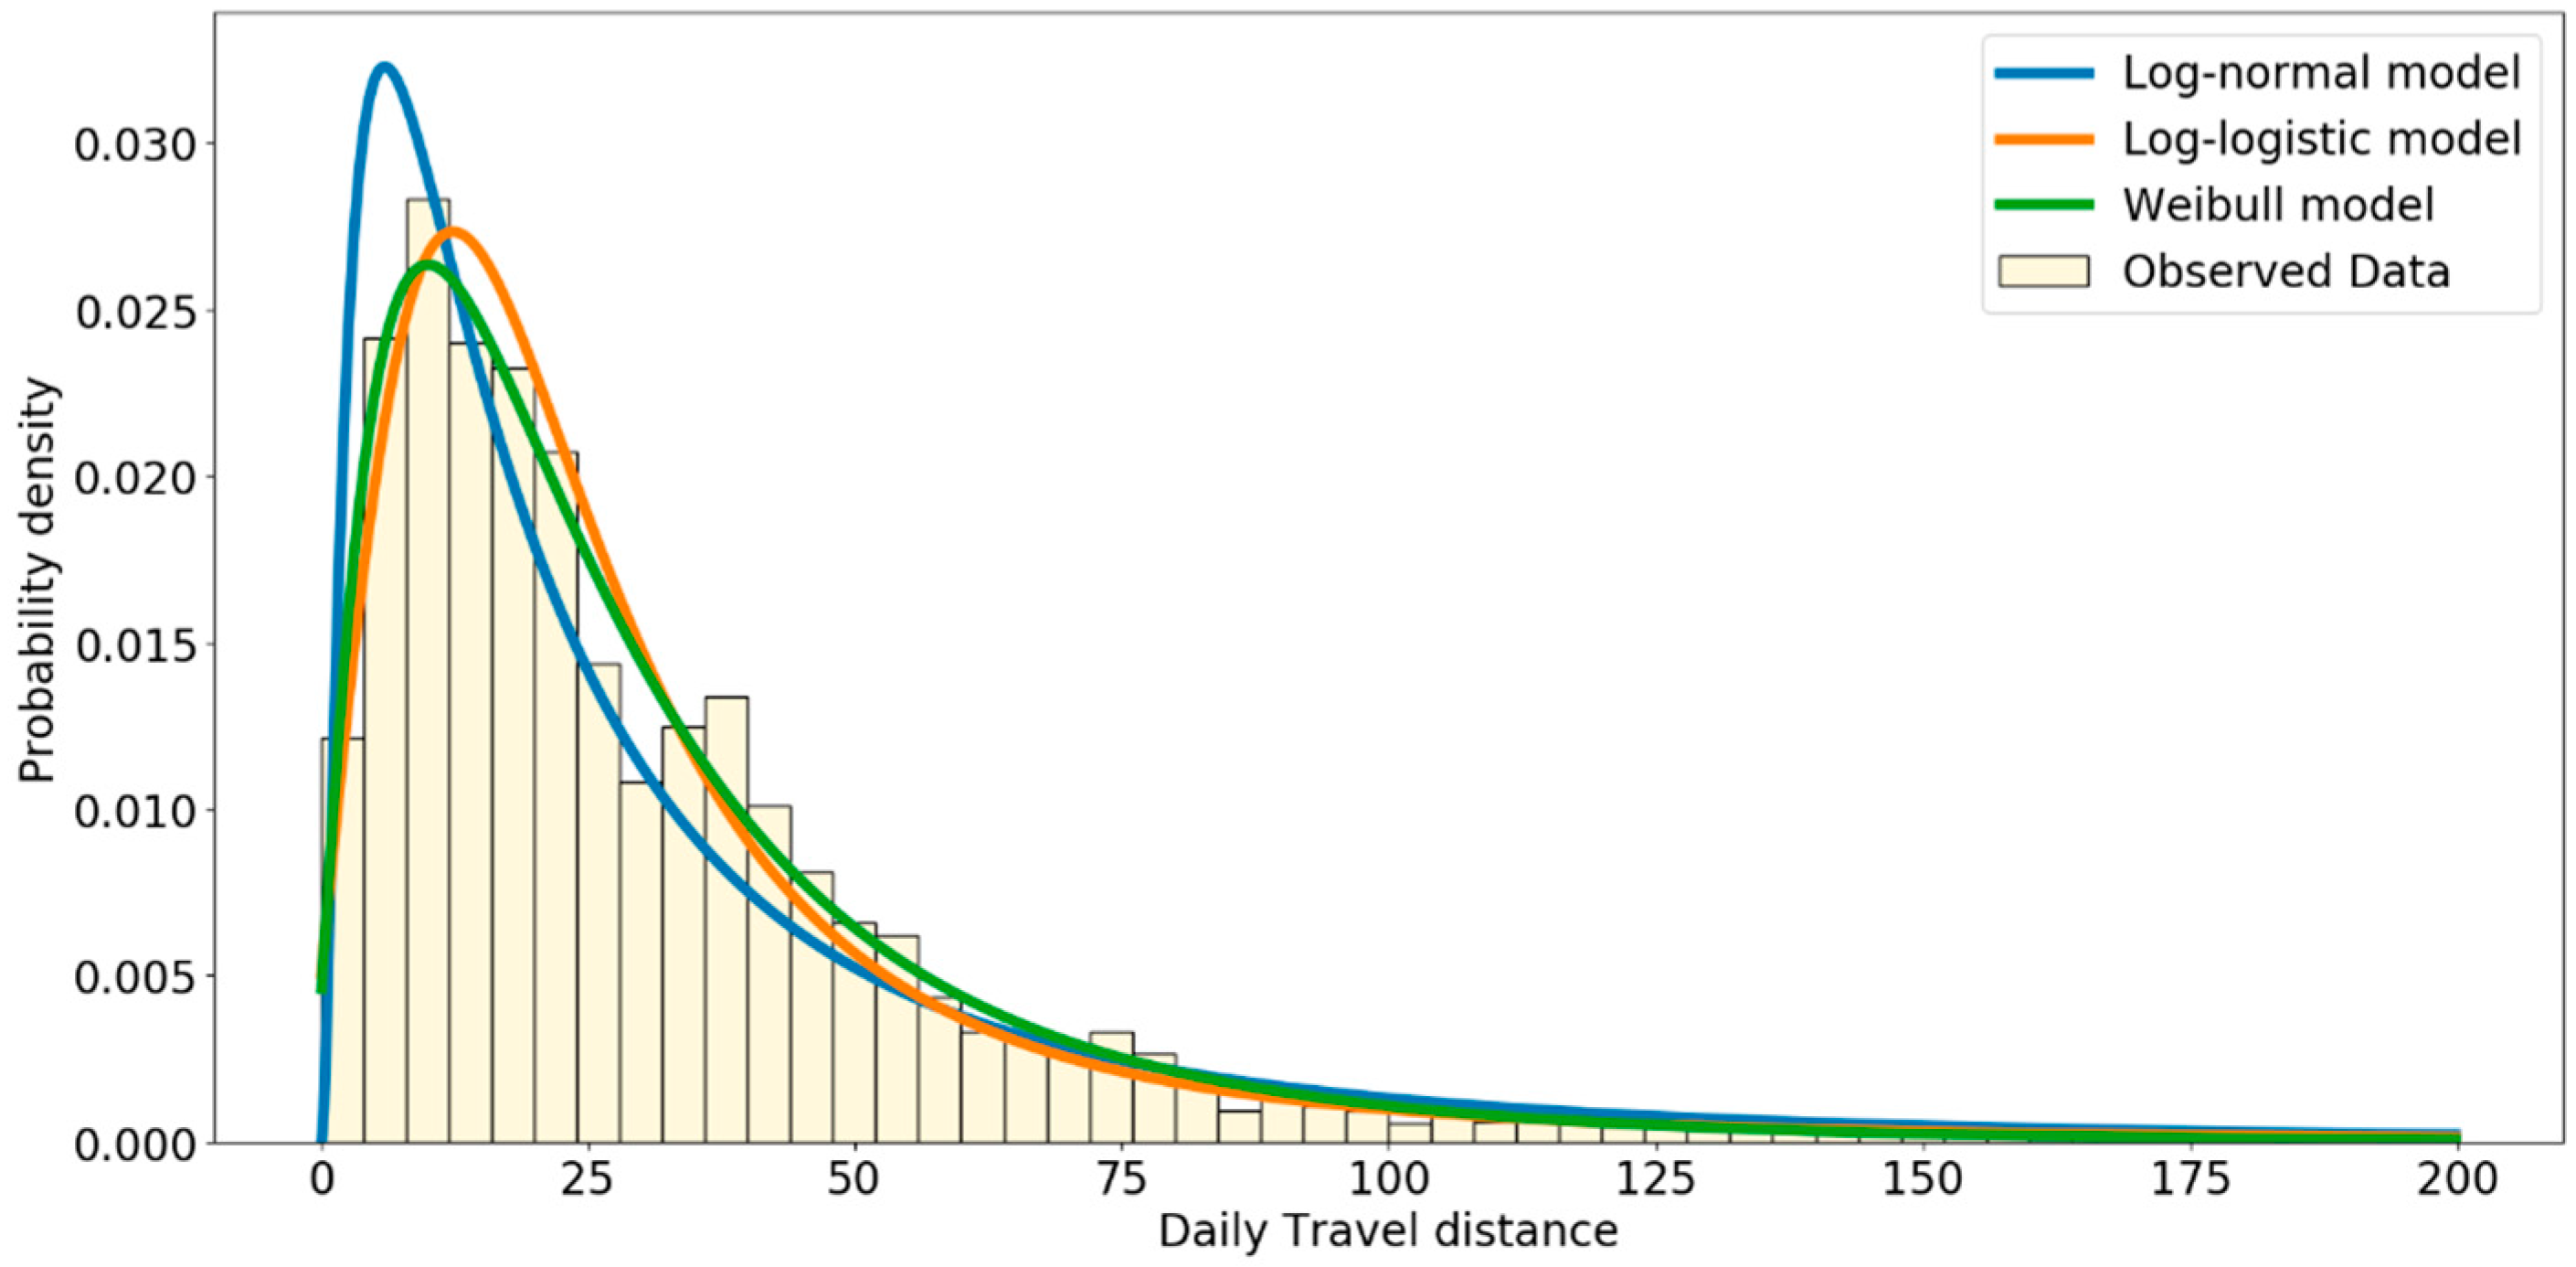
| Dependent Variable | Logarithm of Daily Travel Distance | ||
|---|---|---|---|
| Distribution | Location Parameter | Log-Likelihood | |
| Lognormal | 3.06 | 1.130 | −23,322.8 |
| Log-logistic | 3.12 | 0.580 | −22,154.5 |
| Weibull | 3.57 | 0.965 | −22,539.7 |
| Dependent Variable: Natural Logarithm of Daily Travel Distance (km) | Lognormal Duration | Weibull Duration | Log-Logistic Duration | |||
|---|---|---|---|---|---|---|
| Explanatory Variables | Coefficient | Prob. |z|>Z | Coefficient | Prob. |z|>Z | Coefficient | Prob. |z|>Z |
| Constant | 3.14325 | 0.0000 | 3.32110 | 0.0000 | 3.28881 | 0.0000 |
| Daily average temperature (°C) | 0.00359 | 0.0135 | 0.00325 | 0.0020 | 0.00429 | 0.0015 |
| Daily average precipitation (mm) | −0.00197 | 0.0017 | −0.00283 | 0.0000 | −0.00172 | 0.0016 |
| Daily average wind speed (m/s) | −0.06030 | 0.0031 | −0.05800 | 0.0003 | −0.04074 | 0.0413 |
| Weekday dummy (1 if weekday, 0 otherwise) | −0.05296 | 0.0043 | −0.25470 | 0.0000 | −0.09310 | 0.0000 |
| Engine size (100 cc) | −0.02054 | 0.0000 | −0.01878 | 0.0000 | −0.02712 | 0.0000 |
| Fuel efficiency (jc08-mode, km/L) | 0.00911 | 0.0837 | 0.02061 | 0.0000 | 0.01034 | 0.0266 |
| Price of vehicle (100,000 yen) | 0.01468 | 0.0000 | 0.02662 | 0.0000 | 0.01734 | 0.0000 |
| Vehicle type (1 if hybrid vehicle, 0 otherwise) | 0.22142 | 0.0010 | 0.03746 | 0.4480 | 0.23627 | 0.0001 |
| Age | −0.00601 | 0.0000 | −0.00827 | 0.0000 | −0.00688 | 0.0000 |
| Gender (1 if male, 0 otherwise) | 0.09815 | 0.0054 | 0.17672 | 0.0000 | 0.08206 | 0.0121 |
| Job description (1 if working for car manufacturer, 0 otherwise) | −0.09112 | 0.0001 | −0.00198 | 0.9002 | −0.12268 | 0.0000 |
| Job description (1 if working for public facility, 0 otherwise) | −0.03070 | 0.3526 | 0.08971 | 0.0001 | −0.09606 | 0.0009 |
| Job description (1 if working as company staff, 0 otherwise) | 0.20993 | 0.0000 | 0.18038 | 0.0000 | 0.21507 | 0.0000 |
| Job description (1 if working for driving school, 0 otherwise) | 0.05295 | 0.2587 | −0.02980 | 0.5257 | 0.10149 | 0.0281 |
| Job description (1 if working as association staff, 0 otherwise) | −0.08662 | 0.1038 | 0.02049 | 0.6176 | −0.13689 | 0.0018 |
| Job description (1 if unemployed, 0 otherwise) | −0.25231 | 0.0004 | 0.03304 | 0.3847 | −0.34250 | 0.0000 |
| Scale parameter for survival distribution () | 1.11172 | 0.0000 | 0.93473 | 0.0000 | 0.56312 | 0.0000 |
| Initial log-likelihood LL(0) | −23,322.81 | −22,539.75 | −22,154.52 | |||
| Log-likelihood at convergence LL() | −23,090.43 | −22,129.83 | −21,785.89 | |||
| Likelihood ratios | 464.76 | 819.84 | 737.26 | |||
| Akaike Information Criterion (AIC) | 46,216.86 | 44,295.66 | 43,607.78 | |||
| Dependent Variable: Natural Logarithm of Daily Travel Distance (km) | Lognormal Duration | Weibull Duration | Log-Logistic Duration | |||
|---|---|---|---|---|---|---|
| Explanatory Variables | Coefficient | Prob. |z|>Z | Coefficient | Prob. |z|>Z | Coefficient | Prob. |z|>Z |
| Daily average temperature (°C) | 0.00379 | 0.0005 | 0.00137 | 0.0446 | 0.00000 | 0.9861 |
| Daily average precipitation (mm) | −0.00186 | 0.0048 | −0.00310 | 0.0000 | −0.00149 | 0.0014 |
| Daily average wind speed (m/s) | −0.05944 | 0.0147 | −0.05298 | 0.0002 | −0.04210 | 0.0176 |
| Weekday dummy (1 if weekday, 0 otherwise) | −0.05222 | 0.0000 | −0.28743 | 0.0000 | −0.11532 | 0.0000 |
| Engine size (100 cc) | −0.02003 | 0.0000 | 0.01953 | 0.0000 | −0.02027 | 0.0000 |
| Fuel efficiency (jc08-mode, km/L) | 0.00920 | 0.0000 | 0.06357 | 0.0000 | 0.03423 | 0.0000 |
| Price of vehicle (100,000 yen) | 0.01474 | 0.0000 | 0.03324 | 0.0000 | 0.03107 | 0.0000 |
| Vehicle type (1 if hybrid vehicle, 0 otherwise) | 0.21835 | 0.0000 | −0.59288 | 0.0000 | −0.06972 | 0.1465 |
| Age | −0.00540 | 0.0000 | −0.00534 | 0.0000 | −0.00782 | 0.0000 |
| Gender (1 if male, 0 otherwise) | 0.09680 | 0.0000 | 0.19651 | 0.0000 | 0.28473 | 0.0000 |
| Job description (1 if working for car manufacturer, 0 otherwise) | −0.08985 | 0.0000 | 0.21099 | 0.0000 | −0.00159 | 0.9211 |
| Job description (1 if working for public facility, 0 otherwise) | −0.03028 | 0.0000 | 0.16471 | 0.0000 | −0.28980 | 0.0000 |
| Job description (1 if working as company staff, 0 otherwise) | 0.20702 | 0.0000 | 0.10726 | 0.0012 | −0.03591 | 0.2540 |
| Job description (1 if working for driving school, 0 otherwise) | 0.05222 | 0.0000 | 0.39482 | 0.0000 | 0.03742 | 0.3017 |
| Job description (1 if working as association staff, 0 otherwise) | −0.08542 | 0.0000 | 0.14466 | 0.0009 | 0.45943 | 0.0000 |
| Job description (1 if unemployed, 0 otherwise) | −0.24880 | 0.0000 | 0.55913 | 0.0000 | 0.72097 | 0.0000 |
| Constant (means for random parameters) | 3.09958 | 0.0000 | 1.61064 | 0.0000 | 2.31731 | 0.0000 |
| Constant (scale parameter for random parameters) | 0.00922 | 0.0000 | 0.50549 | 0.0000 | 0.68278 | 0.0000 |
| Scale parameter for survival distribution () | 1.11058 | 0.0000 | 0.84781 | 0.0000 | 0.45431 | 0.0000 |
| Initial log-likelihood LL(0) | −23,322.81 | −22,539.75 | −22,154.52 | |||
| log-likelihood at convergence LL() | −23,077.00 | −20,714.03 | −19,353.08 | |||
| Likelihood ratios | 491.62 | 3651.44 | 5602.88 | |||
| Akaike Information Criterion (AIC) | 46,192.00 | 41,466.06 | 38,744.16 | |||
© 2020 by the authors. Licensee MDPI, Basel, Switzerland. This article is an open access article distributed under the terms and conditions of the Creative Commons Attribution (CC BY) license (http://creativecommons.org/licenses/by/4.0/).
Share and Cite
He, J.; Yamamoto, T.; Miwa, T.; Morikawa, T. Hazard Duration Model with Panel Data for Daily Car Travel Distance: A Toyota City Case Study. Sustainability 2020, 12, 6331. https://doi.org/10.3390/su12166331
He J, Yamamoto T, Miwa T, Morikawa T. Hazard Duration Model with Panel Data for Daily Car Travel Distance: A Toyota City Case Study. Sustainability. 2020; 12(16):6331. https://doi.org/10.3390/su12166331
Chicago/Turabian StyleHe, Jiahang, Toshiyuki Yamamoto, Tomio Miwa, and Takayuki Morikawa. 2020. "Hazard Duration Model with Panel Data for Daily Car Travel Distance: A Toyota City Case Study" Sustainability 12, no. 16: 6331. https://doi.org/10.3390/su12166331
APA StyleHe, J., Yamamoto, T., Miwa, T., & Morikawa, T. (2020). Hazard Duration Model with Panel Data for Daily Car Travel Distance: A Toyota City Case Study. Sustainability, 12(16), 6331. https://doi.org/10.3390/su12166331