1. Introduction
The sustainable development of a city/region/country is generally linked to the ability of its public decision makers (the governance) to pursue policies able to promote a rational use and consumption of both natural and human resources. Within this context, the type and quality of the decision-making processes implemented may influence the result of the planning process (success vs. failure). Within the transport sector, the literature and the media abound in examples of transportation planning failures affecting both public and private subjects (see the literary review in
Section 2.1). The main causes of these failures are related to unpredicted events modifying the input scenario for long-term projects, but also to the decision-making implemented, in term of mistakes—unintended or otherwise—in forecasting the effects (implementation times and costs, ridership, revenues, external impacts), and the inability to implement the project as intended. Similarly, some problems remain unsolved as potentially ‘beneficial’ projects fail to reach sufficient consensus among stakeholders, either being delayed or cancelled altogether. Furthermore, the quality of transportation planning and design could improve if the professionals involved became more aware of the nature of the process they were involved in and the possible roles they could play. Indeed, problems in effective decision making in transportation also stem from the gap still existing between the traditional technical approach and real-life decision-making processes. The decision-making process has, or should have, some form of ‘rationality’ and that quantitative tools, i.e., statistical analyses and mathematical models, play a central role in it, contributing to actually making decisions or at least influencing them.
The transport sector is often the center of political and scientific debate on sustainability due to its negative impacts on the environment (e.g., emissions and energy consumptions) and socio-economic systems (e.g., welfare). As is known, the sustainable development of a territorial area is based on the jointly sustainable development of the environmental, economic, and social systems. Precisely, environmental sustainability entails improvement in the quality of environment and reduction of negative emissions and energy consumption (e.g., greenhouse gasses emissions; pollutant emissions; impacts in other sectors). By contrast, social sustainability entails improvement in the quality of life, social equity (e.g., easy access to activities and opportunities), but also consensus building among the public choices (e.g., social acceptability of the investments choices related to the transport system). Finally, economic sustainability entails making the mobility of people more effective and ensuring that the benefits (impacts) produced by the interventions are greater than its realization costs.
Among the main sustainable transport policies, the promotion/development of the public transport system (e.g., bus, metro, train transport services), discouraging the usage of the private transport modes (e.g., private car), could be considered one of the most sustainable transport policies for improving the transport system, reducing its negative externalities (e.g., pollutant emissions). Within this topic, the effective and sustainable design of public transport services is a crucial issue that may affect both local economies and social inclusion. Indeed, transport accessibility of households, businesses, and retail activities is one of the main drivers that influence location choices and sustainable development and where the public transport services may play a key (positive) role. Furthermore, the economic crisis of the 2009 and the current ones caused by the COVID-19 pandemic has further limited the funds available for public services, including the transport sector. For example, in several Italian regions, a significant reduction in funds has been observed, producing consequent cutbacks in public services provided.
In this context, the rational design of public transport services becomes a fundamental activity, strictly correlated with the sustainable development of both the environment and socio-economic systems (e.g., welfare), limited to available funds (constraints). The thesis discussed in this paper is that the (rational) decision-making process followed to design transportation solutions is itself a key element of sustainability, because it can influence its achievement (success or failure of the planning process). There are numerous studies (
Section 2.1) that focus on the design of mass-transit systems, usually considering only technical aspects of the problem (e.g., user costs and benefits/costs for the operators), while social impacts and externalities (sustainability) and consensus building (stakeholder engagement) have been largely overlooked, and this paper aims to contribute to covering this gap.
Starting from these considerations, the aim and the main originality of this paper has been to propose an innovative decision-making methodology for designing local public transport services based on a rational process with stakeholder engagement, aiming to perform a sustainable development perspective. The proposed methodology combines technical aspects (e.g., quantitative methods and models), social and political issues, equity challenges, and it aims to obtain a design solution that can be also accepted by the whole community. Within this topic, the technical aspects (i.e., the quantitative design methods and models) cover a central role. A transit network multi-criteria design problem was proposed for the scope, which is a fundamental—and extensively studied—component of the more general public transport planning issue (see the literary review in
Section 2.2). Furthermore, although multi-actor/multi-criteria design methods have been commonly applied in literature with respect to these research issues, to date, there has been no explicit attempt to incorporate design and institutional constraints in conjunction with stakeholder interests, which is one of the main originalities of this paper.
The proposed theoretical design methodology has been also applied to a case study in order to verify its applicability to a real context (in term of strengths and weaknesses produced), consisting of the design of the local public transport plan of the province of Foggia in southern Italy. Precisely, within a rational design of local public transport services, one aspect of the problem concerns equity in the distribution of resources and services. Since local public transport is mainly financed by public money, in theory, up to 65% under Italian law (beyond this value in practice), aspects of equity in the distribution of resources must necessarily be considered as proposed in this research.
The paper is organised as follows:
Section 2 provides an analysis of the current literature with respect to both transport planning decision-making processes and technical features for transport services design;
Section 3 describes the proposed design methodology;
Section 4 presents the case study and the main results. Finally, conclusions and research perspectives are reported in
Section 5.
3. The Proposed Rational Decision-Making Methodology for the Design of Public Transport Services
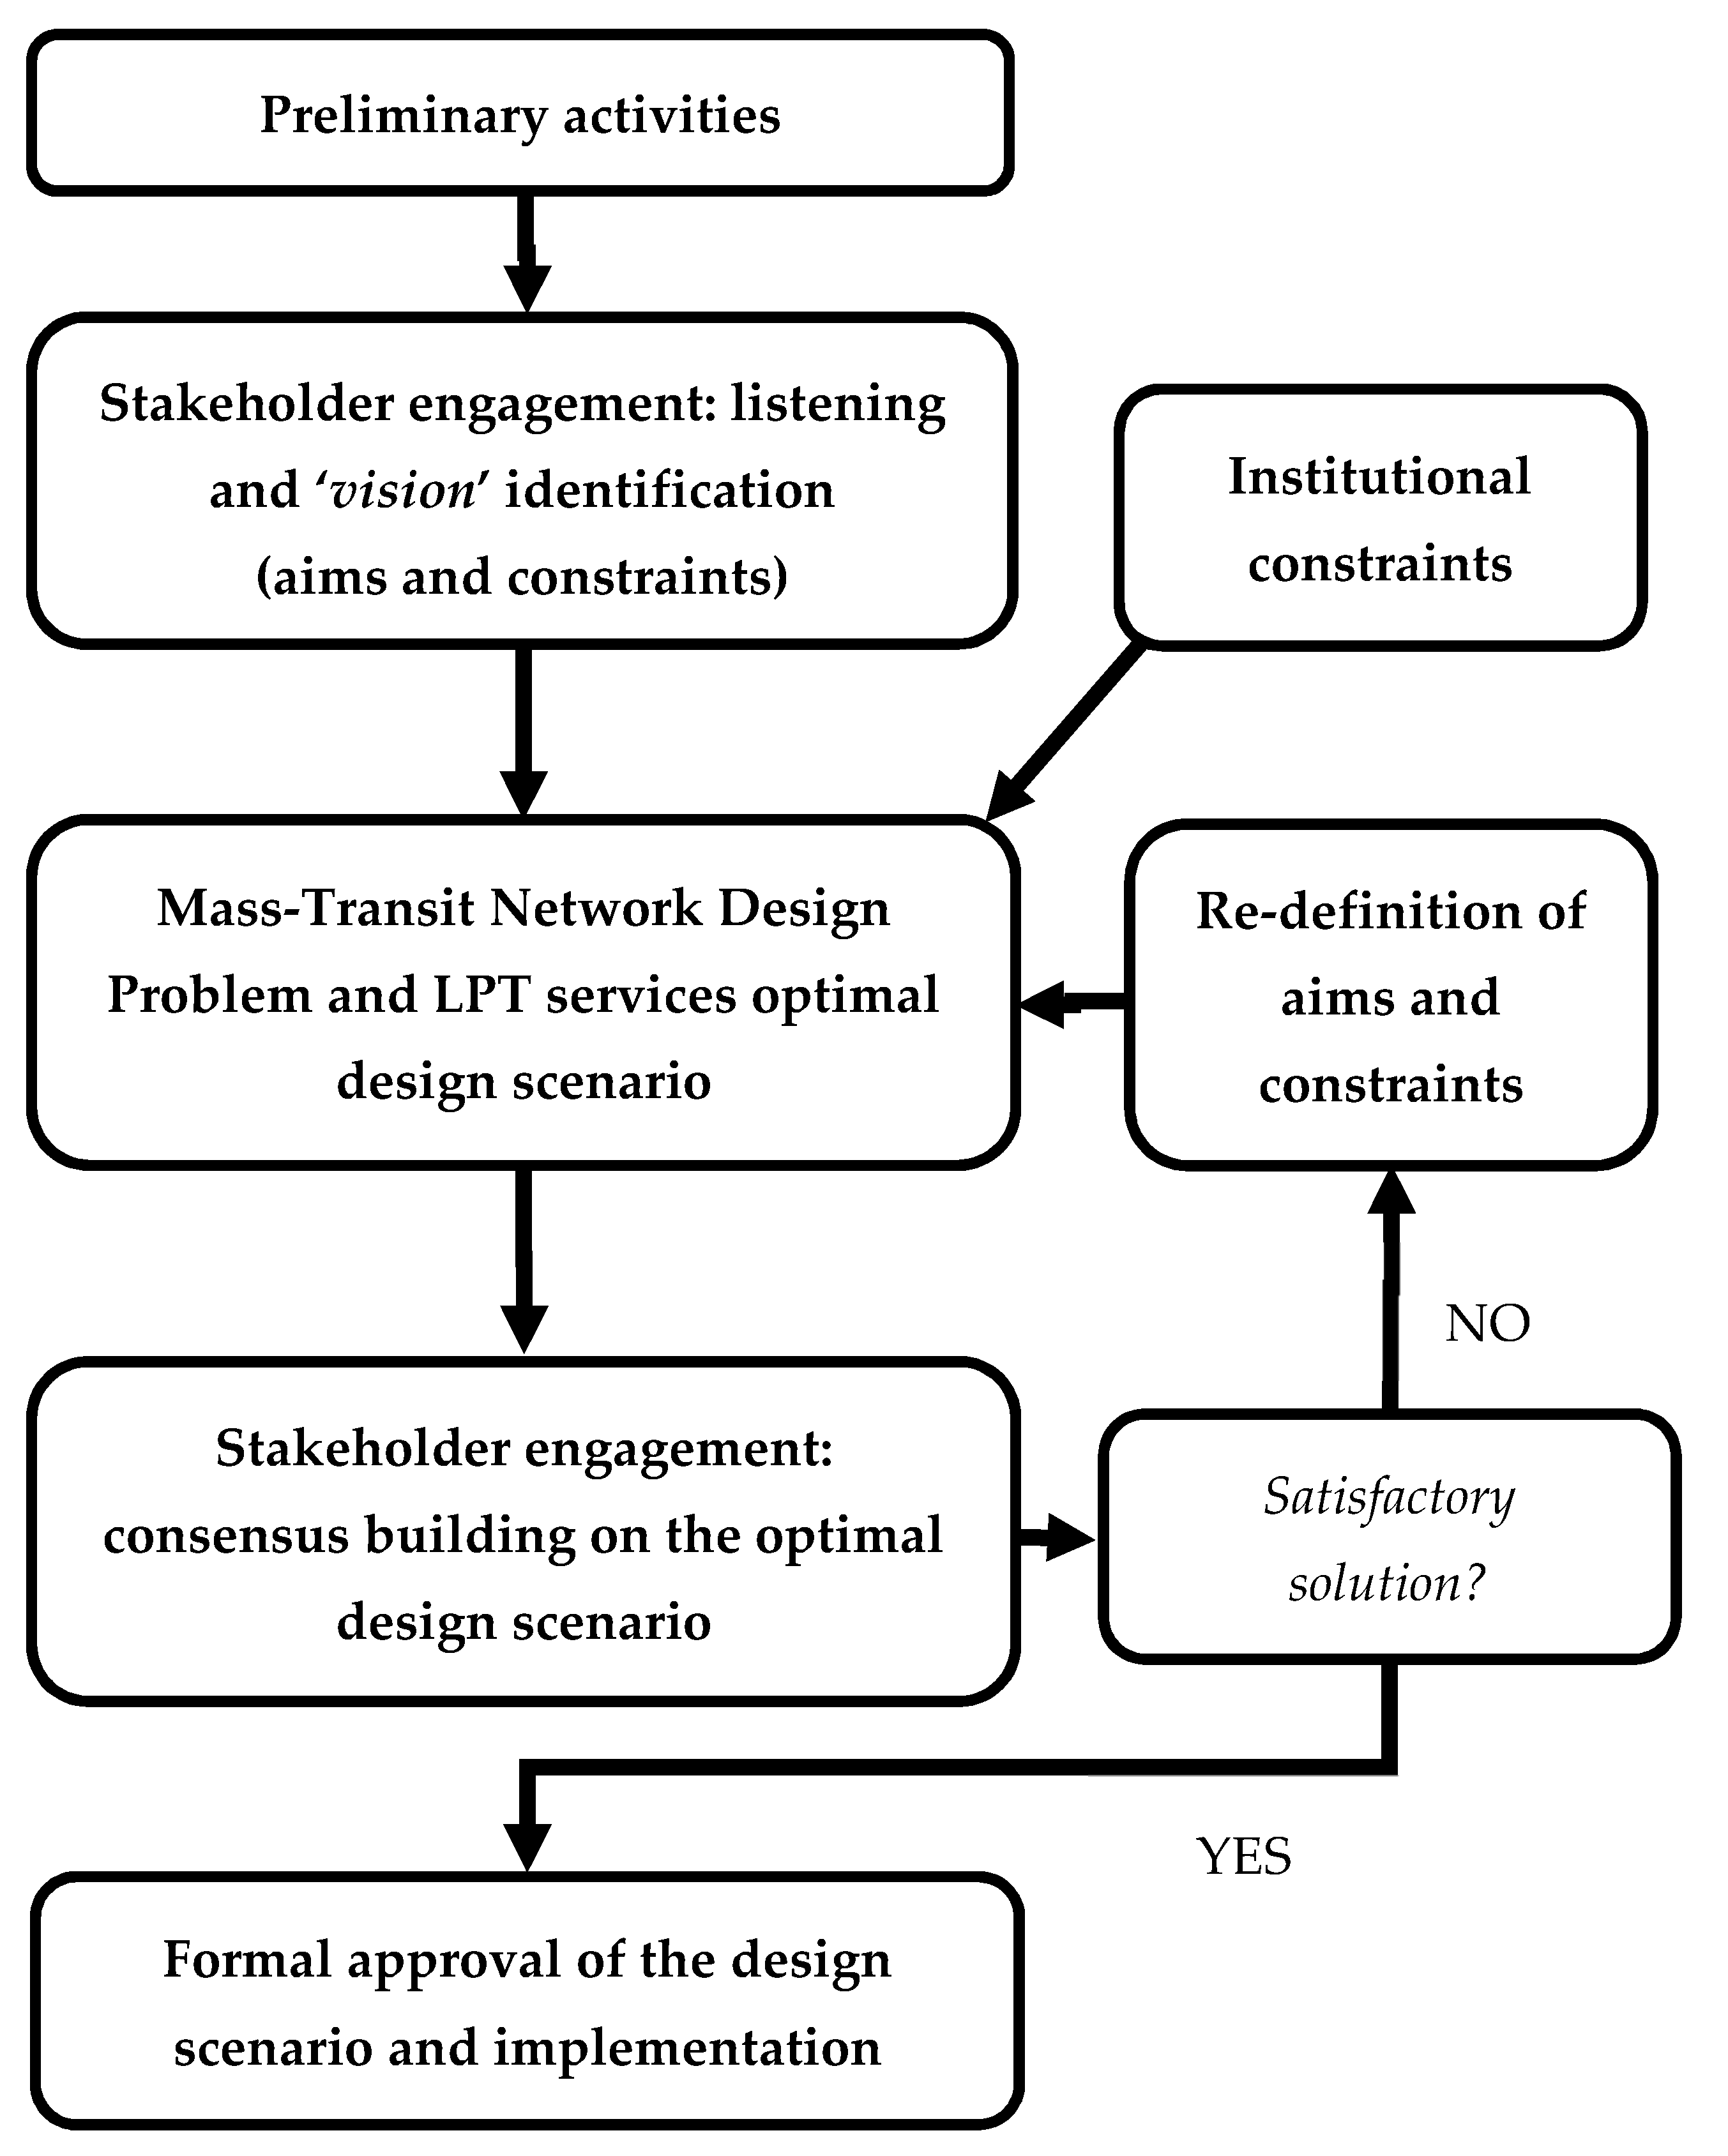
As said, the main aim of this paper is to propose an innovative methodology for designing local public transport services based on a rational decision-making process with stakeholder engagement, aiming to perform a sustainable development perspective. A ‘satisfactory’ transportation planning process should combine the benefits of a rational decision-making model with stakeholder engagement. By ‘satisfactory’ we mean a process that leads to decisions that are ‘as efficient as possible’ given the context and, once implemented, reduce the risk of unavoidable uncertainties both in context and in technical analysis. To this end, the decision-making process should be transparent (i.e., decisions should be traceable and justifiable) and participative (i.e., decisions should be shared by the largest possible number of decision-makers and stakeholders). Decisions are rational if they are based on the comparison of alternatives (plans/projects), with respect to their expected effects (impacts). However, decisions are generated by exploring alternatives until a solution is reached that satisfies the ‘vision’ of the decision-makers and as many stakeholders as possible.
Many definitions of rationality have been proposed in the literature across the years. The definition of rational decision-making ‘as acting in the best possible way considering the aims and the constraints’ ([
37]) is general enough to be compatible with different decision-making approaches. However, according to [
16], to make this definition operational it is necessary to follow some minimal (necessary) requirements for rational decisions. Indeed, in order to be rational, a decision has to be consistent, comparative, aware, and flexible. The comparison of alternative solutions is arguably the most critical phase. A (broad) public consensus is required to define the ‘satisfactory’ alternative, i.e., that with a higher probability of being implemented. This decision stage can be supported by stakeholder consultation and participation, where different engagement tools can be adopted depending on the specific nature of the decision to be made.
Starting from these considerations, the proposed methodology (
Figure 1) consists of different interconnected activities with some loops (retroactions) as detailed in the next subsections.
3.1. Preliminary Activities
The first (preliminary) activities proposed, may be formulated by means of the following:
- (a)
Analysis of the legal and planning framework;
- (b)
Estimation and identification of mobility needs (transport users);
- (c)
Analysis of current transport supply and related supply model;
- (d)
Analysis of the current scenario and identification of its main critical issues;
- (e)
Definition of a participated ‘vision’ (aims) for mobility in the study area consistent with the available constraints;
- (f)
Definition of participated ‘criteria’ for choosing the best public transport services to implement.
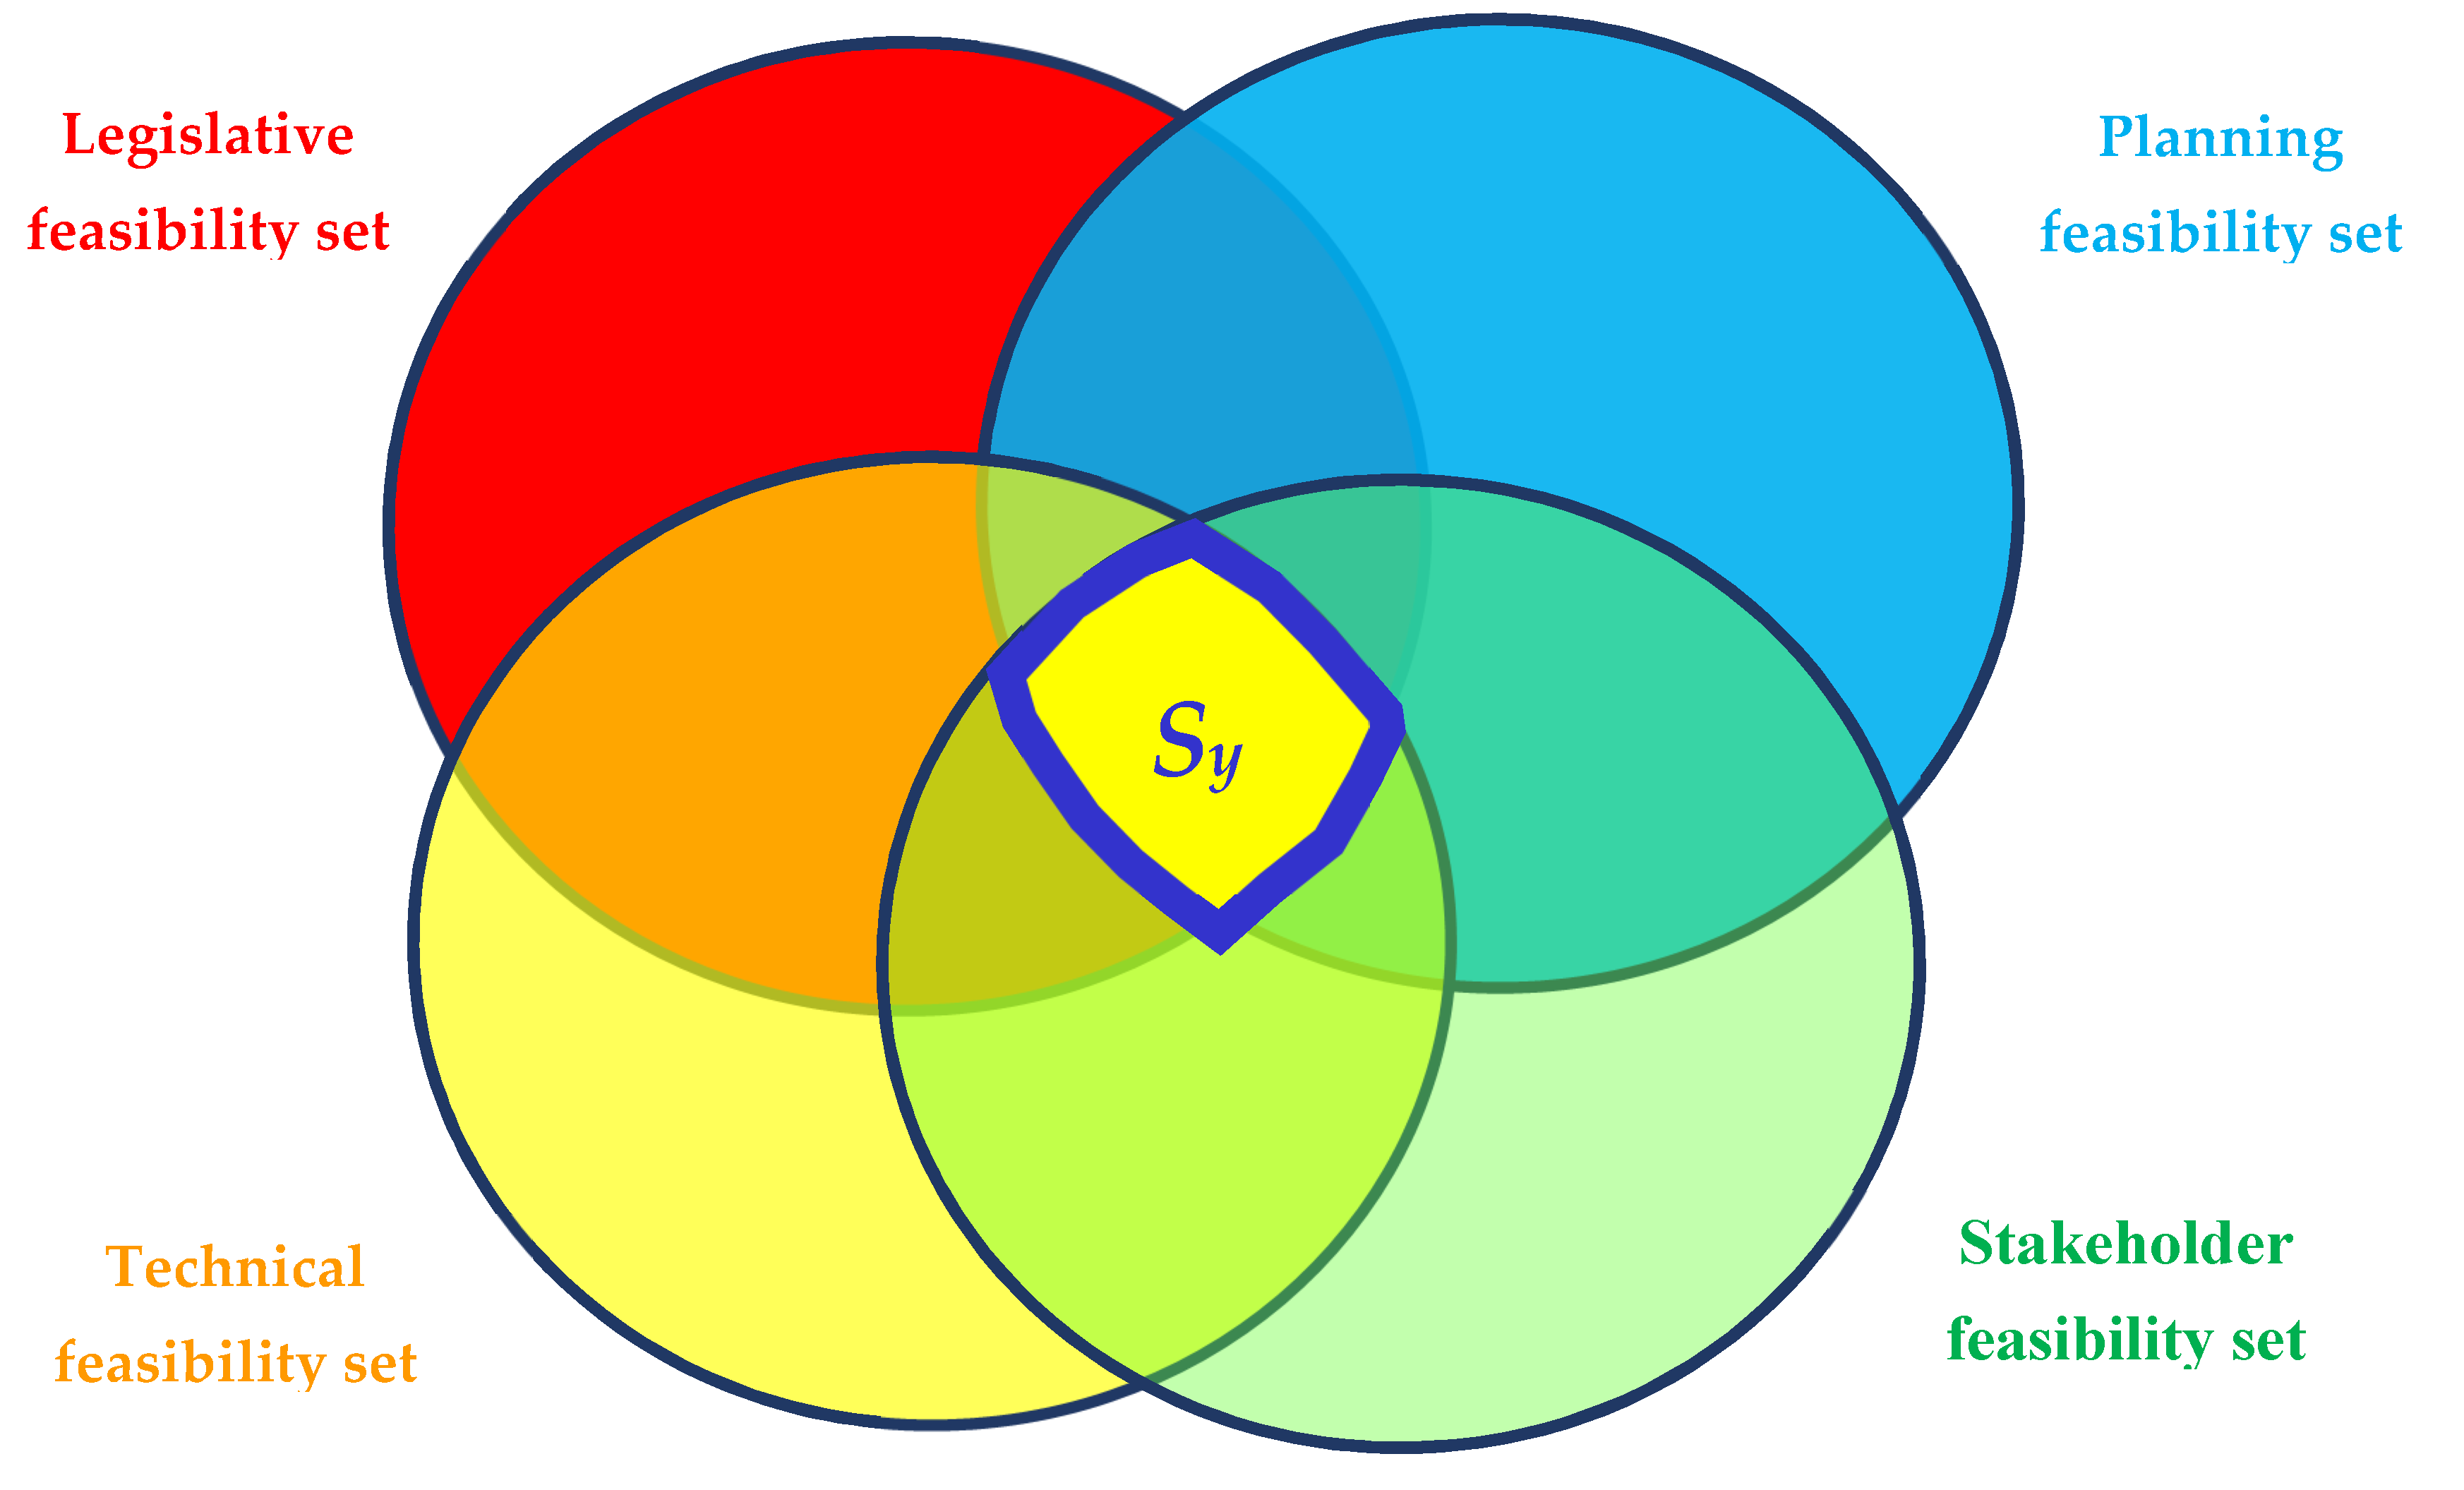
The first activity consists of analysing all national/local laws and regulations that influence and limit the feasible solutions of the problem (design scenarios). Hence, a first set of feasible solutions compatible with the legal framework may be identified and indicated as SL.
By the same token, previous or hierarchically superior plans may set boundaries or oblige the design solution to take a certain direction. However, in some cases, it is necessary to incorporate and coordinate actions of inferior plans. This analysis allows a second set of feasible solutions to be identified that is compatible with the planning framework and indicated as SP.
The second activity consists in estimating the transport demand in terms of all transport modes origin–destination matrices, representing the average number of users (for each transport mode) travelling from an origin o to a destination d. These matrices also refer to different time periods, such as peak hours, off-peak hours, working days, pre-holidays, or holidays. Considering all transport modes available in the study area, it is possible to estimate both the current travel demand (e.g., users that currently travel by public transport) but also the potential demand that could be attracted by new public transport services and thus shifted from non-sustainable transport modes.
Analysis of current transport supply allows all available transport modes and the corresponding transport performance in terms of, for example, average travel time, waiting time, and monetary costs to be determined for each origin–destination pair and for each time interval. All these attributes are used for defining the supply mathematical model, which is necessary for simulating the multimodal transportation system.
3.2. Mass-Transit Network Design Problem and Local Public Transport (LPT) Services Optimal Design Scenario
The definition of local public transport services may be considered as one of the issues addressed by the well-known Mass-Transit Network Design Problem (MTNDP) and may therefore be formulated as a multidimensional constrained optimisation problem (e.g., [
38]), that is:
subject to:
with:
where
y is the vector of decisional variables (such as line routes, service frequencies, bus capacities, etc.) to be optimised;
y^ is the optimal value of
y;
Z(·) is the objective function to be minimised;
f * is the vector of passenger flows;
Λ(·) is the assignment function;
Γ(·) is the vector of resource use;
B is the vector of budget constraints; and
Sy is the feasibility set of vector
y.
In this context, the problem (1)–(4) consists of identifying the optimal value of y (indicated as y^), among those belonging to the feasibility set Sy, which minimises Z and jointly satisfies the assignment and the budget constraints.
The assignment constraint, expressed by (2), ensures coherence between transportation system performance and user choices. Indeed, as widely shown by [
39,
40], transportation system performance depends on the number of users (as well as vehicles) that jointly want to use the same facility. For their part, users, modelled as rational decision-makers according to the approach proposed by [
41], tend to choose the mobility alternative, which minimises their perceived generalised cost. Hence, this recursive dependence between transportation system performance and user choices may be formulated as a fixed-point problem, whose theoretical properties, as well as solution algorithms, can be found in [
19,
42].
The budget constraint, described by (3), provides the resource use as a function of the considered scenario (described by y) and user choices (described by f *), which may be expressed, for instance, in terms of number of vehicles required, number of annual vehicle-kilometres, operational costs, ticket revenues, and subsidies required. These resources are limited and their upper bounds (i.e., constraint values) are expressed by vector B.
Finally, the feasibility constraints, summarised with (4), limit the solutions to those both technically feasible and politically/socially acceptable by the parties involved such as users, labour unions, public transport companies, and local administrations. In these constraints, it is possible to introduce a constraint about equity.
The objective function to be minimised, indicated as
Z(⋅), may have different formulations. Often, it is formulated in terms of total cost minimisation (see [
38]). In the objective function:
Each term has to be quantified;
Suitable substitution rates among its terms, such as the Value of Time, which expresses the monetary value of level-of-service attributes (walking, waiting, travel, and transfer times), have to be provided;
All direct costs (for users) and indirect costs (for society) have to be considered, including those produced by other transportation systems or borne by users of other modes;
Its formulation has to be acceptable by stakeholders according to the engagement process described in
Section 3.4.
In the case study described in
Section 4, stakeholders showed great interest in the reduction in user generalised costs (i.e., the sum of all times and monetary costs incurred to make a trip) and in firm operational costs (i.e., the sum of all costs incurred to implement the public transport service). Likewise, they showed interest in a plan that was also ‘equitable’ for residents in the study area. Therefore, we (a) optimised the public transport system according to the objective function suggested by stakeholders and (b) adopted an equity constraint in the model. The latter constraint is verified at the end of the procedure by comparing the equity of the final scenario with that of the current scenario. If the final solution complies with the constraint, i.e., there is no loss of equity, the procedure ends; otherwise, some decisions need to be reconsidered in order to redress the equity issue in the plan.
However, details on the models and related solution algorithms for solving problem (1) subject to relations (2)–(4), in the case of public transport systems, may be found in [
43,
44]. Almost all methodologies proposed in the literature are based on the adoption of a fixed feasibility set
Sy, whose definition represents an a priori external task. In this context, the innovativeness of the present paper concerns the definition of an iterative procedure for identifying dynamically the feasibility set
Sy and the related optimal design solution as part of the planning task.
Before analysing the current scenario, some a priori rules for determining the optimal operating interval of the different kinds of public transport services to be implemented need to be set. We may consider:
Public transport services with fixed routes and fixed frequencies, generally indicated as ordinary services;
Public transport services with fixed routes and variable frequencies, generally indicated as specific services;
Public transport services with variable routes and variable frequencies, generally indicated as Dial-a-Ride services.
The next activity consists in simulating the interaction between travel demand and the supply model so as to obtain the user flows on the various elements of the transportation supply. In this phase, it is possible to identify both the ‘high-demand corridors’, where the current and potential demand is significant and the ‘low-demand areas’, where traditional public transport services are of little utility. Moreover, it is possible to identify congested services to be strengthened, for instance by means of additional runs, additional lines, or by modifying the transport technology (from buses to rail-based systems). At the same time, this phase also reveals underused services to be resized, optimised, or cancelled.
Following these phases, the first proposal of the design scenario (plan) obtained by interaction with the client (i.e., a local administration) may be laid down. It is worth noting that in this phase the technical set of feasible solutions is also determined, indicated as ST.
However, as shown by
Figure 1, the proposed scenario has to be submitted to the stakeholders’ approval (see the next subsection) in order to receive a positive judgment from trade unions, mayors and municipalities, companies, local administrators, consumer associations, users, and so forth. Hence, it is necessary to begin an iterative process between stakeholders’ approval and planning proposals, which has to converge, using acceptance, rejection, and/or mediation of observations (i.e., alternative proposals). Obviously, each iteration/interaction requires a new formulation of the plan proposal. Moreover, in this phase, a set of feasible solutions may be identified that is compatible with stakeholders’ requirements and indicated as
SS.
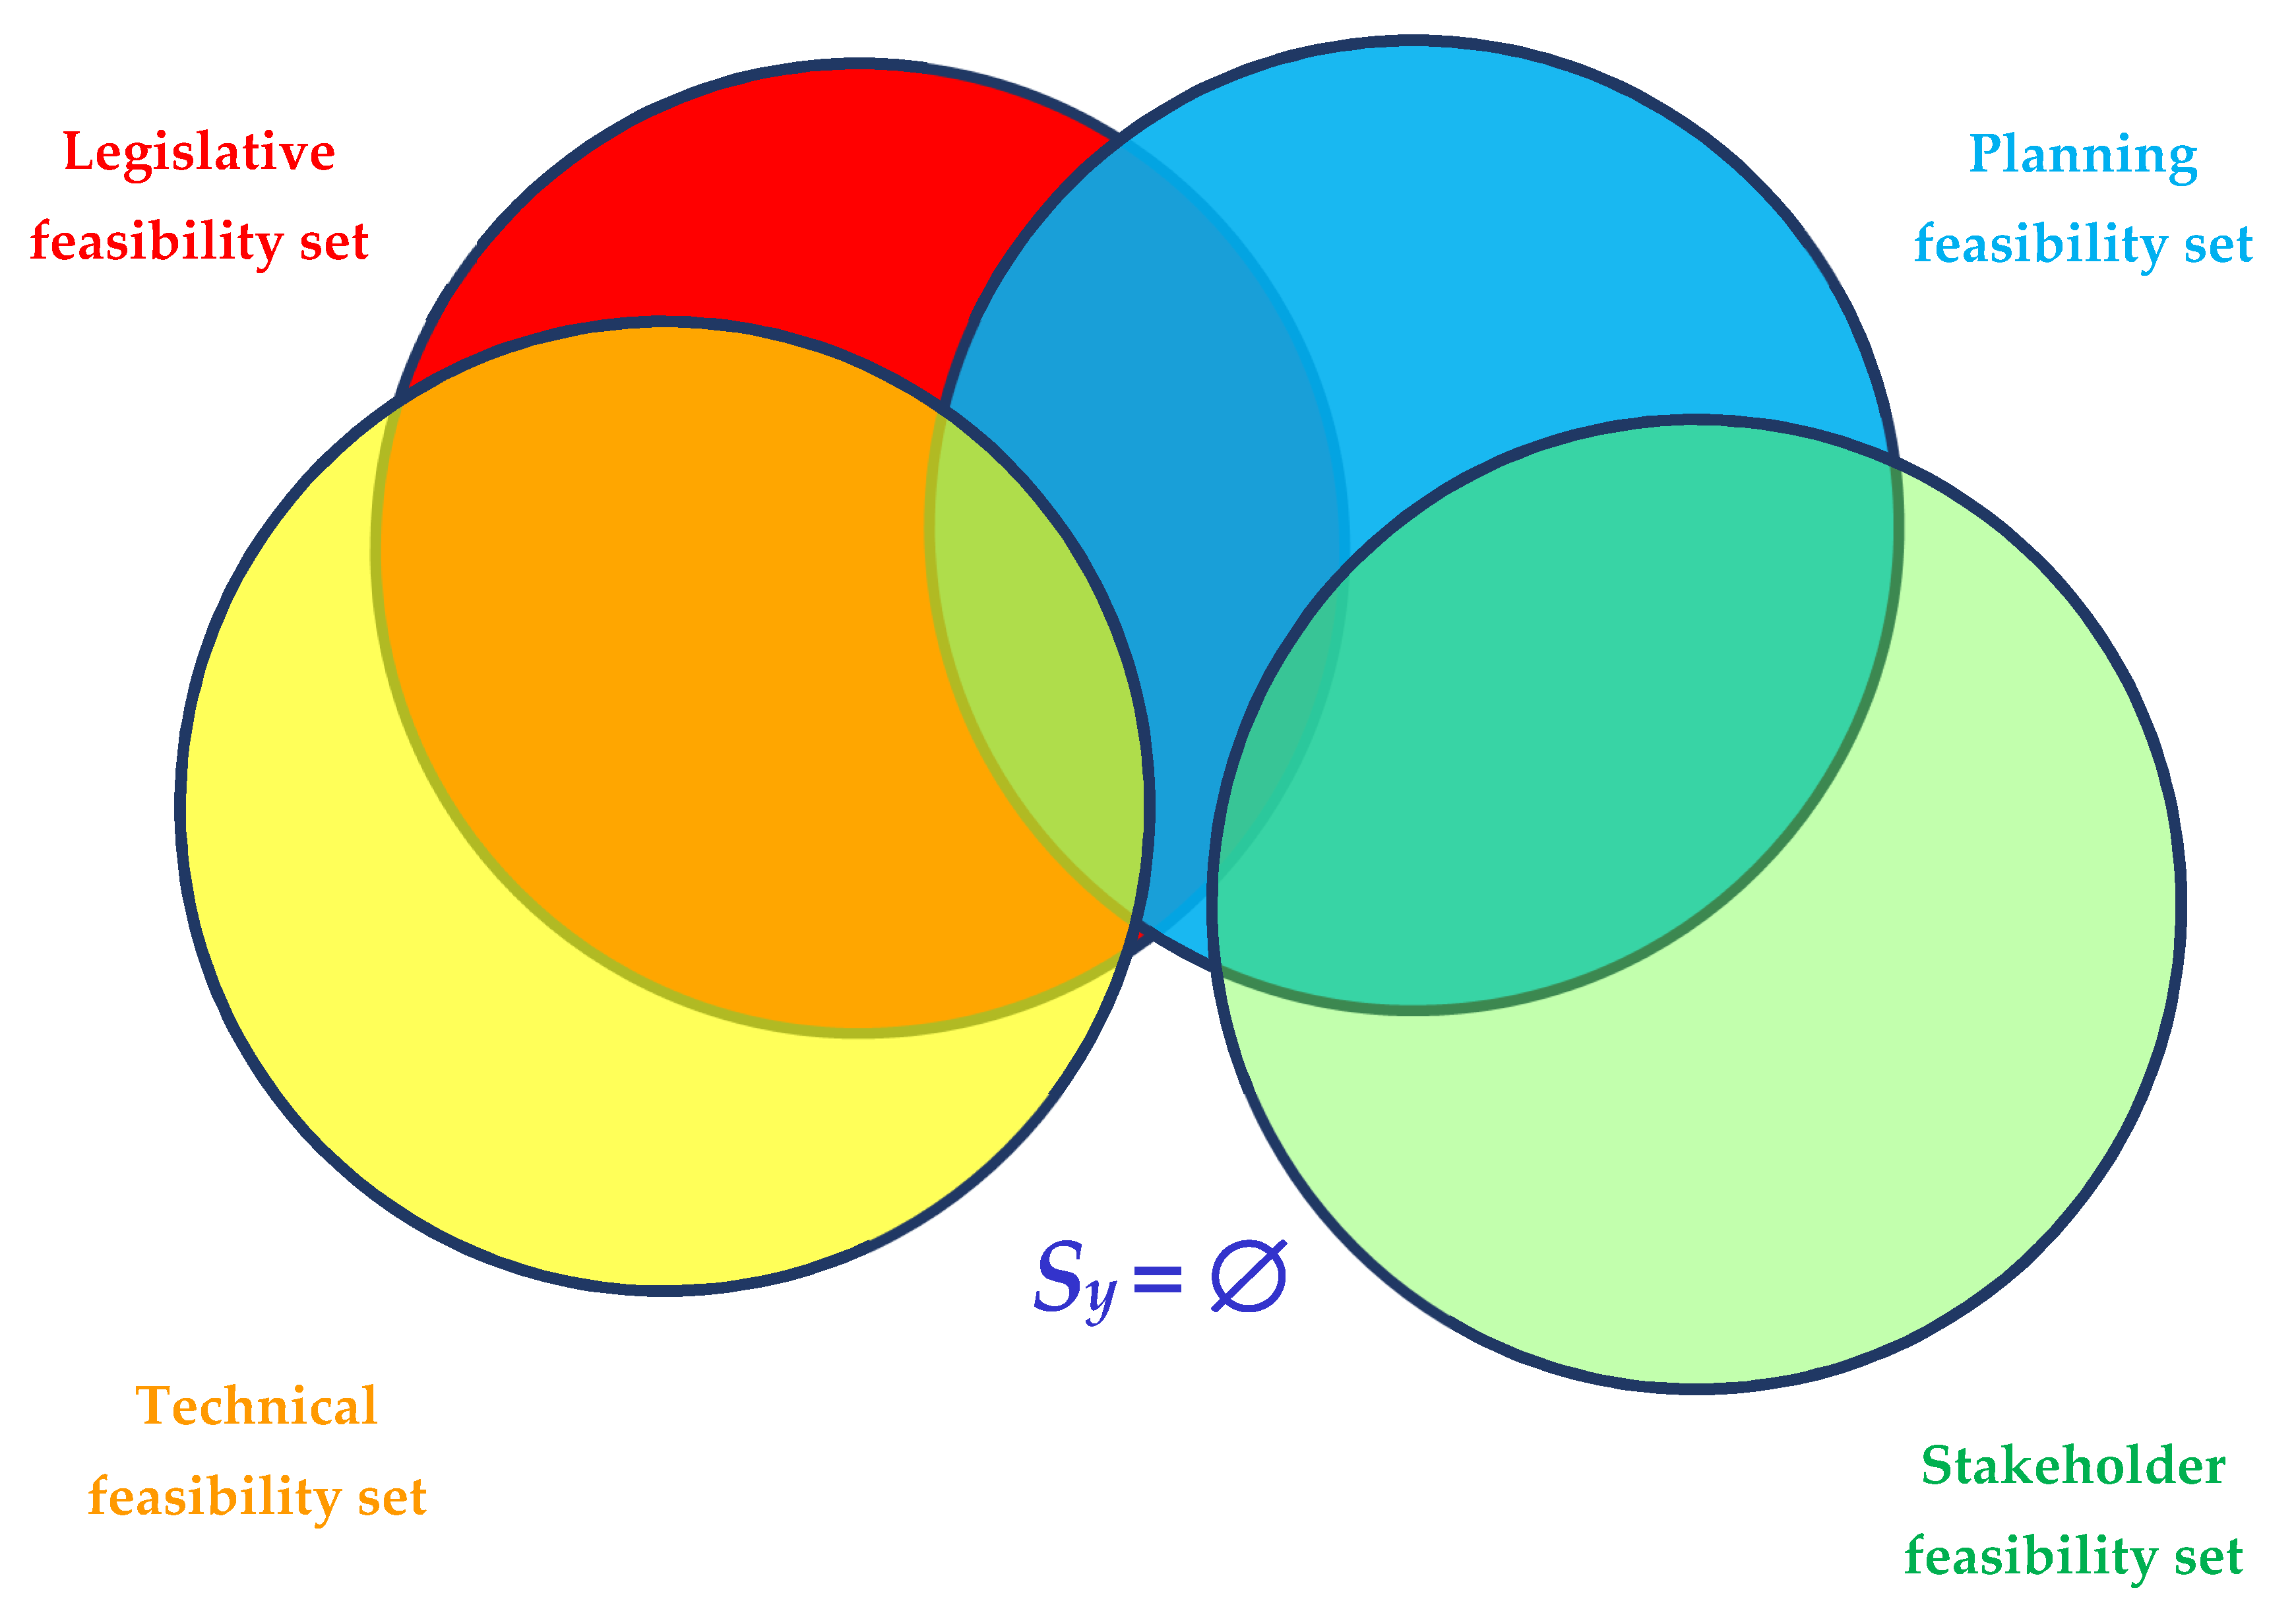
The set of feasible solutions, indicated in (4) as
Sy, is identified in the above-mentioned decision-making process as the intersection among the four described feasibility sets (
Figure 2), that is:
However, in some conditions, the intersection may generate an empty set, that is
Sy =
∅, as shown in
Figure 3. In this case, assuming that the technical constraints are not removable, hence that it is not possible to modify
ST, that the legal constraints cannot be removed either (set
SL), and planning constraints are difficult to change (set
SP), it is crucial to interact with stakeholders and make them change their positions to generate a non-empty feasibility set. In this case, the solution will probably be closer to stakeholder requirements, and sub-optimal from the technical point of view. However, if technicians and stakeholders do not allow any feasible solution to be identified, it is necessary to interact with the planning process.
Hence, in the case study, we show that in the case of the province of Foggia (Italy), an iterative procedure was implemented in order to achieve agreement between technicians, provincial administration, and stakeholders (i.e., a definition of a non-empty feasibility set). Moreover, we introduced a further constraint in order to verify that the final scenario does not provide a reduction in equity.
3.3. Equity
Numerous researchers have studied equity in transportation and proposed methods for measuring it; here, we refer to [
45,
46,
47,
48,
49,
50]. In particular, equity in public transport has been studied by [
31,
51,
52,
53,
54]. On examining the literature, it is evident that considering equity is crucial in the process of public transport planning. Yet, often a consolidated (and sometimes unfair) distribution of public transit resources is difficult to modify, due to opposition by those who enjoy a more favourable situation. In this context, stakeholder engagement (public engagement) assumes a fundamental role in the planning process, as detailed in the next subsection.
In this study, equity was assumed as a constraint on network design. In particular, in the analysis and comparison phase between the future scenario and the current scenario, the equity aspect was evaluated, and it was verified that equity had not declined. The avoidance of the inclusion of equity in the objective function was induced by various motivations such as:
Clearly, in the design phase, if the design scenario is less equitable than the initial one, it is possible to intervene with modifications to bring equity back to its starting value.
It is far from straightforward to evaluate equity in the context of a plan for the reorganisation of local public transport at the provincial level, such as that being studied. Indeed, it is not possible to evaluate the distribution of resources between territories (in our case, municipalities), in terms of vehicle-km/year: The services do not fall within the single municipality but connect different locations and are used not only by residents in one specific location.
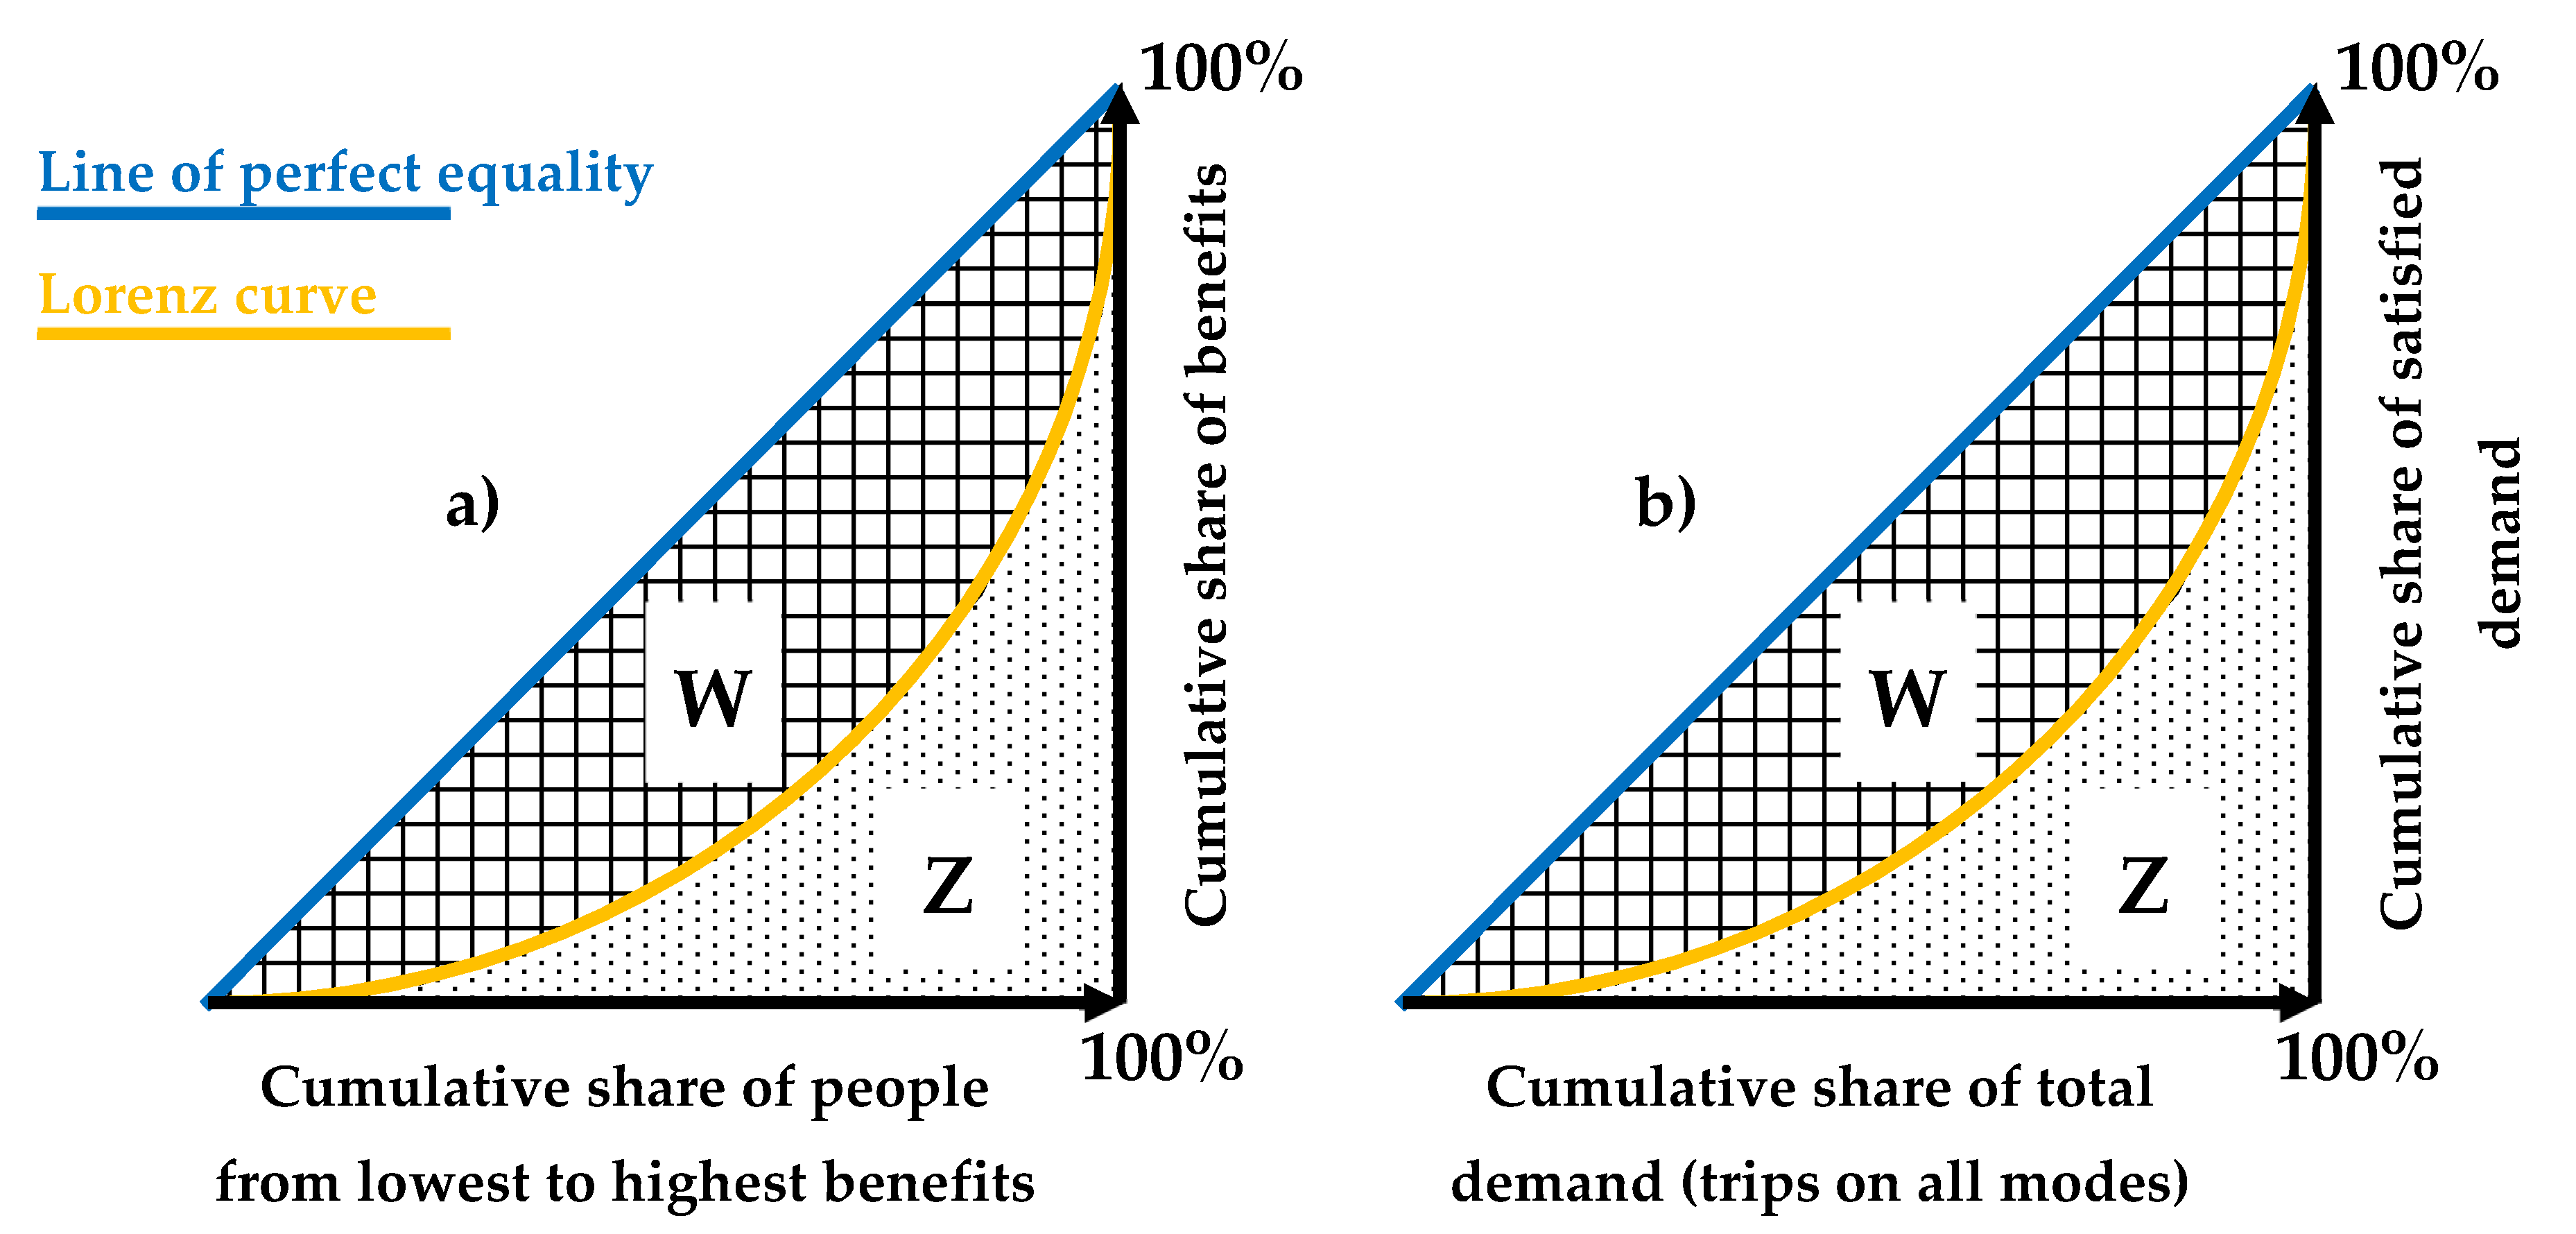
Therefore, we believe that equity should be assessed with the OD pairs served and the demand between the same OD pairs; this approach to evaluating equity is, to our best knowledge, original. The proposed procedure is based on the well-known Gini index [
55], suitably adapted to the evaluation of the OD pairs served. This index varies from 0 (perfect equality) to 1 (maximal inequality) and is calculated as the ratio between areas
W and
W +
Z in
Figure 4a, where the Lorenz curve expresses the proportion between the cumulative share of the benefit and the cumulative share of people that enjoy the corresponding value of the benefit; it is also equal to 2
W (or 1 – 2
Z). The proposed approach considers travellers on all modes as the subjects who can benefit from the resources, and the demand served by LPT as the benefits of the intervention. Consequently, the Gini index is calculated as usual, only modifying the elements to be reported on the axes of the graph (see
Figure 4b).
Section 4 will report the results for the case study.
3.4. Stakeholder Engagement
Stakeholder engagement (also called public engagement) can be defined as the process of involving stakeholder concerns, needs, and values in the transport decision-making process ([
56]). It is a two-way communication process that provides a mechanism for exchanging information and promoting stakeholder interaction with formal decision-makers and the project team. The overall goal of engagement is to achieve a transparent decision-making process with greater input from stakeholders and their support for the decisions that are taken.
Some administrations pay little attention to stakeholder engagement in planning and designing transportation systems, either in the belief that professionals are best placed to make decisions, considered essentially technical, or because local political representatives believe that they best represent stakeholders’ interests. This approach is known in the literature as the
Decide, Announce, Defend (
DAD) syndrome ([
57,
58]).
Only in more recent years have stakeholders become engaged in the earlier stages of the transportation decision-making process, mostly for infrastructural planning and design ([
59]). There are still major differences in the levels of stakeholder engagement in different countries. In most countries, stakeholder engagement in transportation planning and design is not regulated and left to the single administration ([
60]). It should be stressed that stakeholder engagement is by no means limited to decisions involving public organisations. Indeed, it has been increasingly recognised as an effective tool for the management of decisions in firms (e.g., [
61]).
Starting from these considerations, the proposed ‘
stakeholder engagement’ phase is derived from the rational decision-making process proposed in [
16,
56]. Different levels of stakeholder engagement were identified and adopted in the decision-making processes applied. The first level is
stakeholder identification, which deals with the key task of identifying the relevant stakeholders for a given decision-making process, and then, if possible, defining different engagement strategies for different groups. For example, [
62] proposed a classification based on two levels of interests and two levels of power, suggesting different engagement strategies for the various groups. The authors of [
63] proposed an enhancement of that proposed by [
62], introducing the concept of stakeholder empowerment. The second level is
listening, which involves organised ways to gather information about stakeholder expectations, requests, and concerns. The third level,
information giving, deals with disseminating information relative to the project. The fourth level is
consultation, which entails decision-makers listening to the various opinions of (selected) stakeholders on the proposed solution (design scenario), with the aim of improving the project before decisions are taken and/or making any changes during its implementation. Finally, the fifth level is
participation, which can be seen as an extension of the consultation level where the groups directly affected become joint partners in project choice and implementation (e.g., through a referendum or other forms of participated decision-making).
Various techniques and tools may be used to engage actors in the process. Selecting the most effective set of techniques of engagement is crucial to the success of the whole process. Not only may inappropriate techniques be ineffective but, in some circumstances, they may create unnecessary barriers as observed in [
16,
64,
65].
Although, theoretically speaking, stakeholders may appropriately be engaged throughout the whole decision-making process [
16], from a practical point of view it is sometimes useful (for the planning process to succeed) to exclude them from some technical-decisional activities (e.g., definition of design solutions).
Stakeholder engagement (
SE), within the same plan/project and decision-making process, can be conducted with different levels of ‘
depth’ and participation. As suggested by [
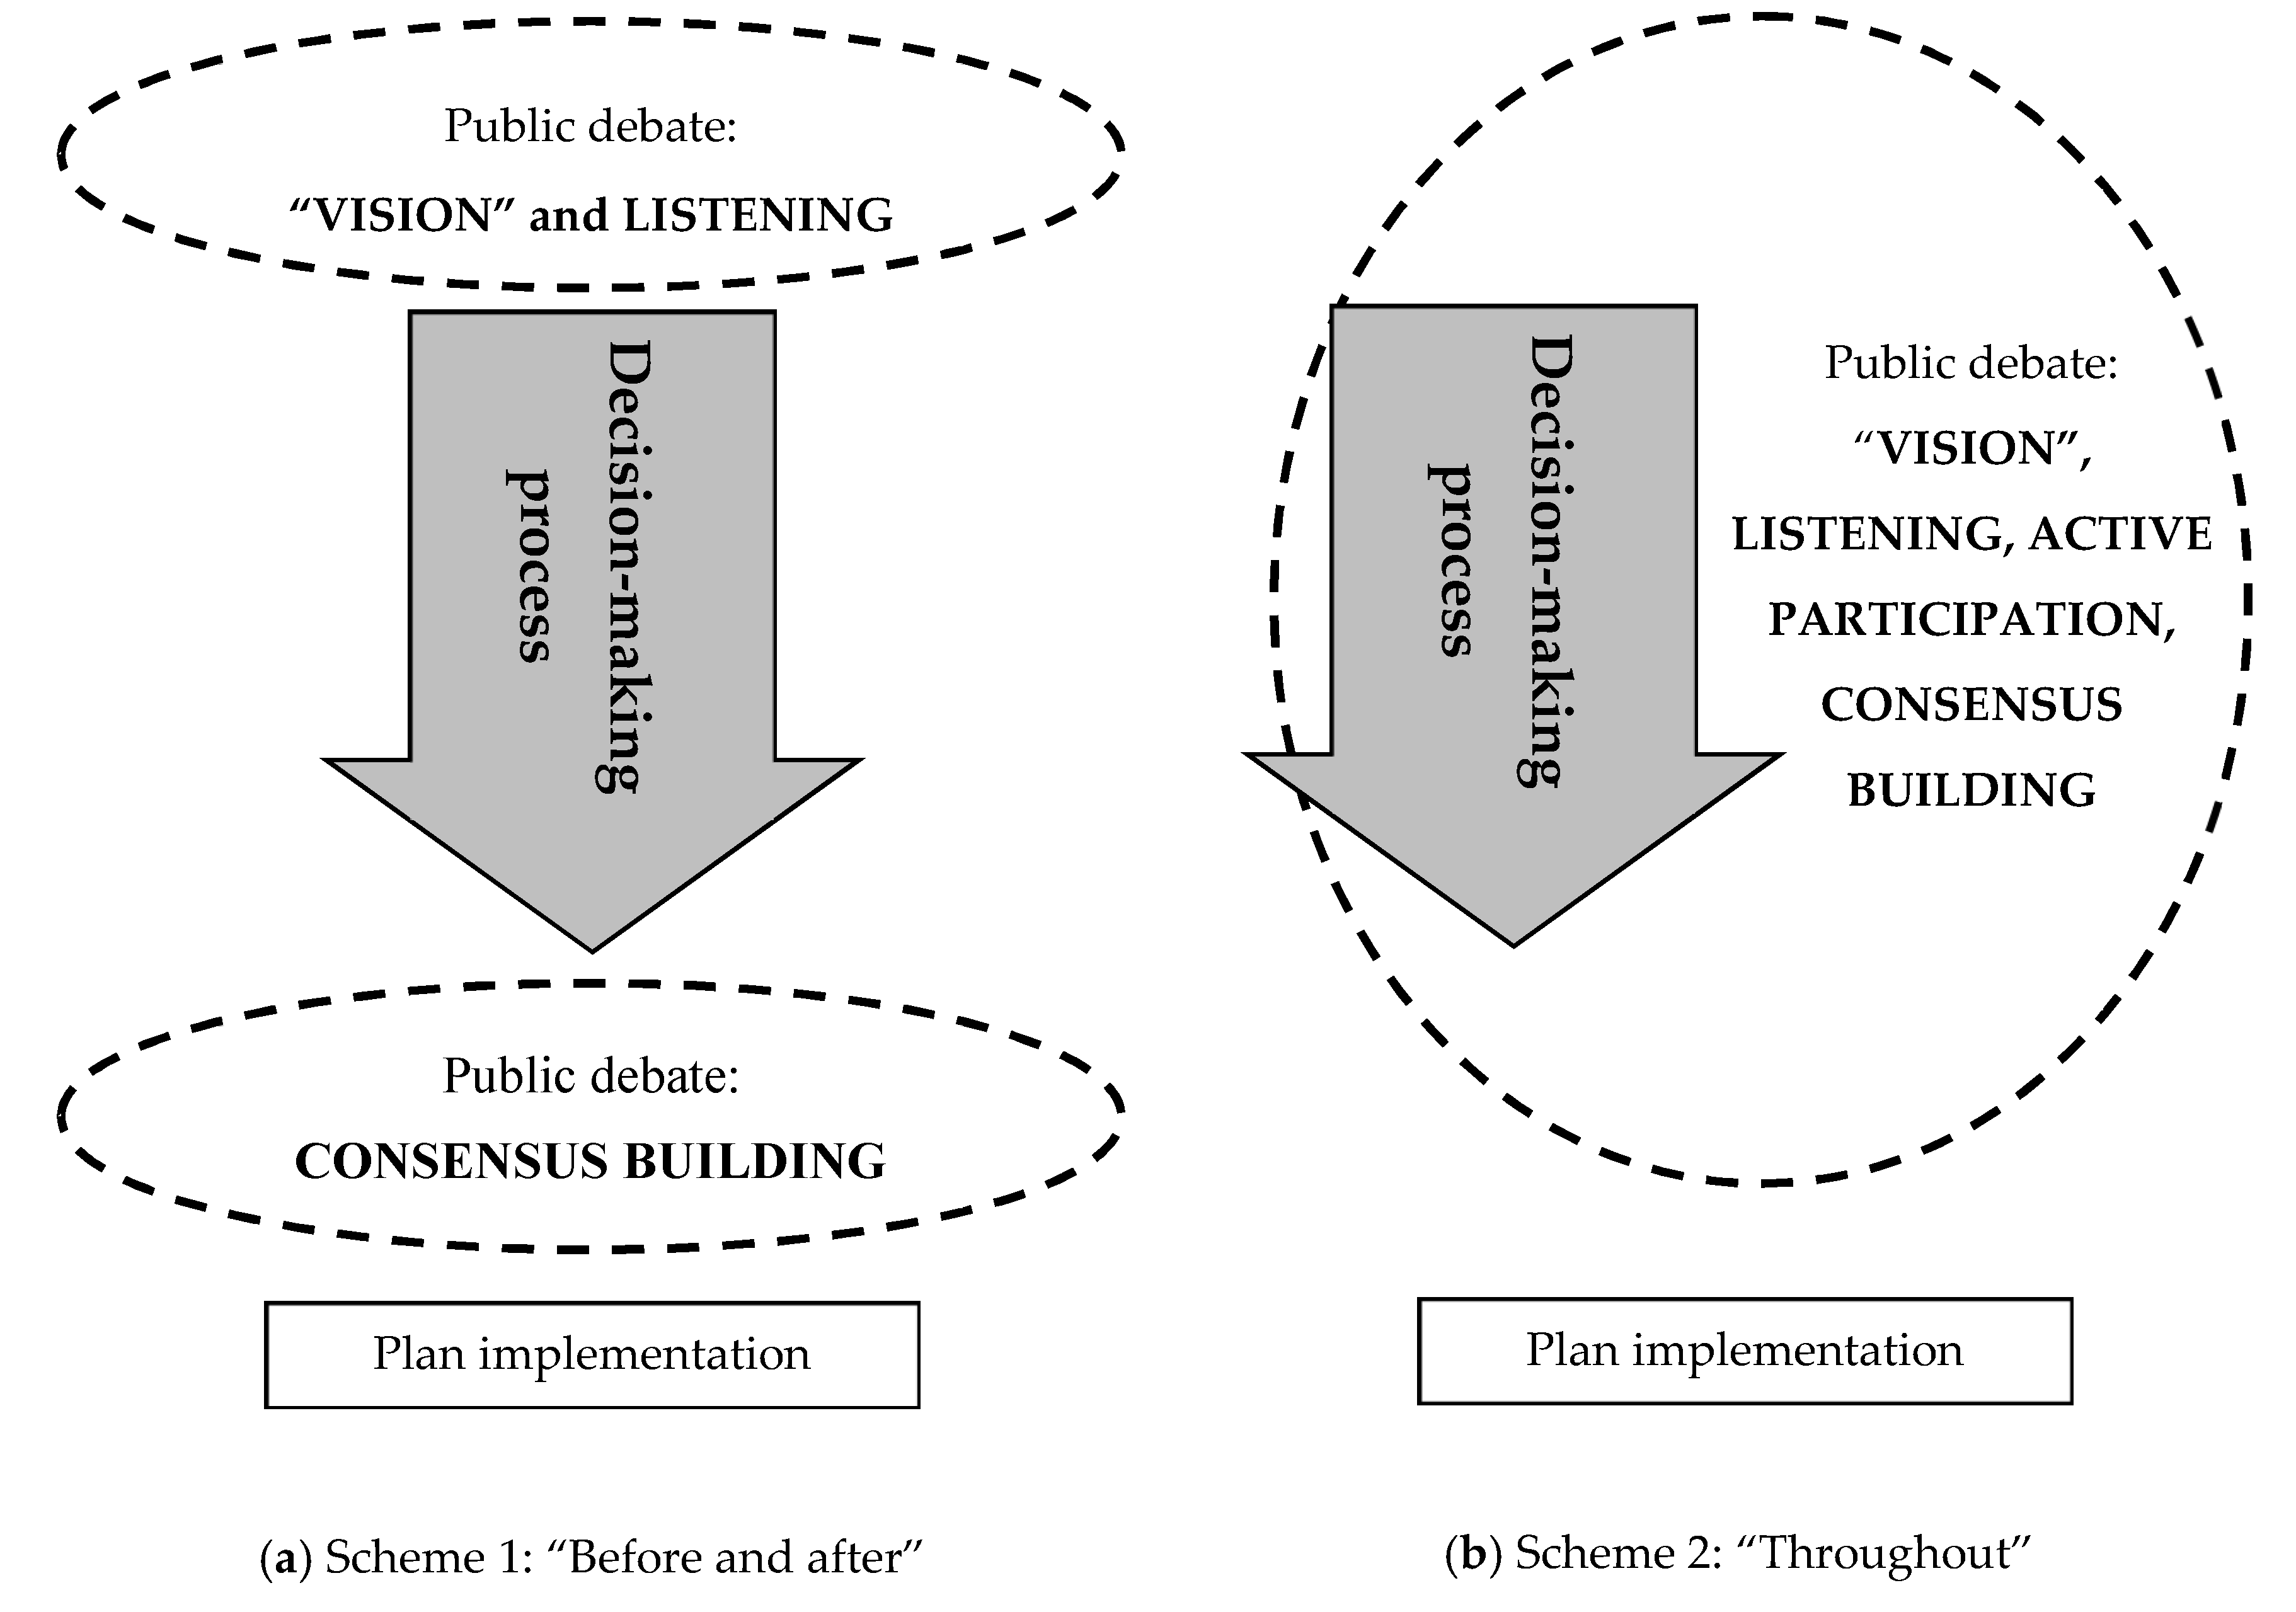
66], the main stakeholder engagement models follow two main schemes (
Figure 5):
Stakeholder engagement before and after the decision-making process, so as to define the ‘vision’ of the plan, listen to the needs of the stakeholders and create consensus around the design solution before its implementation;
Stakeholder engagement throughout the whole decision-making process, with the active involvement (active participation) of the stakeholders also for the definition of the design alternatives to compare/evaluate.
The first scheme is applied whenever it is felt that stakeholders do not have to participate in defining the design alternative (or plan) to be implemented but should only be heard for the definition of the ‘vision’ of the plan, on their needs (prior to the decision-making process) and on small changes to the project to be integrated into the final design scenario before its realization. In general, those who participate in public debates are often non-users of the transport system (e.g., citizens or representatives of categories) intent on defending their own interests and opposing specific project hypotheses (or plans). On the other hand, users of the system are not always willing to actively participate in these public events, running the risk of not having representatives to pursue their interests in the process. This circumstance, observed for the case study discussed in this paper, could even lead to the failure of the decision-making process, leading to the choice of a design solution that only reflects the needs of non-users and not those of transport users (e.g., a new bus line that non-users decide must have a route totally outside the city centre to avoid environmental pollution and noise, but that does not reflect the mobility needs of users who would like bus stops within the centre where they live/work).
In the case of stakeholder engagement ‘
before and after’ the decision-making process (Scheme 1 in
Figure 5), it is necessary to implement the following phases:
Participation in defining the ‘vision’ of the plan (objectives to be pursued and constraints to be respected) and listening to the needs and proposals of the stakeholders;
Consensus building on the design solution through:
Detailed information on the design solution and on the technical motivations that led to this choice (e.g., impacts and benefits produced);
Listening to reactions and consulting with stakeholders to define possible small changes (improvements) to the design solution prior to implementation.
On the other hand, in the case in which balanced and profitable participation (and this is not the case for the proposed application case study) of stakeholders may be obtained for all categories of users involved (users and non-users), it will be possible to proceed by applying the second SE scheme in which stakeholders are asked to actively participate also in defining the design to implement.
Applying the
stakeholder engagement methodology proposed, as described in
Figure 1, it is possible to satisfy (e.g., after one or more loops) stakeholder requirements in keeping with the project aims and constraints. Finally, the ‘satisfactory’ solution (sub-optimal if considered only from a technical standpoint) could be formally approved by the administration and then implemented.
4. Case study: Design of Local Public Transport Services for The Province of Foggia (Italy)
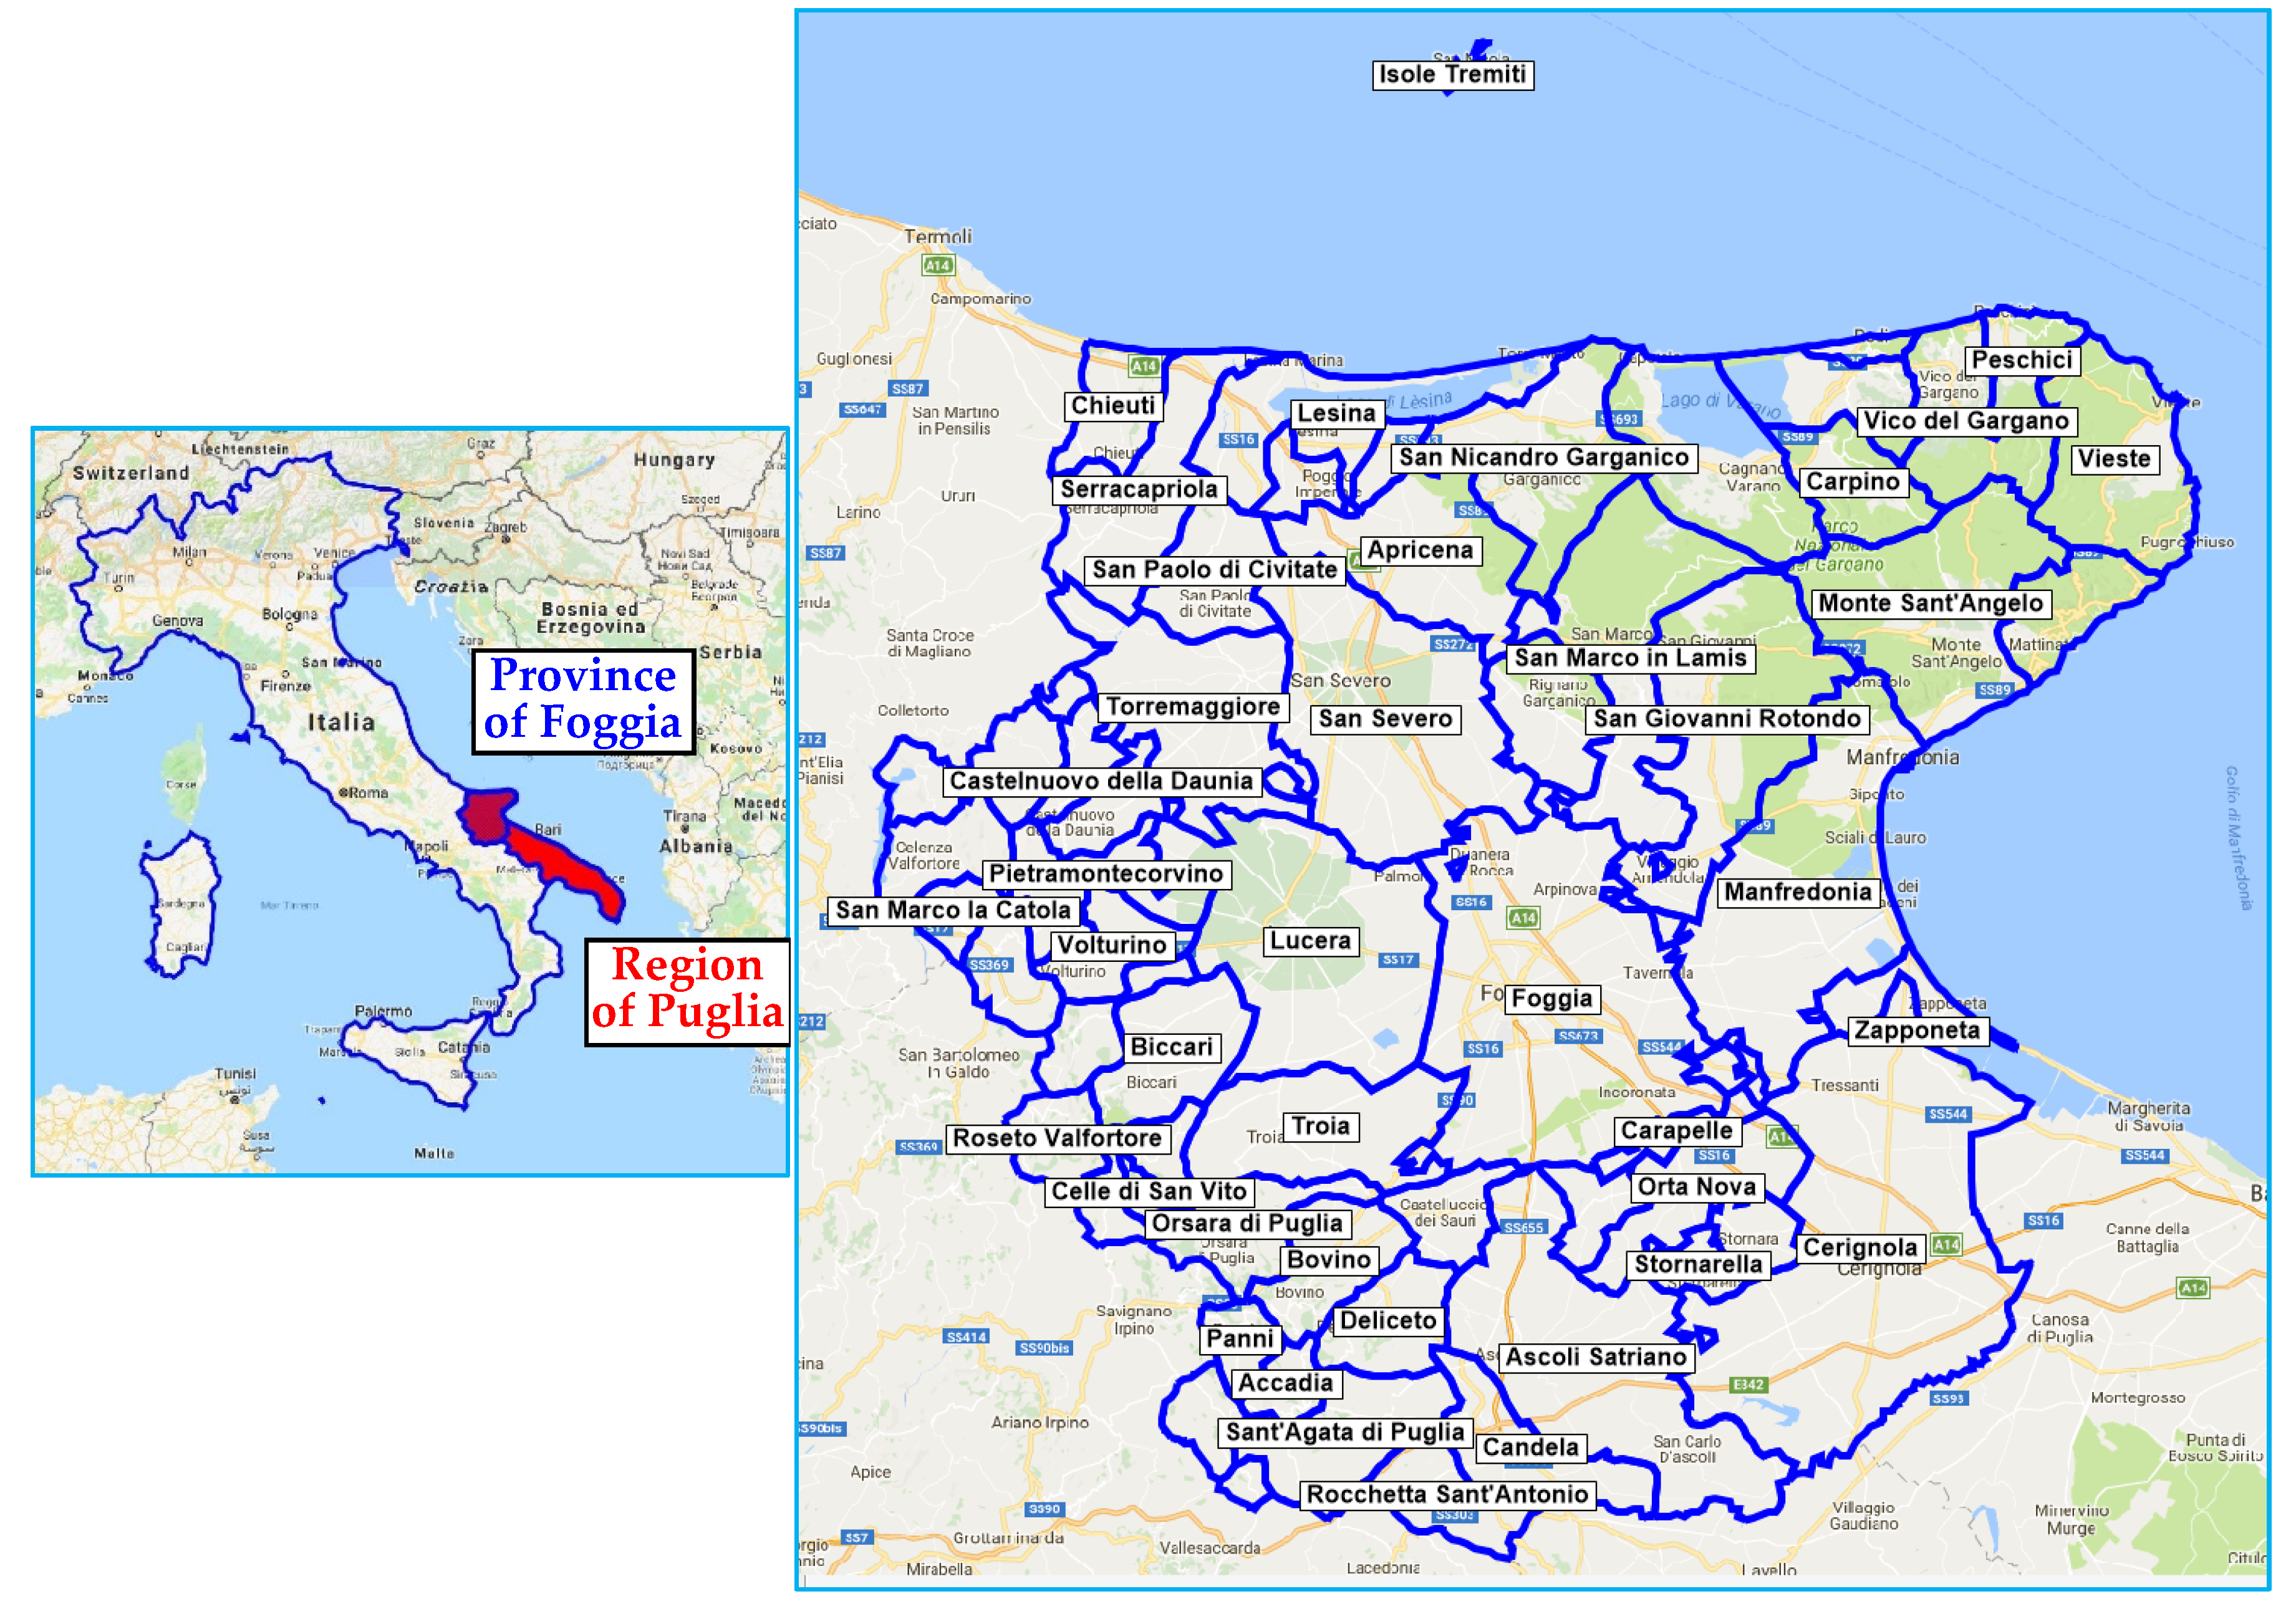
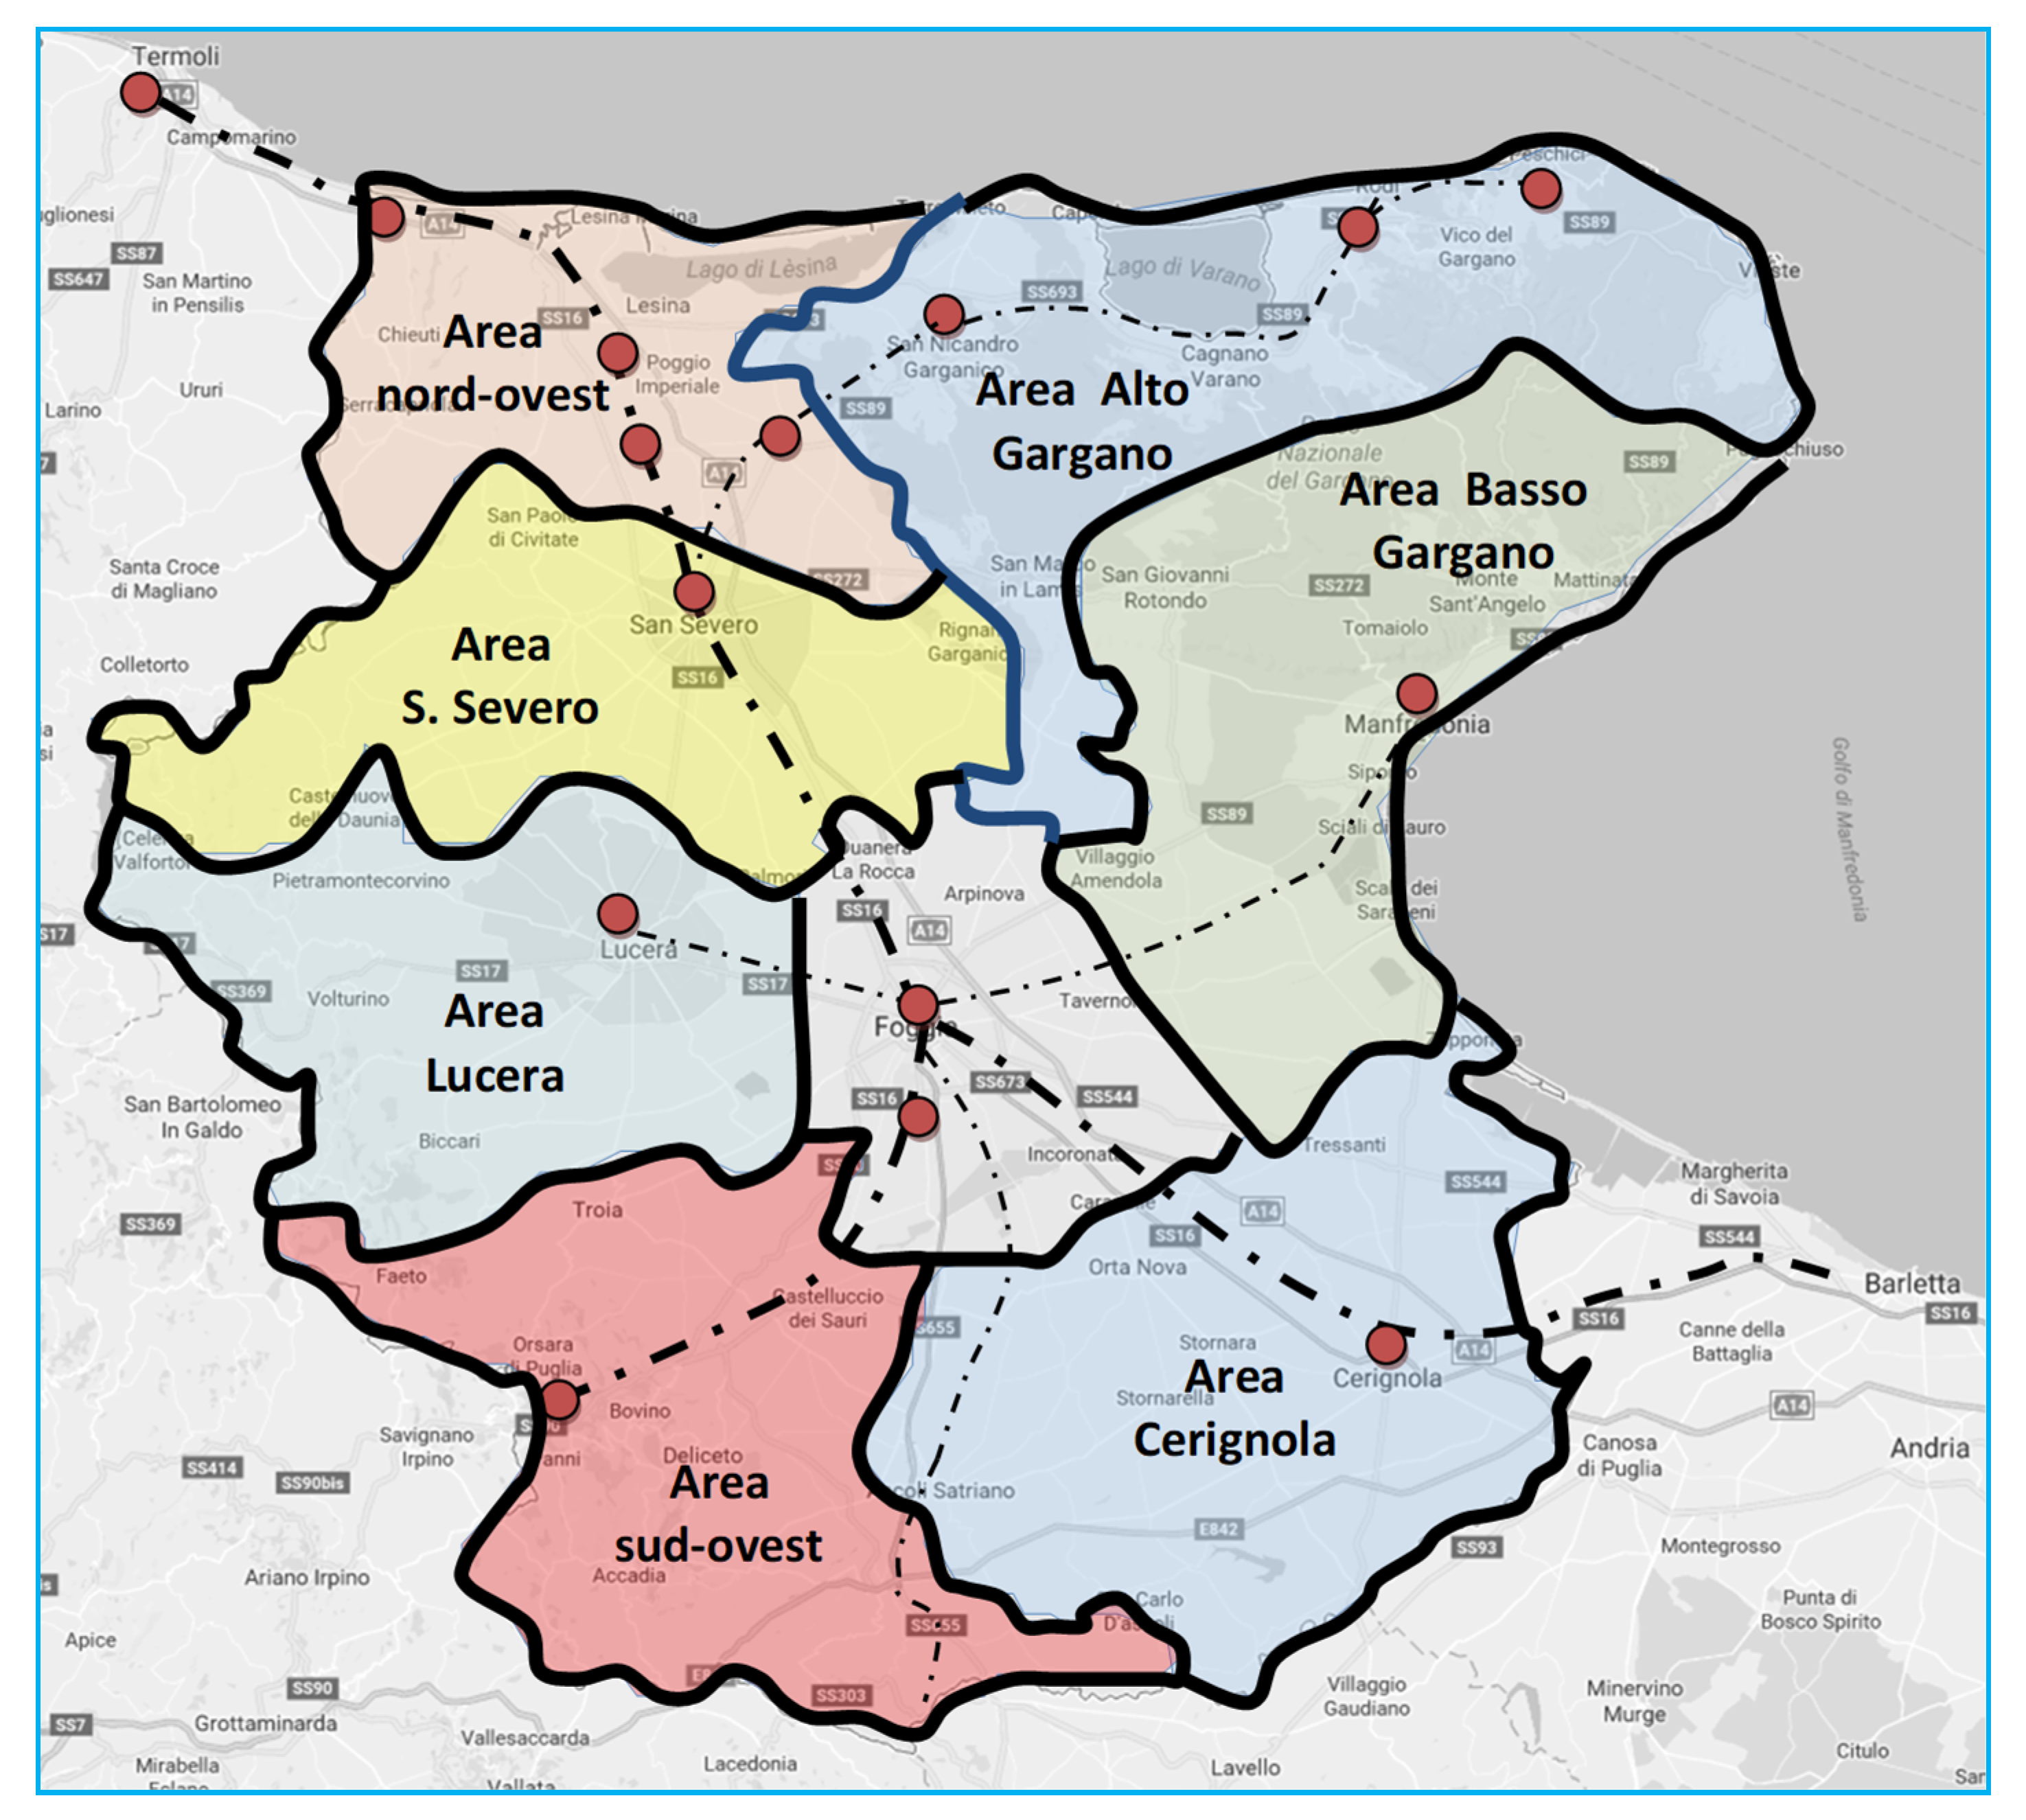
To show the applicability and utility of the proposed methodology, we applied it in the case of the public transport plan for the province of Foggia. The province of Foggia in south-eastern Italy (see
Figure 6) occupies an area of 7007.54 km
2 and has 630,851 inhabitants (i.e., an average density of 90.02 inh./km
2). It consists of 61 municipalities (see
Figure 6), where the most populous is Foggia (151,991 inhabitants) and the least is Celle di San Vito (166 inhabitants). In terms of area, the largest municipality is Cerignola (594.93 km
2) and the smallest is the Tremiti Islands (3.18 km
2). Finally, the municipality with the highest population density is Foggia (298.45 inh./km
2) and the lowest-density municipality is Volturara Appula (8.27 inh./km
2).
In terms of altitude, the highest municipality is Monteleone di Puglia (842 m a.s.l.) and the lowest Zapponeta (2 m a.s.l.). Overall, 21 municipalities are classified as lowland, 9 municipalities as coastal hills, 23 as inland hills, and 8 as upland in the interior.
As stated above, one of the main activities of the proposed methodology is the estimation of mobility needs in terms of current travel demand for transport modes. Through the application of a consolidated demand estimation methodology, not reported for brevity (e.g., [
19]), consisting of the application of both travel demand models and the use of traffic counts and census data, it was estimated that:
Total travel demand (considering all transportation modes) consists of 1,518,538 trips/day, where the intra study area trips (i.e., trips which have both their origin and destination in the province of Foggia) represent 96.21% of the total;
Total travel demand within the peak hour of the average working day consists of 114,531 trips/hour, where the intra study area trips represent 98.34%;
Average daily travel demand using the local public transport consists of 76,755 trips/day (about 5% of the total), where the intra study area trips represent 83.76%;
The average peak-hour mobility using local public transport consists of 9604 trips/hour (about 8% of the total), where internal trips represent 92.39%.
The result of travel demand estimation shows that the local public transport modal share is only 5.05% during the average working day, increasing to 8.39% during peak hours. This shows a major problem of the area concerned, namely low-quality, hence poorly used, public transport services. In addition, there arose the need to re-design the public transport services following a transfer of jurisdiction on bus services from the Puglia Regional Authority to its provinces. Up until 2017, the Provincial Administration of Foggia managed only 85 bus lines, corresponding to about 11 million bus*km per year. In 2017, the Puglia Regional Authority transferred to the province of Foggia (see
Table 1) the following:
31 new bus lines among the regional services, corresponding to almost 5 million bus*km per year;
Urban bus services for eight municipalities, corresponding to almost 6 million bus*km per year;
Two bus lines replacing/integrating rail services, corresponding to almost 180,000 bus*km per year.
Hence, the total amount of bus services to be managed grew 101.2% from under 11 to almost 22 million bus*km per year.
Furthermore, in designing the new bus services, the main prescriptions of the Regional Transportation Master Plan—RTMP (superordinate) were taken into account:
Abolition of rail services on some corridors and their replacement with bus services. Likewise, on other corridors, the action imposed the abolition of bus services and their replacement with rail services;
Optimisation and integration of bus services, due to the overlap of some provincial and regional lines;
Definition of a new Bus Rapid Transit connection within a high-demand corridor;
Implementation of Dial-a-Ride bus services in a low-accessibility and low-demand area (Monti Dauni) in the province;
Integration and optimisation between urban and rural bus services in Foggia (the provincial capital);
Feasibility analysis, and related service definition, in the high-demand corridor “Foggia-Manfredonia”.
Preliminary activities consisted of analysing results of passenger mobility surveys, considering information such as number of passengers and ticket revenues for each bus line. These data (see an example shown in
Table 2 and
Table 3) allowed the productivity level of each bus line to be determined, helping to decide which lines were to be kept unchanged, which were to be entirely suppressed (total suppressions), and which were to be optimised by retaining the service only in some time periods (partial suppressions).
However, since the planning of public transport services requires network hierarchisation, where the rail system represents the backbone of mobility, given also that most of the actions proposed by the RTMP were rail-based solutions, the first planning step was to identify existing rail services (
Figure 7) and establish suitable catchment areas (
Figure 8).
Furthermore, in order to run sustainable and high-quality transport services, the vehicle fleet to be used for the services has to fulfil the following criteria:
Physical and functional suitability, using vehicles of the most appropriate size both for the road infrastructures involved (e.g., small vehicles for the bus lines that run along mountain roads), and for the level of demand (e.g., high-capacity buses for high-demand corridors);
Straightforward renewal, in order to counter the current high average age of the Foggia province bus fleet;
Focus on sustainability, which means replacing the current vehicle fleet with bi-modal vehicles (e.g., bi-fuel with natural gas) and/or electric vehicles (e.g., hybrids, plug-in).
As stated above, for the design of the new bus lines, the proposed rational decision-making process with stakeholder engagement was applied iteratively (
Figure 1). As is well known, it is very important from the beginning of the planning process to analyse who the stakeholders interested in the process are and how to engage them. According to the classification by [
62], stakeholders could be grouped according to two levels of interests and two levels of power (see
Table 4), and different engagement for the various groups identified could be suggested. For example, for the application case study it was necessary to keep institutional stakeholders (strong power and low interest) informed. Key stakeholders (strong power and high interest) are the most demanding (e.g., mayors or elected officials of areas impacted by projects, unions, etc.) as they have potential for veto rights. Such stakeholders were not only informed, but also directly involved (consulted) on the ‘vision’ definition and on the design scenario impacts (effects). Marginal stakeholders (weak power and low interest) were those requiring the least effort. The last group of operational stakeholders (weak power and high interest) (e.g., transport users and operators, citizens directly affected, etc.) were involved in the listening and information dissemination phases with the appropriate tools as they have the potential to become key stakeholders by self-empowerment, or by being empowered as part of the process management strategy.
With respect to the stakeholder identification phase, the regional government and the city authorities were among the main institutional stakeholders involved in the process. Other stakeholder groups comprised users affected by the RMS project both directly (e.g., rail and public transport users’ associations) and indirectly (environmental and other public concern groups) as well as the regional and local transport operators. Local communities and media were also explicitly recognised as potential stakeholders. The ‘listening’ stage was the first stage of the SE, consisting of preliminary meetings with both stakeholders and with the technical panel responsible for plan implementation, in order to outline the ‘vision’ (objectives) of the plan, times, methodologies, as well as requirements and problems. Such meetings were organised at the very beginning of both area-wide planning and (specific) service design processes.
The main results of this first activity were the definition of mobility needs (for users and non-users) and the participated ‘vision’ of the plan that the new local public transport services would have to aim towards:
Effectiveness, which means public transport services of utility to users, increasing transport accessibility and environmental sustainability at the same time;
Efficiency, improving transport quality and the price/quality ratio;
Equity, regarding the fair distribution of transport services among citizens.
The “key characteristics” arising from the public debate were as follows:
Multi-modal integration, focusing on:
Competition with the car mode in order to reduce the number of journeys with private vehicles by encouraging the modal shift to public transport, as well as, in the long term, aiming to reduce the motorization rate (fewer cars/family);
Cooperation with car and rail transport modes, intercepting through suitable new modal interchange hubs in order to promote the use of more sustainable transport;
Quality of services in all its components and factors (e.g., vehicles, bus stops, technologies, ticketing, passenger services), as well as a greater ‘cultural’ orientation towards public and sustainable transport. The idea of the plan is to promote a new identity of provincial local public transport, which is not only more sensitive to environmental issues (e.g., ‘green’ transport mode), but generally linked to all socio-cultural areas connected with conservation and with quality of life.
With respect to the ‘information stage’, various dissemination strategies were used (
Table 5). Printed materials provided summarised project descriptions to the general public, or informed transport users on how they would need to adapt to the forthcoming changes in the transport system. Such materials ranged from leaflets announcing public events and posters to convey the main ‘vision’ of the plan as it developed over time, to full technical reports providing details of the public service designed. Multimedia campaigns were used as well. Local radio and newspapers promoted the plan through announcements and campaigns. Events were also promoted to inform and elicit stakeholder feedback. For this reason, several exhibitions were organized to illustrate the plan, as well as conferences and debates to keep the public updated on the state of the works.
The ‘consultation phase’ consisted mainly in meetings of various types. A number of meetings were organized to discuss the ‘vision’ and the design solutions, results of technical analyses, and new options to be evaluated. These meetings were organized with local institutional stakeholders (e.g., regional government, Foggia provincial authority, and/or other city authorities), transport operators, and associations.
To reach a consensus over the design scenario (plan), between 2017 and 2019, various interactions were performed with the stakeholders involved, for example:
In March 2017, we were appointed as consultants by the provincial administration of Foggia;
From March to July 2017, we provided a first draft plan to be submitted to the analysis of the technicians of the provincial administration;
From July to October 2017, based on comments received, we proposed a second draft plan, which was presented to the provincial representatives (president, ministers and councillors) in November 2017;
From November 2017 to January 2018, based on new observations and suggestions, we modified the drafts in order to provide a first plan proposal, which, having been checked by the technicians of the provincial administration, was publicised (March 2018) and presented at a public event (May 2018), referred to as a service conference, to which all stakeholders (i.e., local administrators, mayors and municipalities, trade unions, companies, and consumer associations) were invited;
In October 2018, based on the stakeholders’ observations received between May and July 2018, we provided a new version of the plan. We then started an iterative process based on extensive interaction with stakeholders appropriately divided into homogeneous groups. However, this process provided numerous versions of the plan until December 2018 when a shared version was identified;
Having identified a final version of the plan in December 2018, all technical and administrative activities were then undertaken to bring the plan to approval in March 2019.
Table 6 shows the main features of the plan in the different steps of the decision-making process and
Table 7 provides the percentage differences with respect to the initial scenario. It is worth noting that, although, as shown in
Table 1, the services were initially classified in terms of administrative jurisdiction, having to implement a single plan where all services must be integrated, we classified services into: (
i) Intra-provincial services, which represent all bus services connecting origins and destinations falling in the province of Foggia; (
ii) inter-provincial services, which represent all bus services which connect points in the province of Foggia with points in neighbouring provinces; and (
iii) urban services, which represent all bus services performed entirely in a single municipality. Only for these services does the definition coincide with the administrative one provided in
Table 1.
Although the difference between the initial and the final scenario may seem very slight (according to data shown in
Table 6 and
Table 7), it occurs only in terms of allocated resources since one of the aims of the plan was to keep such resources as unaltered as possible. Indeed, as shown in
Table 8 in terms of rural services (i.e., the sum of intra-provincial and interprovincial lines), the total variation of +0.37% was obtained by suppressing eight existing lines (–2,880,499 bus*km/year) and by adding 22 new lines (+3,803,186 bus*km/year). Moreover, the 110 preserved lines were optimised by keeping 83 lines unaltered, by boosting seven lines (+104,400 bus*km/year), and by running down services on 20 lines (–968,178 bus*km/year).
Likewise, in terms of urban services, the total variation in allocated resources equal to +3.36% was obtained by reformulating services in each municipality. In particular, for any municipality, the proposed plan contemplated variations from −12.50% to +25.00% in terms of number of lines, and from −18.84% to +30.70% in terms of allocated resources (i.e., bus*km/year).
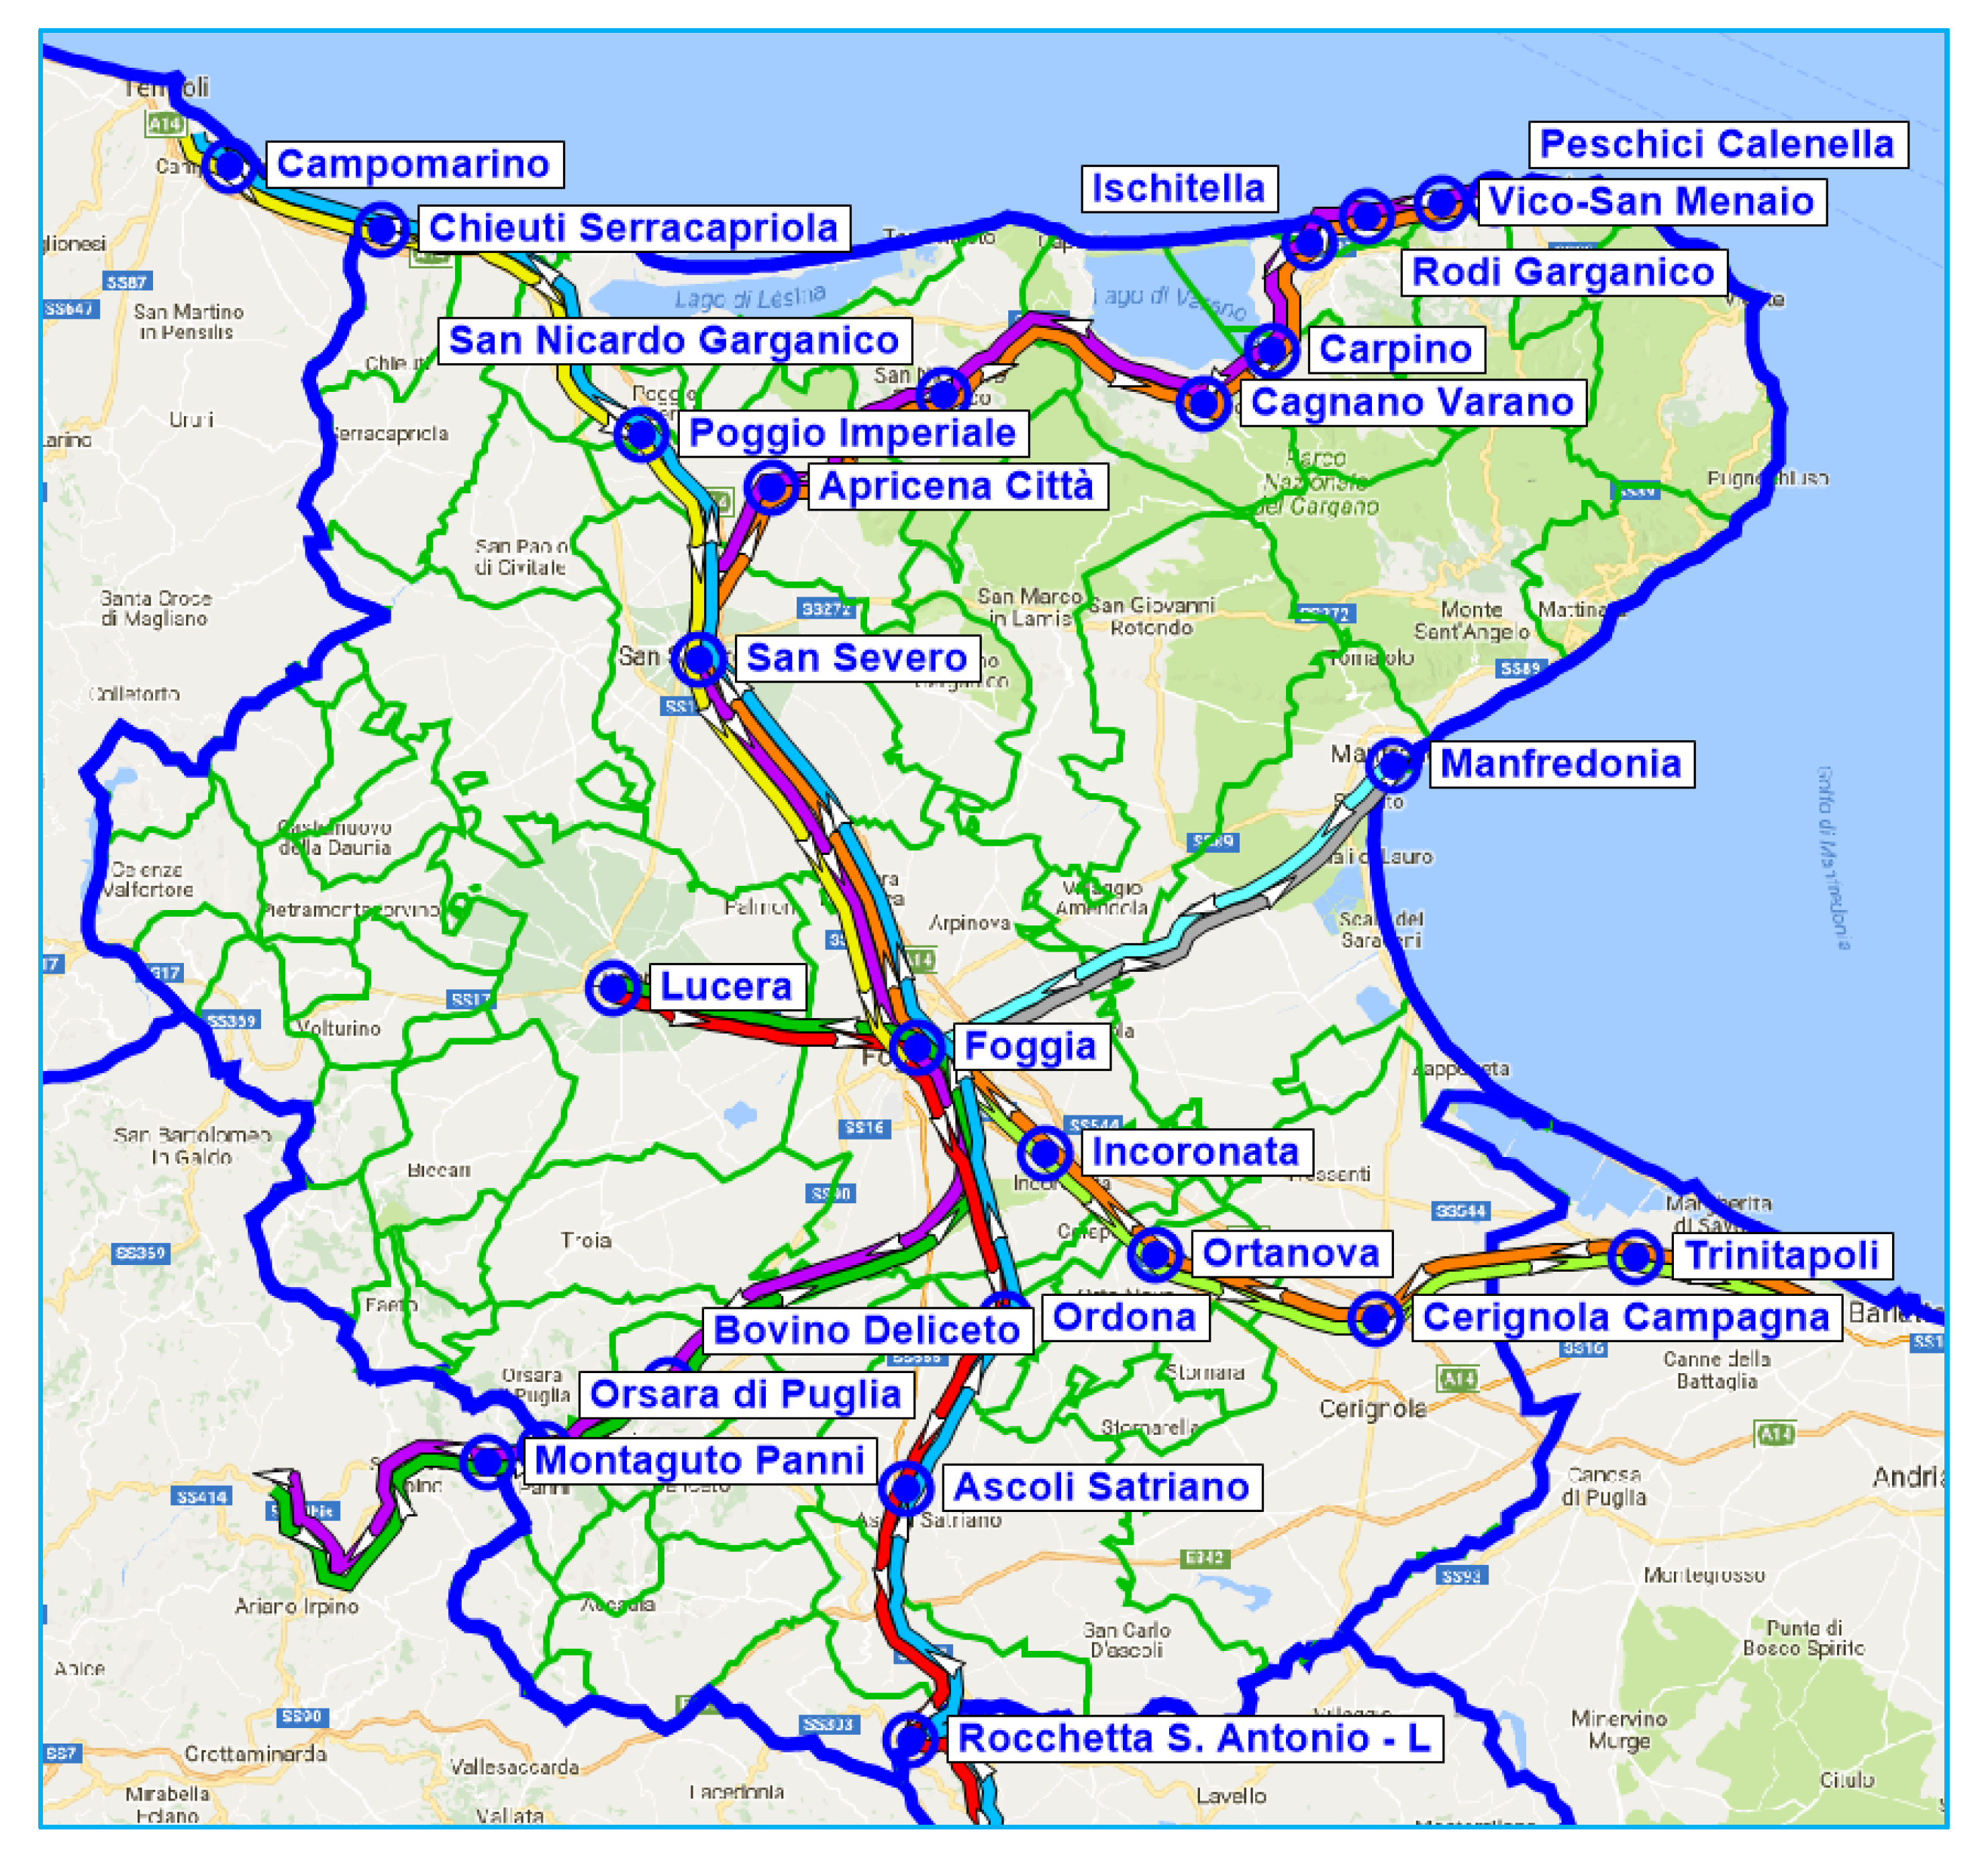
The main interventions proposed in the final design scenario (plan) were as follows:
Optimisation and coordination of all the bus lines (urban and rural);
Introduction of a new bus line in accordance with demand needs and the suppression of low-usage lines;
Integration among overlapping bus lines;
The abolition of some low-demand rail services and their replacement with new and less expensive bus services, optimising and coordinating with other pre-existing lines;
The abolition of some bus services in favour of new high-attraction railway services;
Introduction of a new Bus Rapid Transit service within a high-demand corridor “Foggia-Manfredonia”;
Introduction of a Dial-a-Ride service in a low-accessibility and low-demand area (Monti Dauni), in addition to some other already existing traditional bus services;
Integration and optimisation of urban and rural (extra-urban) bus services.
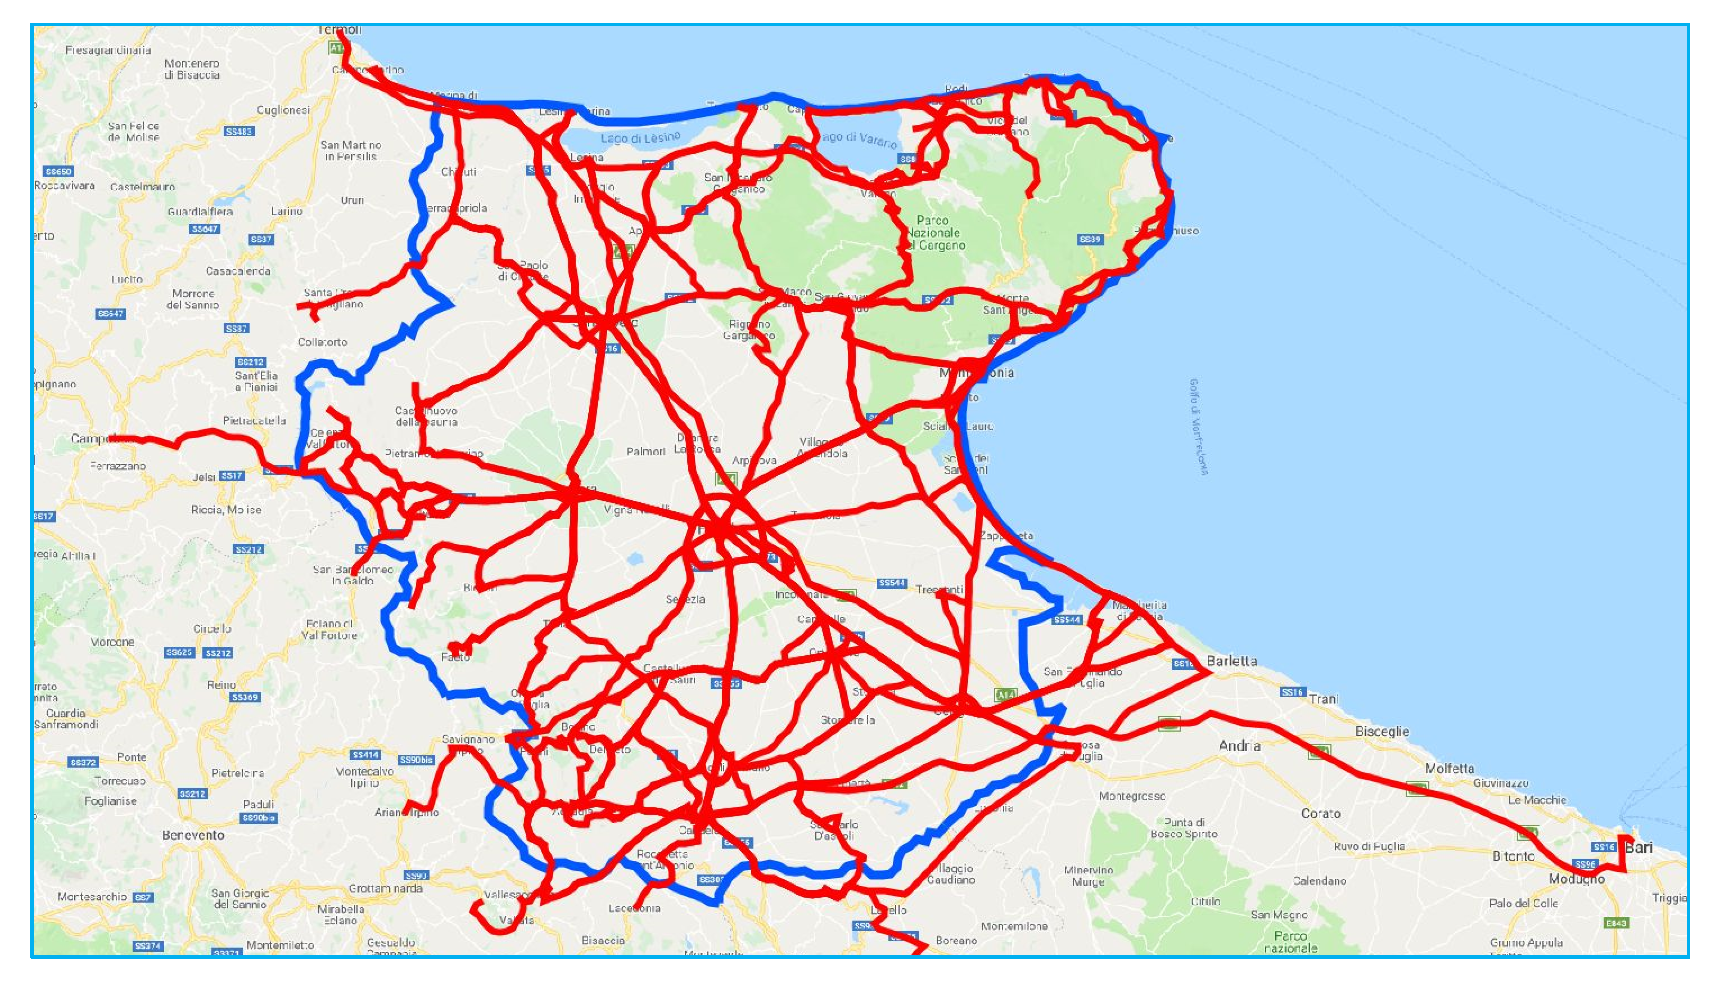
As an example of the final design scenario (plan), the paths of rural lines are reported in
Figure 9.
Although the Regional Transportation Master Plan has to adopt a multimodal approach (i.e., it should consider all transportation modes jointly), it also needs to consider differences in contract durations to avoid temporal misalignment, which generally leads to a do-nothing approach. Moreover, since, in the analysed case, the Puglia Regional Authority paid the contract costs while the provinces the related Value Added Tax (IVA), doubling bus services meant that the provincial administration had to find additional resources.
Moreover, since a recent Italian law has imposed the adoption of standard cost definition under which a cost increase of 10% is expected in order to allow rolling stock renewal, in the absence of increased State funding, this may result in a 10% cutback in public transport services or in regions having to find additional resources to ensure, at the very least, that level of services provided remains unchanged.
Finally, the design scenario was compared with the current scenario from the point of view of equity. In particular, using the procedure proposed in
Section 3.3, the Gini index was calculated for the current scenario as equal to 0.394, and that for the final scenario, 0.391. Comparison between the two values shows a slight increase in equity in the future scenario compared with the current one, which makes the constraint imposed on the design also respected from this point of view. The result was however predictable, given that the number of OD pairs served by direct lines (without transfers) has increased from 628 to 654.
5. Conclusions and Research Perspectives
Sustainability is a cross-disciplinary topic and transportation planning cover a central role in its challenges. Precisely, as we know, transportation systems impact environmental, cultural, economic, and social sustainability of human beings, and so decision-making in transportation planning can significantly contributes in a sustainable development. In this context, the mobility and transport sectors are typically faced with complex decision processes that involve different stakeholders, each with their own stake within decisions that have to be made. Furthermore, these decision-making processes may also give rise to unsatisfactory results. The quality of transportation planning could improve if the professionals involved became more aware of the nature of the process they were involved in and the possible roles they could play. Indeed, problems in effective decision making in transportation also stem from the gap still existing between the traditional technical approach and real-life decision-making processes.
Furthermore, the continued dominance of practical, legislative, and operational limitations around what can be done shows that stakeholders’ influence, however small, it is not necessarily unimportant.
Starting from these considerations, the thesis discussed in this paper is that the (rational) decision-making process followed to design transportation solutions is itself a key element of sustainability, because it can influence its achievement (success or failure of the planning process). Precisely, the aim and the main originality of this paper has been to propose an innovative decision-making methodology for designing local public transport services based on a rational process with stakeholder engagement, aiming to perform a sustainable development perspective. The traditional approach based on the formulation of a mathematical optimisation problem was combined with stakeholder engagement to identify a technically feasible design solution. The proposed methodology is based on a cyclic framework where stakeholder approval and plan proposals interact until an agreed solution is identified.
The main contribution of the paper was to explicitly incorporate in the transport service design problem both institutional constraints and stakeholder interests, with due consideration of the equity issue. The proposed theoretical design methodology has been also applied to a case study in order to verify its applicability to a real context (in term of strengths and weaknesses produced), consisting of the design of the local public transport plan of the province of Foggia in southern Italy. Although the approach required higher plan preparation times than a non-participatory approach and the formulation (over time) of six different plan proposals, the plan enjoys a higher consensus among stakeholders and users, and hence is very likely to be able to be implemented without any disputes or controversies. The application results show that the design solution identified was technically feasible, optimal, participative, and supported by planners, politicians, users, and stakeholders, and more equitable for citizens. Furthermore, although the difference between the initial and the final scenario may seem very slight (+0.37%) in terms of allocated resources, only 46% of the rural services were kept unchanged while the remaining 54% were subject to re-planning tasks (suppression, creation of new services, strengthening, and running-down of existing services). Finally, the equity constraint was satisfied: A small increase in equity was obtained with the final scenario.
Among the possible research prospects, there are the introduction of other key elements in the proposed sustainable decision-making methodology. For example, the legislative implication of the proposed approach, such as the adoption of proper policies for the renewal of bus and railway fleets, the variation in contract durations among different transportation services, and, finally, the cash flow of public transport funds from the central state to the peripherical administrations (regions, provinces, and municipalities), could be explicitly considered within the design procedure to enlarge the economic and social sustainability of the overall transportation planning process. Finally, another research perspective within the topic of “quality” in transportation planning that, as observed in many researches (e.g., [
67,
68]) could significantly improve both the travel perception among the passengers (travel experience) and the overall sustainable development, is enlarging the usage of green transport modes (rail transport, sharing mobility) against the private cars.


