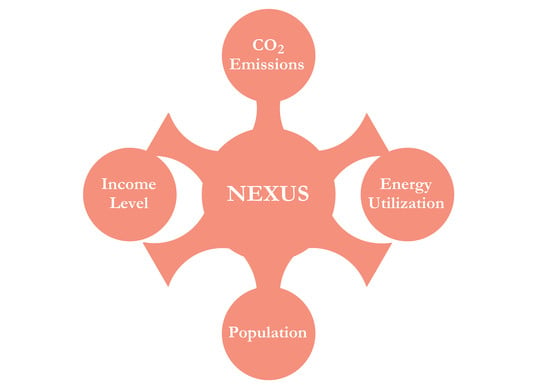
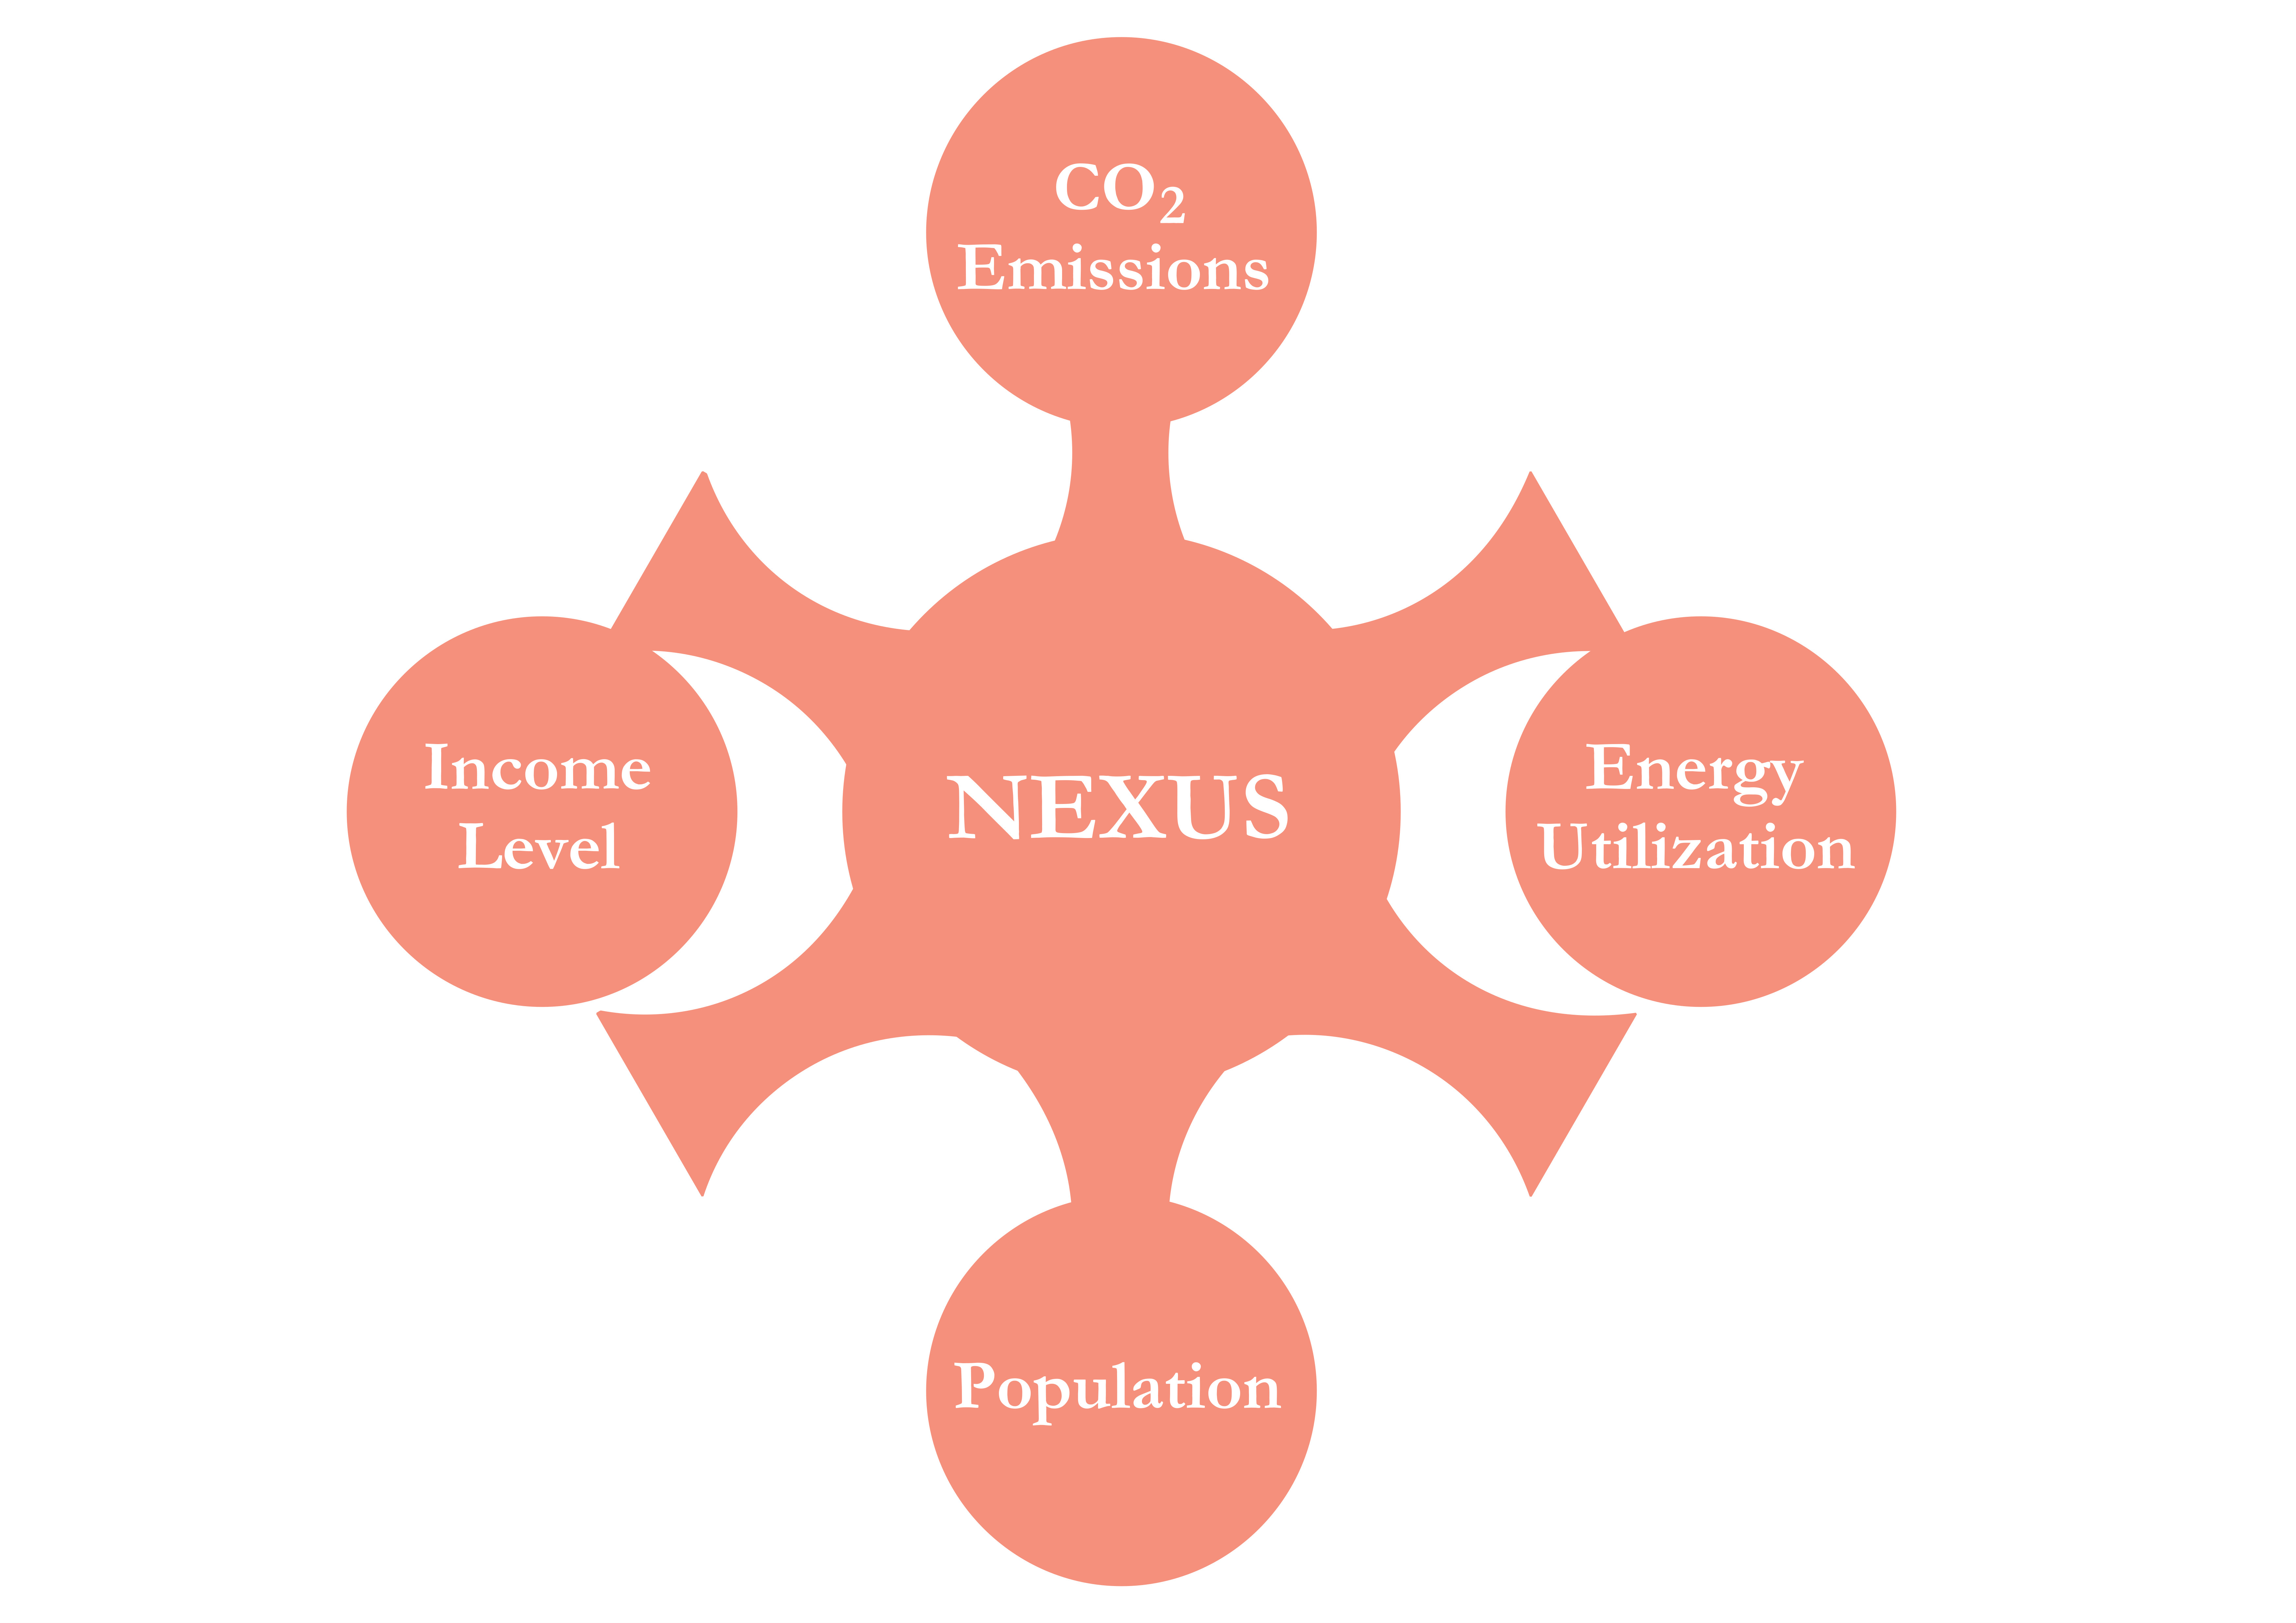
Energy–Climate–Economy–Population Nexus: An Empirical Analysis in Kenya, Senegal, and Eswatini

 ,
,  ,
, 

Abstract
1. Introduction
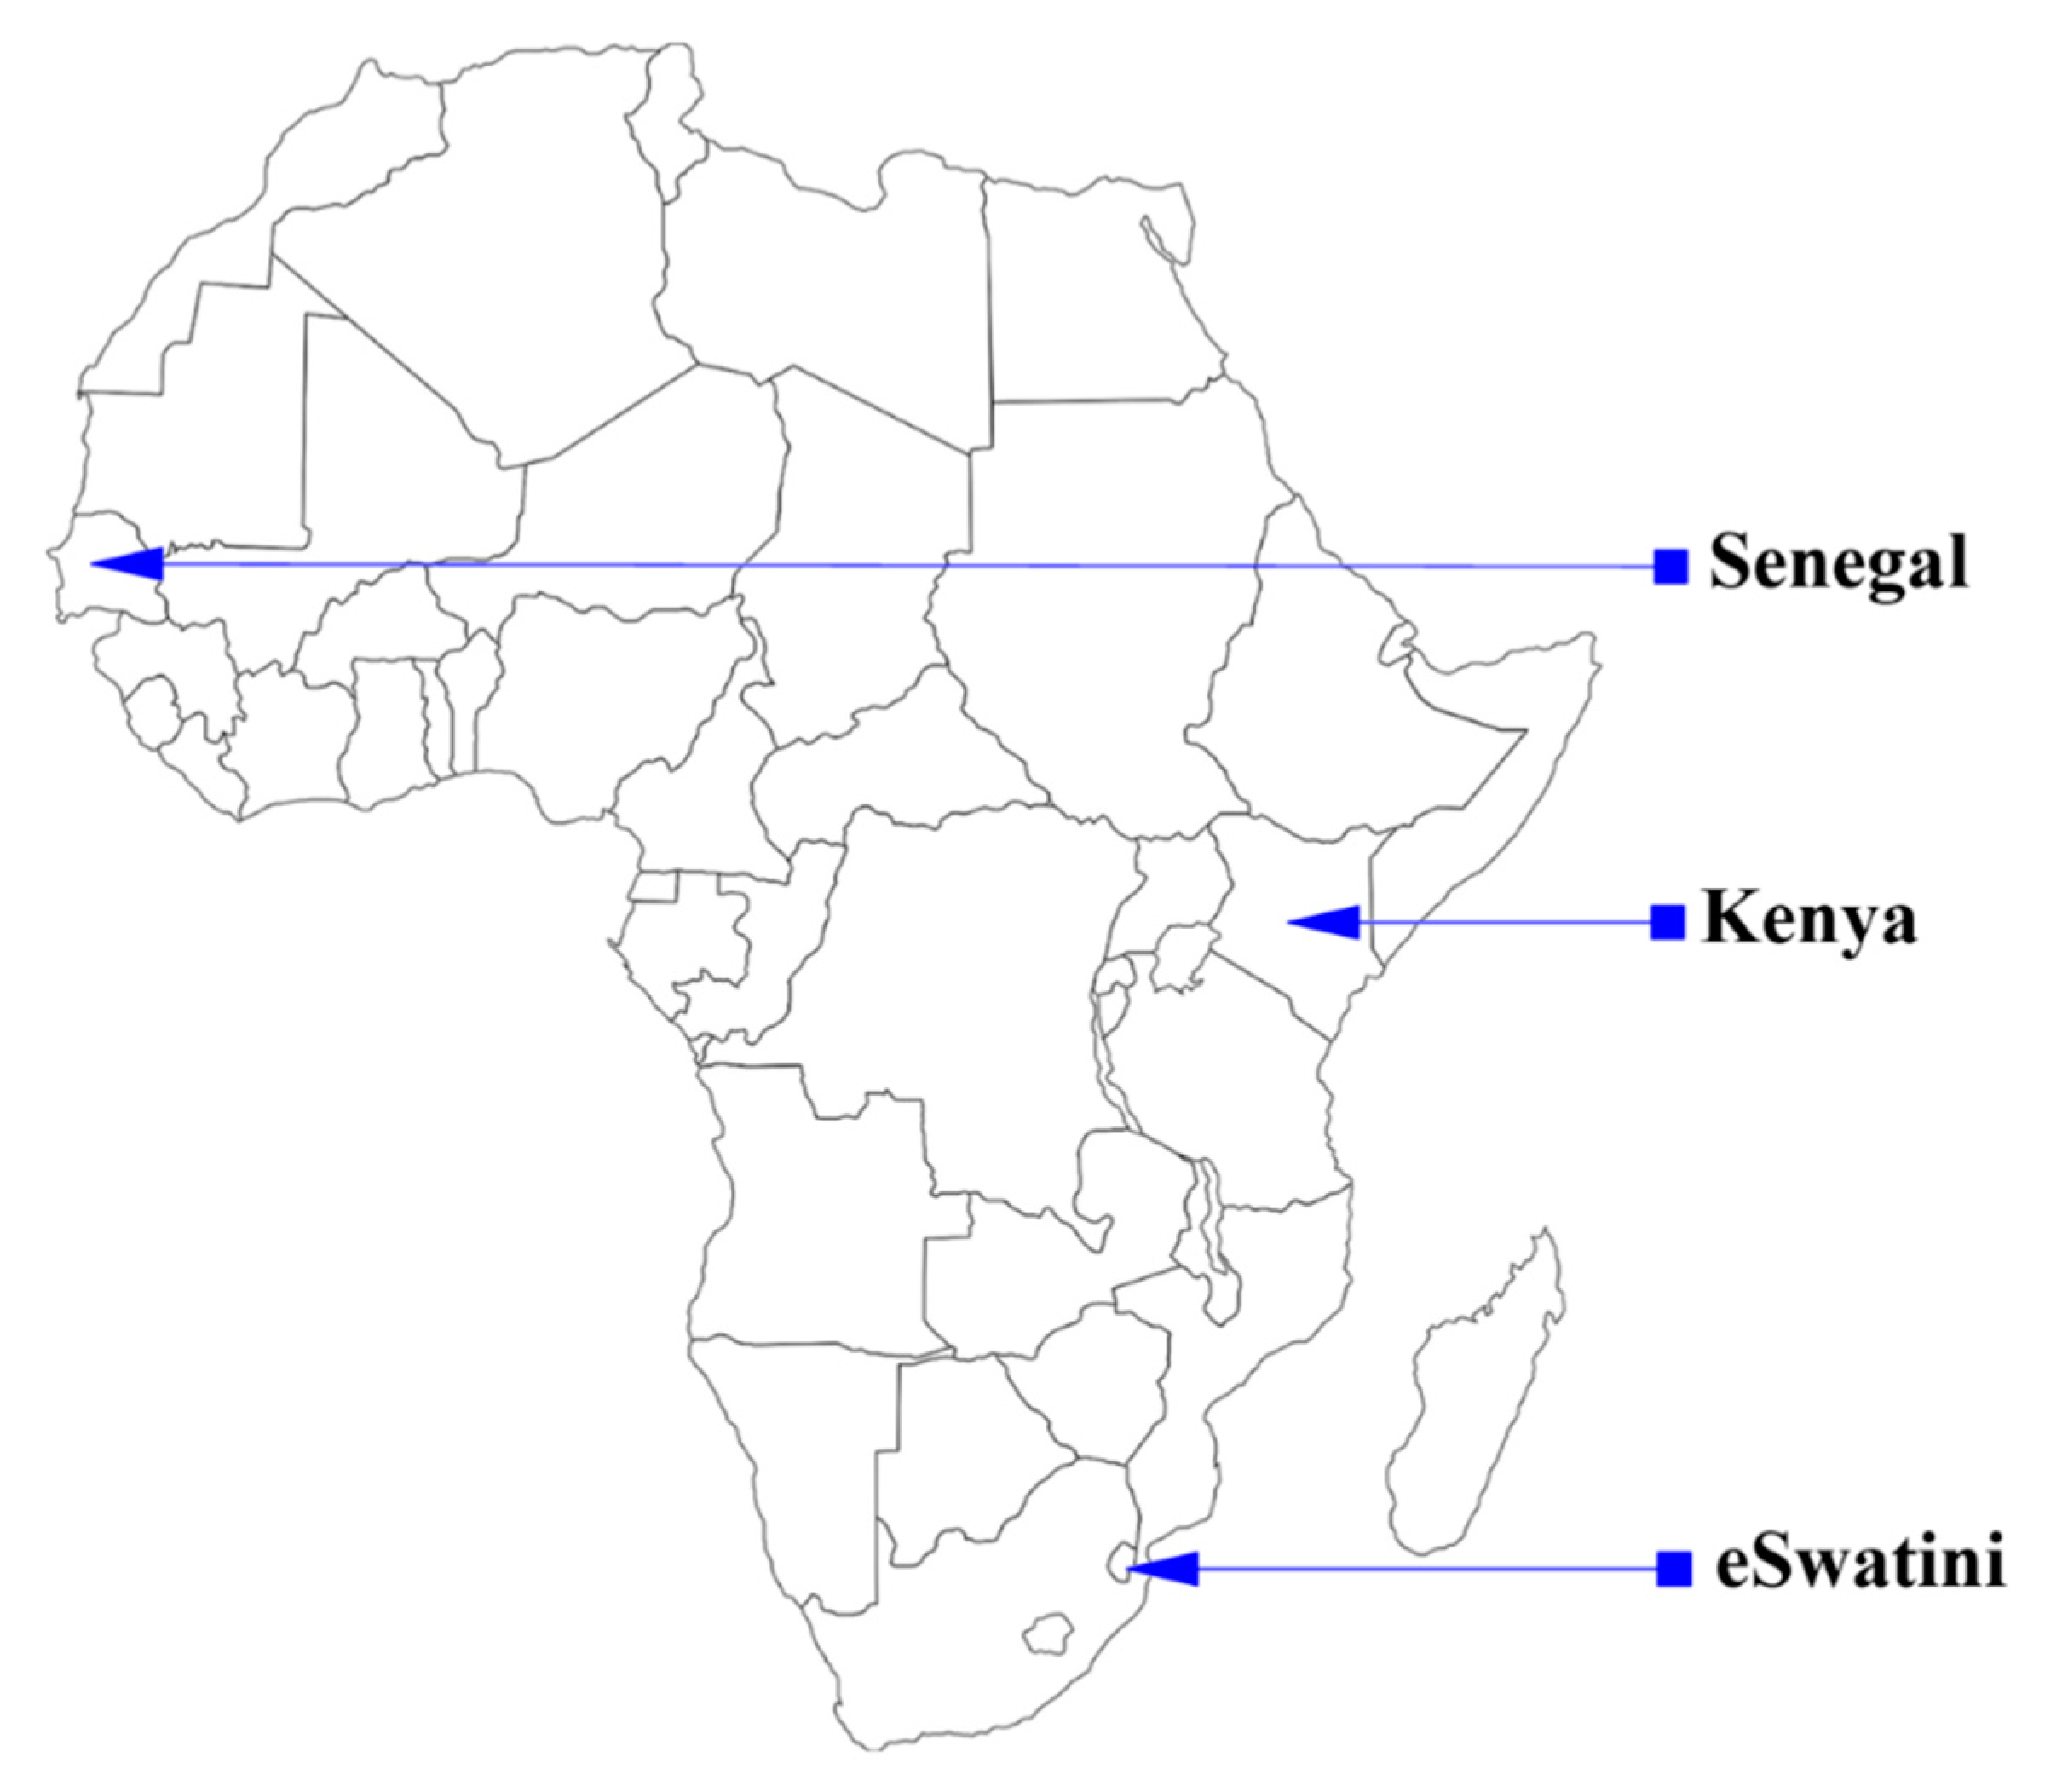
2. Brief Background on Kenya, Senegal and Eswatini
2.1. Kenya
2.2. Senegal
2.3. Eswatini
3. Method
4. Results and Discussion
5. Conclusions
Author Contributions
Funding
Conflicts of Interest
References
- United Nations. Sustainable Development Goals. Available online: https://sustainabledevelopment.un.org/?menu=1300 (accessed on 24 October 2015).
- Owusu, P.; Asumadu, S.S. A Review of Renewable Energy Sources, Sustainability Issues and Climate Change Mitigation. Cogent Eng. 2016, 3, 1167990. [Google Scholar] [CrossRef]
- Kraft, J.; Kraft, A. On the relationship between energy and GNP. J. Energy Dev. 1978, 3, 401–403. [Google Scholar]
- Grossman, G.M.; Krueger, A.B. Environmental Impacts of a North American Free Trade Agreement; National Bureau of Economic Research Working Paper Series; National Bureau Of Economic Research: Cambridge, MA, USA, November 1991; No. 3914. [Google Scholar] [CrossRef]
- Etokakpan, M.U.; Solarin, S.A.; Yorucu, V.; Bekun, F.V.; Sarkodie, S.A. Modeling natural gas consumption, capital formation, globalization, CO2 emissions and economic growth nexus in Malaysia: Fresh evidence from combined cointegration and causality analysis. Energy Strategy Rev. 2020, 31, 100526. [Google Scholar] [CrossRef]
- Usman, O.; Iorember, P.T.; Olanipekun, I.O. Revisiting the environmental Kuznets curve (EKC) hypothesis in India: The effects of energy consumption and democracy. Environ. Sci. Pollut. Res. 2019, 26, 13390–13400. [Google Scholar] [CrossRef] [PubMed]
- Ozturk, I. A literature survey on energy–growth nexus. Energy Policy 2010, 38, 340–349. [Google Scholar] [CrossRef]
- Sarkodie, S.A.; Adams, S. Renewable energy, nuclear energy, and environmental pollution: Accounting for political institutional quality in South Africa. Sci. Total Environ. 2018, 643, 1590–1601. [Google Scholar] [CrossRef]
- Destek, M.A.; Sarkodie, S.A. Investigation of environmental Kuznets curve for ecological footprint: The role of energy and financial development. Sci. Total Environ. 2019, 650, 2483–2489. [Google Scholar] [CrossRef]
- Damette, O.; Seghir, M. Energy as a driver of growth in oil exporting countries? Energy Econ. 2013, 37, 193–199. [Google Scholar] [CrossRef]
- Baranzini, A.; Weber, S.; Bareit, M.; Mathys, N.A. The causal relationship between energy use and economic growthin Switzerland. Energy Econ. 2013, 36, 464–470. [Google Scholar] [CrossRef]
- Tang, C.F.; Tan, E.C. Exploring the nexus of electricity consumption, economic growth, energy prices and technology innovation in Malaysia. Appl. Energy 2013, 104, 297–305. [Google Scholar] [CrossRef]
- Halicioglu, F. An econometric study of CO2 emissions, energy consumption, income and foreign trade in Turkey. Energy Policy 2009, 37, 1156–1164. [Google Scholar] [CrossRef]
- CIA. Central Intelligence Agency (CIA). 2019. Available online: https://buff.ly/3jU1GcD (accessed on 24 November 2019).
- Energypedia. Africa Energy Outlook 2019 World Energy Outlook Special Report. 2019. Available online: https://buff.ly/3jSPIQl (accessed on 23 November 2019).
- EIA. International Energy Statistics. 2015. Available online: https://www.eia.gov/ (accessed on 15 November 2015).
- USAID. Power Africa in Senegal. 2020. Available online: https://buff.ly/3gei5Gp (accessed on 14 July 2020).
- Dafrallah, T.; Ackom, E. Analysis of national Jatropha biodiesel programme in Senegal. Aims Energy 2016, 4. [Google Scholar] [CrossRef]
- NDS. National Development Strategy for Eswatini. 1997. Available online: https://buff.ly/2DnMkMt (accessed on 13 November 2019).
- UNDP. Human Development Reports. 2019. Available online: http://hdr.undp.org/en/countries/profiles/ (accessed on 14 July 2020).
- IEA. Explore Energy Data by Category, Indicator, Country or Region. 2019. Available online: https://buff.ly/33cnk62 (accessed on 14 July 2020).
- World Bank. World Development Indicators. 2020. Available online: http://data.worldbank.org/country (accessed on 24 February 2020).
- EIA. International Energy Statistics. 2017. Available online: https://www.eia.gov/ (accessed on 16 March 2017).
- Blanco, A.S.; Gerlagh, R.; Suh, S.; Barrett, J.A.; de Coninck, H.; Diaz Morejon, C.F.; Mathur, R.; Nakicenovic, N.; Ahenkorah, A.O.; Pan, J.; et al. Drivers, Trends and Mitigation; Edenhofer, O., Ed.; Cambridge University Press: Cambridge, UK, 2014. [Google Scholar]
- Raupach, M.R.; Marland, G.; Ciais, P.; Le Quéré, C.; Canadell, J.G.; Klepper, G.; Field, C.B. Global and regional drivers of accelerating CO2 emissions. Proc. Natl. Acad. Sci. USA 2007, 104, 10288–10293. [Google Scholar] [CrossRef] [PubMed]
- Pedroni, P. Purchasing Power Parity Tests in Cointegrated Panels. Rev. Econ. Stat. 2001, 83, 727–731. [Google Scholar] [CrossRef]
- Pedroni, P. Fully Modified OLS for Heterogeneous Cointegrated Panels and the Case of Purchasing Power Parity; Manuscript; Department of Economics, Indiana University: Bloomington, IN, USA, 1996. [Google Scholar]
- Kao, C. Spurious regression and residual-based tests for cointegration in panel data. J. Econom. 1999, 90, 1–44. [Google Scholar] [CrossRef]
- Hainmueller, J.; Hazlett, C. Kernel regularized least squares: Reducing misspecification bias with a flexible and interpretable machine learning approach. Political Anal. 2014, 22, 143–168. [Google Scholar] [CrossRef]
- Pesaran, M.H. General Diagnostic Tests for Cross Section Dependence in Panels; CESifo Working Paper, No. 1229; Center for Economic Studies and ifo Institute (CESifo): Munich, Germany, 2004. [Google Scholar]
- Pesaran, M.H. A simple panel unit root test in the presence of cross-section dependence. J. Appl. Econom. 2007, 22, 265–312. [Google Scholar] [CrossRef]
- Canadell, J.G.; Le Quéré, C.; Raupach, M.R.; Field, C.B.; Buitenhuis, E.T.; Ciais, P.; Conway, T.J.; Gillett, N.P.; Houghton, R.A.; Marland, G. Contributions to accelerating atmospheric CO2 growth from economic activity, carbon intensity, and efficiency of natural sinks. Proc. Natl. Acad. Sci. USA 2007, 104, 18866. [Google Scholar] [CrossRef]
- Dietz, T.; Rosa, E.A.; York, R. Environmentally efficient well-being: Is there a Kuznets curve? Appl. Geogr. 2012, 32, 21–28. [Google Scholar] [CrossRef]
- Sarkodie, S.A.; Ozturk, I. Investigating the Environmental Kuznets Curve hypothesis in Kenya: A multivariate analysis. Renew. Sustain. Energy Rev. 2020, 117, 109481. [Google Scholar] [CrossRef]
- Sarkodie, S.A.; Owusu, P.A. The Causal Effect of Carbon Dioxide Emissions, Electricity Consumption, Economic Growth and Industrialization in Sierra Leone. Energy Source Part B Econ. Plan. Policy 2017, 12, 32–39. [Google Scholar] [CrossRef]
- Asumadu, S.A.; Owusu, P.A. Recent Evidence of the Relationship between Carbon Dioxide Emissions, Energy use, GDP and Population in Ghana: A Linear Regression Approach. Energy Source Part B Econ. Plan. Policy 2017, 12, 495–503. [Google Scholar] [CrossRef]
- Davis, S.J.; Caldeira, K.; Matthews, H.D. Future CO2 emissions and climate change from existing energy infrastructure. Science 2010, 329, 1330–1333. [Google Scholar] [CrossRef] [PubMed]
- O’neill, B.C.; Dalton, M.; Fuchs, R.; Jiang, L.; Pachauri, S.; Zigova, K. Global demographic trends and future carbon emissions. Proc. Natl. Acad. Sci. USA 2010, 107, 17521–17526. [Google Scholar] [CrossRef]
- Sarkodie, S.; Owusu, P. A Multivariate Analysis of Carbon Dioxide Emissions, Electricity Consumption, Economic Growth, Financial Development, Industrialization and Urbanization in Senegal. Energy Source Part B Econ. Plan. Policy 2017, 12, 77–84. [Google Scholar] [CrossRef]
- Schandl, H.; Hatfield-Dodds, S.; Wiedmann, T.; Geschke, A.; Cai, Y.; West, J.; Newth, D.; Baynes, T.; Lenzen, M.; Owen, A. Decoupling global environmental pressure and economic growth: Scenarios for energy use, materials use and carbon emissions. J. Clean. Prod. 2016, 132, 45–56. [Google Scholar] [CrossRef]


| Country | Kenya | Senegal | Eswatini | |||||||
|---|---|---|---|---|---|---|---|---|---|---|
| Parameter | Unit | Value | Reference Year (s) | Source | Value | Reference Year (s) | Source | Value | Reference Year (s) | Source |
| Population | Million | 48.4 | 2018 (est.) | CIA [14] | 15 | 2018 (est.) | CIA [14] | 1.09 | 2018 (est.) | CIA [14] |
| Population growth rate | % | 1.6 | 2018 (est.) | CIA [14] | 2.4 | 2018 (est.) | CIA [14] | 0.8 | 2018 (est.) | CIA [14] |
| Urbanization | % of total population | 27.5 | 2019 | CIA [14] | 47.7 | 2019 | CIA [14] | 24 | 2019 | CIA [14] |
| GDP | Billion USD | 79.2 | 2017 (est.) | CIA [14] | 21.1 | 2017 (est.) | CIA [14] | 4.4 | 2017 (est.) | CIA [14] |
| GDP real growth rate | % | 4.9 | 2017 (est.) | CIA [14] | 7.2 | 2017 (est.) | CIA [14] | 1.6 | 2017 (est.) | CIA [14] |
| GDP Per capita (PPP) | USD | 3500 | 2017 (est.) | CIA [14] | 3500 | 2017 (est.) | CIA [14] | 10,100 | 2017 (est.) | CIA [14] |
| GDP-composition, by sector of origin | ||||||||||
| agriculture | % | 34.5 | 2017 (est.) | CIA [14] | 16.9 | 2017 (est.) | CIA [14] | 6.5 | 2017 (est.) | CIA [14] |
| industry | % | 17.8 | 2017 (est.) | CIA [14] | 24.3 | 2017 (est.) | CIA [14] | 45 | 2017 (est.) | CIA [14] |
| services | % | 47.5 | 2017 (est.) | CIA [14] | 58.8 | 2017 (est.) | CIA [14] | 48.6 | 2017 (est.) | CIA [14] |
| Human development index | - | 0.579 (ranked 147 of 189 countries) | 2018 | UNDP [20] | 0.514 (ranked 166 of 189 countries) | 2018 | UNDP [20] | 0.608 (ranked 138 of 189 countries) | 2018 | UNDP [20] |
| Electricity access | ||||||||||
| population without electricity | million | 13 | 2017 | CIA [14] | 6 | 2017 | CIA [14] | - | - | - |
| electrification-total population | % | 56 | 2016 | CIA [14] | 65 | 2017 | CIA [14] | 65.8 | 2016 | CIA [14] |
| electrification-urban areas | % | 77.6 | 2016 | CIA [14] | 90 | 2017 | CIA [14] | 82.8 | 2016 | CIA [14] |
| electrification-rural areas | % | 39.3 | 2016 | CIA [14] | 43 | 2017 | CIA [14] | 61.2 | 2016 | CIA [14] |
| Energy Production | Quadrillion Btu | 0.075 | 2017 | IEA [21] | 0.0069 | 2017 | IEA [21] | 0.0065 | 2017 | IEA [21] |
| Electricity-Consumption | billion kWh | 7.8 | 2016 | CIA [14] | 3.5 | 2016 | CIA [14] | 1.4 | 2016 (est.) | CIA [14] |
| Electricity-installed generating capacity | million kW | 2.4 | 2016 (est.) | CIA [14] | 1.0 | 2016 (est.) | CIA [14] | 0.3 | 2016 (est.) | CIA [14] |
| Electricity-from fossil fuels | % of total installed capacity | 33 | 2016 (est.) | CIA [14] | 82 | 2016 (est.) | CIA [14] | 39 | 2016 (est.) | CIA [14] |
| Electricity-from hydroelectric plants | % of total installed capacity | 34 | 2017 (est.) | CIA [14] | 7 | 2017 (est.) | CIA [14] | 20 | 2016 (est.) | CIA [14] |
| Electricity-from other renewables | % of total installed capacity | 33 | 2017 (est.) | CIA [14] | 11 | 2017 (est.) | CIA [14] | 41 | 2016 (est.) | CIA [14] |
| CO2 emissions from consumption of energy | million tonnes | 18 | 2017 (est.) | CIA [14] | 8.6 | 2017 (est.) | CIA [14] | 1.1 | 2017 (est.) | CIA [14] |
| Statistic | CO2 | GDP | PEC | POP |
|---|---|---|---|---|
| Mean | 4307.898 | 8.55E+09 | 0.0743 | 13,144,562 |
| Median | 3698.17 | 5.10E+09 | 0.0550 | 9,085,303 |
| Maximum | 13,457.89 | 5.51E+10 | 0.2470 | 44,826,849 |
| Minimum | 132.012 | 3.61E+08 | 0.0077 | 603,372 |
| Std. Dev. | 3491.428 | 1.04E+10 | 0.0633 | 12,935,509 |
| Skewness | 0.789782 | 2.596235 | 0.9352 | 0.889964 |
| Kurtosis | 2.815526 | 9.967597 | 3.0433 | 2.605364 |
| Variable | CD | CIPS Level | CIPS 1st Diff | CADF Level | CADF 1st Diff |
|---|---|---|---|---|---|
| lnCO2 | 7.470 † | −1.864 | −5.973 *** | 0.438 | −4.795 *** |
| lnPEC | 8.200 † | −1.290 | −5.790 *** | 1.593 | −3.486 *** |
| lnGDP | 8.840 † | −1.896 | −4.754 *** | −0.175 | −3.966 *** |
| lnPOP | 8.880 † | −0.037 | −3.960 *** | 6.110 | −2.507 *** |
| Panel | A | B | C | D |
|---|---|---|---|---|
| Modified Dickey–Fuller t | −3.129 *** | −3.129 *** | −5.236 *** | −1.286 * |
| Dickey–Fuller t | −2.644 *** | −2.644 *** | −5.913 *** | −1.501 * |
| Augmented Dickey–Fuller t | −1.006 | −1.006 | −1.963 ** | −0.939 |
| Unadjusted modified Dickey–Fuller t | −5.486 *** | −5.486 *** | −14.642 *** | −4.018 *** |
| Unadjusted Dickey–Fuller t | −3.253 *** | −3.253 *** | −8.035 *** | −2.575 *** |
| DOLS | FMOLS | ||||||
|---|---|---|---|---|---|---|---|
| Variable | Coefficient | t-Statistic | Prob. | Variable | Coefficient | t-Statistic | Prob. |
| GDP | 1.3013 (0.3408) | 3.8185 | 0.0002 *** | GDP | 1.5527 (0.3211) | 4.8358 | 0.0000 *** |
| GDP2 | −1.0459 (0.2682) | −3.9003 | 0.0002 *** | GDP2 | −1.2476 (0.2524) | −4.9428 | 0.0000 *** |
| PEC | 0.6162 (0.1270) | 4.8504 | 0.0000 *** | PEC | 0.5621 (0.1200) | 4.6826 | 0.0000 *** |
| R2 | 0.9239 | R2 | 0.9216 | ||||
| lnCO2 | Coef. | Std. Err. | z | P > z |
|---|---|---|---|---|
| LR | ||||
| lnPEC | −0.2855 | 0.2694 | -1.0600 | 0.2890 |
| lnGDP | 0.2145 | 0.1143 | 1.8800 | 0.0610 * |
| lnPOP | 1.3672 | 0.3802 | 3.6000 | 0.0000 *** |
| SR | ||||
| Kenya | ||||
| ECT(-1) | −0.4028 | 0.1059 | −3.8000 | 0.0000 *** |
| lnPEC | 0.0517 | 0.2309 | 0.2200 | 0.8230 |
| lnGDP | −0.0447 | 0.1240 | −0.3600 | 0.7190 |
| lnPOP | −131.6134 | 63.2806 | −2.0800 | 0.0380 ** |
| _cons | −8.1012 | 2.6299 | −3.0800 | 0.0020 *** |
| Senegal | ||||
| ECT(-1) | −0.5178 | 0.1286 | −4.0300 | 0.0000 *** |
| lnPEC | 0.4385 | 0.1577 | 2.7800 | 0.0050 *** |
| lnGDP | 0.0201 | 0.1032 | 0.1900 | 0.8460 |
| lnPOP | 58.3176 | 32.4960 | 1.7900 | 0.0730 * |
| _cons | −9.9219 | 3.6142 | −2.7500 | 0.0060 *** |
| Eswatini | ||||
| ECT(-1) | −0.2325 | 0.1106 | −2.1000 | 0.0360 ** |
| lnPEC | 1.2801 | 0.3097 | 4.1300 | 0.0000 *** |
| lnGDP | 0.5122 | 0.2329 | 2.2000 | 0.0280 ** |
| lnPOP | 22.6474 | 16.0772 | 1.4100 | 0.1590 |
| _cons | −4.1624 | 2.3686 | −1.7600 | 0.0790 * |
| Panel | A | B | C | D |
|---|---|---|---|---|
| lnCO2 | — | — | 0.242 *** (0.047) | 0.411 *** (0.074) |
| lnPEC | 0.262 *** (0.033) | 0.295 *** (0.037) | — | 0.517 *** (0.051) |
| lnGDP | 0.133 *** (0.024) | 0.229 *** (0.045) | 0.236 *** (0.041) | — |
| lnGDP2 | 0.054 *** (0.015) | — | — | — |
| lnPOP | 0.140 *** (0.024) | 0.130 *** (0.028) | 0.322 *** (0.030) | 0.123 *** (0.040) |
| Diagnostics | ||||
| Number of obs | 102 | 102 | 102 | 102 |
| R2 | 0.950 | 0.950 | 0.968 | 0.920 |
| Lambda | 0.800 | 0.800 | 0.800 | 0.800 |
| Eff. df | 8.588 | 8.098 | 8.471 | 7.202 |
| Looloss | 8.728 | 8.602 | 6.707 | 14.340 |
| Panel | A | B | C | D |
|---|---|---|---|---|
| lnCO2 | ||||
| 5th Percentile | — | — | −0.136 *** (0.047) | −0.179 *** (0.074) |
| 50th Percentile | — | — | 0.290 *** (0.0470 | 0.404 *** (0.074) |
| 95th Percentile | — | — | 0.466 *** (0.047) | 0.852 *** (0.074) |
| lnPEC | ||||
| 5th Percentile | −0.034 *** (0.033) | −0.036 *** (0.037) | — | 0.136 *** (0.051) |
| 50th Percentile | 0.244 *** (0.033) | 0.267 *** (0.037) | — | 0.529 *** (0.051) |
| 95th Percentile | 0.664 *** (0.033) | 0.730 *** (0.037) | — | 1.037 *** (0.051) |
| lnGDP | ||||
| 5th Percentile | −0.206 *** (0.024) | −0.238 *** (0.045) | −0.084 *** (0.041) | — |
| 50th Percentile | 0.185 *** (0.024) | 0.273 *** (0.045) | 0.266 *** (0.041) | — |
| 95th Percentile | 0.290 *** (0.024) | 0.466 *** (0.045) | 0.493 *** (0.041) | — |
| lnGDP2 | ||||
| 5th Percentile | −0.114 *** (0.015) | — | — | — |
| 50th Percentile | 0.054 *** (0.015) | — | — | — |
| 95th Percentile | 0.149 *** (0.015) | — | — | — |
| lnPOP | ||||
| 5th Percentile | −0.018 *** (0.0240) | −0.027 *** (0.028) | 0.072 *** (0.030) | −0.063 *** (0.040) |
| 50th Percentile | 0.163 *** (0.024) | 0.141 *** (0.028) | 0.351 *** (0.030) | 0.065 *** (0.040) |
| 95th Percentile | 0.304 *** (0.024) | 0.289 *** (0.028) | 0.540 *** (0.030) | 0.483 *** (0.040) |
| Diagnostics | ||||
| Number of obs | 102 | 102 | 102 | 102 |
| R2 | 0.950 | 0.950 | 0.968 | 0.920 |
| Lambda | 0.800 | 0.800 | 0.800 | 0.800 |
| Eff. df | 8.588 | 8.098 | 8.471 | 7.202 |
| Looloss | 8.728 | 8.602 | 6.707 | 14.340 |
© 2020 by the authors. Licensee MDPI, Basel, Switzerland. This article is an open access article distributed under the terms and conditions of the Creative Commons Attribution (CC BY) license (http://creativecommons.org/licenses/by/4.0/).
Share and Cite
Sarkodie, S.A.; Ackom, E.; Bekun, F.V.; Owusu, P.A. Energy–Climate–Economy–Population Nexus: An Empirical Analysis in Kenya, Senegal, and Eswatini. Sustainability 2020, 12, 6202. https://doi.org/10.3390/su12156202
Sarkodie SA, Ackom E, Bekun FV, Owusu PA. Energy–Climate–Economy–Population Nexus: An Empirical Analysis in Kenya, Senegal, and Eswatini. Sustainability. 2020; 12(15):6202. https://doi.org/10.3390/su12156202
Chicago/Turabian StyleSarkodie, Samuel Asumadu, Emmanuel Ackom, Festus Victor Bekun, and Phebe Asantewaa Owusu. 2020. "Energy–Climate–Economy–Population Nexus: An Empirical Analysis in Kenya, Senegal, and Eswatini" Sustainability 12, no. 15: 6202. https://doi.org/10.3390/su12156202
APA StyleSarkodie, S. A., Ackom, E., Bekun, F. V., & Owusu, P. A. (2020). Energy–Climate–Economy–Population Nexus: An Empirical Analysis in Kenya, Senegal, and Eswatini. Sustainability, 12(15), 6202. https://doi.org/10.3390/su12156202