1. Introduction
As an emerging environmental policy, payment for ecosystem services (PES) has been widely used across the world [
1,
2,
3]. In contrast to traditional environmental protection policies that focus on punishment, PES projects emphasize the need to internalize the positive externality of ecosystem services and encourage land owners and land users to protect the ecosystem through incentives [
4,
5,
6,
7]. Two of the core factors in PES projects are using adequate payment criteria and using appropriate modes, both of which can help improve the efficiency and sustainability of PES projects.
The externality and non-marketability of some ecosystem services make it impossible to determine PES criteria through market-based supply and demand relationship [
8,
9,
10]. Current PES criteria are mainly determined through payment willingness, opportunity cost, ecological benefits, protection value, and practical cost [
11,
12]. However, these methods commonly consider only macro factors and rarely take into account the relationship between the payment criteria and land use opportunity cost for the compensated individual, thus failing to measure the relationship between the payment criteria and the newly-added ecosystem services [
13].
Large quantities of observation data are needed to accurately simulate the additional ecosystem services after the implementation of PES projects because of the variety of ecosystem services. Additionally, we need large amounts of social and economic survey data to determine the level of ecological compensation. Therefore, it can be difficult to carry out quantitative research into the relationship between the amount of ecological compensation and the additional increment of ecosystem services over large temporal and spatial scales. At present, most of the ecological compensation standards in China have not fully considered the cost-benefit principle of compensation amount and new ecosystem services and have focused more on the social benefits [
14].
To address this, researchers developed the minimum data method and inferred the relationship between payment criteria, land use modes, and additional ecosystem services based on analysis of the spatial distribution of the land use opportunity cost. This method has been applied in several studies with good results [
15]. It is also challenging to simulate the volume of newly-added ecosystem services using the minimum data method. Many of the PES projects implemented so far have aimed to protect water resources [
16]. Because of its strong base in physics and broad applicability, using the Soil and Water Assessment Tool (SWAT) model to simulate newly-added water conservation services can help improve the simulation accuracy of the minimum data method. The SWAT model is a physically-based distributed hydrological model that can simulate the hydrological processes and crop growth in the catchment [
17]. The model has been widely accepted and used in various fields related to water resources and the environment [
18,
19].
Current payment modes for PES projects include cash payments, in-kind payments, capacity improvement, and policy payments [
20,
21,
22]. Cash compensation is a common and simple method that allows the compensated to use the funds freely and buy corresponding goods and services according to their own preferences and needs. The compensation used for returning grain plots to forestry projects belongs to this type. However, cash compensation may result in excessive consumption and other impacts. With in-kind compensation, the compensation provider delivers lifestyle and production elements in the form of goods and services to meet the needs of the compensated. Common in-kind compensation includes cereals, forage, and production tools. Capacity compensation means that compensation providers offer technical consulting and free training for the compensated in order to lift their knowledge and skill level, help change their means of livelihood, and improve livelihood sustainability. In policy compensation, relevant government authorities will provide policy support and preferential treatment to the compensated within their scope of authority. Corresponding support will be given to the compensated area through systems and policy resources in order to promote alternative development in the compensated area, such as by providing a reduction or exemption from tax or subsidies for competitive industries. Some researchers classify cash compensation and in-kind compensation as “blood transfusion” compensation while capacity compensation and policy compensation are classified as “hematopoietic” compensation [
22]. Current studies mostly report that “hematopoietic” compensation is more sustainable and effective than “blood transfusion” compensation. However, as cash compensation and in-kind compensation are more applicable and easier to operate than policy and capacity compensation [
16], these modes tend to have been used in previous PES projects.
Research in China is mainly focused on the classification of payment types and discussions on policies, with few studies using real-world regional conditions to analyze the effectiveness of specific payment modes [
23]. Studies in other countries are engaged in exploring the impacts of different PES modes on the efficiency of PES projects [
16]. However, the impact of differences in the age, culture, and lifestyles of the compensated on their compensation needs are rarely considered. It is necessary to consider the conditions and preferences of individuals more closely to determine appropriate compensation methods and increase support for ecological compensation projects [
24].
In recent decades, many of the inland river basins in China’s northwestern arid region have experienced a common challenge. Booming populations and rapid economic development in the up- and mid-stream areas of the river basins have increased the consumption of water and diminished the water available for ecological processes. Terminal lakes have dried up, sandstorms have become more common, and the vegetation has a tendency of degradation, leading to a series of severe ecological disasters [
25]. To change this situation, the Chinese government has implemented ecological compensation control projects for the upper, middle, and lower reaches of river basins. For example, in the Heihe River Basin, the second largest inland river basin in China, some economic compensation will be given to local residents to return farmland to forests and grassland in the upper and middle reaches. This will control unsustainable agricultural activities, change land use, and increase the supply of ecosystem services such as water resource conservation, which will improve the condition of the local ecosystem. However, because of the need for large amounts of observation and survey data, research determining the optimal ecological compensation standards and compensation methods is still rare.
Given the above facts, this paper simulated the additional water conservation volume after implementing PES using the SWAT model, considered the opportunity cost of banning grazing in grasslands, and analyzed the relationship between PES criteria and additional water conservation volume using the minimum data method [
26]. The paper also explored the most suitable PES mode for the study area in the upper reaches of the Heihe River by analyzing the payment willingness and payment preference of different social groups. It aims to offer a reference for this area and other similar areas during development of PES policies.
In this article, we first describe the research materials and methods. Next, we present the results on the quantitative relationship between compensation standards and new ecosystem services and on the optimal ecological compensation method under the influence of different factors. Then the significance and shortcomings of this study are discussed and conclusions and policy opinions are provided.
2. Materials and Methods
2.1. Study Area
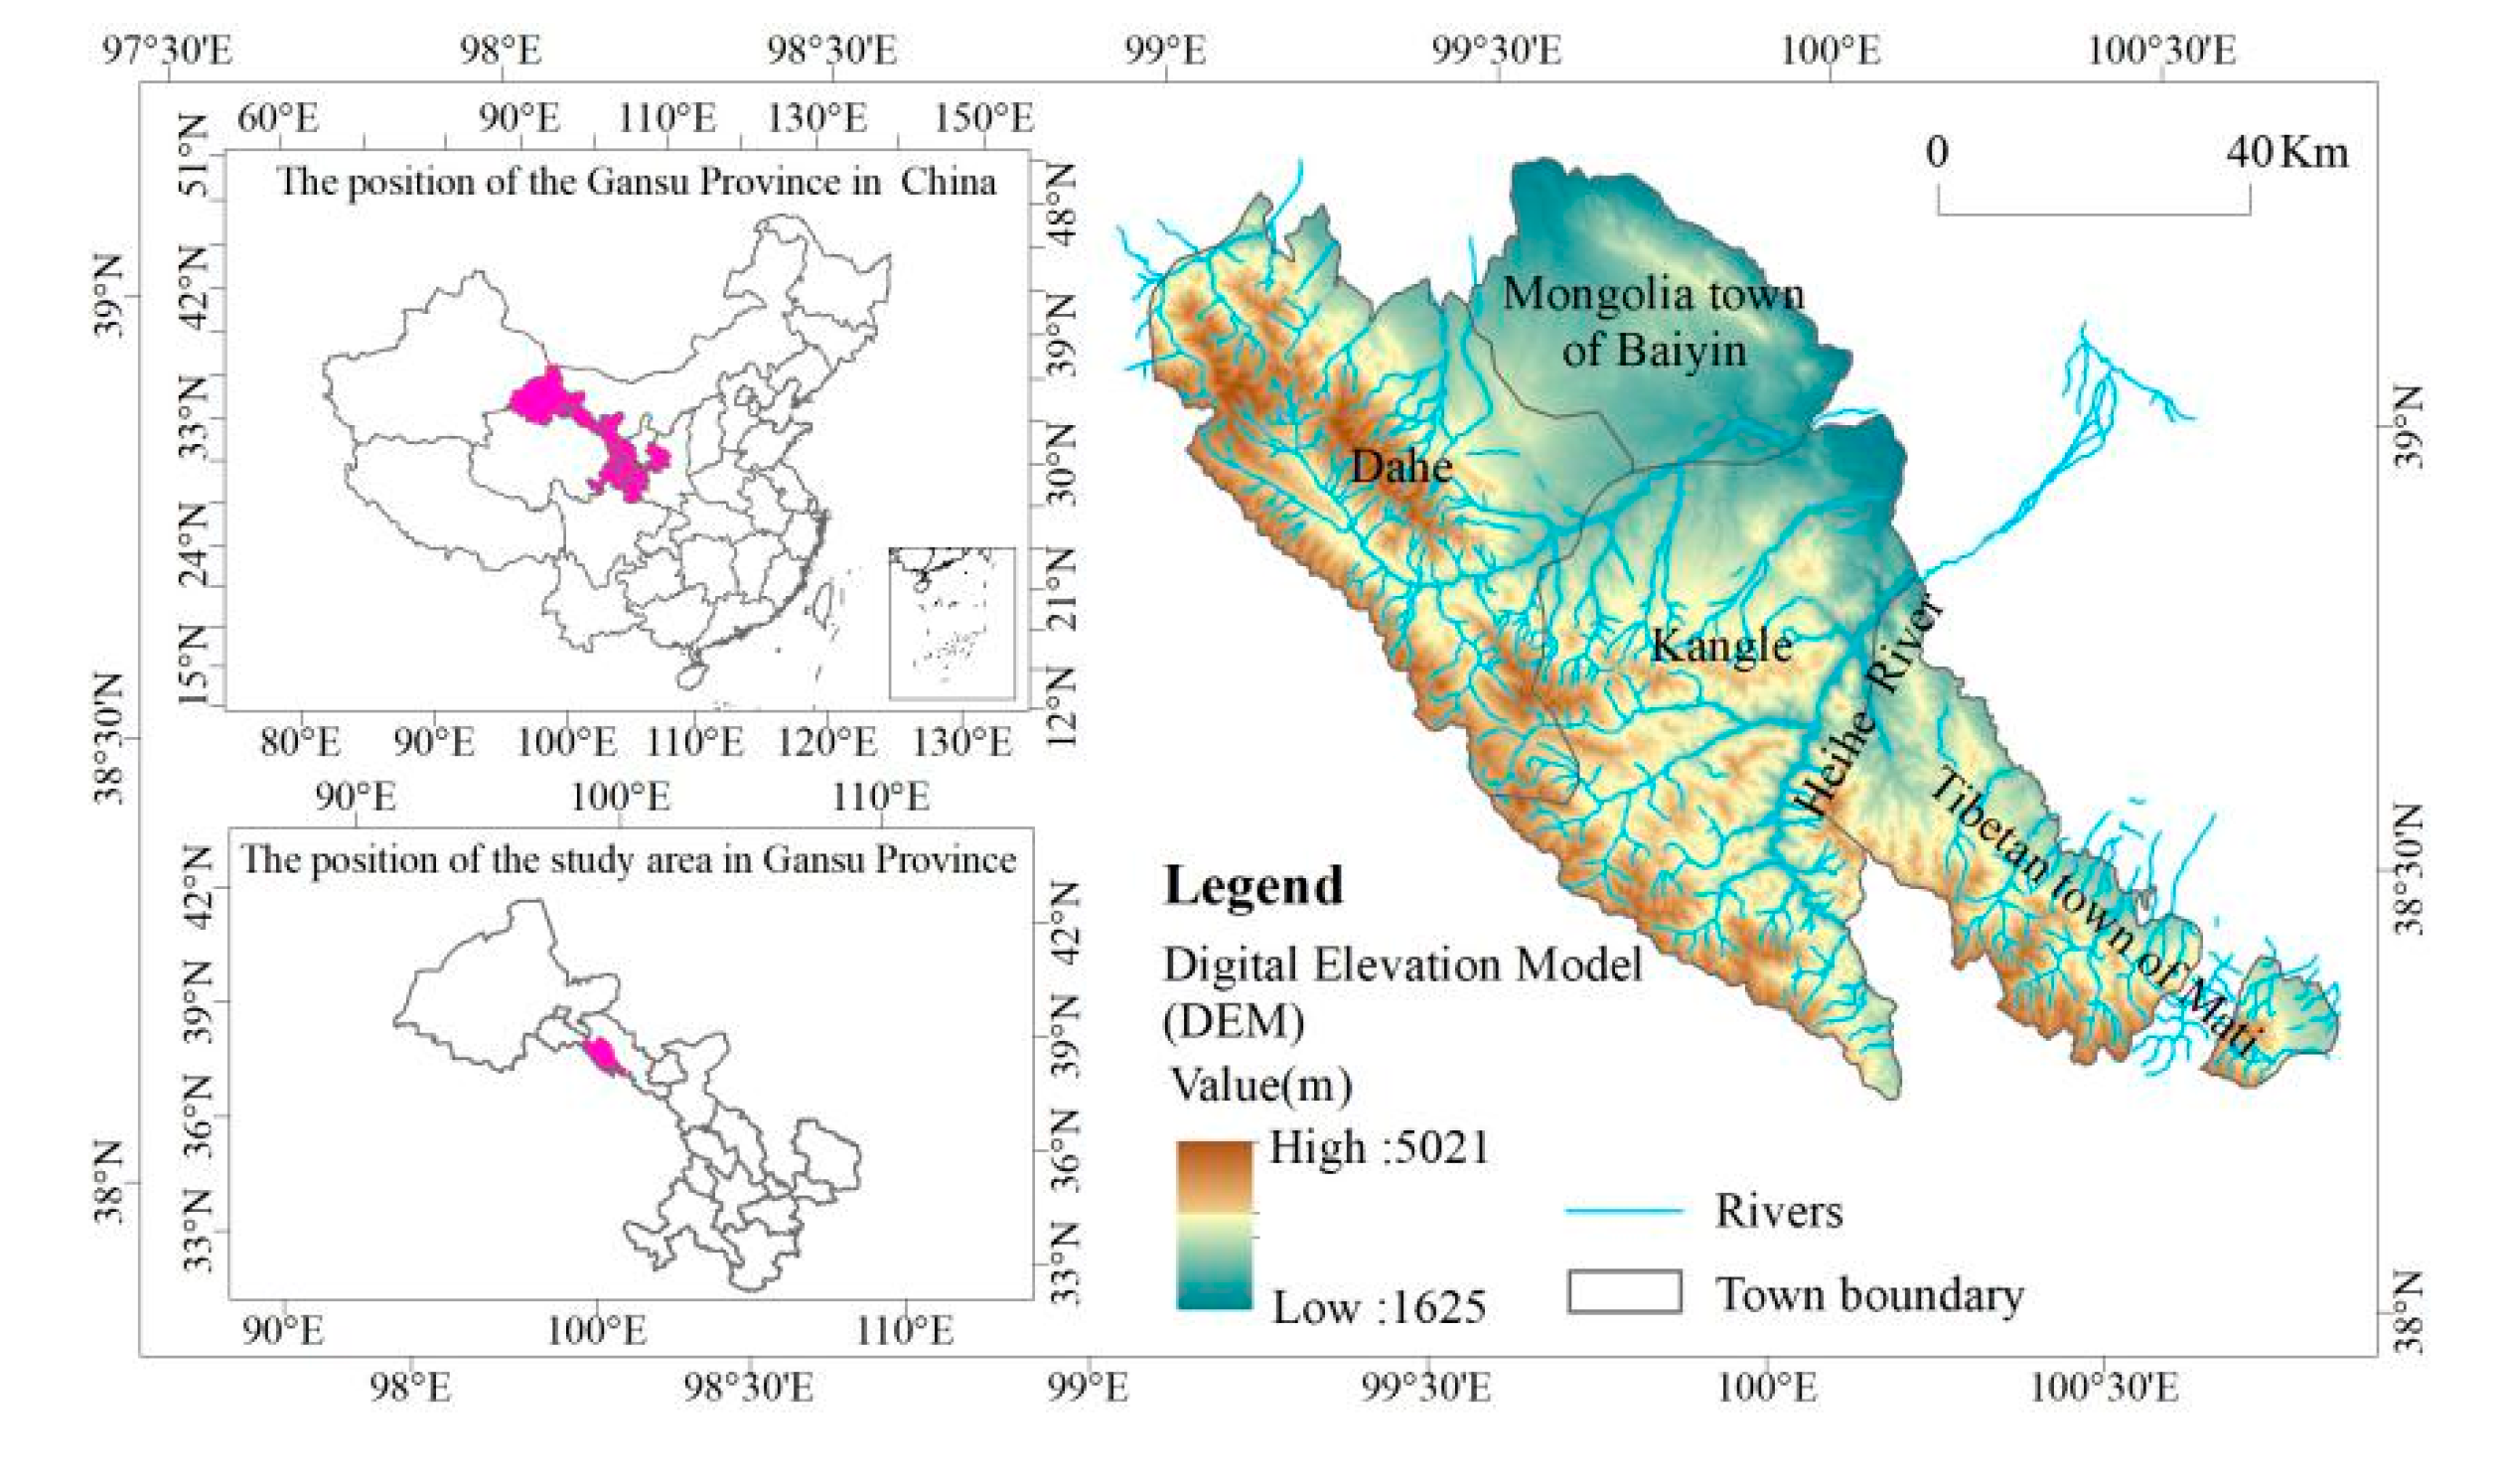
The study area is located in Sunan County (
Figure 1), in the upper reaches of the Heihe River, which is sourced from the north Qilian Mountains. The main stream of the Heihe River is 821 km and it is the second largest inland river in northwest China. The river basin is located at 98°–102° E and 37°50′–42°40′ N, covering 142,900 km
2. In 2018, the total population was 34,400, and the population density was 1.5 persons/km
2. Since the 1950s, many water conservancy infrastructure and land reclamation projects have occurred, forming a large area of artificial oasis and creating huge agricultural economic benefits. Sunan County is the most significant zone for ecological functions in the Qilian Mountains, and it is also a key ecological function zone for China. However, human activities have led to significant changes to land use and land cover, resulting in continuing degradation of the ecosystem. Sunan County is the only autonomous county for the Yugu people in China, and animal husbandry is its main industry. The deep river valleys within the county are surrounded by high mountains, and the riverbeds are steep. The climate is moist and cold, with a mean annual temperature below 2 °C. The annual rainfall in this county reaches 350 mm, making Sunan the major water conservation area for the Heihe River. In 2005, grassland was the largest land use type, accounting for 51.74% of the county. Forest, cultivated land, construction land, water, and unused land accounted for 25.49%, 0.67%, 0.05%, 1.34%, and 20.70%, respectively. Because of global environmental change and increasing human activities, grassland degradation and desertification as well as the decline of grassland quality have become major environmental problems in the region. The Several Opinions on Further Supporting Economic and Social Development of Gansu Province Report, issued by the State Council in 2010, proposed the Qilian Mountain PES Experiment Area to safeguard the ecological safety of the Hexi Corridor and align the Qilian Mountain PES Project with national strategies. The first policy round for grassland ecological protection and subsidies was implemented in China in 2011. The herders were given a grazing prohibition subsidy of 90 yuan/ha for five years in Sunan County. The area of grassland under the policy in Sunan County between 2011 and 2015 was 1.39 million ha, including 0.456 million hectares with a grazing prohibition, affecting 26,388 people in the county. Sunan County was listed also as a pilot for comprehensive ecological compensation in 2020 to further improve the compensation mechanism in China.
2.2. Data Sources
This study collected data for the SWAT model, the opportunity cost of land use, and herders’ compensation willingness. The SWAT model was used to simulate additional water conservation services, which was the sum of additional soil water content and water yield in each sub basin after the implementation of PES. The input parameters in the SWAT model included spatial and attribute data. The digital elevation model (DEM), land-use land-cover change data in 2005, and meteorological and daily runoff data for the Yingluoxia hydrological station (1990–2000) were provided by the Cold and Arid Region Scientific Data Center (
http://data.casnw.net). Spatial data also included a 2005 land use map (1:100,000) and soil map (1:100,000). Soil attributes were derived from the World Soil Database (
http://data.casnw.net). The DEM was used to identify sub basins in Sunan County.
The opportunity cost data for land use and transformation and data on the herders’ compensation willingness were obtained from a field investigation and interviews. The field investigation was conducted in Sunan County, Zhangye City between 28 March and 9 April 2011, during which we investigated households and carried out random visits in the towns of Dahe, Kangle, Baiyin, and Mati, and in villages under their jurisdiction. We issued 117 PES questionnaires, of which 104 (88.9%) questionnaires were valid. Visits were made to the 104 herder households, accounting for approximately 4.1% of all herder households within the study area. The data included the age, nationality and other basic information of respondents, 2009 and 2010 herders’ income from animal husbandry within the study area (e.g., sales revenues from lambs, sheep, yak, and wool), expenditure for animal husbandry (e.g., feed cost, epidemic prevention cost, fuel cost, and pasture change cost), engagement willingness for a no-grazing PES project (e.g., the impact of the ecological project on environmental improvement and satisfaction with current PES policies), and choice of no-grazing PES delivery mode (e.g., expected compensation standards and modes).
We chose to use meteorological and runoff data from 1990 to 2000 because, after 2000, the local government constructed many more dams and drainage systems in the Heihe River Basin, which resulted in some station data being heavily influenced by artificial controls. Although these data may seem dated, they ensure that the natural observations and simulations used in this study were similar to the time period of the socio-economic and the opportunity cost survey (2011) used in this paper. This ensures comparability before and after the implementation of ecological compensation projects.
2.3. Methods
The SWAT model simulation was conducted using ArcSWAT2005 while the data analysis was carried out with Excel (Version: 2003, Washington, DC, USA), SPSS (Version: 17.0, IBM Inc., Chicago, IL, USA) and Matlab (Version: 7.0, MathWorks Inc., Natick, MA, USA).
2.3.1. Calculation of Additional Water Conservation
Based on simulation results of the SWAT model, this paper used the sum of additional soil water content and water yield to indicate the additional water conservation. The formula is as follows:
where e stands for additional water conservation per area of the PES basin, e
sw stands for additional soil water content after PES simulation in the basin with the SWAT model, and e
wy stands for additional water yield after PES simulation in the basin with the SWAT model.
2.3.2. Calculation of Opportunity Cost of Land Use and Transformation
To improve the water conservation capacity of grass, it is necessary to use grazing prohibition to restore overgrazed grasslands with a low grass coverage. The opportunity cost shows the economic loss of local herders after grazing prohibition, namely the minimum compensation for transforming from grazing to no grazing. After implementing the grazing prohibition in pasture, the economic income from grazing will be 0 and the opportunity cost for the change in land use type is the current income from grazing. The opportunity cost estimation was based on questionnaires and calculated according to Formula (2) after analyzing the input and output per area of grass in the study area.
The herding income per area of grass under current grazing conditions can be used to indicate the opportunity cost of per area of grass transformed from grazing to no grazing. The formula is as follows:
where C
opp stands for opportunity cost of grazing prohibition and B
i, U
i are separate income and expenditure per herder household per area of grass.
2.3.3. Calculation of Payment Criteria
This paper inferred the supply of additional ecosystem services through spatial distribution of the opportunity cost of the ecosystem service based on the minimum-data method [
27], analyzed the supply curve of ecosystem services, and identified the payment criteria under different grazing-no grazing ratios. The minimum-data method assumes that each land unit adopts the grazing method (a) and no grazing method (b), where the additional water conservation is 0 in (a) and e in (b). It was assumed that herders’ decisions on land use were all based on expected revenue v(p,s,z) from using the land to the maximum extent, where p is the output price parameter, s is the land parcel, and z = a/b, which indicates the land use method. The selection mechanism of land use methods by land users is:
If ω(p,s) > 0, land users will choose (a); if not, they will choose (b). After confirming the probability density function φ(ω) through sequencing the ω(p,s), of all land use units, the ratio of land units adopting method (b) can be calculated, namely r(p):
If the total land area is H, then the ecosystem services S(p) that can be supplied are:
When providing PES compensation funds for herders that promote the transformation from (a) to (b), then the selection mechanism for land use methods by land users will be ω(p,s) − p
e > 0; when ω(p,s) > p
e, land users will choose (a); if not, they will choose (b). Thus, when the payment criteria are p
e, land with an opportunity cost between 0 and p
e will be transformed from (a) to (b) and the ratio of such land will be:
The total supply of water conservation is:
The supply of newly-added water conservation is:
According to Formula (8), we can calculate corresponding payment criteria when the additional ecosystem service volume or no-grazing ratio is known.
3. Results
3.1. Calculation of PES Criteria
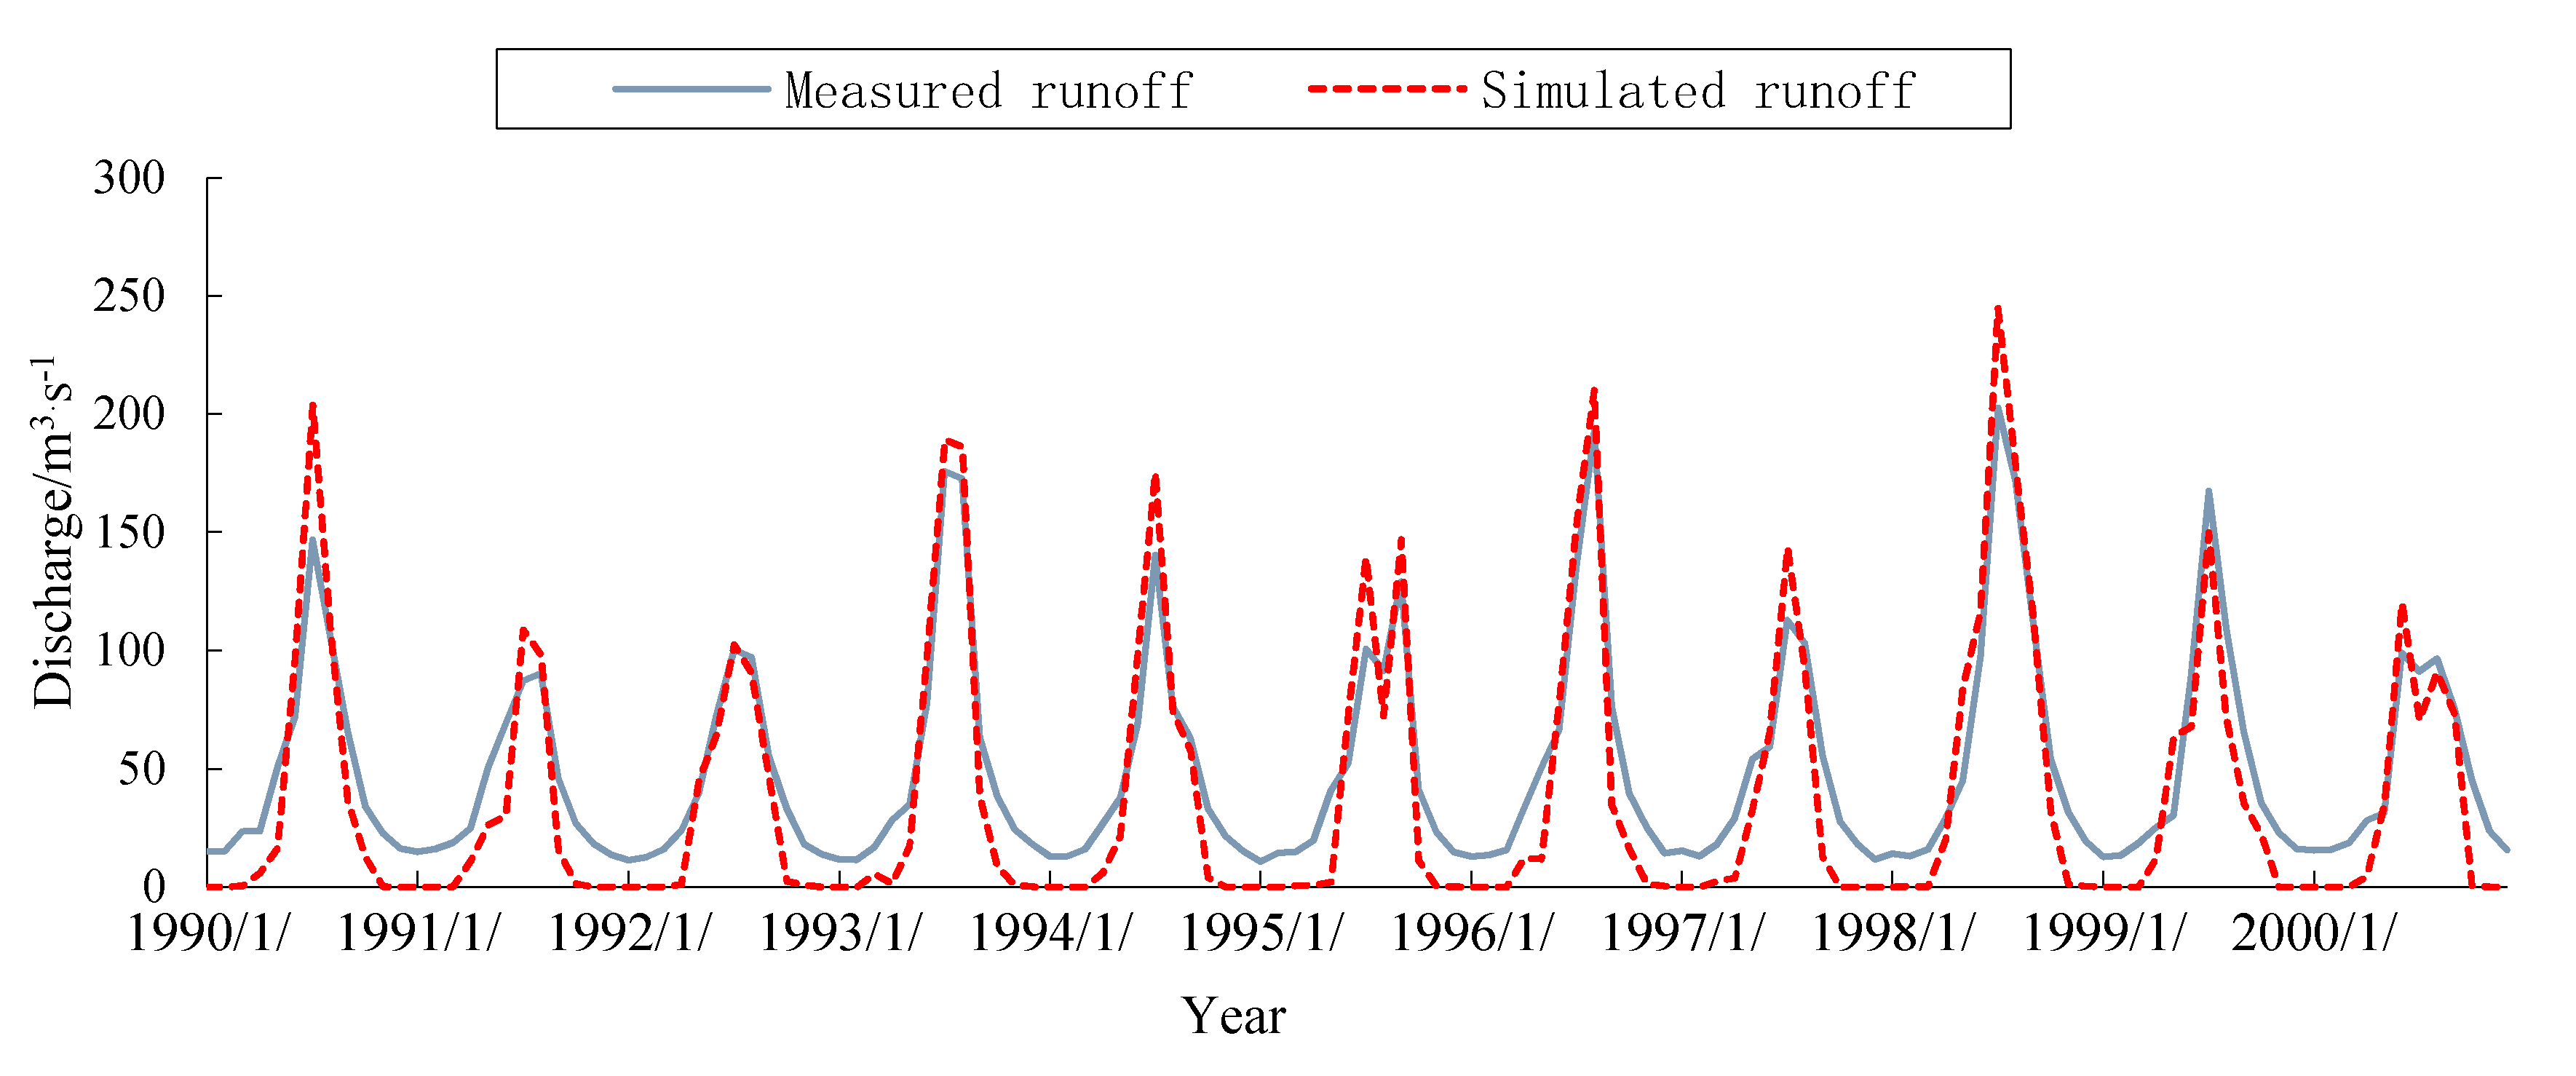
The model was established using spatial and attribute data in ArcSWAT2005. The monthly runoff data from the Yingluoxia hydrometric station (1990–1995) was used for parameter calibration while the monthly runoff data from the Yingluoxia hydrometric station (1996–2000) was used for verification (
Figure 2). The result showed that the relative errors between annual average runoffs during the calibration period and the validation period of the SWAT model were 17.5% and 16.8%, respectively, meeting the reliability standard. The coefficient of determination (R
2) and Nash-Sutcliffe coefficient of efficiency (Ens) between the measured and simulation value of monthly average runoff were both >0.6. The R
2 reached 0.93 and 0.92, and the Ens reached 0.78 and 0.83. The simulation achieved good results, showing that the model was suitable for use in the study area.
This paper indicated the additional water conservation of grassland after the change in land use types from PES using the additional soil water content and water yield. Water conservation after PES in Sunan County was simulated by setting the simulation scenario to transform current grassland with a low and medium coverage to high-coverage grassland based on the targeted effect after PES. Formula (1) is used to estimate the additional water conservations after PES in sub-basins (
Table 1).
According to analysis of land use in 2005, we found that the total grass area in the study area was 164,262 ha, including a regressive grassland area (that is, where grassland coverage declined) of 117,194 ha, accounting for 71.35% of the total grass area. Out of this, 76,723 ha (46.7%) of the total grass area was low coverage suffering from serious degradation, while 40,471 ha (24.65%) was medium coverage suffering from slight degradation.
The PES targets were classified into near-term and long-term targets according to the current conditions of degradation in the study area and fund inputs in PES. The near-term targets referred to returning grazing land to grassland and PES for seriously degraded grassland (46.7% of the total), while the long-term targets referred to returning grazing land to grassland and PES for all regressive grassland (71.35% of the total).
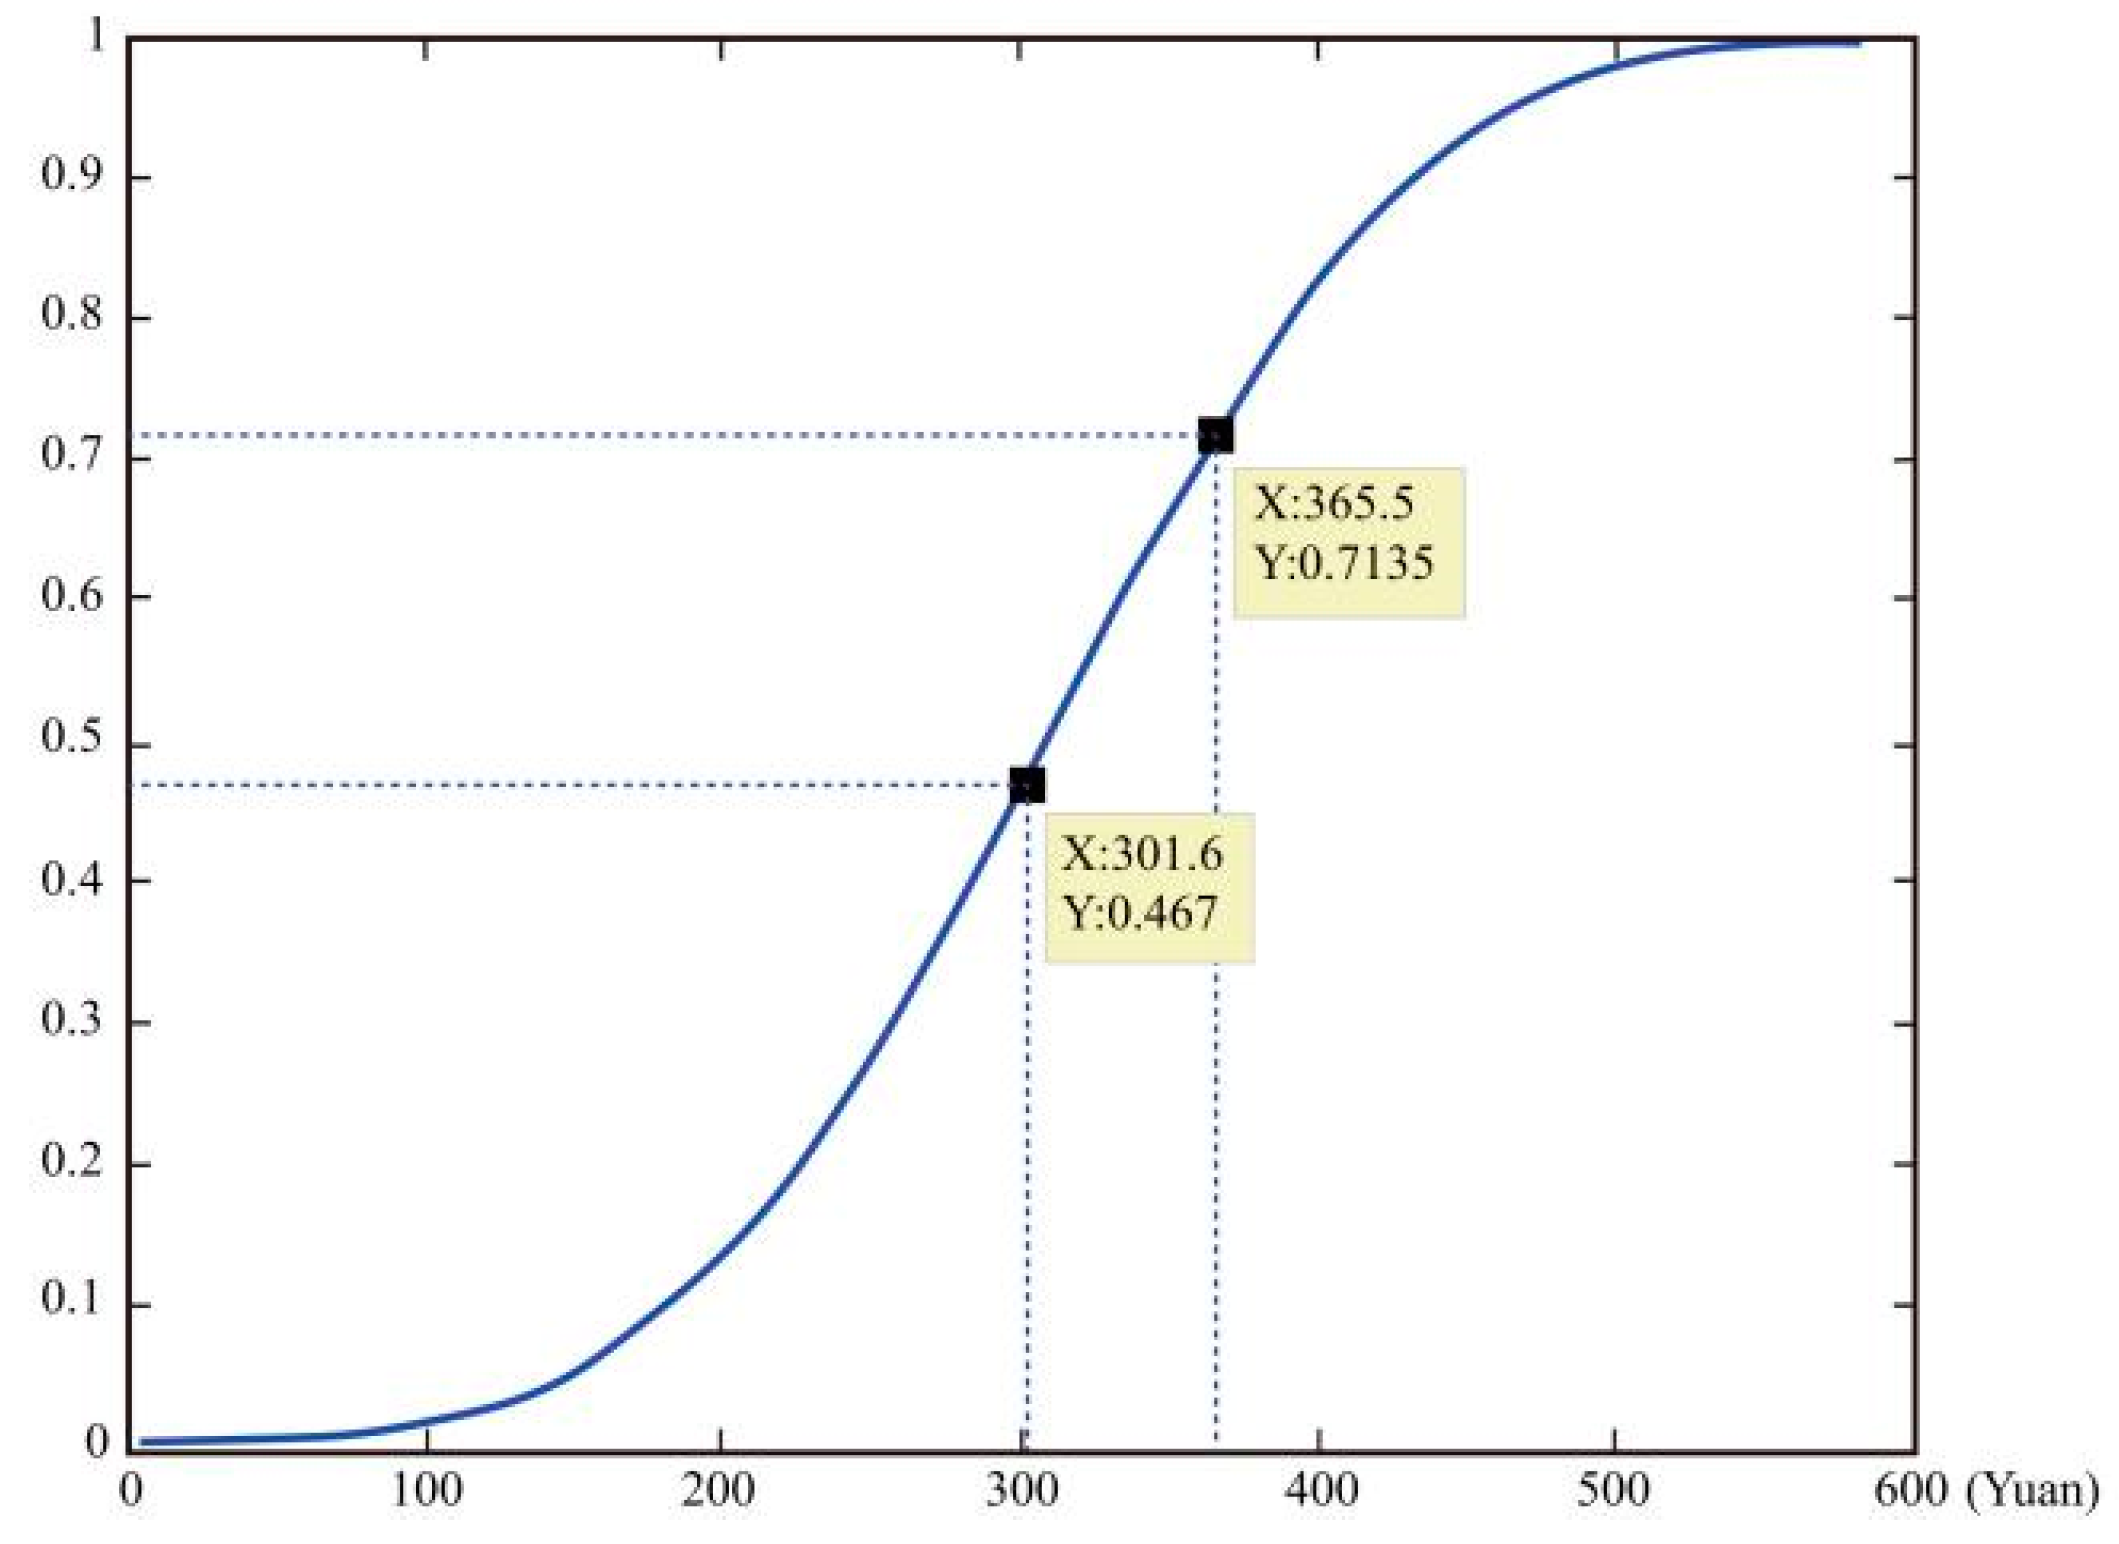
The relationship between payment criteria with the ratio of no grazing grassland (
Figure 3) and with the supply curve of conservation of water resources in the study area (
Figure 4) were calculated with Formulas (5)–(7) according to the spatial distribution of opportunity costs, ω, for grass use and transformation and in combination with the simulation results of additional water conservation.
The figures show that, as the payment criteria improved, the ratio of no-grazing grassland increases, also increasing additional water conservation. When the compensation reaches 600 yuan/ha, almost all grassland is in grazing prohibition. According to the near-term and long-term targets of returning grazing land to grassland and PES for grassland mentioned above, and based on Formulas (7) and (8), it can be seen that, when the payment criteria reaches 301.6 yuan/ha, all grass suffering from serious degeneration becomes no-grazing and additional water conservation amounts to 1.69 × 10⁶ m3 annually; when the payment criteria reaches 365.5 yuan/ha, all regressive grassland can show a grazing prohibition and additional water conservation amounts of up to 2.59 × 10⁶ m3 annually.
3.2. Study on Payment Modes
The study area has implemented a PES project of returning grazing land to grassland since 2006, with many herders involved. Of the 104 valid questionnaires, 97 herder households participated in PES projects, accounting for 91.51% of households. This level validated our investigation results. Ninety-three of the 97 households (95.88%) thought that returning grazing land to grassland improved local grass quality. However, none of the 97 herder households were satisfied with current PES criteria and thought the amount was too low. In the field investigation, local PES for returning grazing land to grassland was 37.13 yuan/ha, while the average income from grazing was around 310 yuan/ha. Only 5.15% of interviewees were willing to continue to participate in PES projects under current criteria; 36.08% of herders were willing to participate if the criteria were higher than 90 yuan/ha, and 97.94% of herders were willing to participate if the criteria were higher than 180 yuan/ha. Low payment criteria were the main factors that influenced herders’ participation in PES projects. Thus, the key to improving herders’ participation is to raise the PES payment.
To analyze local herders’ preferences for payment modes, we identified four payment modes in the questionnaire, including “cash” (cash compensation), “Cereals, forage, and farm tools” (in-kind compensation), “technical trainings” (capacity compensation), and “preferential policies” (policy compensation). The herders were able to choose one or two items.
Analysis on questionnaires showed that four kinds of selection were made in total, namely “cash”, “cash + in-kind compensation”, “cash + capacity”, “cash + policy”, while other individual items and combination items were not selected. The interviewees below 40 years old and above 40 years old showed obvious difference in preferences for payment modes, with specific ratios shown in
Table 2.
Table 2 shows that cash, which 33.02% interviewee choose as the first choice, is the mode most favored by most local herders; 31.13% of interviewees choose “cash + capacity”; and only 9.43% choose “cash + policy”. All the choices included some cash compensation. Through interviews with herder households, we found that herder households commonly thought that cash compensation was the most trusted and tangible payment and could be spent according to individual needs.
The analysis of the compensation preferences of interviewees above and below 40 showed that there were significant differences between the two groups. The herders under 40 preferred the “hematopoietic” mode, that is, “cash + capacity” compensation, while those above 40 preferred the “blood transfusion” mode, that is, “cash + in-kind compensation”. During the interviews, we found that herders above 40 were less willing to implement new technologies and qualify for new jobs through training, and the “cash + in-kind compensation” mode would give them a stable income for life. The herders below 40 wished to develop new careers and improve their revenues through training.
4. Discussion
4.1. Ecosystem Services Selection
The primary objective of PES projects is to restore and protect the local ecosystem and improve the supply quality of ecosystem services within the area. Our study has shown that PES is an effective way to conserve the grassland in Sunan County. When offered certain payment criteria, herders would change their land use to produce additional water conservation services. The combination of the SWAT model and the minimum-data approach was time-saving and cost-effective for decision-making. For effective PES schemes, it is necessary to select one or more ecosystem service based on the environmental problems faced in different regions, screen the regional PES projects and participants according to the supply capacity of ecosystem services, and determine the payment criteria. In our study area, the Heihe River Basin, the shortage of water resources leads to other environmental problems and restrains social and economic development. Thus, this paper chose water conservation as the main ecosystem service to study. Realizing that the combination of ecological protection of grassland and income increases for herders is an important premise for the sustainable implementation of ecological compensation. Herders mainly consider the reciprocal relationship between income loss and compensation. The current payment criteria are relatively low in Sunan County, which reduces the willingness to participate.
4.2. Practical Implications for PES Projects
Since 1998, China has implemented a series of large-scale PES projects that have involved restoring farmland and grazing land to forestry or grassland [
28,
29]. Although these projects play a critical role in restoring and improving China’s natural ecosystem, problems such as inadequate payment criteria and lack of multiple payment modes have also emerged during implementation [
30,
31]. To manage PES projects in the past, the government usually applied a “one size fits all” approach by dividing the payment criteria and defining the payment mode according to spatial regions. For example, the national project of returning farmland to forestry or grassland divided the payment criteria as per the Yangtze River Basin and Yellow River Basin and specified the payment terms for eight years, during which time compensation of cash and cereals were provided. The payment criteria and modes did not align with the rapid development of society and the economy, resulting in re-cultivation of farmland and illegal grazing in no-grazing areas. The demands to adjust payment criteria and diversify payment modes have increased day by day.
In China’s previous PES projects, the payment criteria were determined from the macro perspective, and static payment modes were adopted [
27]. Such mechanisms ignore differences among regions and individuals and cause an imbalance between the payment amount and the losses incurred by the compensated, thus impacting on the participation willingness and sustainability of PES projects. To address this requires the establishment of a dynamic mechanism for determining PES criteria based on local residents’ participation willingness, the real economic losses incurred, and actual conditions. Relevant departments should determine proper payment criteria in accordance with local conditions and adjust the criteria regularly to reflect local inflation circumstances. Through the above analysis, we found that the main factor influencing herders’ participation willingness in ecological compensation in the study area was that the compensation criteria payments were too low. Thus, lifting the compensation criteria would effectively improve herders’ participation willingness.
As social groups in different regions have different payment needs, identical payment modes prejudice the sustainability of local residents’ livelihood. We suggest using a mixture of payment modes, including cash, in-kind compensation, policy, and capacity. The development of multiple and adequate payment modes should be based on the real needs of different social groups and the payment preferences of the compensated. Although most herders first chose cash compensation, differences were found among different herder groups, mainly because of different risk appetites. The herders who were older and less confident about learning hoped to gain a stable income for life while those who were younger and more willing to learn hoped to grasp the skills required for new careers in order to improve their living standards. For example, the “cash + in-kind compensation” mode should be provided to herders above 40 to ensure a stable livelihood; while for those below 40, the “cash + capacity” mode should be provided, including training in practical skills applicable in local areas, such as driving and mining machinery operation. Through this method, herders below 40 can attain new skills and upgrade their jobs. Meanwhile, the social security system within regions implementing PES projects should be further improved, so as to provide basic life and medical guarantees for people with special difficulties within the region.
4.3. Limitations
Exploration of proper payment criteria and modes can improve the implementation of PES schemes. In our study, the SWAT model and minimum-data approach were used to simulate additional water conservation services, and the payment mode was examined through field investigation. The SWAT model performed well, and the payments criteria highlighted the preferences of local herders for different modes. However, this study had some limitations. First, the meteorological and hydrological data used in the SWAT model were from 1990 to 2000. Since 2000, the increased intensity of human activities, such as reservoir and canal construction, has strongly altered the natural cycles of hydrological water resources. Therefore, the use of data for this time period, although somewhat dated, had the advantage of being less disturbed by human activities and more consistent with socio-economic survey data. Second, there were some parameters in the minimum-data approach that would benefit from a sensitivity analysis to calibrate the results. Third, the no-grazing setting was relatively simple. Different grazing prohibition scenarios could be set up to explore their impact on the supply of additional water conservation services. Nevertheless, our study provided a scientific reference for the implementation of ecological compensation in Sunan County and a reference for other regions to carry out relevant research.


 ,
, 


