Article

Seasonal Variation of Indoor Radon Concentration Levels in Different Premises of a University Building

1
Research Institute of Environmental Protection, Vilnius Gediminas Technical University, Sauletekis avenue 11, LT-10223 Vilnius, Lithuania
2
Department of Environmental Protection and Water Engineering, Vilnius Gediminas Technical University, Sauletekis avenue 11, LT-10223 Vilnius, Lithuania
*
Author to whom correspondence should be addressed.
Sustainability 2020, 12(15), 6174; https://doi.org/10.3390/su12156174
Submission received: 25 June 2020 / Revised: 29 July 2020 / Accepted: 29 July 2020 / Published: 31 July 2020

Abstract

:
In the present study, we aimed to determine the changes of indoor radon concentrations depending on various environmental parameters, such as the outdoor temperature, relative humidity, and air pressure, in university building premises of different applications and heights. The environmental parameters and indoor radon concentrations in four different premises were measured each working day over an eight-month period. The results showed that the indoor radon levels strongly depended on the outside temperature and outside relative humidity, whereas the weakest correlations were found between the indoor radon levels and indoor and outdoor air pressures. The obtained indoor radon concentration and environmental condition correlations were different for the different premises of the building. That is, in two premises where the ventilation effect through unintentional air leakage points prevailed in winter, positive correlations between the radon concentration and outside temperature were obtained, reaching the values of 0.94 and 0.92, respectively. In premises with better airtightness, negative correlations (R = −0.96 and R = −0.62) between the radon concentrations and outside temperature were obtained. The results revealed that high quality air isolation in premises could be an important factor for higher indoor radon levels during summer compared to winter.

1. Introduction

Radon 222Rn is an odorless and colorless radioactive gas [1,2]. It is formed from the decay of 226Ra, which is a member of the 238U decay chain [3,4,5]. Ionizing radiation can cause harm to human health [6,7]. As radon is one of the natural ionizing radiation sources [8] and is the second cause (after smoking) of lung cancer, a great deal of effort is spent monitoring and forecasting the radon concentrations in the premises of buildings [9].
The radon concentration levels in a building differ depending on the characteristics of the climate (atmospheric pressure, relative humidity, and temperature) and building, as well as on what rocks the building is built [10,11]. In Lithuania, as in many other countries, the main source of radon in buildings is gas flow from the soil. The indoor radon concentration depends on radon exhalation from the soil and building materials, the isolation and height of premises, and the ventilation intensity [12]. Radon has seasonal variations [9,13]. One of the reasons why indoor radon concentration is higher in winter is because in winter, the windows and doors are generally closed, which results in increased accumulation of radon in closed premises [9]. The outdoor and indoor air exchange is an important parameter that influences the indoor radon concentration [14,15].
Radon gas infiltration from the soil into buildings is controlled by many physical and meteorological factors related to the environment, building construction, and the type of ventilation [16,17]. Differences between the indoor and outdoor temperature lead to the difference of air density and pressure between the premises of the building and outdoors. The difference between the indoor and outdoor pressure is the main driving force causing the air flow between the outside and inside of the building [18]. Another important factor influencing the radon concentration in premises is the indoor microclimate—the indoor temperature, indoor humidity, and air change rate in the premises [19].
The relationships between indoor radon concentrations and meteorological parameters have been investigated by numerous researchers and various results have been reported. In the majority of cases, higher indoor radon levels were observed in winter, when the outdoor temperature was low [10,20,21,22]. However, some studies observed elevated radon concentrations in the warm period of year [18]. For example, Hubbard et al. (1992) studied the effect of outdoor temperature on radon concentration in two dwellings and found that indoor radon concentration increased with increasing outdoor temperature. This was explained by the ventilating effect, which was dominant in that house in the winter period [18]. Kitto (2005) reported that the diurnal indoor radon levels in the basement of a single-family house were mostly influenced by the difference between the indoor and outdoor temperatures; however, little correlation between the indoor radon concentrations and barometric pressure and wind speed were found [23].
Xie et al. (2015) found that indoor radon levels were mostly influenced by the indoor–outdoor barometric pressure difference in a two-story building (correlation coefficient R = 0.67) [21]. Aquilina and Fenech (2019) studied the influence of various meteorological parameters on indoor radon levels in four different locations in the Maltese Islands and found that indoor radon levels mostly depended on the outdoor relative humidity and wind speed [24]. The majority of the studies on indoor radon levels and their seasonal variations were performed in dwellings [1,10,13,23,25]. However, some studies were performed on indoor radon levels in workplaces, such as offices and industrial buildings [26,27,28,29], hospitals [26,30,31], and schools [26,32]. Only limited data are available regarding indoor radon levels and their seasonal changes in university buildings [33].
The aim of this study was to analyze the dependence of the indoor radon concentrations on various meteorological parameters in four different premises of a university building that was built in 1985. The meteorological parameters and the radon concentrations were measured each working day and the average monthly values were calculated. During the study period, the premises of the university building were used as usual.

2. Experimental Methods

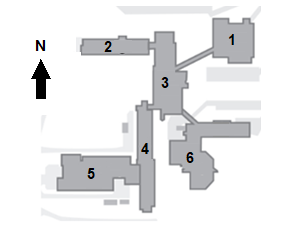
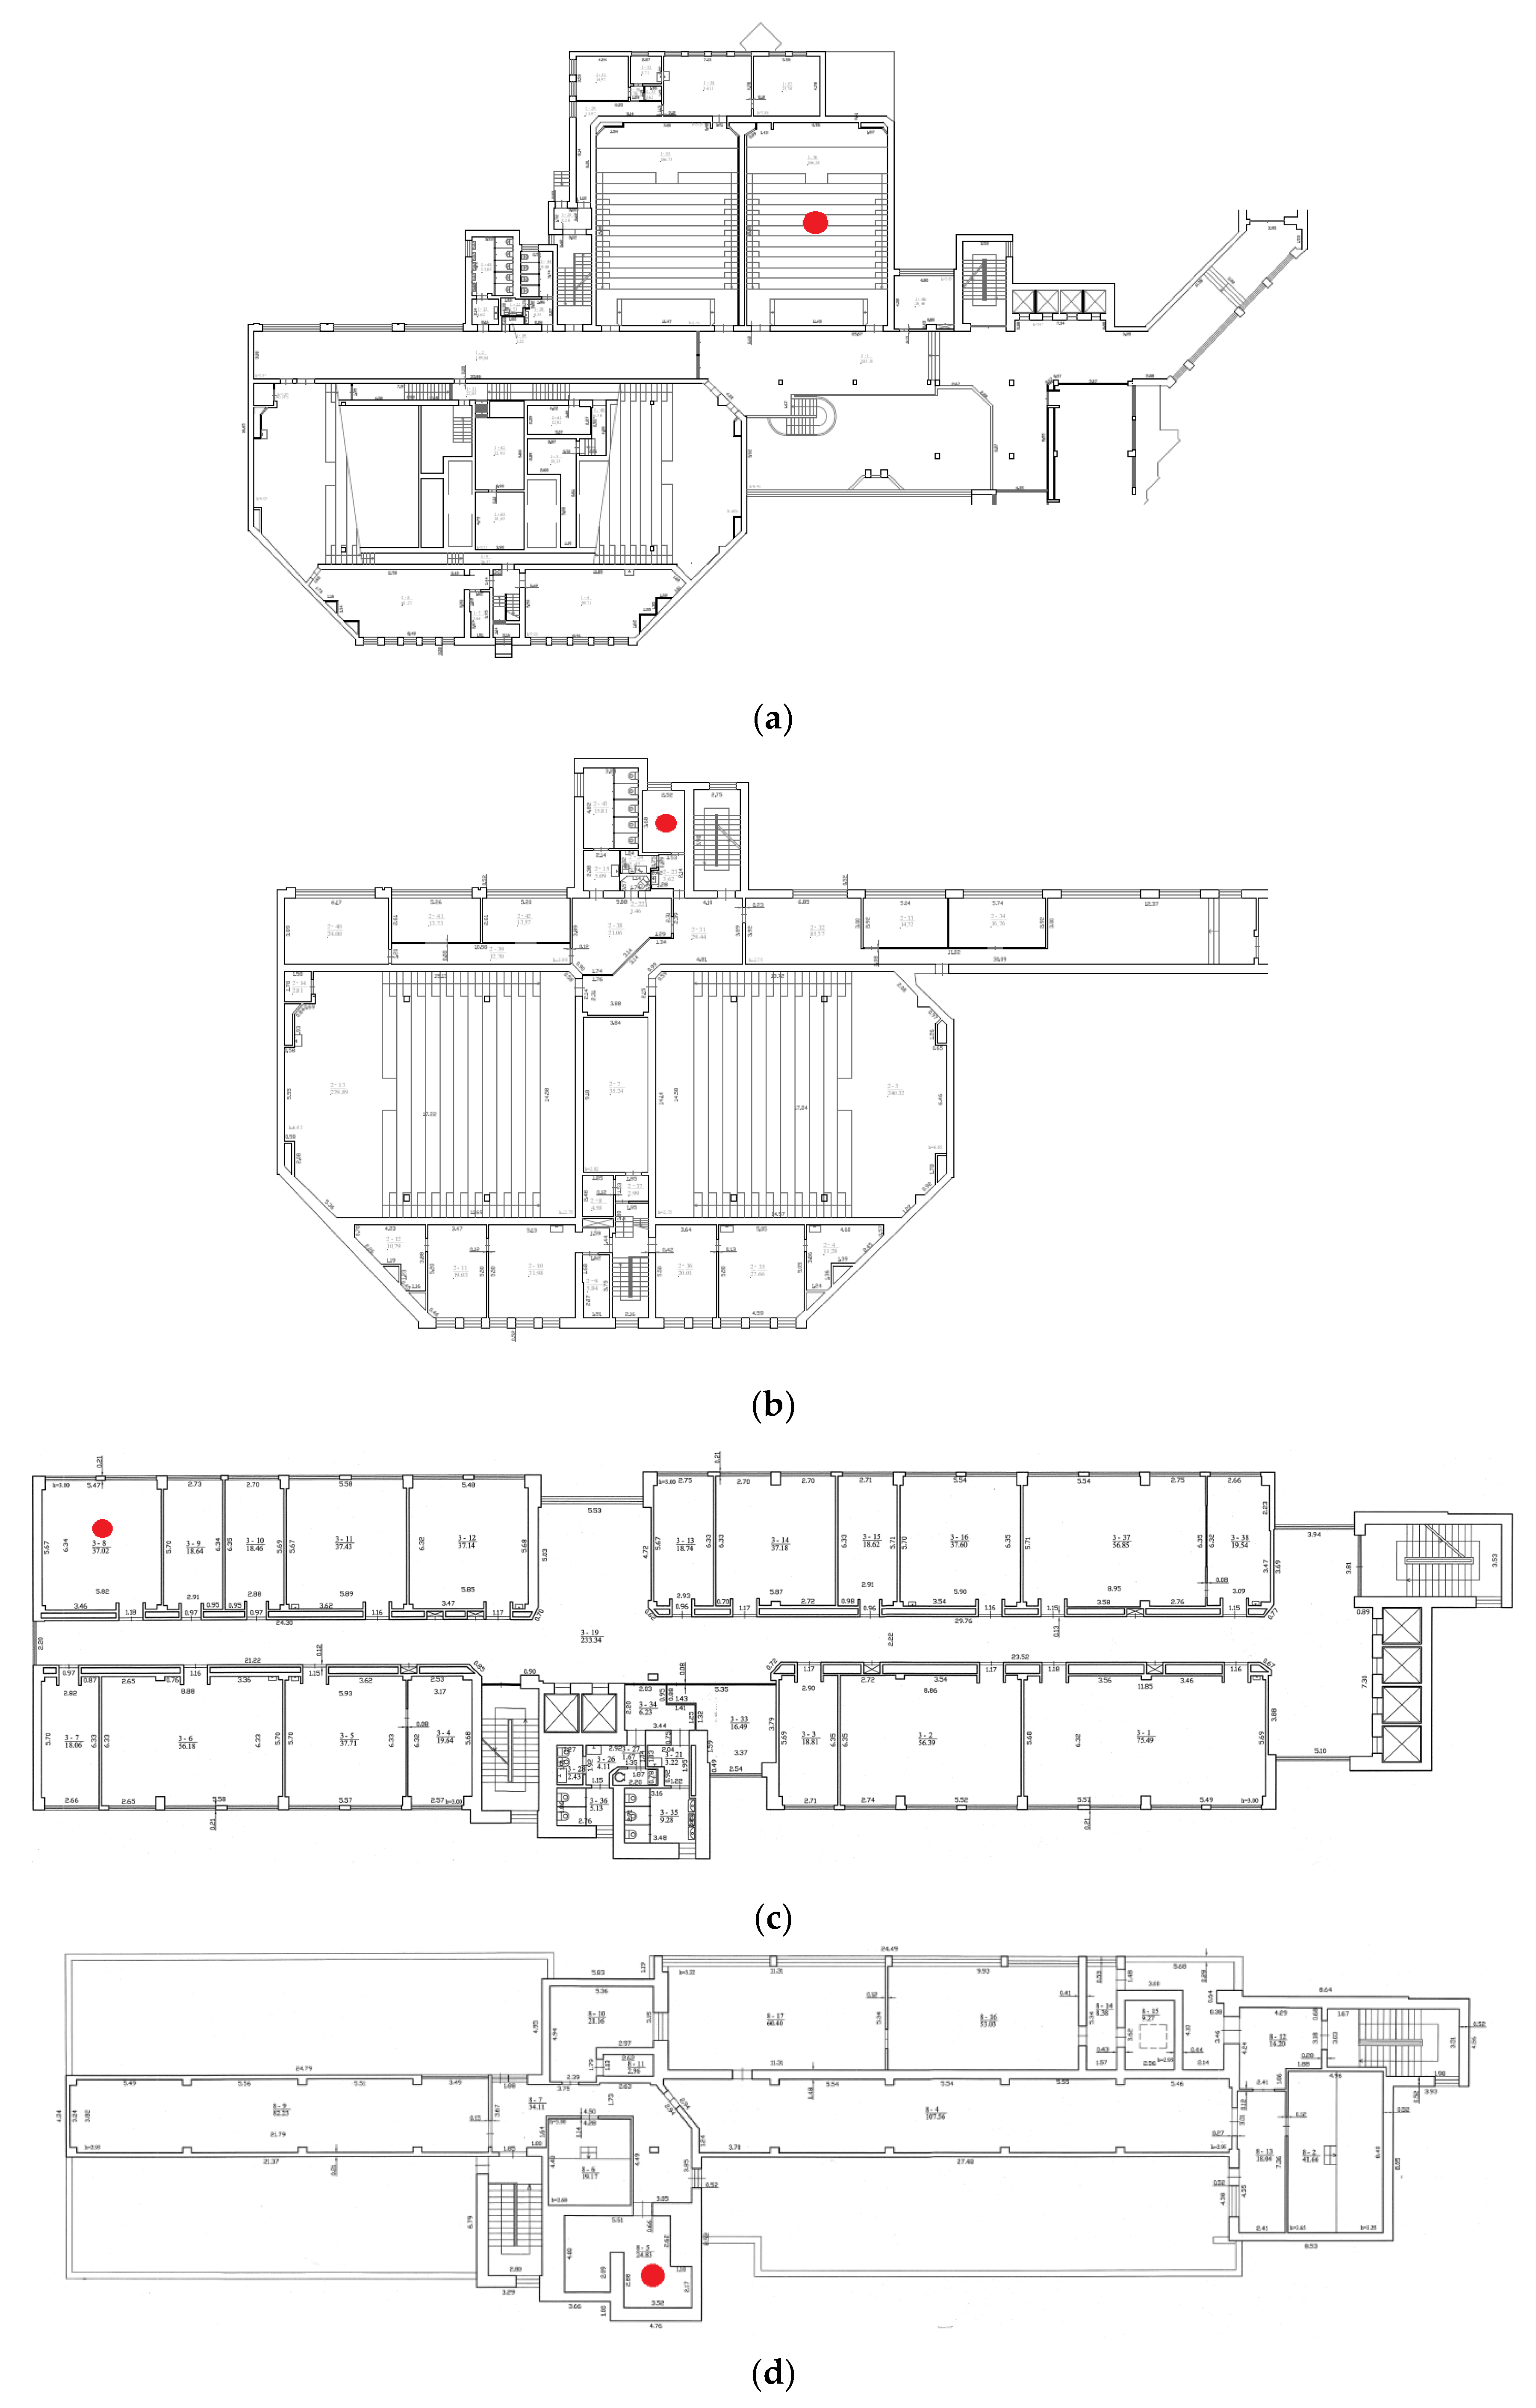
2.1. Description of the Building Location and Premises

The nine-story university building where we analyzed the indoor radon concentrations is located in southeastern Lithuania (Vilnius city). The city is located at north latitude 54°41′ and east longitude 25°16′. Vilnius has a humid continental climate and high precipitation during the year (655 mm). The average temperature of the city is 6.4 °C. The outdoor meteorological conditions, including the outdoor relative humidity, with an accuracy of ±3% and outdoor temperature, with an accuracy of ±0.5 °C, were measured using a Metrel Poly MI6401 device at the same time the radon level measurements were performed. In addition, the outdoor pressure measurements were performed using a pressure measuring instrument with an accuracy of ±3 hPa. The average monthly outdoor temperature and outdoor relative humidity measured during the period of study (from November 2018 to June 2019) are presented in Figure 1.
In November, the monthly average outdoor temperature was 4.9 °C, and this decreased until January. In January, the average outdoor temperature was the lowest and reached −6.9 °C. In later months, during radon concentration measurements, the average outdoor temperature increased and was the highest in June, when it reached 18.8 °C. The highest outdoor relative humidity values were in November and December, and reached 89.3% and 89.6%, respectively. Later on, during the indoor radon concentration measurements, the average outdoor relative humidity decreased. The lowest relative humidity values were in May and June, and reached 55.0% and 57.5%, respectively.
The studied building (Faculty of Environmental Engineering) is present on the University campus (Figure 2, No. 6) and has nine stories and no basement. Sand and sandy loam soil types prevail in the studied area. The building was built in 1985 and, therefore, is not energy efficient. The external walls of the building are made from two layers of brickwork, an insulation layer (polystyrene) between them, plaster layers, and paint.
The radon concentration levels were studied in four building premises (hereafter called premises No. 1, premises No. 2, premises No. 3, and premises No. 4) that are shown in Figure 3 (marked with red dots).
Premises No. 1 was located on the second floor of the building, premises No. 2 was on the third, premises No. 3 was on the fourth, and premises No. 4 was on the ninth floor. In general, during the study, the building premises were used in a normal way.
Table 1 shows the descriptions of the analyzed premises.
The cubic volume of premises No. 1 is 680.7 m3. In premises No. 1, windows are not typically opened; therefore, a forced convection system is used (each day in the afternoon for about 30 min). Air also enters the premises when opening or closing doors. premises No. 1 is an auditory room used for lectures. Approximately 20 lectures a week were held during the study period. premises No. 2 is used as auxiliary room for various laboratory equipment storage and is located on the third floor of the building. The cubic volume of the premises is 25.65 m3. In this premises, the windows are closed all year round, and the room is only ventilated by natural convection and when opening the doors. During the study, premises No. 2 was used every day for picking up and returning various equipment or materials. premises No. 3 is used for laboratory work and is located on the fourth floor of the building. The cubic volume of the premises is 100.4 m3. premises No. 3 is ventilated by natural convection. In this premises, the frequency of opening the windows depended on the season and they were opened only after the measurements were performed. premises No. 4 is a storage place of old laboratory equipment, the capacity of which is 67.0 m3. It is on the ninth floor of the building. The premises has a natural convection system. During the measurement period, premises No. 4 was used approximately three times per week and ventilated rarely.

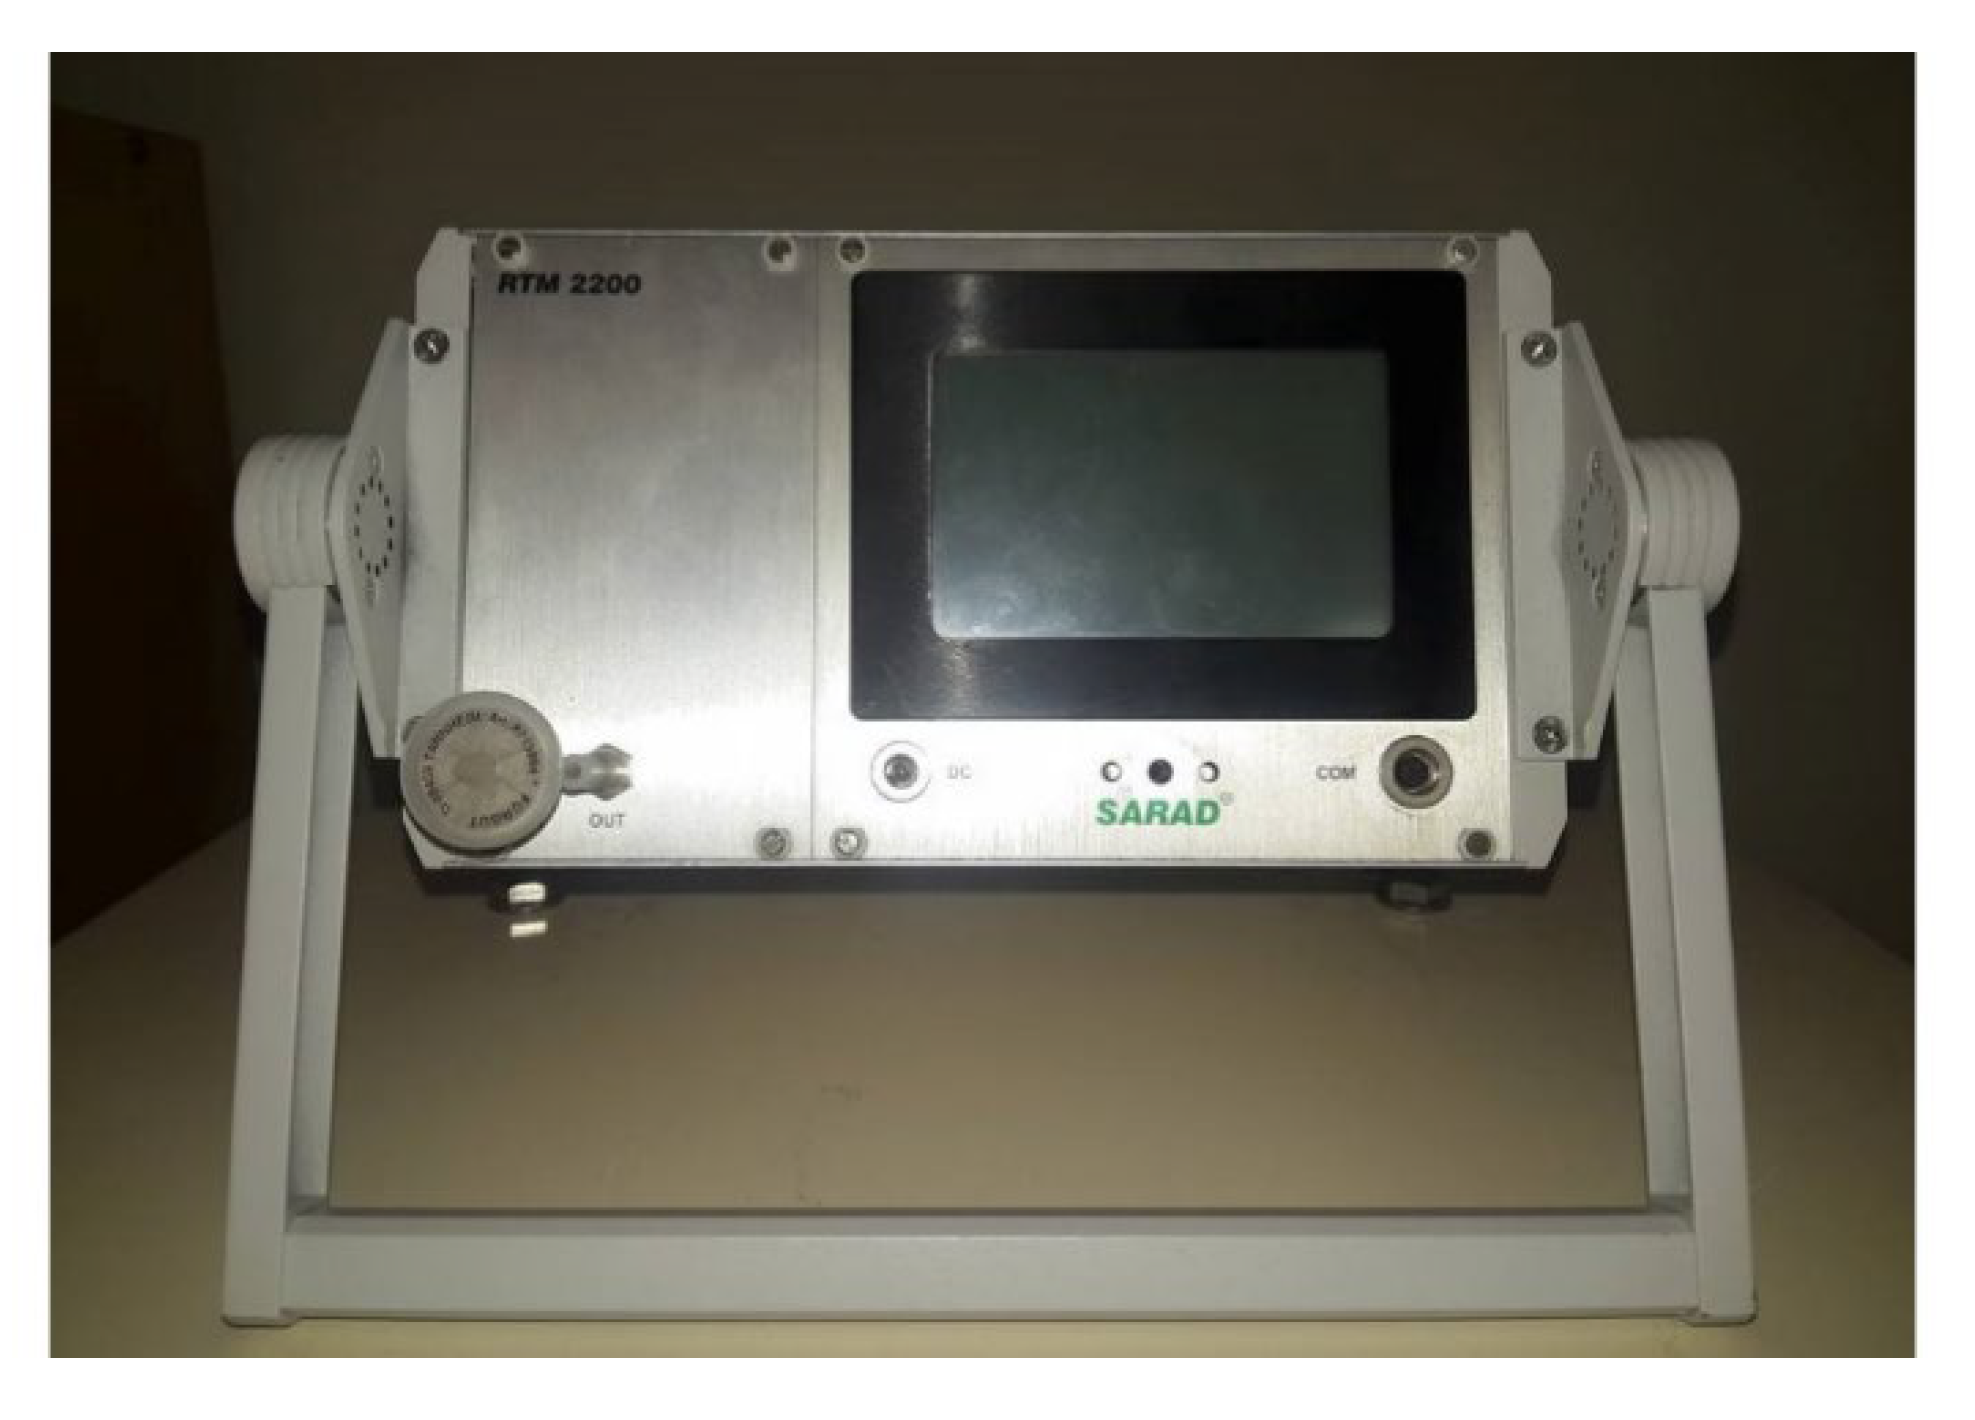
2.2. Measurements of Environmental Parameters and Indoor Radon Concentrations

We performed 8 months of indoor radon concentrations measurements, which began in November 2018 and ended at the end of June 2019 and took place in the four university premises. The indoor radon levels strongly depend on the building operating conditions, therefore the 8-month period was chosen to ensure equal conditions during radon measurements. In the months of July, August, and September, many staff have holidays; in addition, the windows and entrance doors were often opened during these months.
The radon measurements were conducted according to the standards ISO 11665-1:2019 and ISO 11665-5:2020 [34,35]. The radon concentrations in the premises were measured at the same time each working day at the beginning of the working hours (8:00 a.m.) using commercially available radon monitors (SARAD RTM2200) (Figure 4). The measurement range of radon concentration (Bq/m3) of these devices is in the range of 0–10 MBq/m3.
In the analyzed premises, the radon monitor was placed at the height of 1 m, away from windows and doors. The measurements were taken on an hourly basis. At the same time, the indoor environmental parameters were also measured by the same device; i.e., the indoor temperature, with an accuracy of ±0.5 °C, indoor pressure, with an accuracy of ±0.5%, and indoor relative humidity, with an accuracy of ±2%. The monthly average values of all measured data were calculated. The following correlations between the monthly indoor radon concentrations and environmental parameters were analyzed: (1) dependence of the indoor radon concentration on the indoor and outdoor pressure, (2) dependence of the indoor radon concentration on the indoor and outdoor relative humidity, (3) dependence of the indoor radon concentration on the indoor and outdoor temperature, and (4) dependence of the indoor radon concentration on the indoor–outdoor temperature difference.

2.3. Statistical Analysis

The statistical data analysis was performed using Microsoft Excel. Due to significant variations of the daily indoor radon concentrations obtained on an hourly basis for the premises (typically, higher indoor radon values were obtained on Mondays), the average monthly indoor radon values (the monthly sample size ranged from 20 to 23 depending on month) and their standard deviations were calculated. Despite daily indoor radon variation to some degree, no filtering or treatment of the obtained data was performed.
The Pearson correlation coefficient (Equation (1)) was used to evaluate the linear strength between the monthly indoor radon concentrations and environmental variables and was calculated using the following formula [36]:
R = i = 1 n ( x i x ¯ ) ( y i y ¯ ) i = 1 n ( x i x ¯ ) 2 i = 1 n ( y i y ¯ ) 2 ,
where, R—the Pearson correlation coefficient,
  • n—the number of pairs (n = 8),
  • x—the monthly value of environmental variable,
  • x ¯ —the mean value of environmental variable of the study period,
  • y—the monthly indoor radon value, and
  • y ¯ —the mean indoor radon value of the study period.
The correlation was considered strong when its absolute value was higher than 0.70. The determination coefficient (the square of the correlation, R2) was also calculated.
The p value was calculated to test the probability that there was no correlation between the indoor radon levels and the studied environmental parameters. If the obtained probability value was lower than the conventional (p < 0.05), the correlation coefficient was considered statistically significant. The p value was calculated using Microsoft Excel as a function of the t-statistic (Equation (2)), which was calculated using the following formula:
t = R n 2 1 R 2
where, tt statistic,
  • n—the number of pairs (n = 8), and
  • R—the correlation coefficient.

3. Results and Discussion

3.1. Variations of Monthly Indoor Radon Concentrations

The monthly averages of the radon concentrations obtained within the eight months are presented in Table 1. The indoor radon concentrations were obtained each working day in the morning. Before the measurements (after the night), the windows were not opened. Generally, the measured indoor radon levels in the premises were relatively low, not exceeding the reference levels for indoor radon concentrations in workplaces (300 Bq/m3) provided in European Directive 2013/59/Euratom [37].
As it can be seen from Table 2, the highest average value of the eight-month period (47.9 Bq/m3) was obtained in premises No. 4, which is on the top floor of the building; whereas the lowest average value of the indoor radon concentration, 25.6 Bq/m3, was obtained in premises No. 1, which is on the second floor of the building. In most studies, researchers reported that the higher the floor of the building [38], the lower the radon concentration is for that floor. However, such results were not obtained in this study. The results revealed that not only the height of the premises of the same building but also the type of ventilation and the purpose of the premises could be influencing parameters for the indoor radon level. The forced convection system used in premises No. 1 could be influenced by the higher air exchange rate compared to the exchange rate in other premises, where only natural convection systems were used. As premises No. 4 was used and ventilated rarely, the highest indoor radon levels were obtained there. This could also be the reason why limited indoor radon seasonal variation was obtained in premises No. 4. Xie et al. (2015) also found limited indoor radon seasonal variation in the basement they studied, which had negligible ventilation [21].
Generally, indoor radon levels are reported to be the highest in the winter period [9,21,38]. However, the results of this study showed different seasonal variations of radon levels in different premises. Such results could be caused by the difference of the quality of the wall and window insulation in the premises. Therefore, the obtained correlations between the indoor radon levels and meteorological parameters, which are analyzed and discussed below, were different for the different premises of the university building.

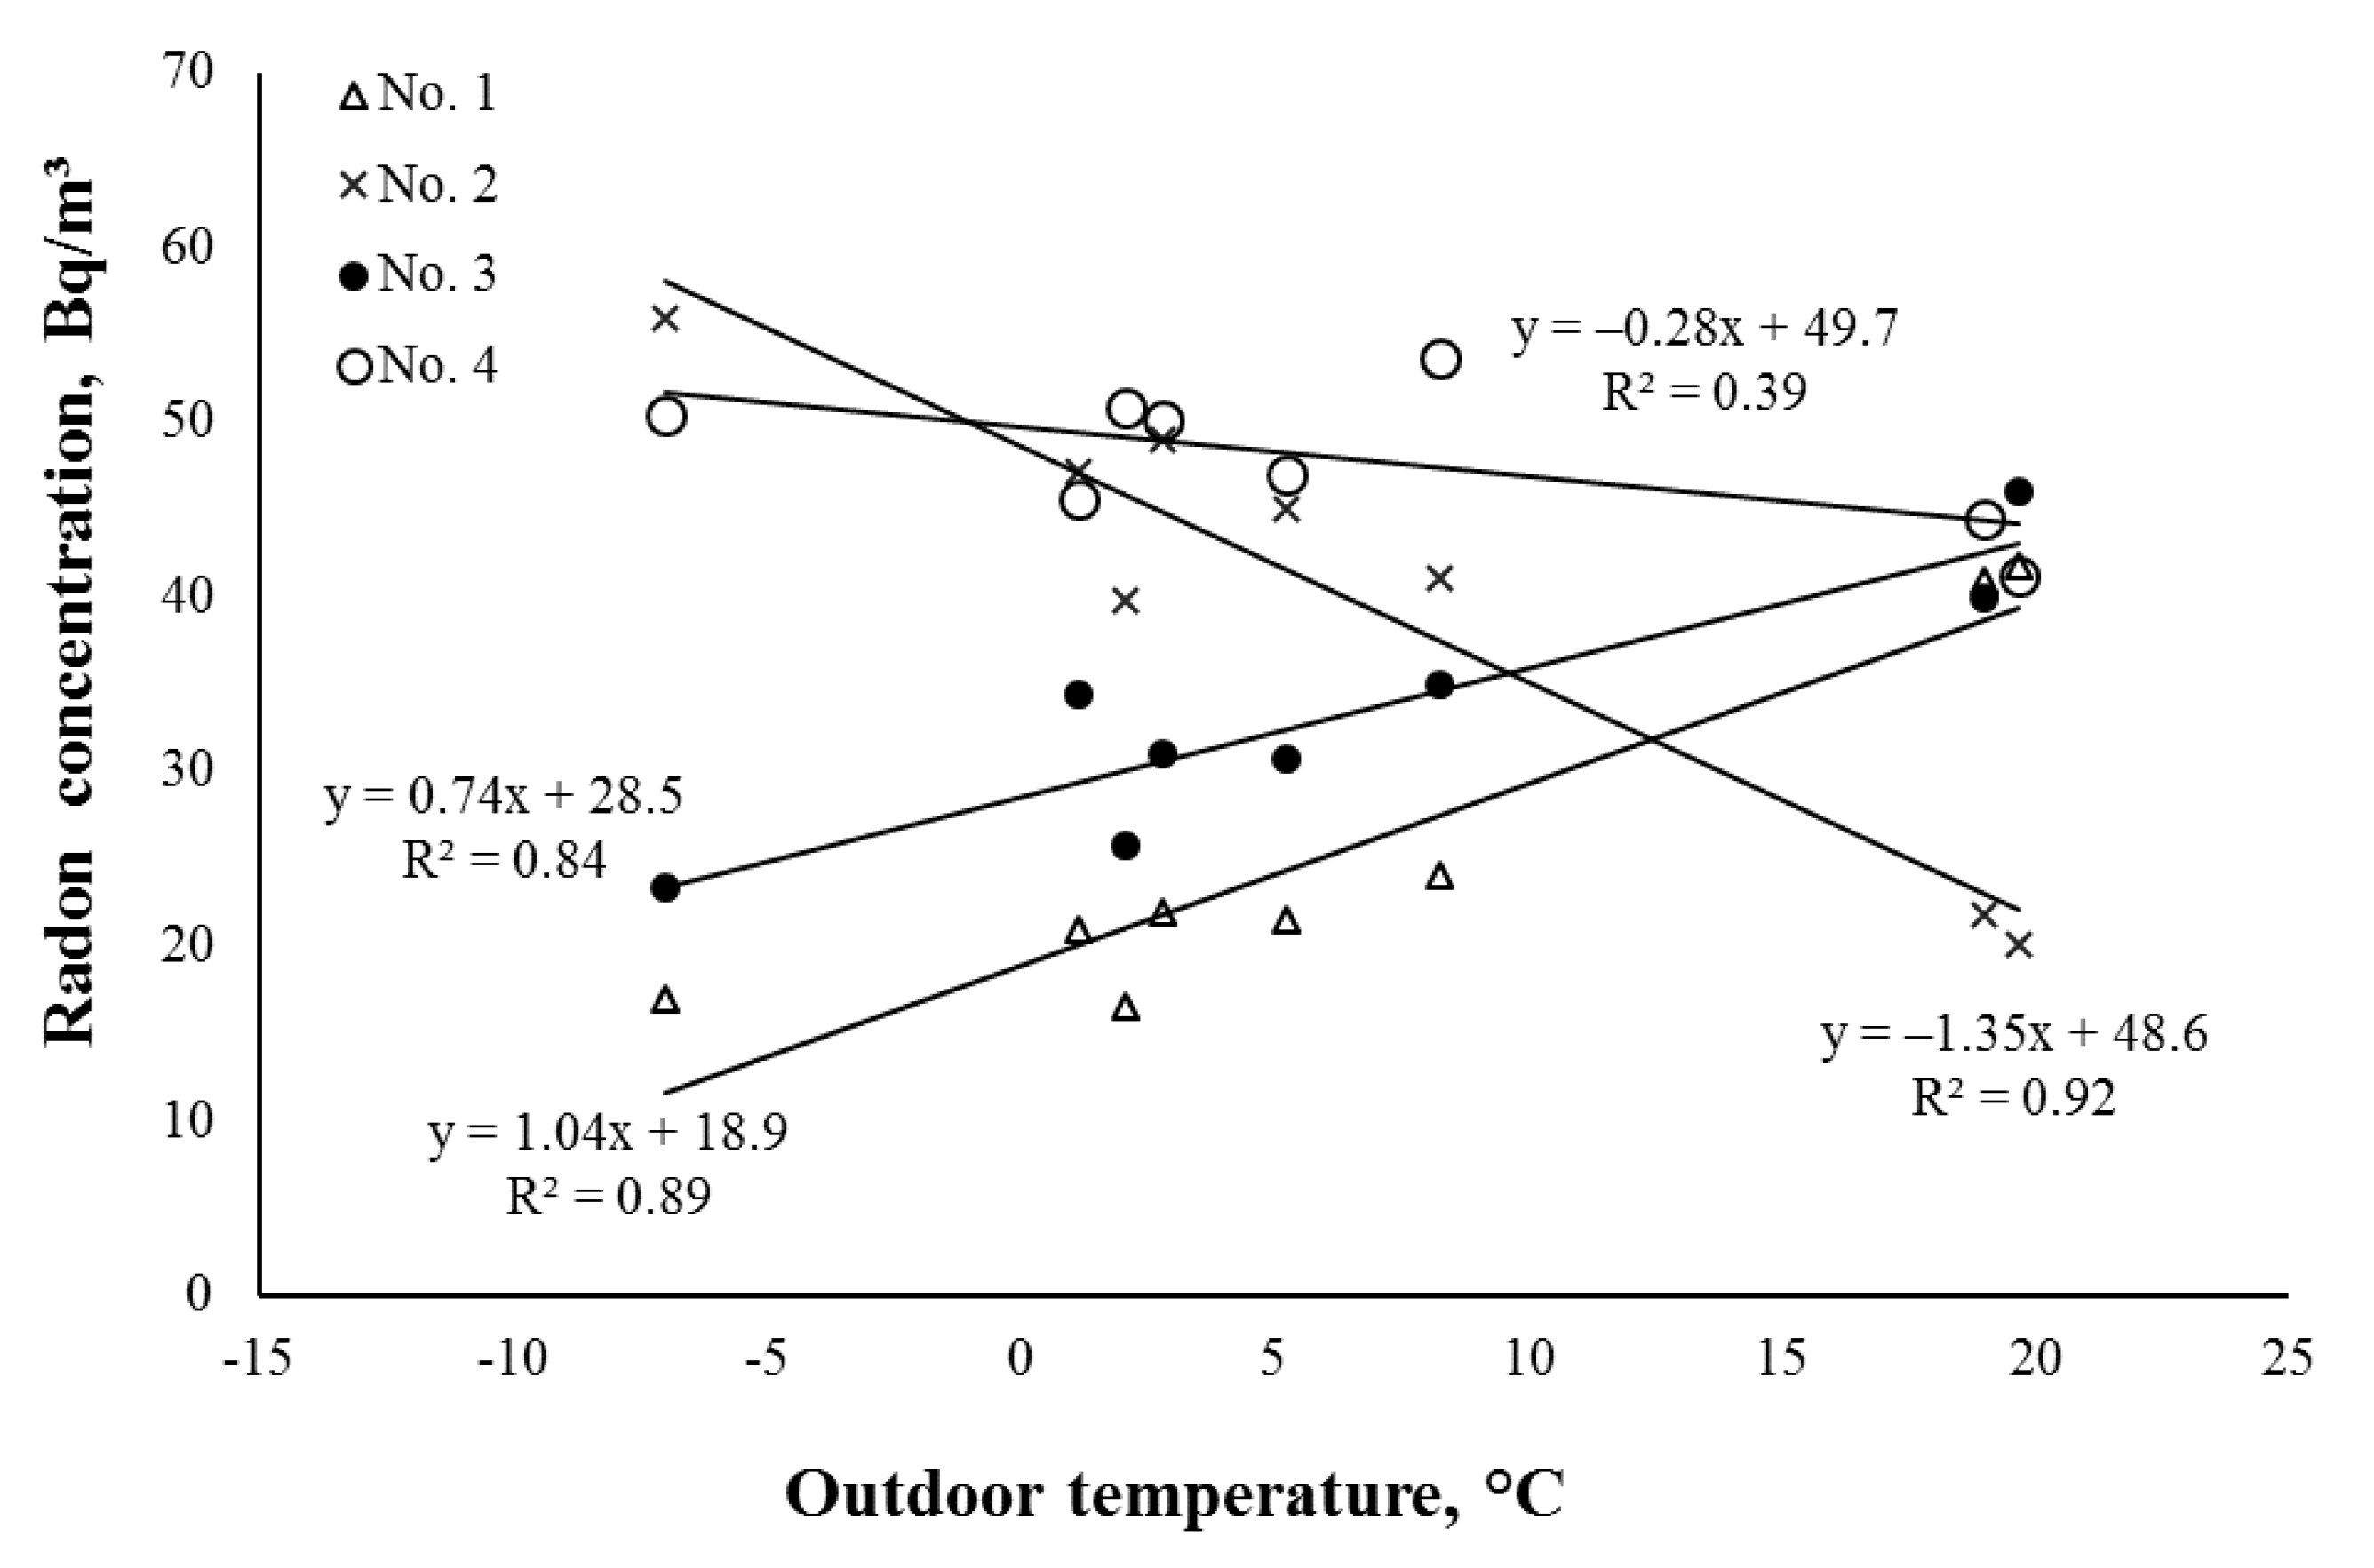
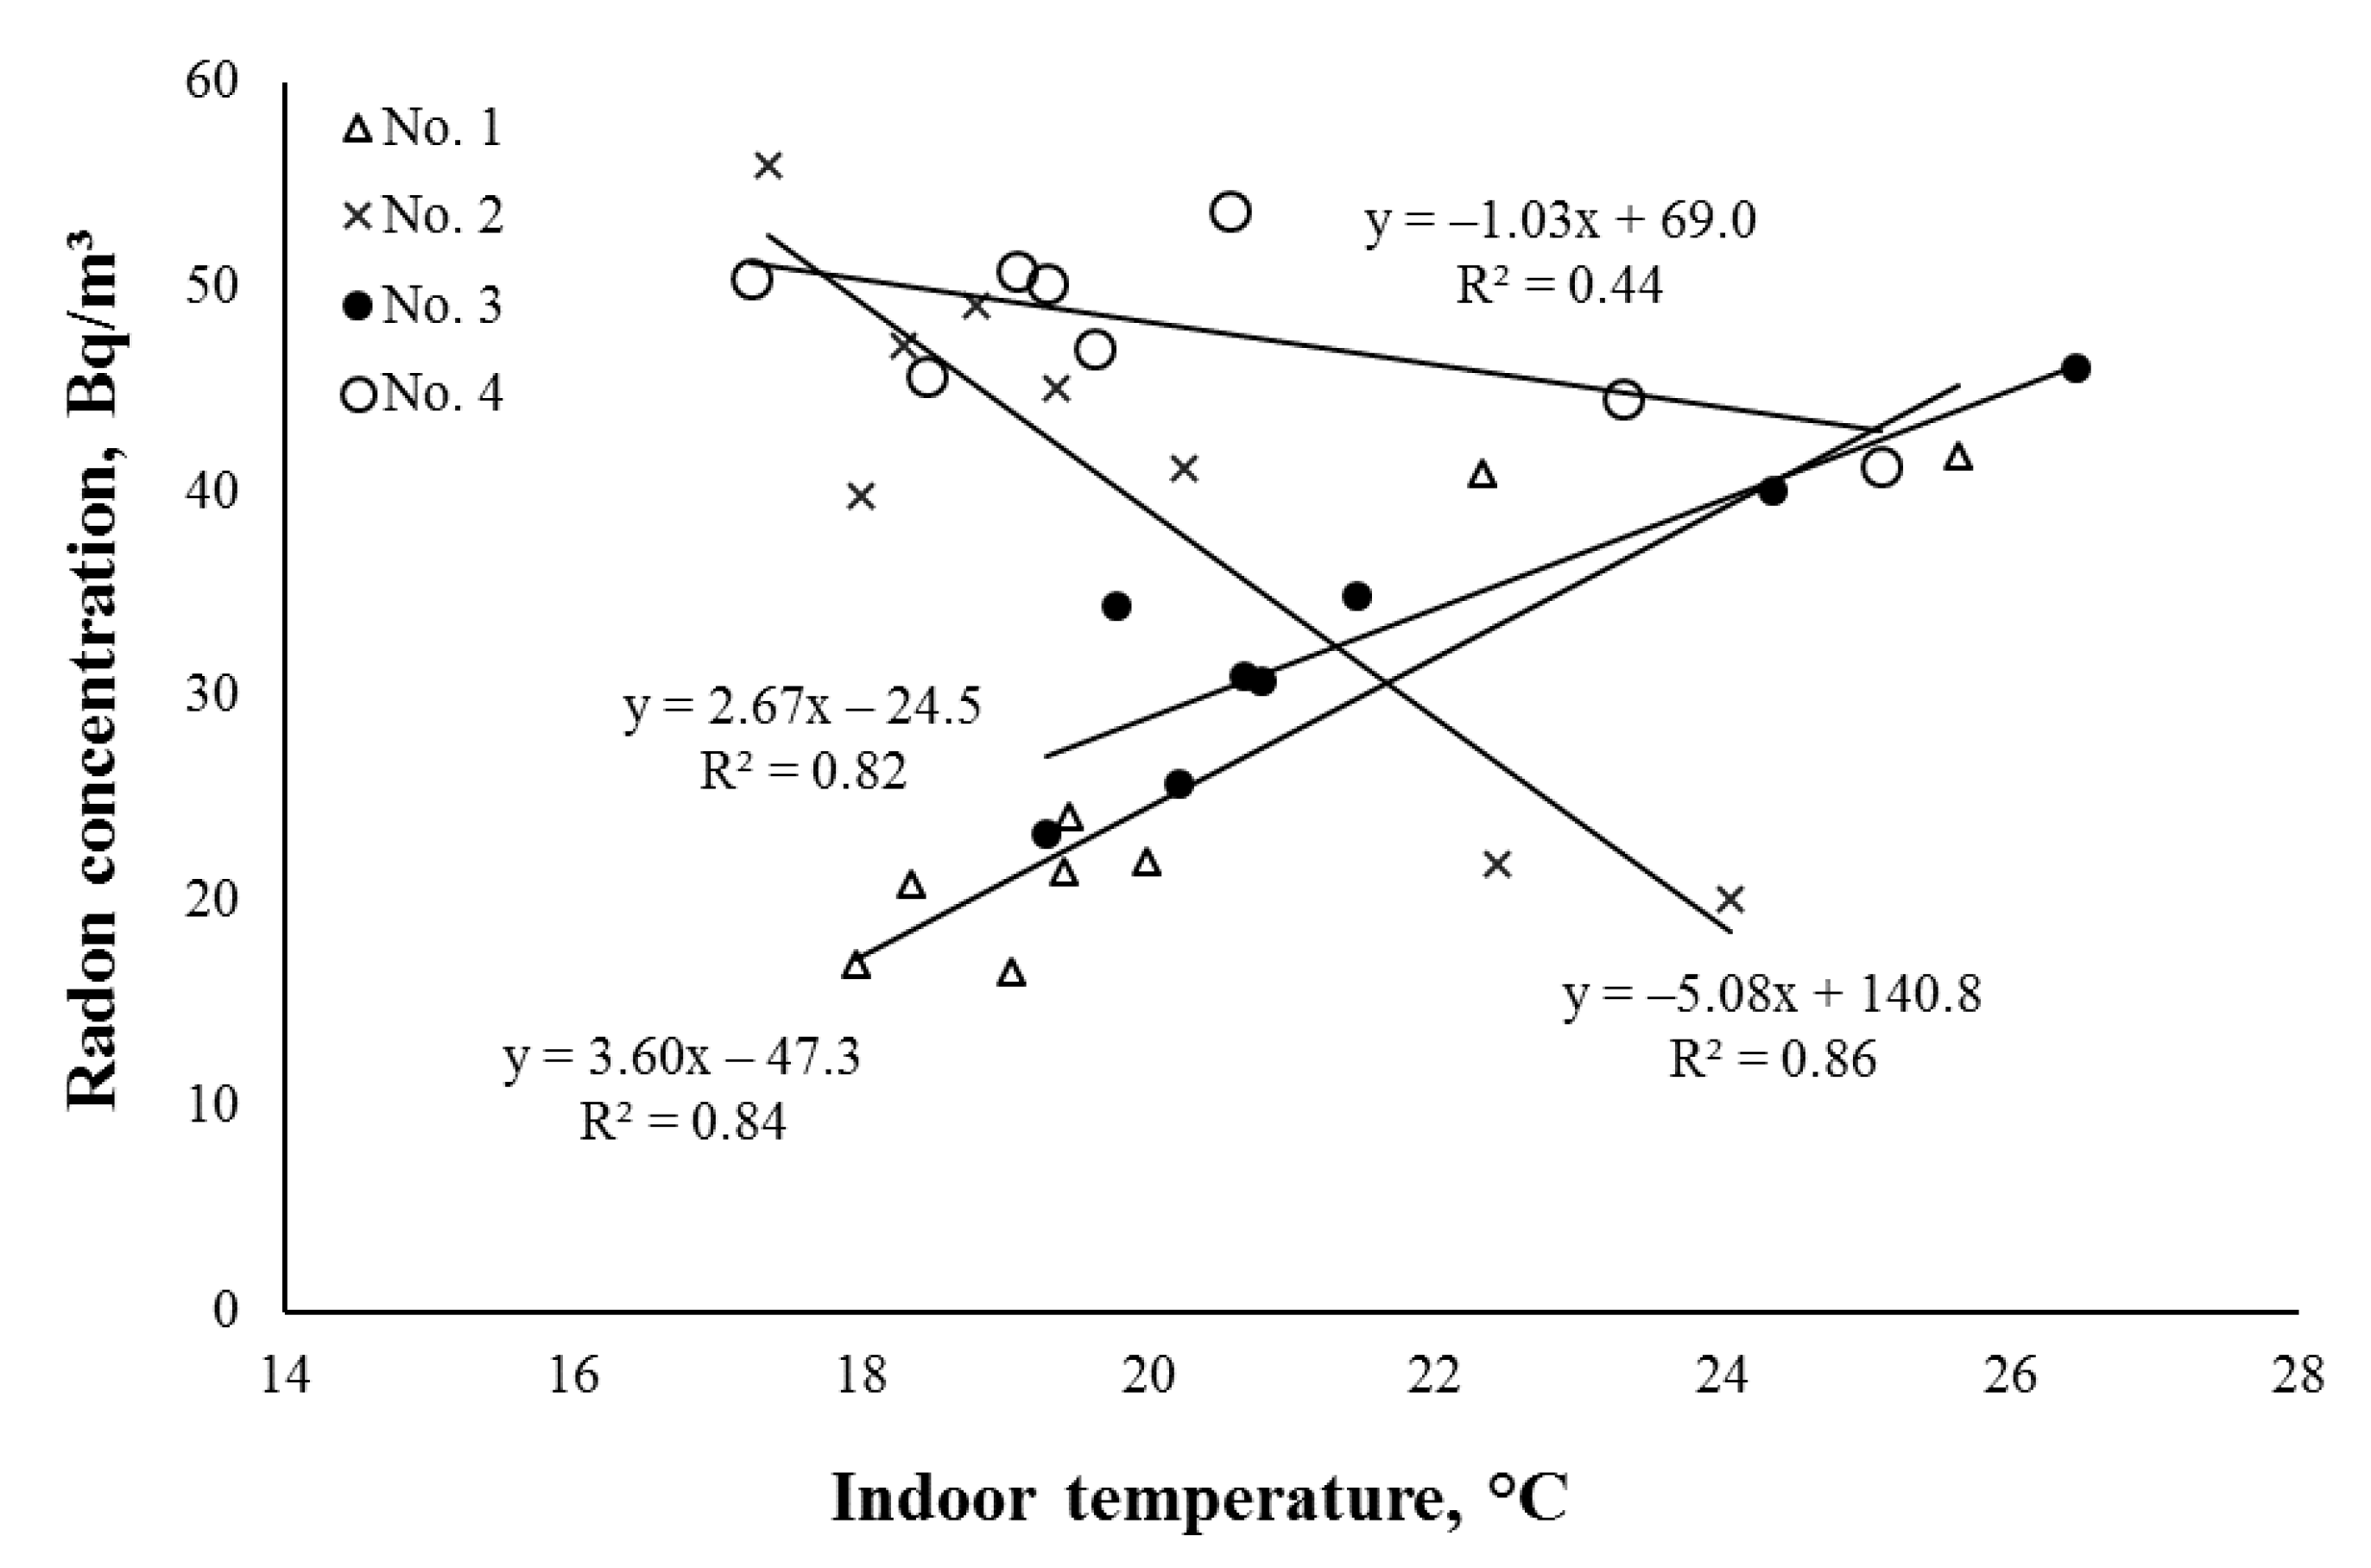
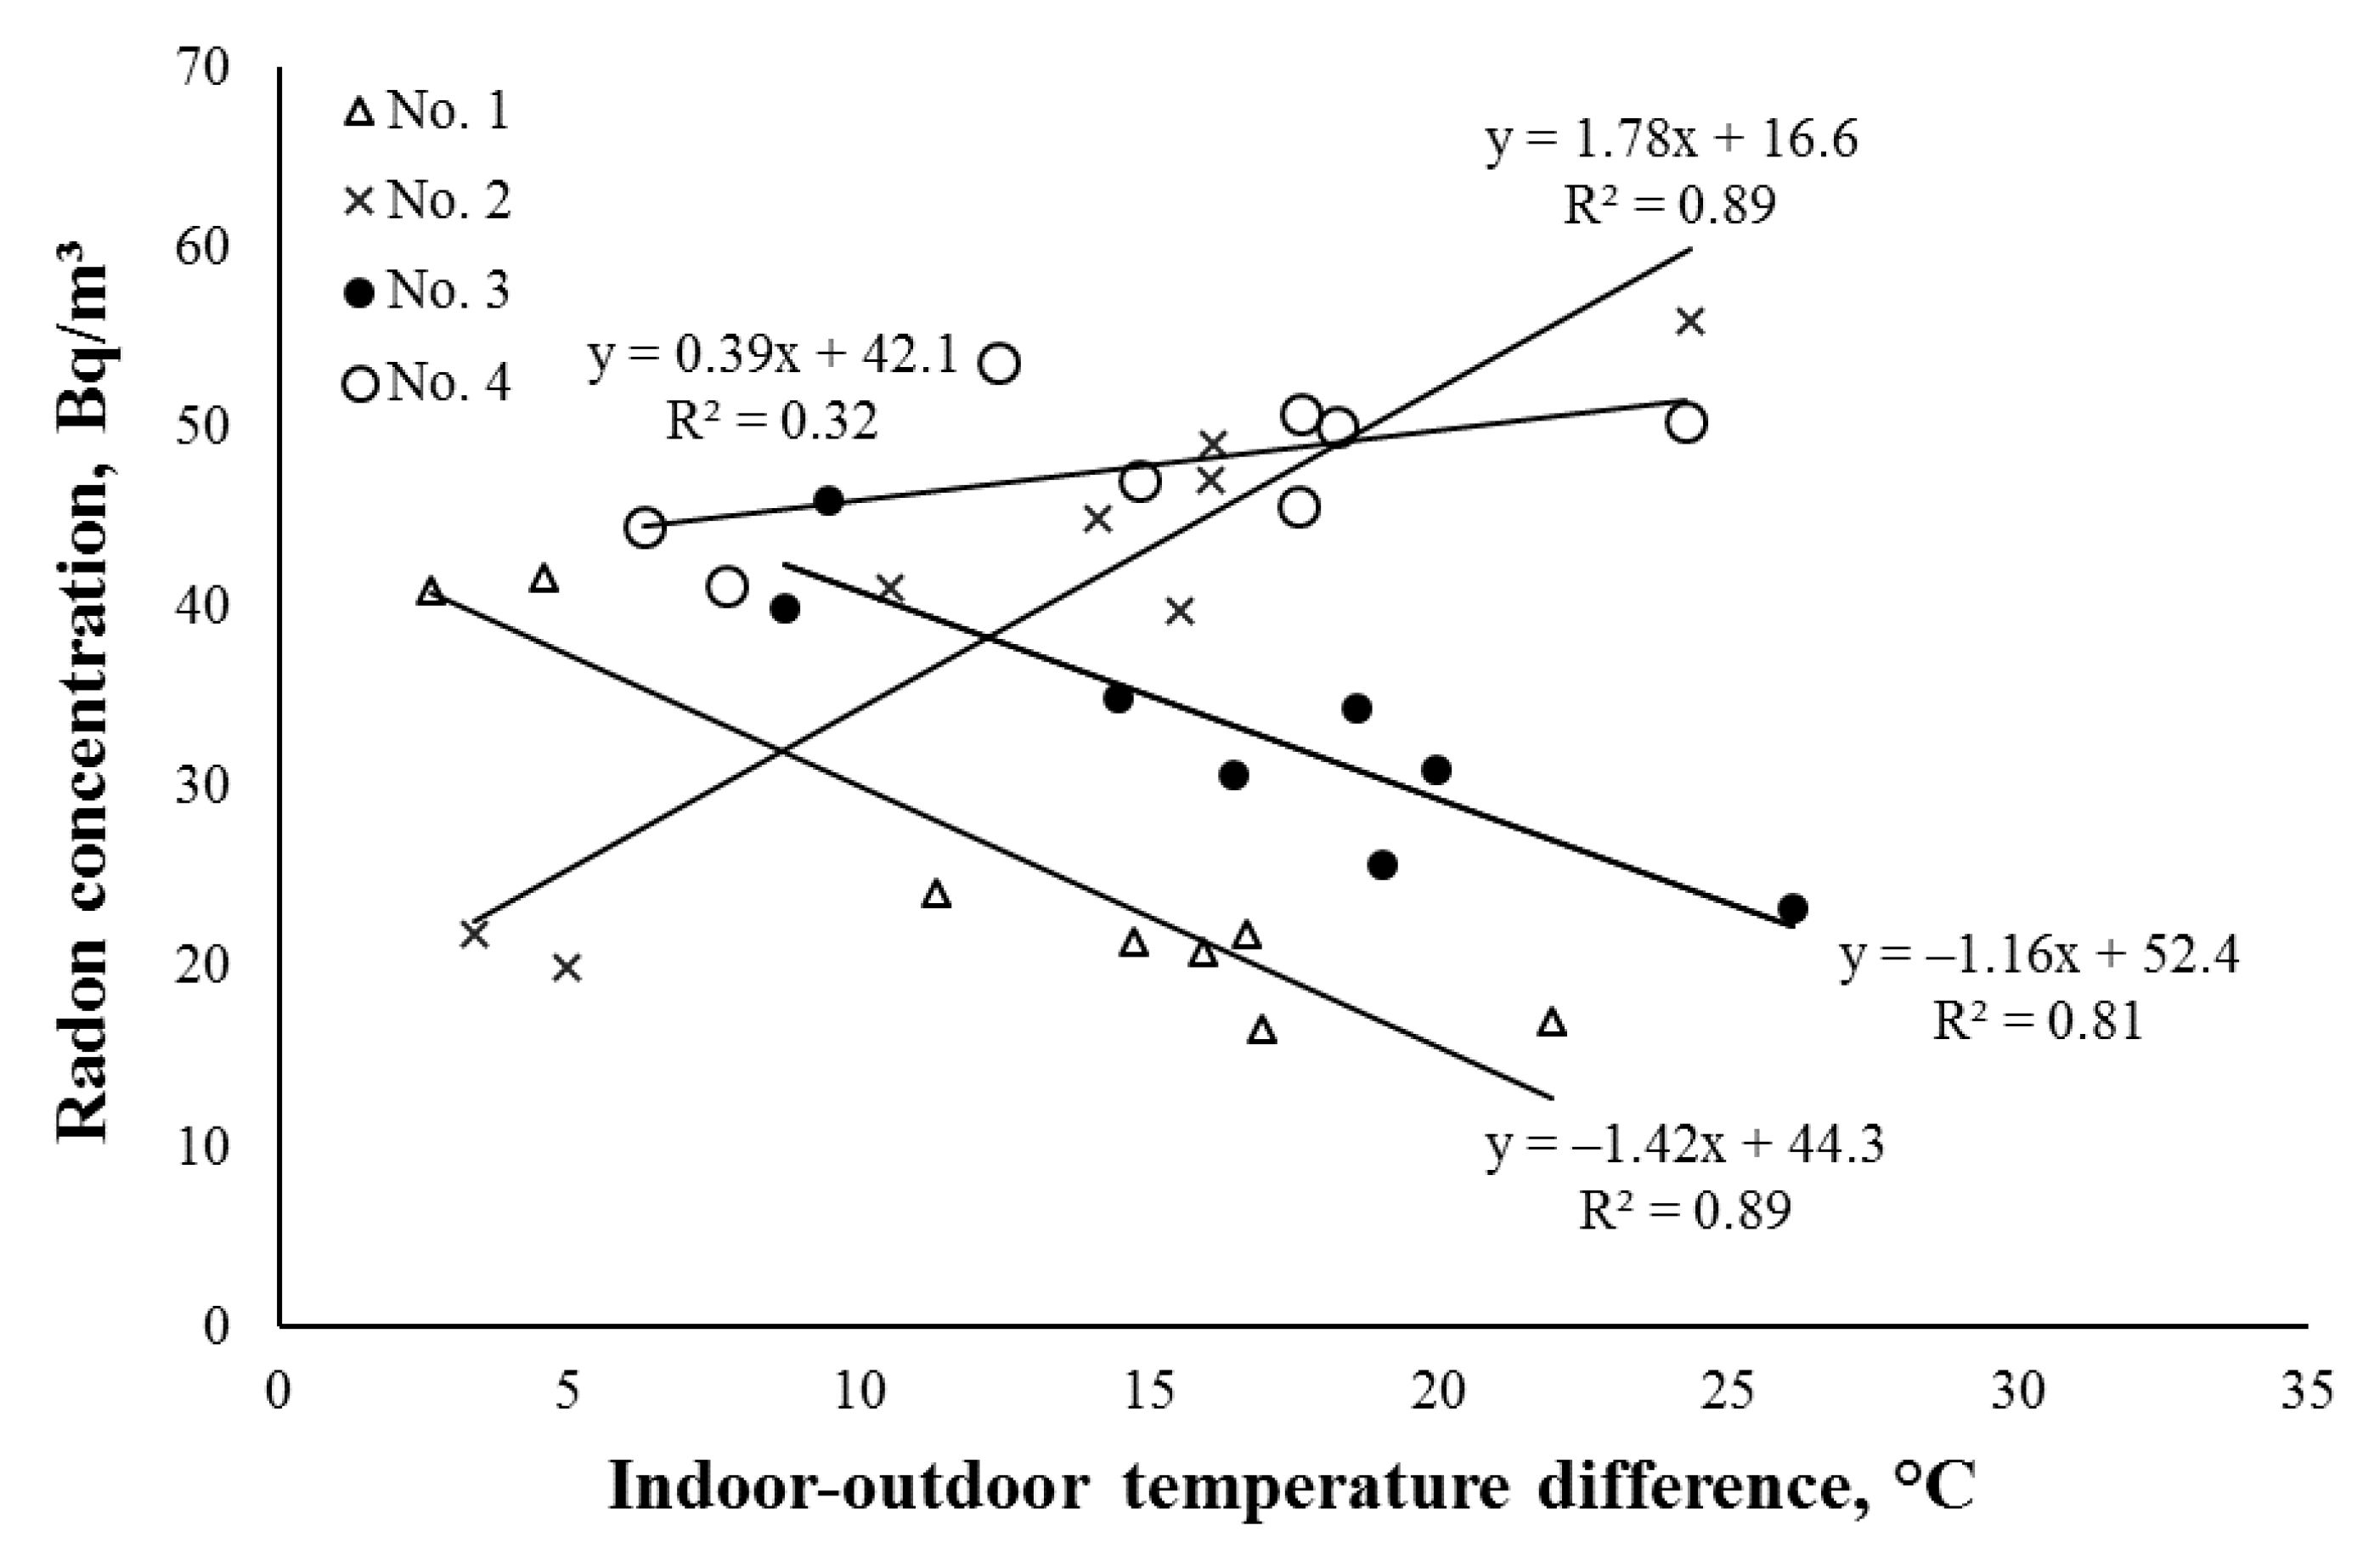
3.2. The Dependence of the Indoor Radon Concentrations on the Outdoor Temperature, Indoor Temperature, and Indoor–Outdoor Temperature Difference

The dependencies of the indoor radon concentration on the outdoor and indoor temperature are presented in Figure 5 and Figure 6, respectively.
As can be seen from Figure 5 and Figure 6, depending on the premises, positive or negative correlations between indoor radon levels and outdoor and indoor temperature were obtained. The indoor radon concentration in premises No. 2 (R2 = 0.92, R = −0.96, p < 0.01) and No. 4 (R2 = 0.39, R = −0.62, p = 0.10) tended to decrease when the outdoor temperature increased and, similarly, tended to decrease (R2 = 0.86, R = −0.93, p < 0.01 and R2 = 0.44, R = −0.66, p = 0.075, respectively) with increased indoor temperature. On the contrary, for premises No. 1 and No. 3, the indoor radon levels increased with the increasing outdoor temperature (R2 = 0.89, R = 0.94, p <0.01 and R2 = 0.84, R = 0.92, p < 0.01, respectively) and indoor temperature (R2 = 0.84, R = 0.92, p < 0.01 and R2 = 0.82, R = 0.91, p < 0.01, respectively). In general, when the outdoor temperature increased, the indoor temperatures in the studied premises also increased. The obtained absolute correlation values between the indoor radon levels and indoor temperature were lower (except for premises No. 4) compared to the correlations between the indoor radon levels and outdoor temperature. This may be due to the fact that the variations of indoor temperatures in the premises were substantially lower compared to the variations of outdoor temperature. In the study of Xie et al. (2015), no clear correlations were found between indoor radon levels and indoor temperatures [21].
Figure 7 shows the dependencies of the indoor radon concentration on the indoor–outdoor temperature difference.
As can be seen from Figure 7, the indoor radon concentration in premises No. 2 and No. 4 tended to increase (R2 = 0.89, R = 0.94, p < 0.01 and R2 = 0.32, R = 0.57, p = 0.14, respectively) with the increasing indoor–outdoor temperature difference. In contrast, for premises No. 1 and No. 3, the indoor radon levels decreased (R2 = 0.89, R = −0.94, p < 0.01 and R2 = 0.81, R = −0.90, p < 0.01, respectively) with the increasing indoor–outdoor temperature difference.
The obtained absolute correlation values between the indoor radon levels and the indoor–outdoor temperature difference were slightly lower compared to the absolute correlation values between the indoor radon levels and outdoor temperature. The outdoor temperature was a more dominant factor than the temperature difference in influencing the variation of the radon levels in the premises. On the other hand, slightly lower correlations could be obtained due to the fact that two variables (indoor and outdoor temperature) were measured on an hourly basis using two different instruments.
The majority of previous studies [21] found increased indoor radon levels in winter periods compared to warmer seasons. In our study, this tendency was also found in premises No. 2 and No. 4. In most cases, the indoor radon concentrations were higher in winter, as the increased indoor–outdoor temperature difference caused increased gas flow from the soil to buildings. In contrast, in the other two premises (No. 1 and No. 3), elevated radon levels were found in the warmer period. There are very few studies [18] that found that increased inside–outside temperature difference caused a decrease in indoor radon concentrations.
Hubbard et al. (1992) studied the radon levels in two Swedish dwellings and found that an increased indoor–outdoor temperature difference caused a decrease in radon concentrations in both studied dwellings. In our study, the different trends were obtained in studied premises of the same building. In their study, Hubbard et al. (1992) explained that there are different mechanisms for how the variation of temperature difference can change the indoor radon concentrations. Increased indoor–outdoor temperature difference can increase air flow through the building shell and, at the same time, reduce the indoor radon concentration (hereafter called the ventilation effect) or can increase the soil-gas entry to a building, therefore increasing the indoor radon concentration (hereafter called the radon source effect) [18]. These two mechanisms are not individual components, as often both mechanisms can occur with increased indoor–outdoor temperature differences.
In our studied building, in premises No. 1 and No. 3, the ventilation effect prevailed in winter, while in premises No. 2, the radon source effect prevailed. Architectural style can have a significant influence on indoor radon levels [25]. Different trends in the premises of the studied building can be explained by different airtightness attributes of the premises. In the winter with a high indoor–outdoor temperature difference, air leakage could occur through possible unintentional air leakage points in premises No. 1 and No. 3. During the warm period, when the indoor–outdoor temperature difference was similar and air circulation through unintentional leakage points could not occur at the same rate, elevated radon concentrations were detected in those premises. In premises No. 2, due to better airtightness, higher indoor radon levels were detected during the cold season. In premises No. 4, both ventilation and radon source effects could occur since the obtained absolute correlation values were the lowest. Symonds et al. (2019) and Meyer (2019) found that, in houses with better airtightness and higher energy performance characteristics, higher indoor radon levels were obtained compared to houses with lower energy performances [39,40].

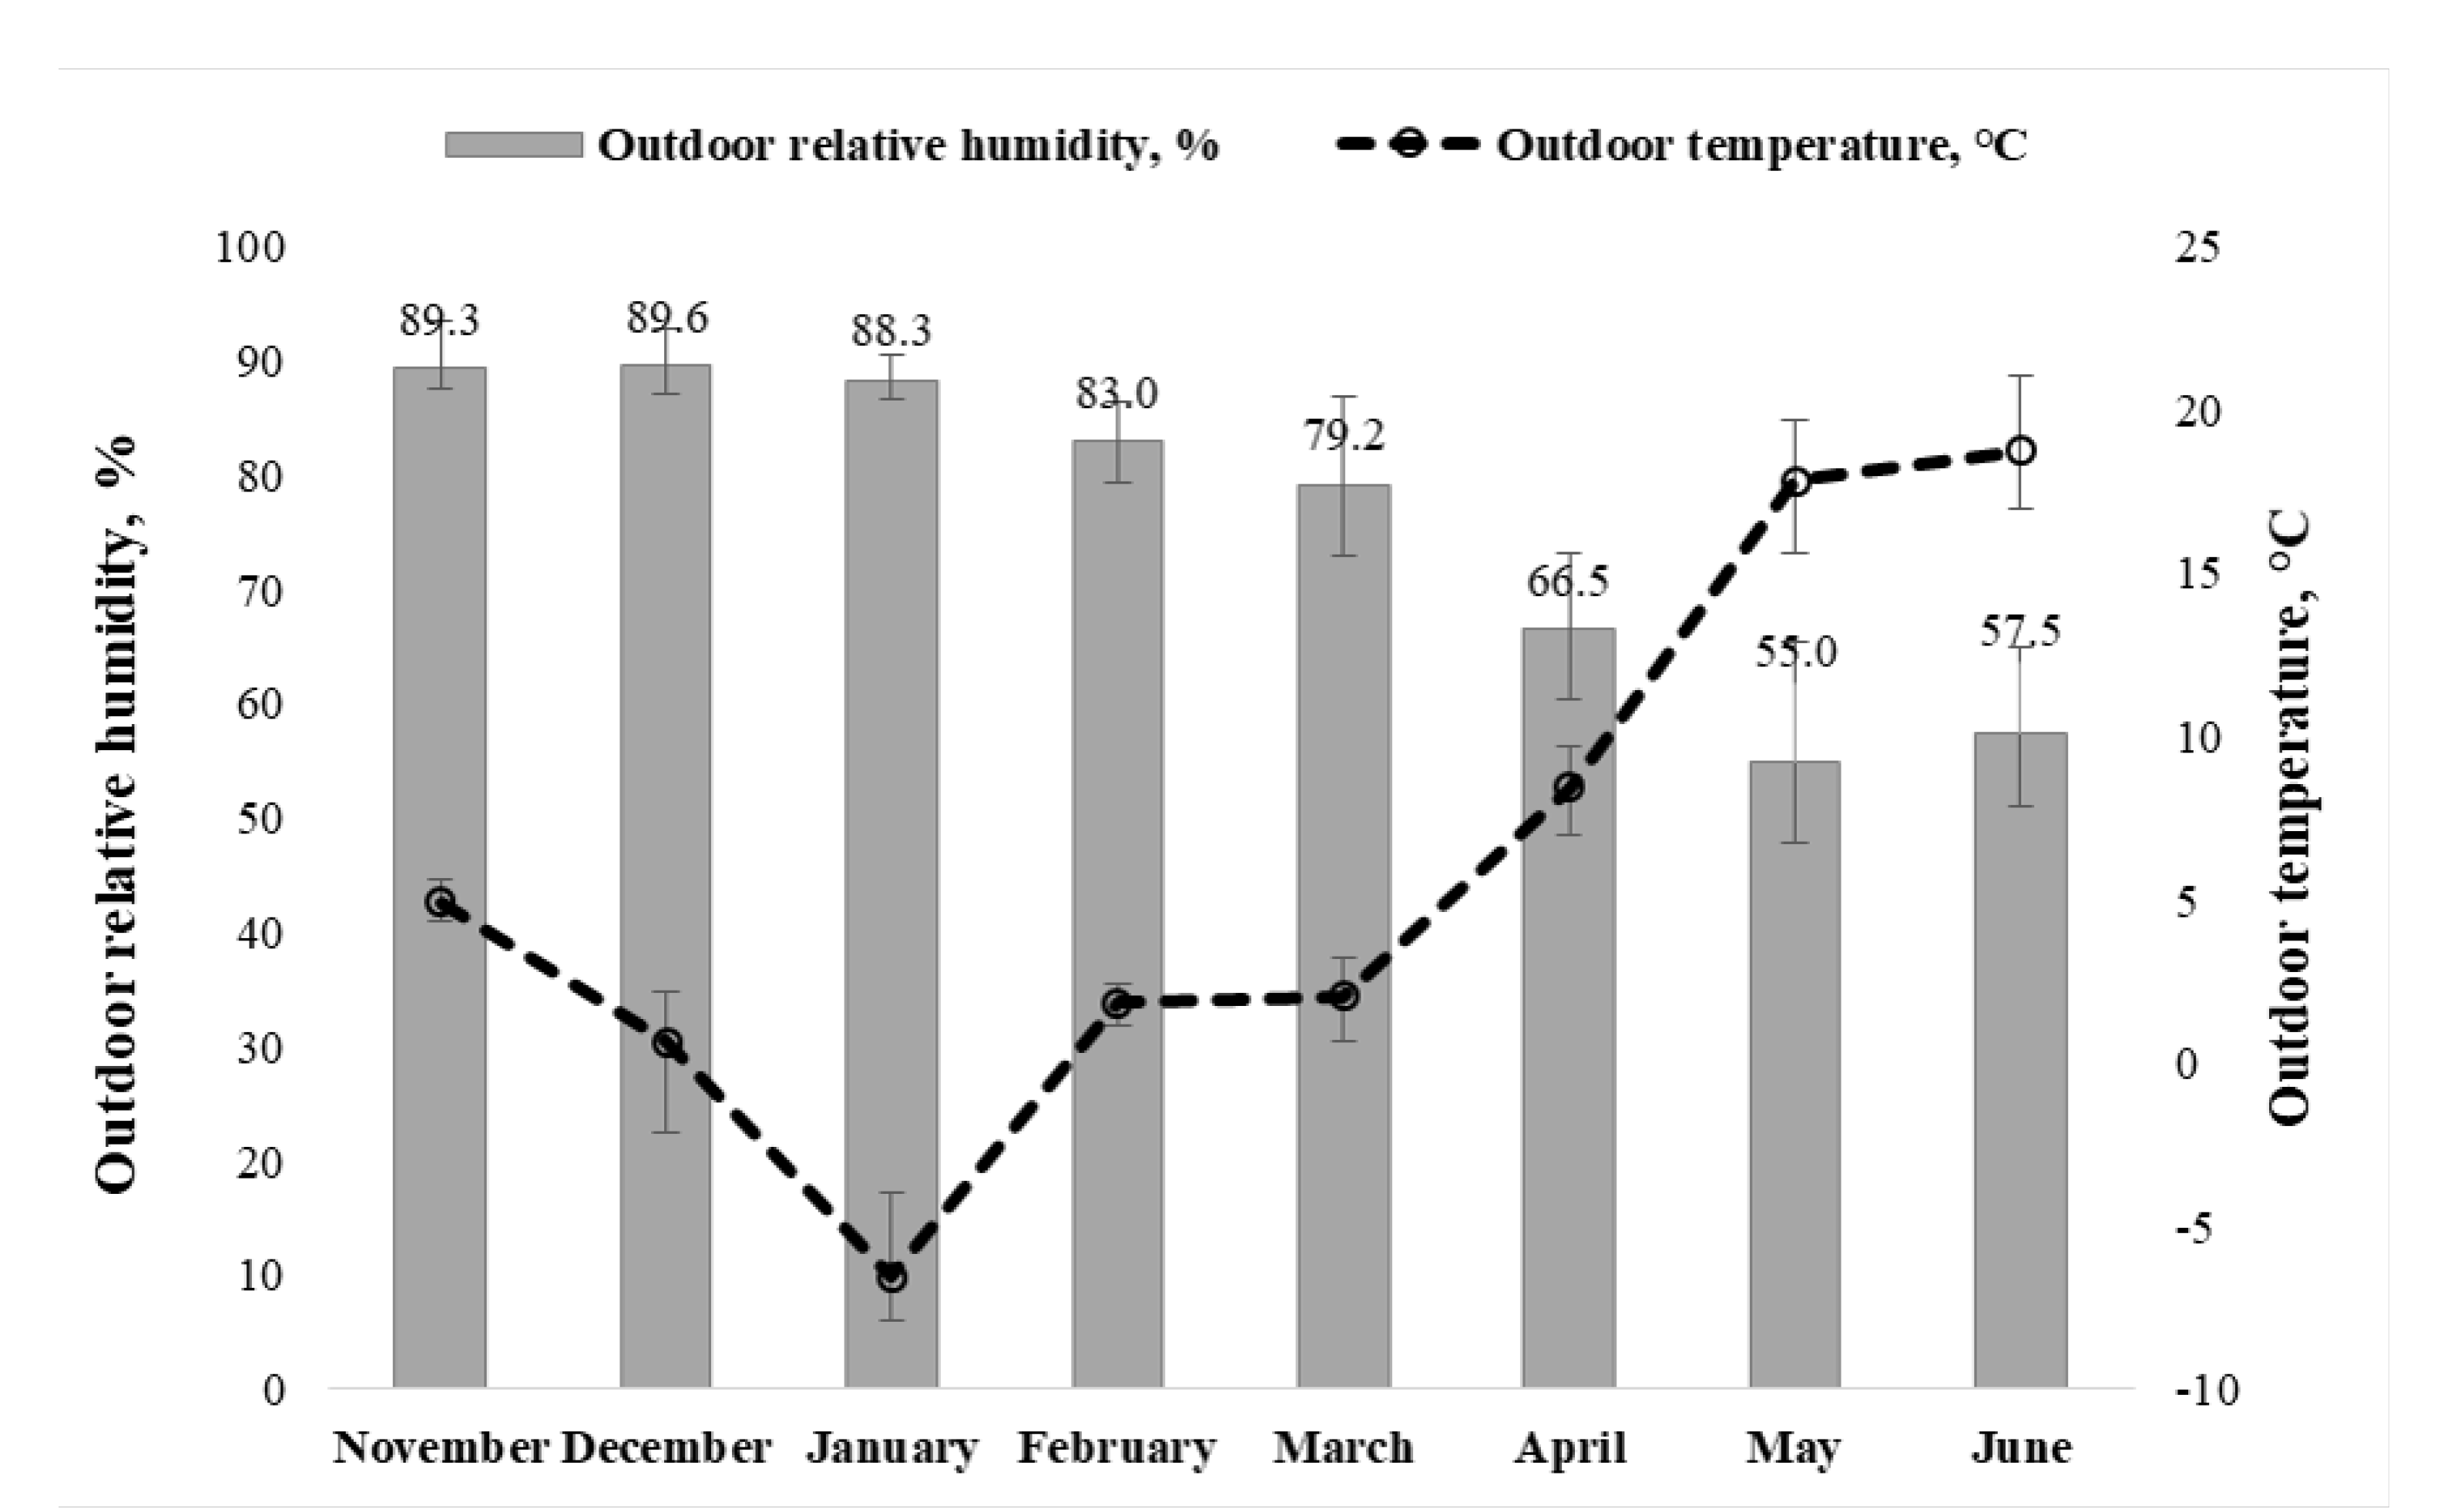
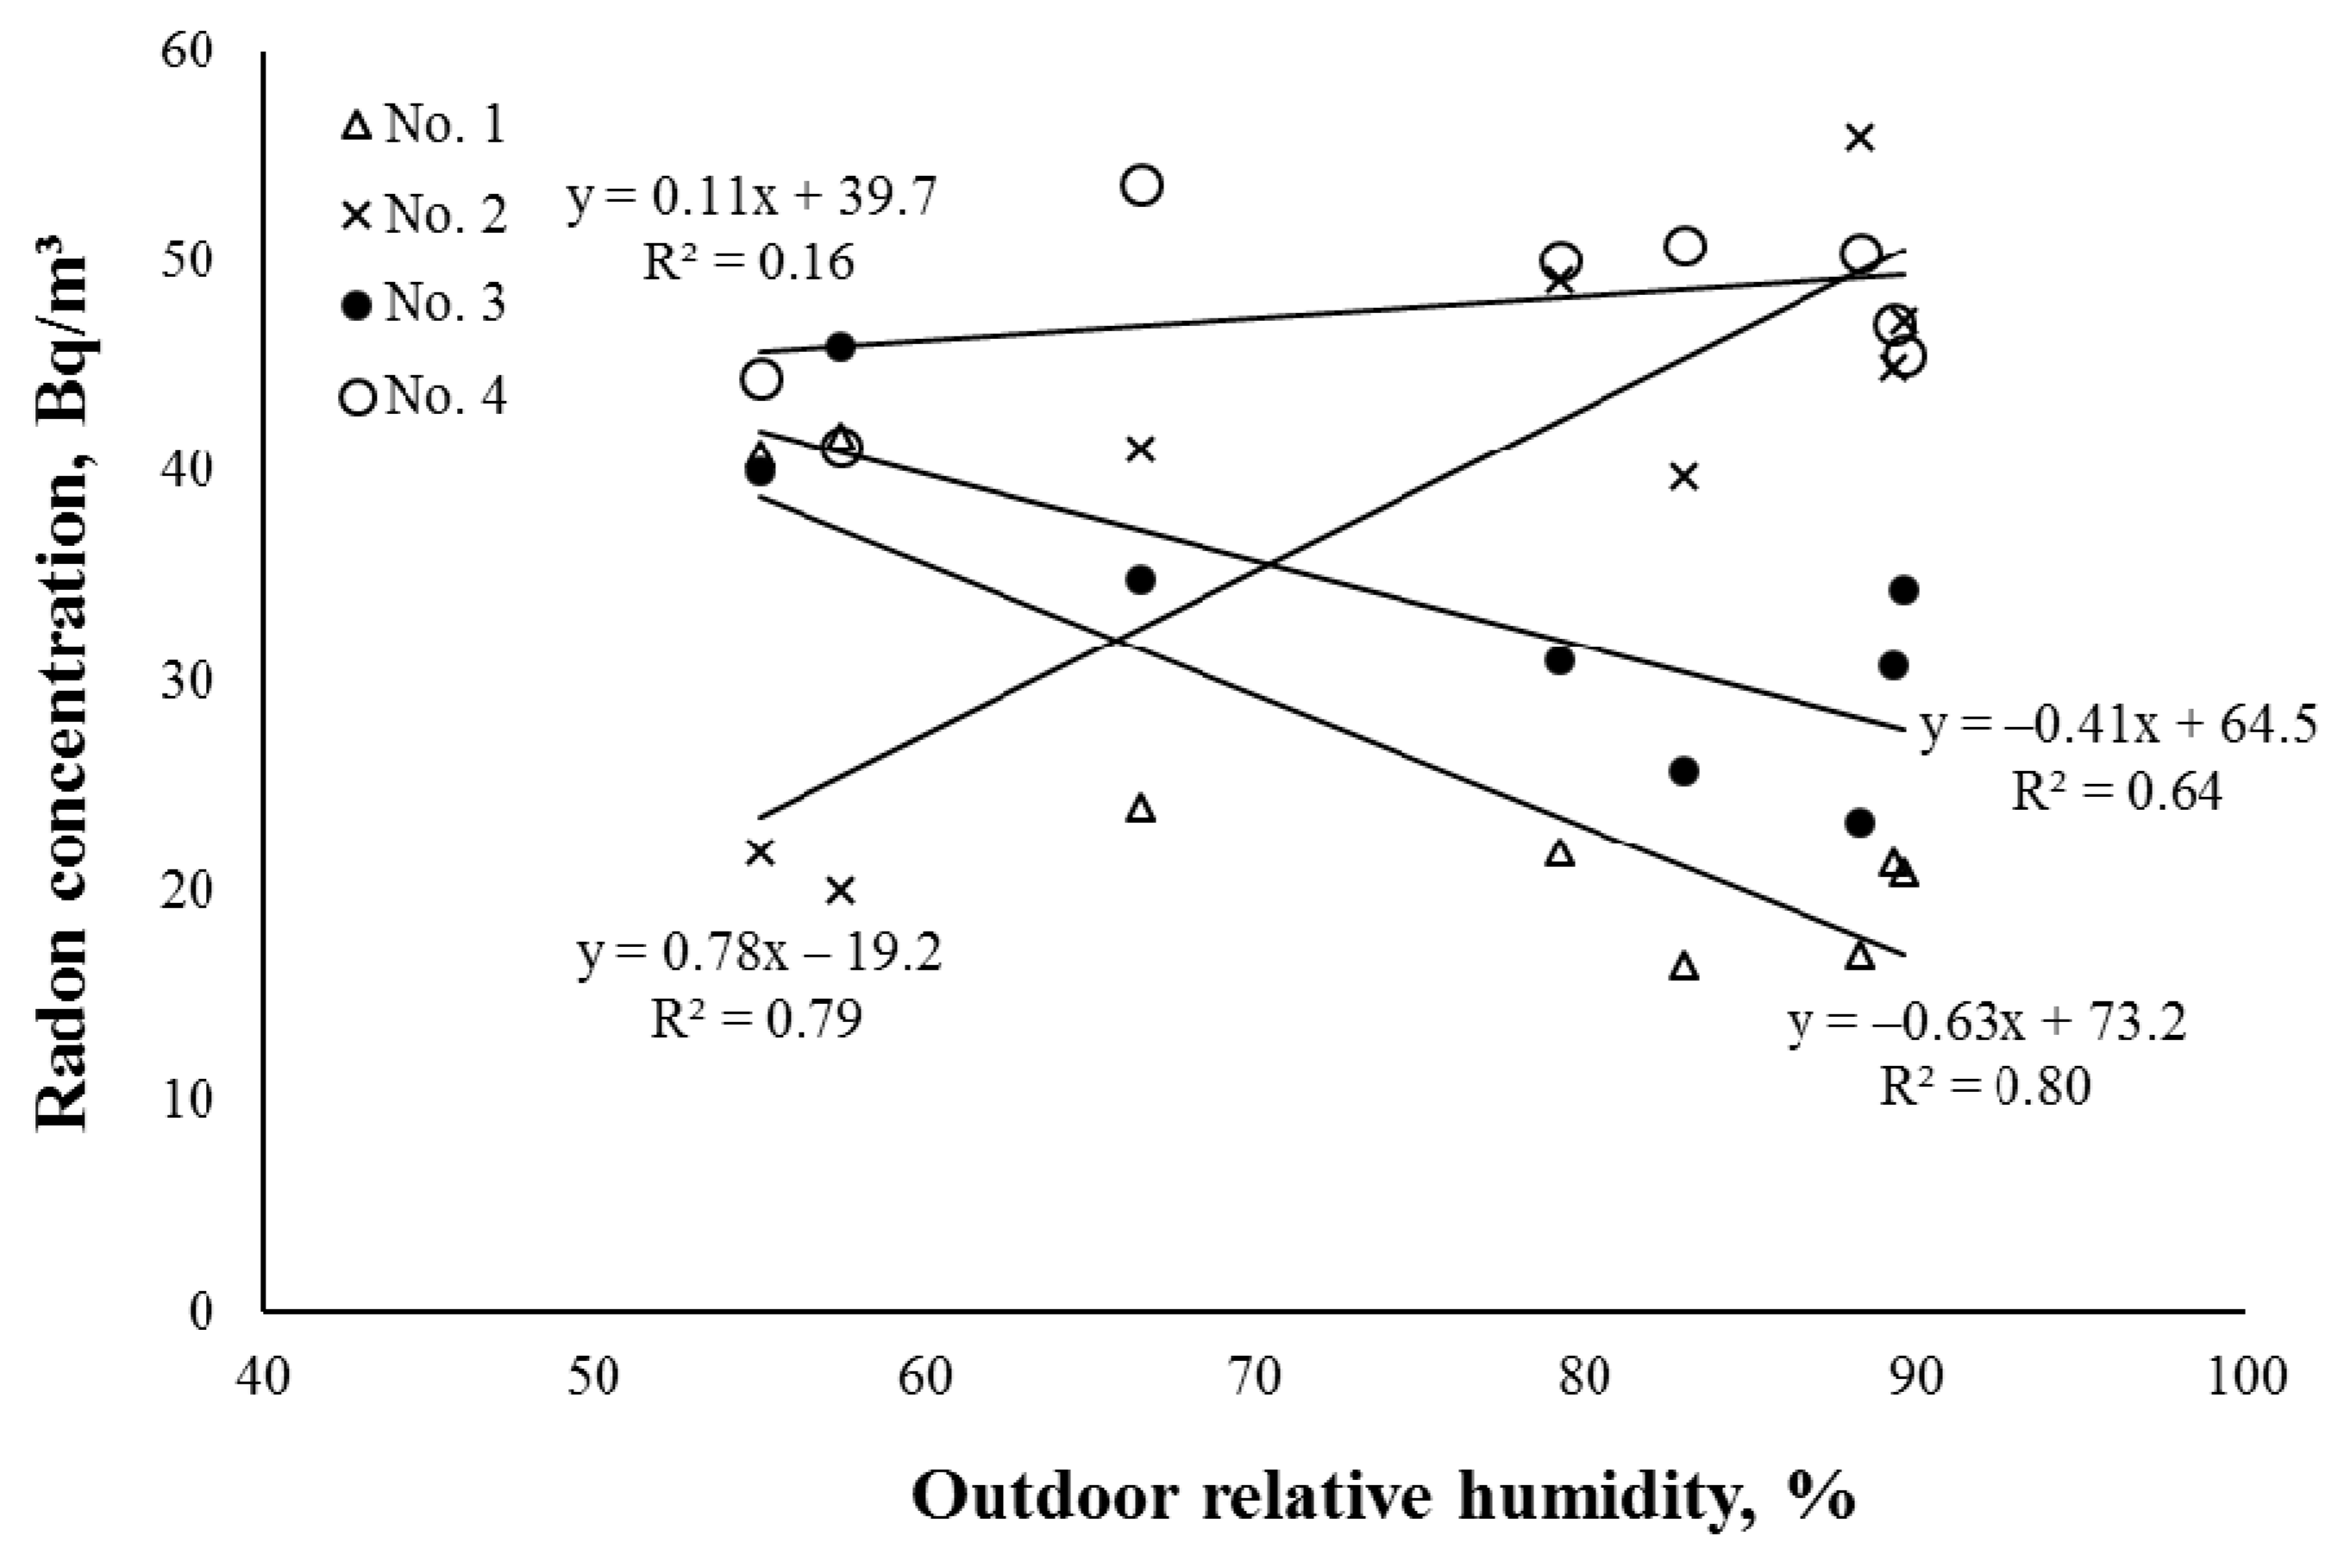
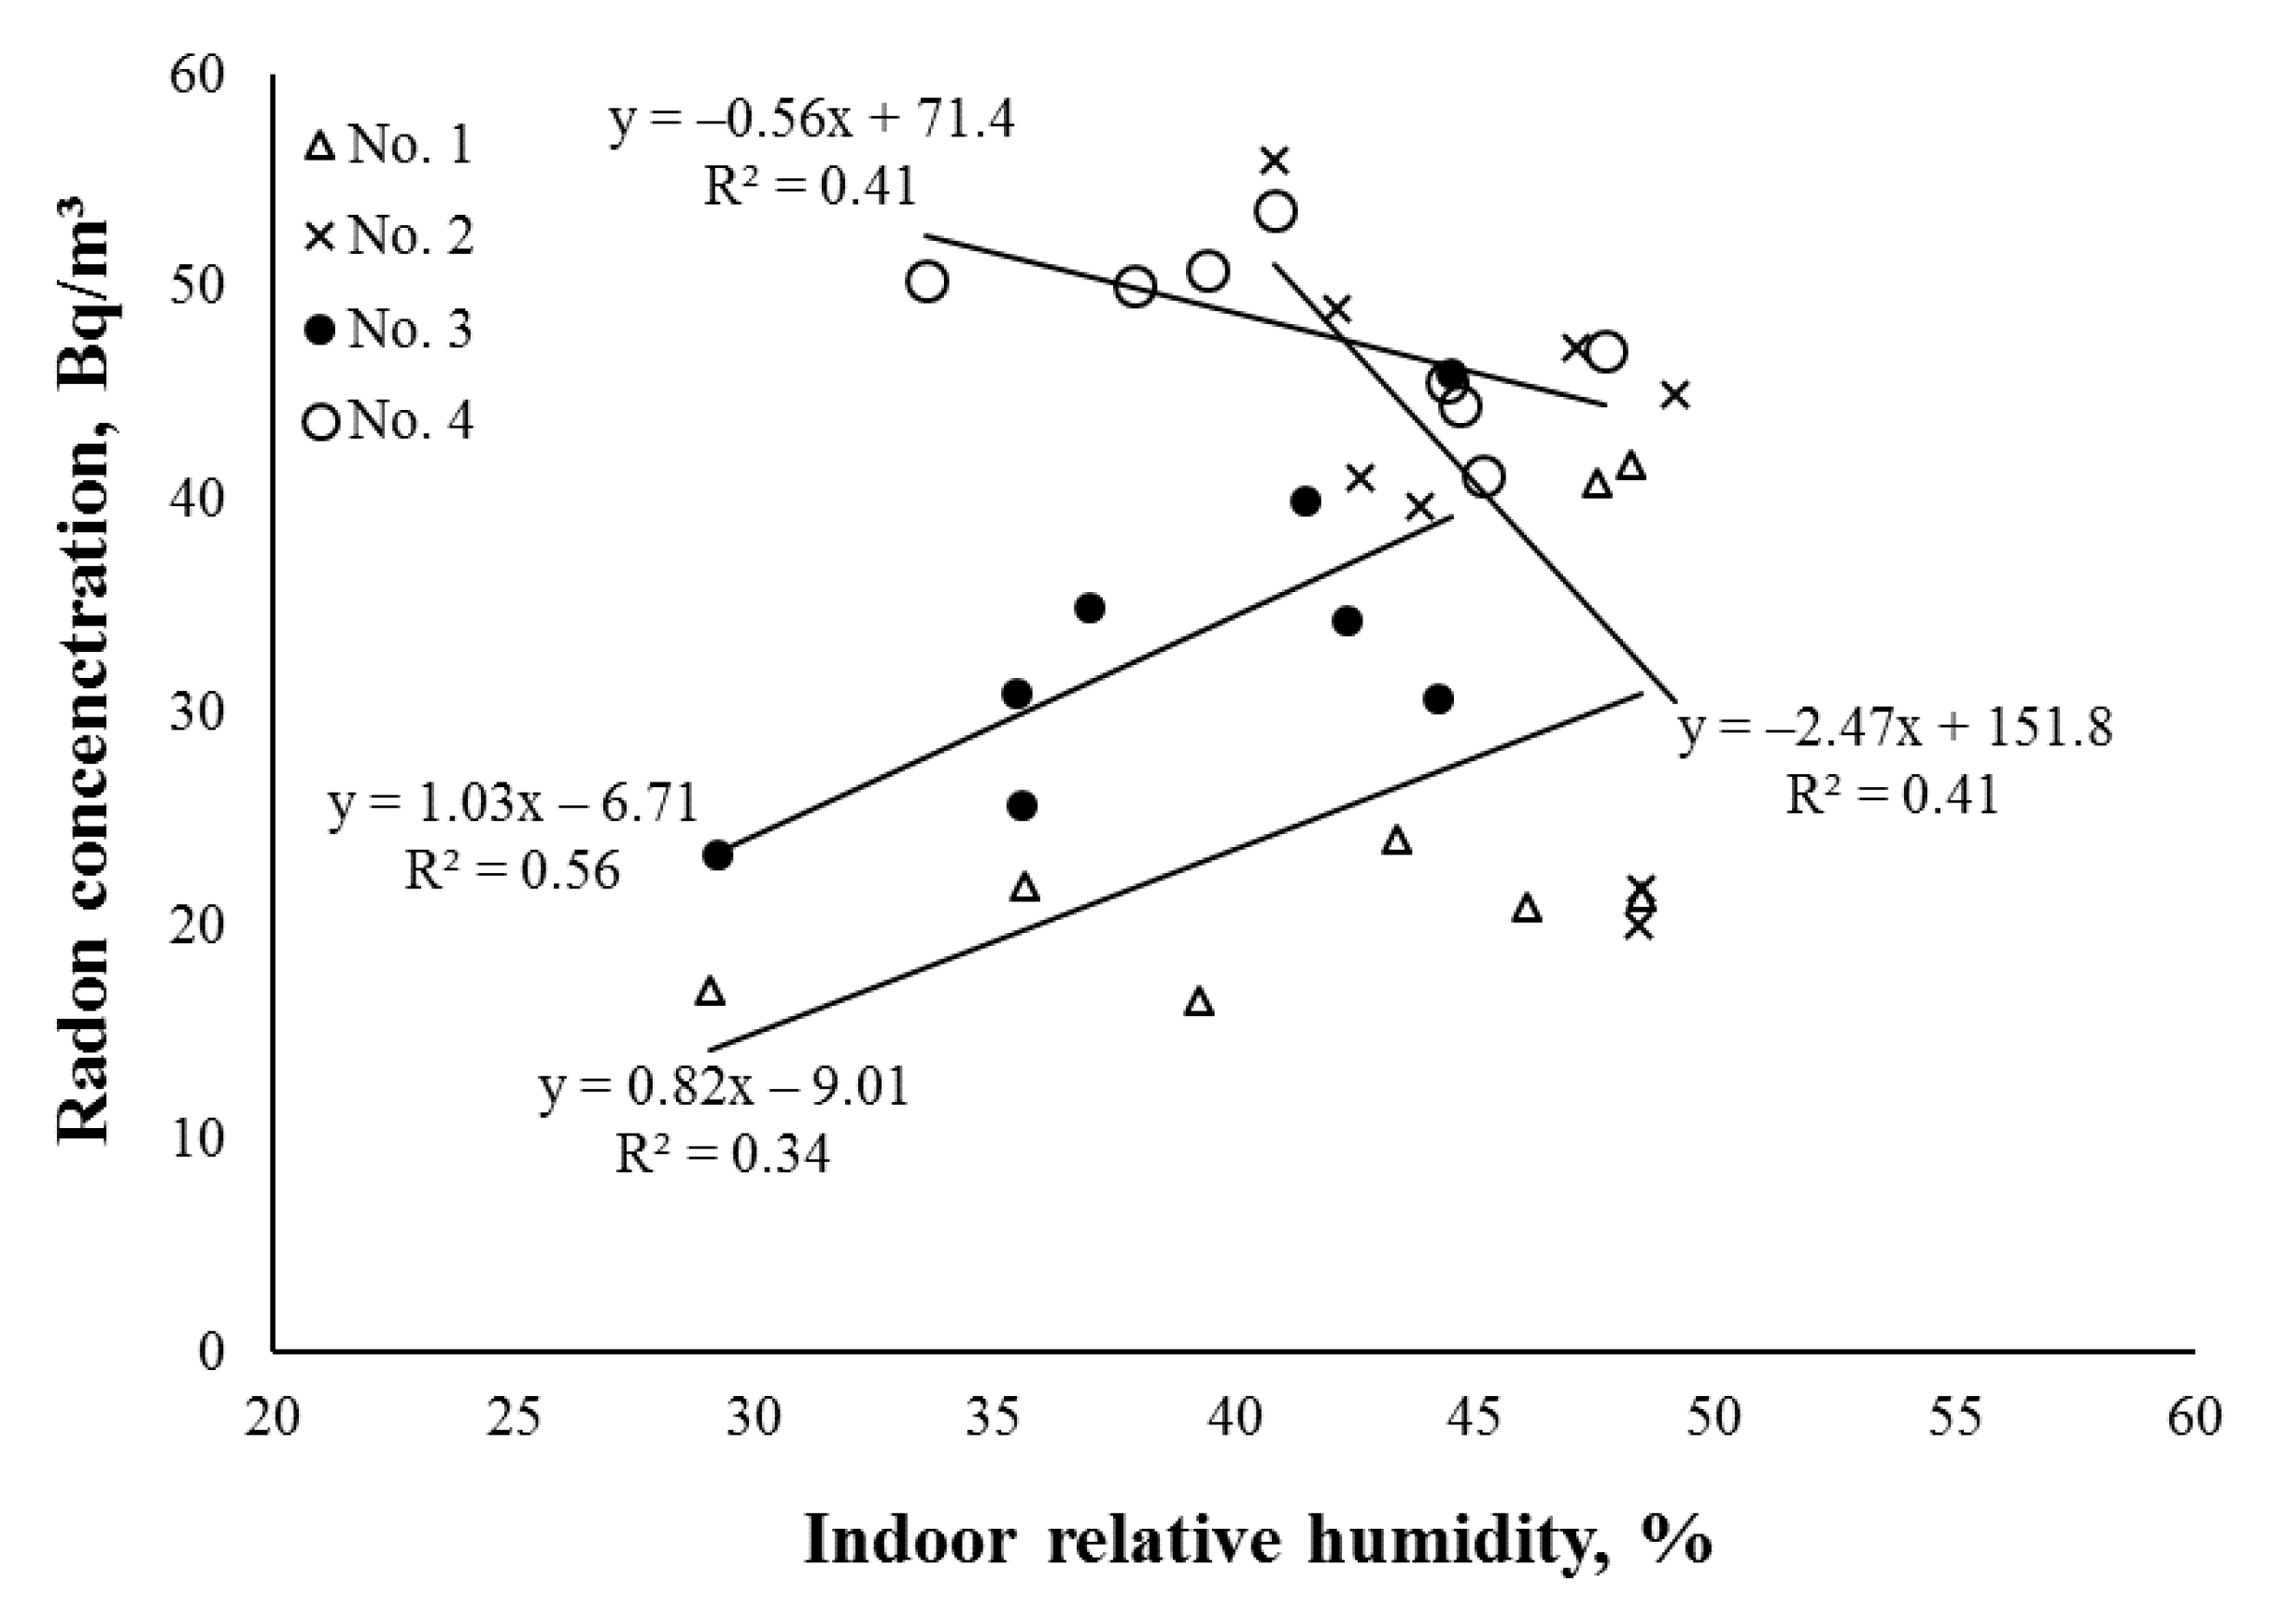
3.3. The Dependencies of the Indoor Radon Concentrations on the Outdoor and Indoor Relative Humidity

The dependencies of the indoor radon concentration on the outdoor relative humidity are presented in Figure 8.
Outdoor relative humidity decreases with increasing outdoor temperature. As can be seen from Figure 1, the measured outdoor relative humidity was inversely proportional to the outdoor temperature, and therefore the obtained correlations were opposite compared to the correlations between the indoor radon levels and outdoor temperature. As shown in Figure 8, for premises No. 2 and No. 4, the radon concentrations increased (R2 = 0.79, R = 0.89, p < 0.01 and R2 = 0.16, R = 0.40, p = 0.33, respectively) with increasing outdoor relative humidity, while for premises No. 1 and No. 3 (R2 = 0.80, R = −0.89, p < 0.01 and R2 = 0.64, R = −0.80, p < 0.05 respectively), the radon levels decreased. The absolute values of the correlations obtained between the indoor radon levels and outside relative humidity were lower than the absolute correlation values between the indoor radon concentration and the outdoor temperature; therefore, in this study, outdoor temperature was the dominant factor determining indoor radon concentrations. Outdoor relative humidity could also be influenced by varying amounts of precipitation during the study period. In the scientific literature, contradictive differences of absolute values of correlations between indoor radon levels and outdoor variables (i.e., temperature and relative humidity) are provided and either of them can be stronger depending on the location and the building [11].
The indoor relative humidity is dependent on many factors, such as the outdoor air temperature and outdoor relative humidity. The dependencies of indoor radon concentrations and the indoor relative humidity are presented in Figure 9.
The indoor relative humidity had a relatively lower variation during the study period compared to the variation of outdoor relative humidity. The radon concentrations correlated positively with the indoor relative humidity in premises No. 1 (R2 = 0.34, R = 0.58, p = 0.13) and No. 3 (R2 = 0.56, R = 0.75, p < 0.05), i.e., in premises where, during winter, possible increased air exchange could occur through air leakage points. The negative correlation values (R2 = 0.41, R = −0.64, p = 0.087) between the indoor radon concentration and indoor relative humidity were obtained in premises No. 2 and No. 4, with better airtightness and where the indoor radon levels were elevated during the cool period. Negative indoor radon correlations with indoor humidity (in buildings where higher indoor radon levels appeared during the autumn–winter season) were also observed by Xie et al. (2015) [21].
During winter, the ventilation effect through leakage points in premises No. 1 and No. 3 was confirmed by the obtained indoor relative humidity values for that premises. The indoor relative humidity strongly depends on the outdoor meteorological parameters (temperature and outdoor humidity) and on how much air comes in to the premises from outside. During the winter, when cold outdoor air enters warm places (building), the relative humidity drops substantially. During the study, the lowest monthly outdoor temperature was obtained in January (Figure 1); therefore, the indoor relative humidity in the studied premises was the lowest.
In January, the indoor relative humidity in premises No. 1 reached 29.1% and in premises No. 3 reached 29.2%. The low values of indoor humidity in these premises in January indicate that, during winter, the air from outside entered the premises and resulted in the ventilation effect. Since the outdoor absolute air humidity is low during the winters, the entering of air into the premises caused a decrease in the indoor relative humidity. In January, the monthly indoor relative humidity in premises No. 2 was 40.8%, indicating lower (compared to premises No. 1 and No. 3) amounts of fresh air entering from outside during winter. Therefore, the increased radon gas flow during winter prevailed in that premises. In premises No. 4, where both ventilation and radon source effects could occur, in January, the obtained monthly indoor humidity value reached 34.6%.
The obtained correlations between the indoor radon concentrations and indoor relative humidity were weaker compared to the correlations between the radon concentrations and outdoor relative humidity, except for premises No. 4, which was rarely used. In premises No. 4, correlations between the indoor radon levels and indoor environmental variables were stronger compared to the correlations between the indoor radon levels and outdoor environmental variables.

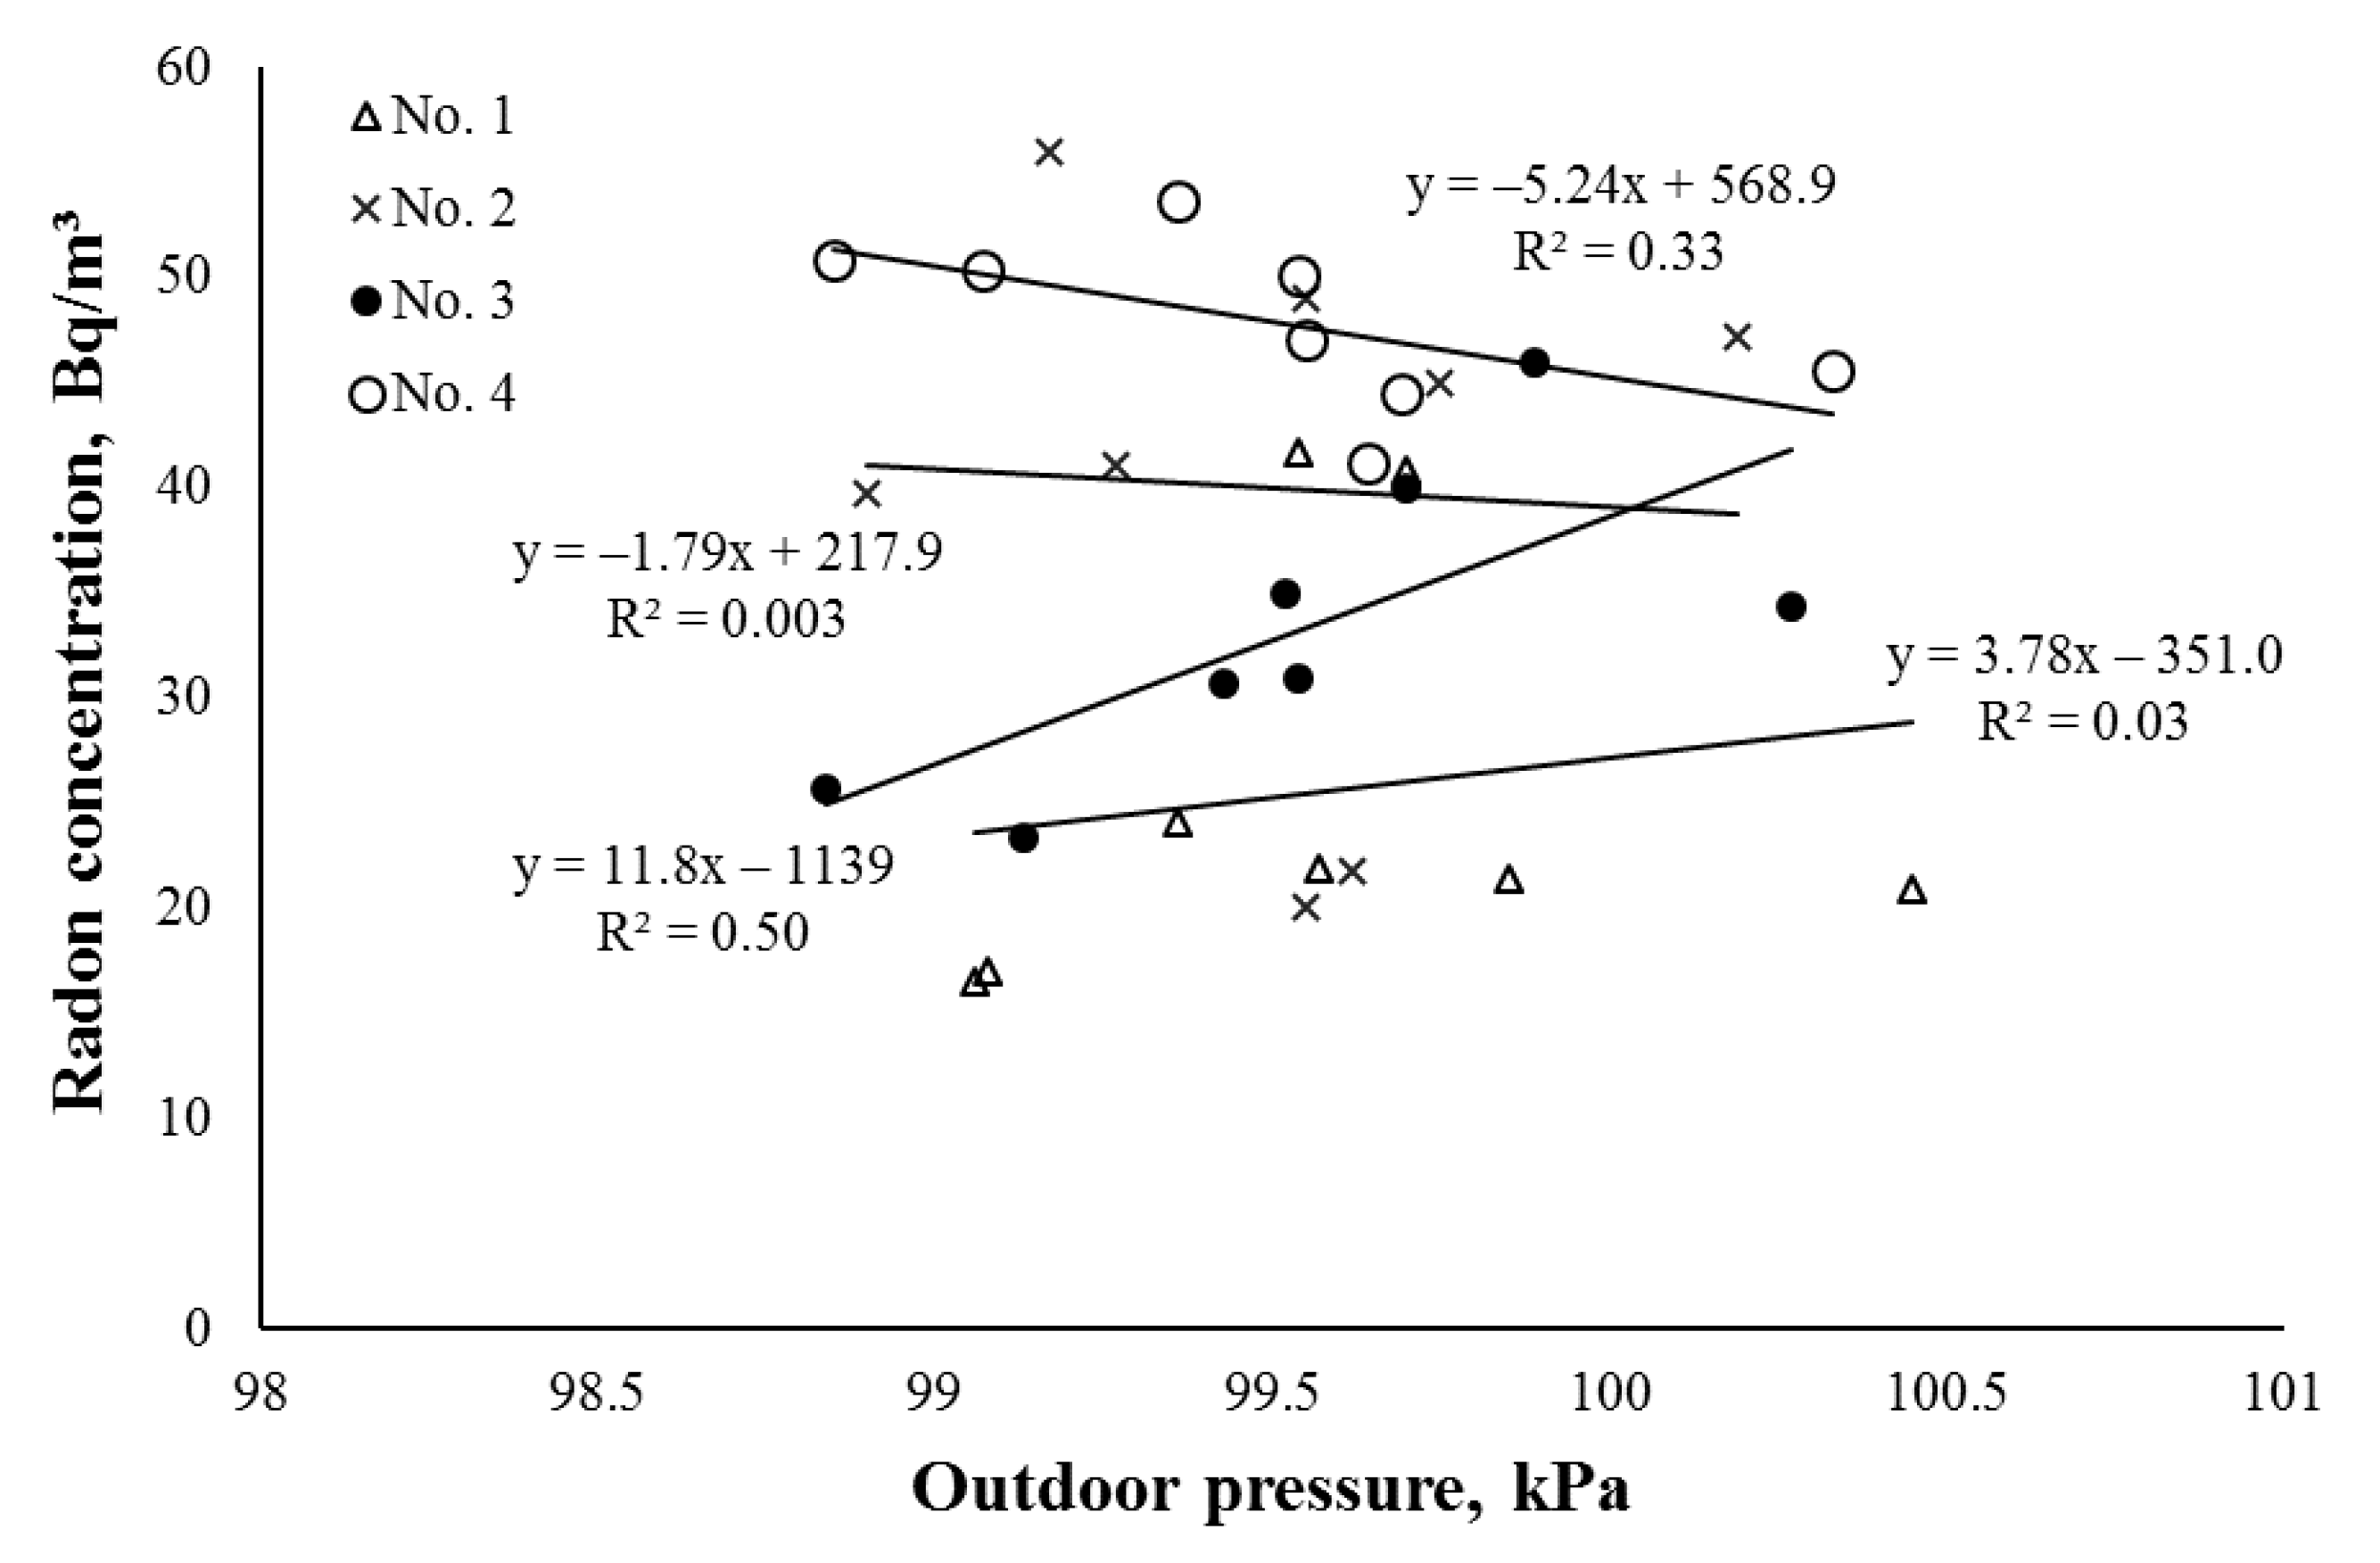
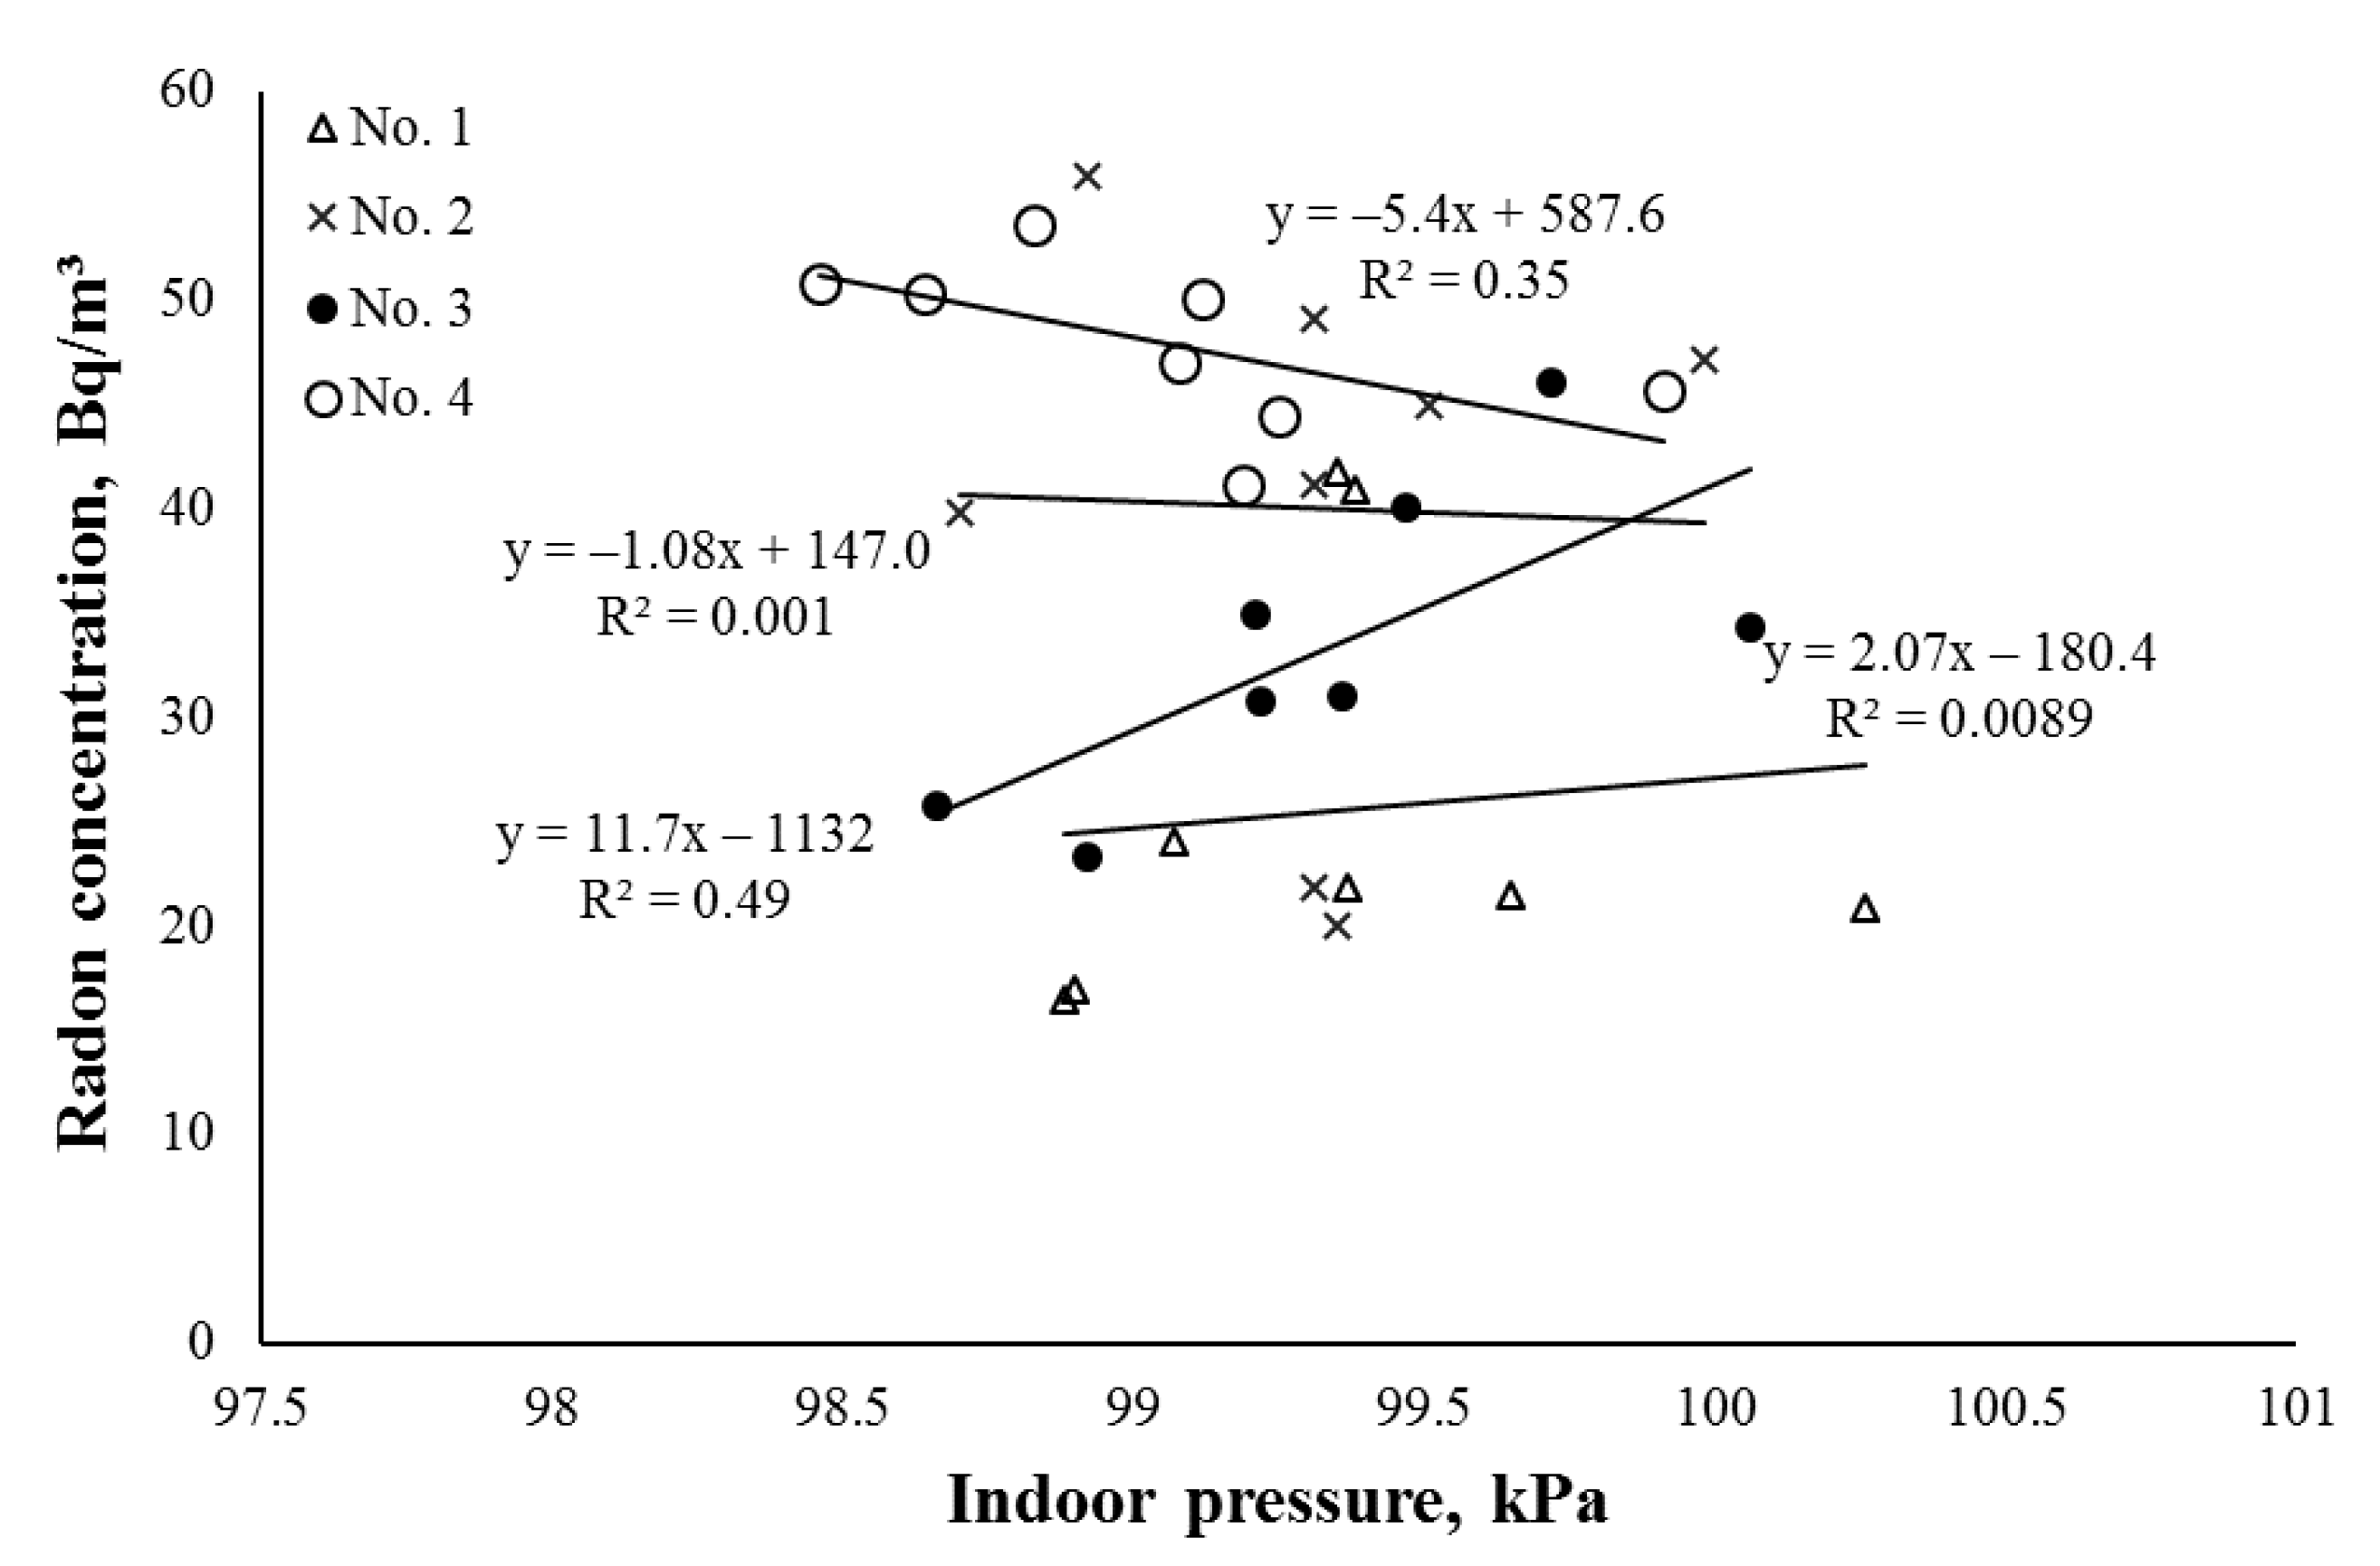
3.4. The Dependence of the Indoor Radon Concentrations on the Outdoor and Indoor Pressure

The dependencies of the indoor radon concentrations on the indoor and outdoor pressure are presented in Figure 10 and Figure 11.
We observed that there were no significant correlations between the indoor radon concentration and the outdoor and indoor air pressure in premises No. 1 and No. 2. However, strong positive correlation coefficients between the indoor radon concentration and outdoor and indoor pressure (R = 0.71, p = 0.05 and R = 0.70, p = 0.053, respectively) were obtained in premises No. 3, where the ventilation effect did occur in winter. Negative correlation coefficients (R = −0.57, p = 0.14 and R = −0.59, p = 0.12) between the indoor radon concentrations and the outdoor and indoor pressure were obtained in premises No. 4. Kitto (2005) and Rowe et al. (2002) [23,41] also observed that pressure had little effect on the indoor radon levels, while Ramola et al. (2000) observed different correlation values between the indoor radon levels and atmospheric pressure in different houses [11]. In this study also, no clear correlations between the indoor radon levels and outdoor and indoor pressures were obtained. The relationship between the indoor radon levels and indoor–outdoor pressure difference was analyzed; however, no significant correlations (R < 0.25 in all cases) were obtained.

4. Conclusions

The present study reports the results of indoor radon level dependencies on various outdoor and indoor environmental parameters for four separate premises of a university building. We found that the indoor radon levels was mostly influenced by the outdoor temperature. The obtained absolute values of correlations between the indoor radon levels and outdoor temperature were the highest compared to the other studied correlations between the indoor radon concentrations and meteorological parameters. In the premises that was rarely used and ventilated, little seasonal radon variation was observed. In this premises, the indoor radon levels were mostly influenced by the indoor temperature and indoor relative humidity.
The research results also showed that the indoor radon variation trends were different in different premises of the same building. Differing characteristics of each premises, such as the airtightness, can result in different correlations between the indoor radon level and outdoor temperature. In premises where possible cracks or unintentional air leakage points occurred, positive correlations between the indoor radon concentrations and outdoor temperature were obtained, while in premises with good airtightness, the obtained correlations between the indoor radon level and outdoor temperature were negative.
The study results indicate that, in educational premises with poorer air isolation, higher indoor radon concentration levels can be obtained in warm seasons compared to the winter period. During winter in these premises, a higher rate of natural ventilation could occur through various air leakage points due to the higher indoor–outdoor temperature difference. However, during the summer season, when the air is hot and stale, higher indoor radon levels could occur, thus creating lower air quality in educational premises. In such premises, we recommend air conditioners in the summer season to lower the indoor temperature and increase the air ventilation rate. In premises with better airtightness, elevated indoor radon levels, especially in the winter season, can be detected. In these buildings, mechanical air ventilation may be recommended during the winter season.
This research is subject to some limitations. The number of premises in which the radon measurements were performed was small, and the seasonal indoor radon level variations were determined in only one educational building, which was built in 1985. Therefore, future research is needed to analyze the relationships between radon concentrations and meteorological parameters in premises of newly built or renovated energy-efficient educational buildings.

Author Contributions

Conceptualization, P.B. and R.G.; methodology, V.D. and R.G.; formal analysis, R.G.; investigation, V.D.; data curation, P.B.; writing—original draft preparation, V.D.; writing—review and editing, P.B. and R.G.; supervision, P.B. All authors have read and agreed to the published version of the manuscript.

Funding

This research received no external funding.

Conflicts of Interest

The authors declare no conflict of interest.

References

  1. Francisco, P.W.; Gloss, S.; Wilson, J.; Rose, W.; Sun, Y.; Dixon, S.L.; Breysse, J.; Tohn, E.; Jacobs, D.E. Radon and moisture impacts from interventions integrated with housing energy retrofits. Indoor Air 2020, 30, 147–155. [Google Scholar] [CrossRef] [PubMed]
  2. Jasaitis, D.; Girgždys, A. The investigation of tobacco smoke influence on the changes of indoor radon and its short-lived decay products volumetric activities. J. Environ. Eng. Landsc. Manag. 2013, 21, 59–66. [Google Scholar] [CrossRef]
  3. Gillmore, G.K.; Phillips, P.S.; Denman, A.R. The effects of geology and the impact of seasonal correction factors on indoor radon levels: A case study approach. J. Environ. Radioact. 2005, 84, 469–479. [Google Scholar] [CrossRef] [PubMed]
  4. Konstantinova, M.; Prokopčiuk, N.; Gudelis, A.; Butkus, D. Radiological assessment of ionizing radiation impact on the terrestrial non-human biota in Lithuania. J. Environ. Eng. Landsc. Manag. 2015, 23, 295–301. [Google Scholar] [CrossRef] [Green Version]
  5. Martins, L.M.O.; Pereira, A.J.S.C.; Oliveira, A.S.; Fernandes, L.F.S.; Pacheco, F.A.L. A new radon prediction approach for an assessment of radiological potential in drinking water. Sci. Total Environ. 2020, 712, 136427. [Google Scholar] [CrossRef] [PubMed]
  6. Ladygienė, R.; Orentienė, A.; Žukauskienė, L. Investigation into 137Cs found in the soil profile within Vilnius region and estimation of inhabitants exposed to 137Cs transfered through the food chain. J. Environ. Eng. Landsc. Manag. 2012, 20, 213–220. [Google Scholar] [CrossRef]
  7. Rizo Maestre, C.; Echarri-Iribarren, V.; Galiano-Garrigós, A. Ventilation as an Indispensable Tool for Healthy Constructions: Comparison of Alicante’s Urban Railway Tunnels. Sustainability 2019, 11, 6205. [Google Scholar] [CrossRef] [Green Version]
  8. Chad-Umoren, Y.E.; Briggs-Kamara, M.A. Environmental ionizing radiation distribution in Rivers State, Nigeria. J. Environ. Eng. Landsc. Manag. 2010, 18, 154–161. [Google Scholar] [CrossRef]
  9. Bossew, P.; Lettner, H. Investigations on indoor radon in Austria, Part 1: Seasonality of indoor radon concentration. J. Environ. Radioact. 2007, 98, 329–345. [Google Scholar] [CrossRef]
  10. Papaefthymiou, H.; Mavroudis, A.; Kritidis, P. Indoor radon levels and influencing factors in houses of Patras, Greece. J. Environ. Radioact. 2003, 66, 247–260. [Google Scholar] [CrossRef]
  11. Ramola, R.C.; Kandari, M.S.; Negi, M.S.; Choubey, V.M. A Study of Diurnai Variation of Indoor Radon Concentrations. Jpn. J. Heal. Phys. 2000, 35, 211–216. [Google Scholar] [CrossRef]
  12. Maestre, C.; Iribarren, V. The Importance of Checking Indoor Air Quality in Underground Historic Buildings Intended for Tourist Use. Sustainability 2019, 11, 689. [Google Scholar] [CrossRef] [Green Version]
  13. Karpińska, M.; Mnich, Z.; Kapała, J. Seasonal changes in radon concentrations in buildings in the region of northeastern Poland. J. Environ. Radioact. 2004, 77, 101–109. [Google Scholar] [CrossRef] [PubMed]
  14. Gallelli, G.; Panatto, D.; Lai, P.; Orlando, P.; Risso, D. Relevance of main factors affecting radon concentration in multi-storey buildings in Liguria (Northern Italy). J. Environ. Radioact. 1998, 39, 117–128. [Google Scholar] [CrossRef]
  15. Porstendorfer, J.; Butterweck, G.; Reineking, A. Daily Variation of the Radon Concentration Indoors and Outdoors and the Influence of Meteorological Parameters. Health Phys. 1994, 67, 283–287. [Google Scholar] [CrossRef]
  16. Andersen, C.E.; Søgaard-Hansen, J.; Majborn, B. Soil Gas and Radon Entry into a Simple Test Structure: Comparison of Experimental and Modelling Results. Radiat. Prot. Dosim. 1994, 56, 151–155. [Google Scholar] [CrossRef]
  17. Keskikuru, T.; Kokotti, H.; Lammi, S.; Kalliokoski, P. Effect of various factors on the rate of radon entry into two different types of houses. Build. Environ. 2001, 36, 1091–1098. [Google Scholar] [CrossRef]
  18. Hubbard, L.M.; Hagberg, N.; Enflo, A. Temperature Effect on Radon Dynamics in Two Swedish Dwellings. Radiat. Prot. Dosim. 1992, 45, 381–386. [Google Scholar] [CrossRef]
  19. Akbari, K.; Mahmoudi, J.; Ghanbari, M. Influence of indoor air conditions on radon concentration in a detached house. J. Environ. Radioact. 2013, 116, 166–173. [Google Scholar] [CrossRef]
  20. Denman, A.R.; Crockett, R.G.M.; Groves-Kirkby, C.J.; Phillips, P.S.; Gillmore, G.K.; Woolridge, A.C. The value of Seasonal Correction Factors in assessing the health risk from domestic radon—A case study in Northamptonshire, UK. Environ. Int. 2007, 33, 34–44. [Google Scholar] [CrossRef]
  21. Xie, D.; Liao, M.; Kearfott, K.J. Influence of environmental factors on indoor radon concentration levels in the basement and ground floor of a building—A case study. Radiat. Meas. 2015, 82, 52–58. [Google Scholar] [CrossRef] [Green Version]
  22. Shaikh, A.; Ramachandran, T.; Vinod Kumar, A. Monitoring and modelling of indoor radon concentrations in a multi-storey building at Mumbai, India. J. Environ. Radioact. 2003, 67, 15–26. [Google Scholar] [CrossRef]
  23. Kitto, M.E. Interrelationship of indoor radon concentrations, soil-gas flux, and meteorological parameters. J. Radioanal. Nucl. Chem. 2005, 264, 381–385. [Google Scholar] [CrossRef]
  24. Aquilina, N.J.; Fenech, S. The Influence of Meteorological Parameters on Indoor and Outdoor Radon Concentrations: A Preliminary Case Study. J. Environ. Pollut. Control 2019, 2, 1–8. [Google Scholar]
  25. Baeza, A.; García-Paniagua, J.; Guillén, J.; Montalbán, B. Influence of architectural style on indoor radon concentration in a radon prone area: A case study. Sci. Total Environ. 2018, 610–611, 258–266. [Google Scholar] [CrossRef]
  26. Oikawa, S.; Kanno, N.; Sanada, T.; Abukawa, J.; Higuchi, H. A survey of indoor workplace radon concentration in Japan. J. Environ. Radioact. 2006, 87, 239–245. [Google Scholar] [CrossRef]
  27. Rahman, S.U.; Rafique, M.; Matiullah, S.; Anwar, J. Radon measurement studies in workplace buildings of the Rawalpindi region and Islamabad Capital area, Pakistan. Build. Environ. 2010, 45, 421–426. [Google Scholar] [CrossRef]
  28. Bucci, S.; Pratesi, G.; Viti, M.L.; Pantani, M.; Bochicchio, F.; Venoso, G. Radon in workplaces: First results of an extensive survey and comparison with radon in homes. Radiat. Prot. Dosim. 2011, 145, 202–205. [Google Scholar] [CrossRef] [Green Version]
  29. Clouvas, A.; Xanthos, S. Antonopoulos-Domis, M. Pilot study of indoor radon in Greek workplaces. Radiat. Prot. Dosim. 2007, 124, 68–74. [Google Scholar] [CrossRef]
  30. Marley, F.; Denman, A.R.; Phillips, P.S. Studies of Radon and Radon Progeny in Air Conditioned Rooms in Hospitals. Radiat. Prot. Dosim. 1998, 76, 273–276. [Google Scholar] [CrossRef]
  31. Mnich, Z.; Karpińska, M.; Kapała, J.; Kozak, K.; Mazur, J.; Birula, A.; Antonowicz, K. Radon concentration in hospital buildings erected during the last 40 years in Białystok, Poland. J. Environ. Radioact. 2004, 75, 225–232. [Google Scholar] [CrossRef] [PubMed]
  32. Banjanac, R.; Dragic, A.; Grabez, B.; Jokovic, D.; Markushev, D.; Panic, B.; Udovicic, V.; Anicin, I. Indoor radon measurements by nuclear track detectors: Applications in secondary schools. Facta Univ. Ser. Phys. Chem. Technol. 2006, 4, 93–100. [Google Scholar] [CrossRef]
  33. Bahtijari, M.; Stegnar, P.; Shemsidini, Z.; Ajazaj, H.; Halimi, Y.; Vaupotič, J.; Kobal, I. Seasonal variation of indoor air radon concentration in schools in Kosovo. Radiat. Meas. 2007, 42, 286–289. [Google Scholar] [CrossRef]
  34. ISO 11665-1:2019. Measurement of Radioactivity in the Environment—Air: Radon-222—Part 1: Origins of Radon and Its short-Lived Decay Products and Associated Measurement Methods. Available online: https://www.iso.org/obp/ui/#iso:std:iso:11665:-1:ed-2:v1:en (accessed on 15 July 2020).
  35. ISO 11665-5:2020. Measurement of Radioactivity in the Environment—Air: Radon-222—Part 5: Continuous Measurement Methods of the Activity Concentration. Available online: https://www.iso.org/standard/76010.html (accessed on 15 July 2020).
  36. Mukaka, M.M. A guide to appropriate use of correlation coefficient in medical research. Malawi Med. J. 2012, 24, 69–71. [Google Scholar]
  37. Council Directive 2013/59/Euratom of 5 December 2013 Laying Down Basic Safety Standards for Protection Against the Dangers Arising from Exposure to Ionising Radiation, and Repealing Directives 89/618/Euratom, 90/641/Euratom, 96/29/Euratom, 97/43/Euratom and 2003/122/Euratom. Available online: https://eur-lex.europa.eu/eli/dir/2013/59/oj (accessed on 15 July 2020).
  38. Stojanovska, Z.; Januseski, J.; Bossew, P.; Zunic, Z.S.; Tollefsen, T.; Ristova, M. Seasonal indoor radon concentration in FYR of Macedonia. Radiat. Meas. 2011, 46, 602–610. [Google Scholar] [CrossRef]
  39. Symonds, P.; Rees, D.; Daraktchieva, Z.; McColl, N.; Bradley, J.; Hamilton, I.; Davies, M. Home energy efficiency and radon: An observational study. Indoor Air 2019, 29, 854–864. [Google Scholar] [CrossRef]
  40. Meyer, W. Impact of constructional energy-saving measures on radon levels indoors. Indoor Air 2019, 29, 680–685. [Google Scholar] [CrossRef]
  41. Rowe, J.E.; Kelly, M.; Price, L.E. Weather system scale variation in radon-222 concentration of indoor air. Sci. Total Environ. 2002, 284, 157–166. [Google Scholar] [CrossRef]
Figure 1. Average monthly outdoor temperature and relative humidity during the study.
Sustainability 12 06174 g001
Figure 2. University campus: 1—central building, 2—building I, 3—auditorium building I, 4—laboratory building I, 5—laboratory building II, and 6—building II (Faculty of Environmental Engineering).
Sustainability 12 06174 g002
Figure 3. The locations of studied premises (red dots): (a) the second floor plan, No. 1; (b) the third floor plan, No. 2; (c) the fourth floor plan, No. 3; and (d) the ninth floor plan, No. 4.
Sustainability 12 06174 g003
Figure 4. Monitor SARAD RTM2200 for radon measurement.
Sustainability 12 06174 g004
Figure 5. Average monthly indoor radon concentration in the premises as a function of the outdoor temperature.
Sustainability 12 06174 g005
Figure 6. Average monthly indoor radon concentration in the premises as a function of the indoor temperature.
Sustainability 12 06174 g006
Figure 7. Average monthly indoor radon concentration in the premises as a function of the indoor–outdoor temperature difference.
Sustainability 12 06174 g007
Figure 8. Average monthly indoor radon concentration in the premises as a function of the outdoor relative humidity.
Sustainability 12 06174 g008
Figure 9. Average monthly indoor radon concentration in the premises as a function of the indoor relative humidity.
Sustainability 12 06174 g009
Figure 10. Average monthly indoor radon concentration in the premises as a function of the outdoor pressure.
Sustainability 12 06174 g010
Figure 11. Average monthly indoor radon concentration in the premises as a function of the indoor pressure.
Sustainability 12 06174 g011
Table 1. Description of the premises.
PremisesThe Premises FloorCubic Volume, m3Type of VentilationThe Purpose of Premises
No. 1Second680.7Natural and forced convectionAuditory premises
No. 2Third25.65Natural convectionVarious laboratory equipment storage place
No. 3Fourth100.4Natural convectionLaboratory premises
No. 4Ninth67.0Natural convectionOld laboratory equipment storage place
Table 2. The monthly average radon concentrations in the premises, Bq/m3 (average ± standard deviation).
MonthRadon Concentration in the Premises, Bq/m3
No. 1 (Second Floor)No. 2 (Third Floor)No. 3 (Fourth Floor)No. 4 (Ninth Floor)
November 201821.5 ± 5.745.0 ± 17.630.7 ± 10.147.1 ± 13.8
December 201820.9 ± 8.247.2 ± 16.134.4 ± 11.945.6 ± 18.2
January 201917.0 ± 5.055.9 ± 20.123.4 ± 8.150.4 ± 18.9
February 201916.5 ± 5.439.9 ± 12.725.7 ± 9.950.8 ± 19.7
March 201921.9 ± 7.349.0 ± 18.331.0 ± 9.350.1 ± 18.3
April 201924.0 ± 8.541.1 ± 17.234.9 ± 9.653.7 ± 17.6
May 201940.9 ± 13.921.9 ± 7.240.2 ± 9.944.5 ± 13.6
June 201941.8 ± 14.320.1 ± 8.346.1 ± 17.341.2 ± 14.7
Average25.640.033.347.9

