Article

Assessing Sustainable Mobility Measures Applying Multicriteria Decision Making Methods

by
Jonas Damidavičius
1,*,
Marija Burinskienė
1 and
Jurgita Antuchevičienė
2
1
Department of Roads, Vilnius Gediminas Technical University, Sauletekio al. 11, 2510 Vilnius, Lithuania
2
Department of Construction Management and Real Estate, Vilnius Gediminas Technical University, Sauletekio al. 11, 2510 Vilnius, Lithuania
*
Author to whom correspondence should be addressed.
Sustainability 2020, 12(15), 6067; https://doi.org/10.3390/su12156067
Submission received: 3 June 2020 / Revised: 16 July 2020 / Accepted: 27 July 2020 / Published: 28 July 2020
(This article belongs to the Special Issue SUMP for Cities’ Sustainable Development)

Abstract

:
An increasing number of recent discussions have focused on the need for designing transport systems in consonance with the importance of the environment, thus promoting investment in the growth of non-motorized transport infrastructure. Under such conditions, the demand for implementing the most effective infrastructure measures has a profoundly positive impact, and requires the least possible financial and human resources. The development of the concept of sustainable mobility puts emphasis on the integrated planning of transport systems, and pays major attention to the expansion of non-motorized and public transport, and different sharing systems, as well as to effective traffic management involving intelligent transport systems. The development of transport infrastructure requires massive investment, and hence the proper use of mobility measures is one of the most important objectives for the rational planning of sustainable transport systems. To achieve this established goal, this article examines a compiled set of mobility measures and identifies the significance of the preferred tools, which involve sustainable mobility experts. The paper also applies multicriteria decision making methods in assessing urban transport systems and their potential in terms of sustainable mobility. Multicriteria decision making methods have been successfully used for assessing the effectiveness of sustainable transport systems, and for comparing them between cities. The proposed universal evaluation model is applied to similar types of cities. The article explores the adaptability of the model by assessing big Lithuanian cities.

1. Introduction

The adverse effect of transport on the environment is currently being addressed through the development of transport infrastructure in cities that have not preserved comprehensive traditions in sustainable mobility planning, thus further encouraging the use of private cars, increasing congestion on roads and causing plenty of negative consequences like loss of time, transport pollution and traffic accidents. The outlined situation has arisen mainly due to urban sprawl, because transport systems are not adapted to the needs of all age, social and interest groups, and no alternatives to travelling by car have been proposed.
In recent years, under the guidance of the White Paper ‘Roadmap to a Single European Transport Area—Towards a competitive and resource efficient transport system’ (White Paper on Transport) [1] and the Communication from the Commission to the European Parliament, the Council, the European Economic and Social Committee and the Committee of the Regions ‘Together Towards Competitive and Resource-Efficient Urban Mobility’ (Communication) [2], a solid theoretical basis for preparing sustainable urban mobility plans (SUMP) has emerged in Europe. Long-term integrated thinking in planning Sustainable Urban Mobility (SUM) systems is one of the most important tasks that must occur in the daily activities of all stakeholders.
The key principles for successful SUM cover the involvement of the public and stakeholders in planning and implementation processes, promoting institutional cooperation on transport links in order to deal with the issues of the other aspects of urban life, identifying the most effective urban infrastructure and sustainable mobility measures (hereinafter referred to as mobility measures), and monitoring and assessing mobility measures and the implementation process.
A huge number of EU-funded projects and programs have provided valuable knowledge that has helped cities to take a new approach to urban planning and transport infrastructure. Modern SUM planning is increasingly evaluated as a necessity for European cities looking towards a common future.
SUM planning is a strategic and integrated method for effectively dealing with the issues of urban transportation. The main goal of the method is to improve accessibility and life quality by switching to alternative transport. This technique is based on decision-making in the long run, which requires a thorough assessment of the current situation and future trends, a mutually acceptable vision and strategic goals, as well as a set of integrated measures (regulatory, promotional, financial, technical and infrastructural) for achieving the established goals. The imposed measures should be regularly monitored and assessed [3].
Hence, with reference to the detailed analysis of practical research and methods applied in other countries, this study aims to reasonably classify mobility measures and assess their significance in line with the size and characteristics of the city. Also, multicriteria decision making methods (MCDM) assist in assessing the transport systems of the biggest Lithuanian cities in terms of sustainable mobility.
Section 2 presents the study process, Section 3 describes the methodology for setting up the package of mobility measures, Section 4 identifies the significance of mobility measures, Section 5 presents the results of MCDM evaluation and Section 6 sets out conclusions and insights.

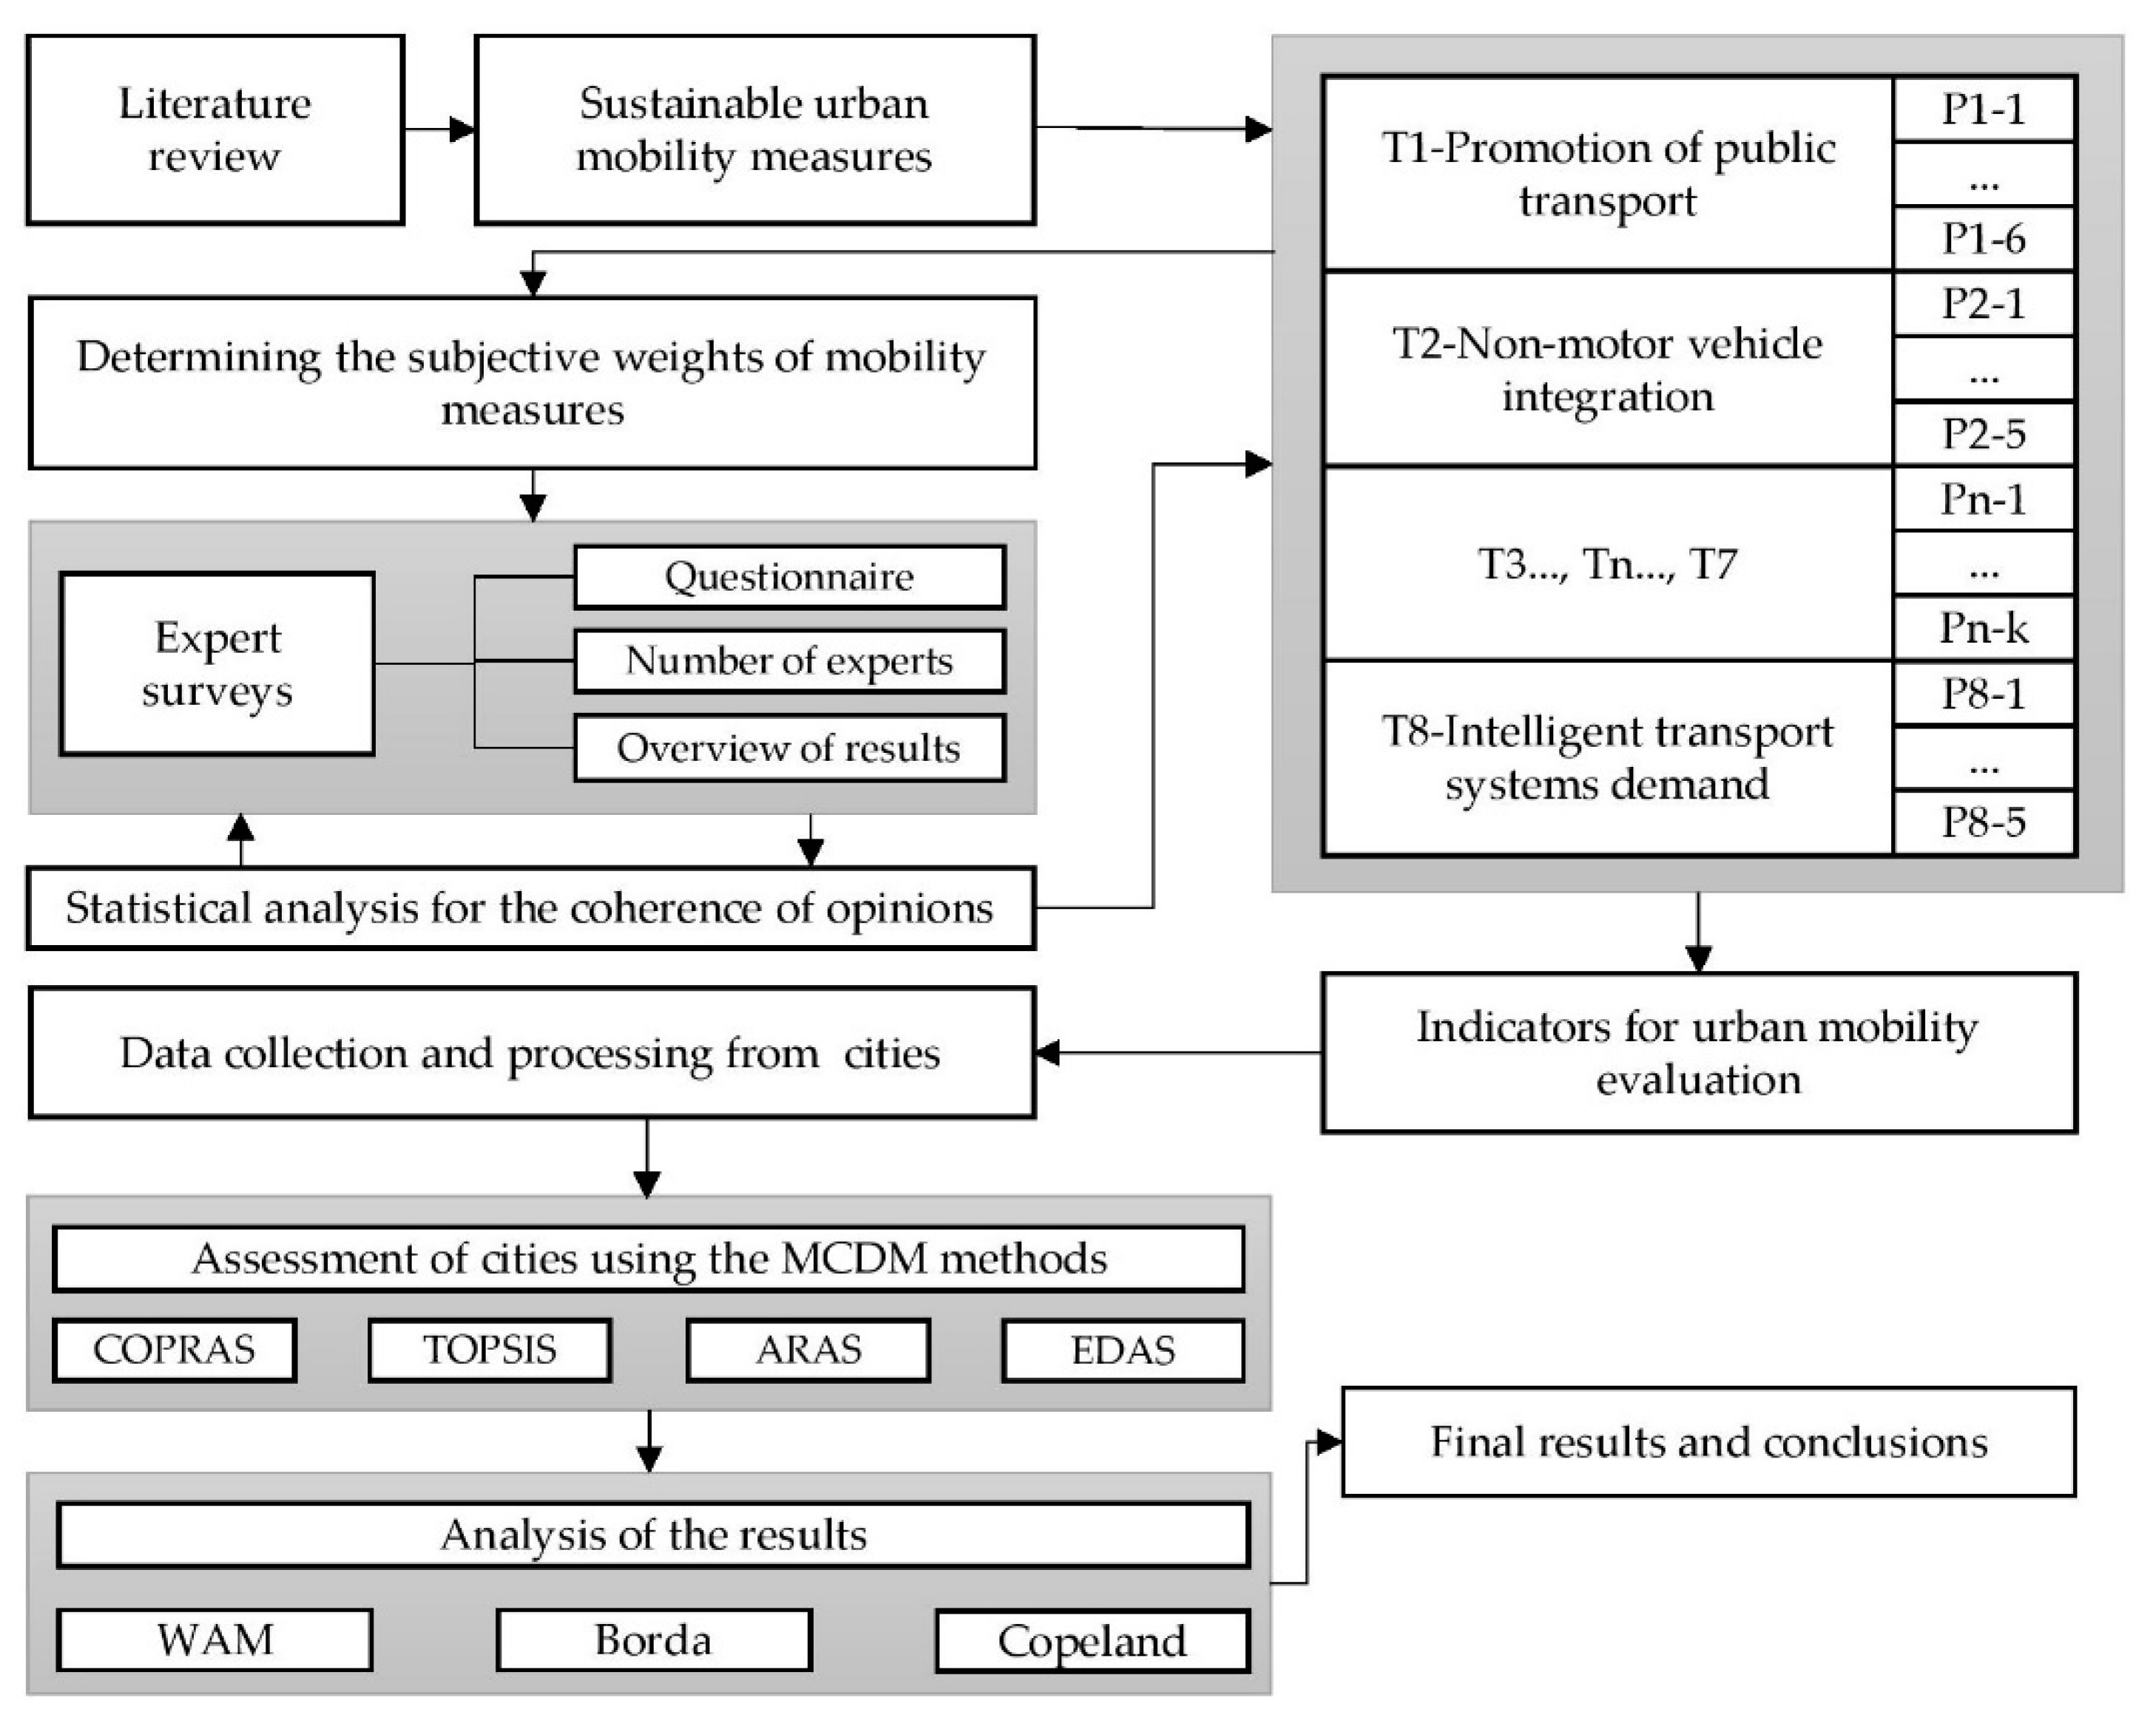
2. The Research Process

Pursuant to the White Paper on Transport and Communication, in 2015, national guidelines for developing Sustainable Urban Mobility Plans were approved in Lithuania [4]. The guidelines covered nine thematic areas that were recommended for further development. The included promotion of public transport (T1), non-motor vehicle integration (T2), traffic safety and transport security (T3), improvement to traffic organization and mobility management (T4), city logistics (T5), integration of people with special needs (T6), promotion of alternative fuels and clean vehicles (T7), assessment of demand for intelligent transport systems (T8) and modal shift (T9). The mobility measures further described in the article are also classified, conforming to the above-introduced thematic areas, but excluding the modal shift, which is more frequently expressed to estimate the impact or result achieved than to describe a set of the specified mobility measures.
The application of MCDM runs into problems because each method gives different meanings in the context of the same criteria. Thus, we usually see to the integrated application of MCDM methods, whereby the results of different MCDM methods are analyzed employing such techniques as the Weighted average, Borda or Copeland, which summarize the findings.
The article is aimed at assessing the largest cities of Lithuania in terms of sustainable mobility. To achieve this objective, the following tasks have been set:
  • compiling the commonly used sets of mobility measures considering thematic areas;
  • compiling expertise to determine the relevance of mobility measures;
  • applying MCDM methods in the assessment of cities;
  • analyzing findings using the Weighted average (WAM), Borda and Copeland methods.
The research process is provided in Figure 1.

3. Designing a System of Mobility Measures

Mobility measures cover a wide range of instruments for achieving the objectives of sustainable development inside the transport sector, and tools for solving the identified transport problems [5]. The identification of efficient mobility measures is the basis of planning SUM.
Until now, the scientific literature has not provided extensive research on SUM development and its impact on urban population, which has been a consequence of the transport infrastructure being designed for the ease of use of road vehicles for a long time. Thus, only street network densification, street widening and traffic throughput were considered [3]. However, in line with the White Paper on Transport, the approach to planning transport systems has changed, and is now more focused on the mobility of people and the effective operation of the infrastructure and transport services that they require.
To solve this issue, researchers, transport experts, the representatives of local authorities and various research agencies have started designing several systems for assessing SUM efficiency and cost-effectiveness, in order to identify the mobility measures that have the greatest positive impact and their economic benefits. The use of sustainable mobility measures takes many forms, some of which see the country-specific manifestation of the mobility measures having the greatest impact [6,7,8,9,10,11,12,13,14,15,16,17,18], while others develop a mobility index based on mobility measures [19,20,21,22,23,24,25,26], or assess sustainable mobility through the environmental, economic and social prism [14,20,27,28,29].
The process of selecting mobility measures is clearly described in the Guidelines for Developing and Implementing a Sustainable Urban Mobility Plan (Second Edition) (Figure 2) [3].
The development of transport infrastructure and the implementation of mobility measures requires a large budget, which often becomes a serious problem for urban governance and, as a result, the development process becomes very slow. The effective and rational selection of mobility measures is a prerequisite for adhering to the principles of economy and acceptability. The assessment and selection of mobility measures needs to identify the most appropriate and cost-effective tools for the chosen development scenario. In order to assess all available options, a comprehensive long list of mobility measures should first be established, which should be based on individual and local expertise, stakeholder and societal ideas, the experience of professionals from other cities and the databases of mobility measures.
Implementing mobility measures in isolation will not achieve the set goals and objectives, and therefore classifying measures and forming their packages is required [3,12,30]. In designing SUM development plans, it is necessary to consider how different mobility measures interact with each other to create a better result than those implemented individually. The creation of such sets is often referred to as an integrated approach, or the integrated implementation of mobility measures. In the development of sets of mobility measures, we often find that relevant identified mobility measures working together have greater impacts (synergy of mobility measures), or they may be designed to enhance the effectiveness of other measures (complementary).
A set of mobility measures is a combination of complementary mobility measures that are often attributed to different categories, and are well-coordinated so as to address specific challenges and overcome barriers to their implementation more effectively than individual mobility measures [5]. In order to create the most useful sets of mobility measures, different ways of grouping should be explored and tested.
T. Litman reviewed and researched many different systems of sustainable transport indicators [31] (revised 54 transport sustainability assessment systems applied in 22 countries), and arrived at the very interesting and useful conclusion that sustainable mobility indicators could not always properly assess urban SUM. For example, if the application area of an indicator is very narrow, it does not reflect the true value with regard to SUM (if only the development of vehicles using an ecological fuel is assessed, refusing the assessment of traffic congestion and road accidents, the assessment indicator does not reflect the real situation). The same is true if intermediate targets, rather than the final result, are considered (the length of cycling routes is an intermediate result, which may not necessarily correspond with the final result, which is a larger number of users). The same principle should apply to the selection and planning of mobility measures: the overall SUM effect requires an integrated approach, rather than the implementation of individual mobility measures.
The search for effective mobility measures and their sets is an increasingly important topic among spatial planning, mobility and transport experts. Therefore, in recent years, many international projects aimed at listing effective mobility measures in relation to certain development criteria or directions have been implemented. Much attention has been paid to developing sets of mobility measures through the CH4LLENGE project [32], which assessed and presented 64 different types of mobility measures. Each of them can be implemented in different ways, subject to the local needs, and thus many possible combinations of the mobility measures present in the sets are available. The mobility measures proposed by the project were integrated into the KonSULT interactive database [11], aimed at helping policy makers, practitioners, experts and other stakeholders to understand urban mobility issues, and identify relevant mobility measures and packages. With reference to the results and recommendations of the CH4LLENGE project, the SUMPs-Up project [6,7,8] provides a long list of mobility measures (more than 100) that fall into 25 categories, related to three types of cities with different levels of SUM development: beginners, advanced and developed. Within the scope of the project, SUM development recommendations for these types of cities were issued. As for other projects, for example EVIDENCE [9], the mobility measures that would have the greatest economic impact were examined. As a result, a list of 22 most cost-effective mobility measures was drawn up, and a detailed description was prepared for each mobility measure, thus indicating the application, implementation and expected cost-effectiveness of the mobility measure.
Experts from the international management consulting company Arthur D Little, and the International Association of Public Transport (UITP), devised an assessment system for urban transport services, composed of 19 key mobility measures each rated with a certain score [15]. A similar assessment was devised by Costa [25], who created the Sustainable Urban Mobility Index (SUMI)—a tool for assessing SUM based on the multicriteria approach. The SUMI was made of 87 indicators proposed by [33]. The indicators were carefully selected to reflect a diverse impact and the outlooks of SUM. J. Lima et al. [21] used both the SUMI and the SUM development method proposed by Mancini [23], who analyzed mobility measures under three categories: cost, time required for implementation, and political risk in the implementation process.
Reisi et al. [20] explored a large quantity of scientific literature, examining the development of SUM-creating systems for indicators and mobility measures. The scientists created an individual SUM assessment index that consisted of nine mobility measures, divided in line with the principles of sustainable development, including environmental, social and economic aspects. To compile the index, mobility measures were assigned assessment indicators for their implementation. The indicators were attributed via their determined significance. In agreement with the principles of sustainable development, mobility measures were also assessed by T. Shiau et al. [16], who used the Rough sets theory [34] and identified the 26 mobility measures that have the greatest impact on SUM. T. Shiau and J. Liu [28] grouped the system of mobility measures conforming to economic, environmental, social and energy aspects, and determined the significance of the mobility measures using the analytical hierarchy process (AHP). Burinskienė et al. [27] assessed a list of 38 mobility measures pursuant to the principles of sustainable development, thus assigning a higher or lower significance to the impacts of each of the measures.
Following a revision of the research literature (the assessment of the prepared international projects containing the sets of the compiled mobility measures and the process of selecting mobility measures), presented in Figure 2, the authors selected 38 mobility measures and divided them into eight thematic areas.
For the further analysis of mobility measures, expertise is used, which allows us to summarize the opinions of the expert group so as to devise a possible solution to the problem.

4. Determining the Significance of Mobility Measures

The Guidelines for Developing and Implementing a Sustainable Urban Mobility Plan (Second Edition) [3] place more emphasis on planning norms, and make recommendations for highlighting city size and its characteristics, specificity, planning differences, urban management, and different integration practices of transport modes and travel habits. This is also important for determining the relevance of mobility measures, because different types of cities have different needs as regards mobility measures. In order to properly establish the significance of mobility measures, the authors divided Lithuanian cities with SUMPs according to population and functional purpose (Figure 3).
Big cities (more than 100 thousand inhabitants) are the Lithuanian cities that are most characterized by a growing economy and a large supply of jobs and services. These cities are strong regional centers, daily attracting a large workforce. The population remains stable, or is slightly increasing. Heavy vehicle traffic predominates in these areas, congestion is frequent during rush hour, and many trips, a wide range of transport options, and a high need for infrastructure development and renovation or repair are observed. These cities are more likely to apply solutions produced by intelligent transport systems, and generate high economic demands.
Middle-sized cities (from 25 thousand to 100 thousand inhabitants) are frequently referred to as metropolitan satellite towns (residential areas). They are often the centers of smaller regions or industrial cities that provide jobs for the local people. The populations remain stable or decline slightly, due to constant migration to nearby cities. These areas are predominated by moderate traffic, infrequent congestion during rush hour, and well-developed infrastructure, which requires less investment in development but more in renovation or repair. A strong focus is placed on the development and maintenance of public spaces. Low supply and demand for transport innovation is observed.
Resorts (up to 25 thousand inhabitants) are strongly characterized by seasonality, when both vehicle flow and the number of city newcomers increase. These towns are characterized by recreational and entertainment services. Visitors prefer these places because of their natural diversity and the quality of the services provided. The local population is not very large, ranging from 3 to 25 thousand. Transport is well developed, with a primary focus on non-motorized transport infrastructure. There is a large supply of transport sharing and rental.
The article discusses and assesses the significance of mobility measures in Lithuania’s biggest cities using MCDM methods. The same evaluation process was carried out for middle-sized cities and resorts, but due to the large volume of data, the article provides only the results from the evaluation of the biggest cities in Lithuania.
The relevance of mobility measures was assessed by interviewing sustainable mobility and transport experts, academicians, advisors, and the representatives of municipal administrations, stakeholder institutions and Non-governmental organizations that have experience in dealing with sustainable mobility and urban planning, and implementing infrastructure measures. The expert survey was based on the separate evaluation of thematic areas, and on the case-by-case assessment of mobility measures for each thematic area, in relation to the different types of cities.
For determining the significance of the impact of mobility measures in big cities, 19 experts were surveyed. Of those experts, 63% were involved in the development of sustainable mobility plans, 47% of the respondents implemented sustainable mobility plans, 32% of the experts participated in sustainable mobility education and policy-making, and 16% of the respondents took part in academic activities. The survey showed that the selected respondents were most frequently involved in more than one area of sustainable mobility, i.e., an expert was engaged in the development of sustainable mobility plans and educational activities, and therefore their interest and experience could be expected to provide high-quality and representative assessment.
The surveyed experts were asked to assess thematic areas and mobility measures imposed in line with the presented thematic areas (hereinafter—assessment indicators), and answer the following questions:
  • What thematic areas are the most important for developing SUM?
  • What mobility measures have the largest impact on SUM development?
Assessment indicators were ranked pursuant to importance. The indicator with the highest value was assessed as having the biggest possible score, and the indicator with the lowest value was given the lowest score. The peer review showed expert preference for thematic areas and the mobility measures of individual thematic areas. With reference to the ranks given, the weights of the mobility measures were determined. The expert survey assessed the consistency of expert opinions [35,36,37,38,39].
First, the sum of ranks for each assessment indicator is determined:
P j = k = 1 r P j k
where Pjk is the expert rank k for assessment indicator j, and r is the number of experts.
The subjective weight of the index is equal to:
ω j = P ¯ j i = 1 m P j
where m is the number of assessment indicators.
The rating of the index enables us to verify the agreement among expert opinions. Kendall’s coefficient of concordance, W, determines the agreement level, calculated via the following formula [35]:
W = 12 · S r 2 · m · ( m 2 1 )
The sum of squared deviations, S, of ranking sums’ Pj deviations from the total mean P is calculated via the following formula:
S = j = 1 m ( P j P ) ¯ 2
The level of expert agreement is determined by the related value of χ2, rather than by the coefficient of concordance W, and is calculated as reported in formula [35]:
χ 2 = W · r · ( m 1 ) = 12 S r · m · ( m + 1 )
The statistical hypothesis concerning the expert agreement on ranks has been proven [35] to be acceptable for making calculations as presented in the last formula, where the value of χ2 is higher than the critical value of χ2kr taken from the χ2 distribution table, with the freedom degree equal to υ = m 1 and the selected significance level α close to zero.
The calculated significances of the mobility measures indicate the instances where the selected assessment indicator is more important than the other assessment indicator. Thus, the following selections of assessment indicators involve only the indicators with the highest values in each of the intended groups.
The parameters and determined significance from the expert survey of the assessment indicators are provided in Table 1.
The established significance values of the assessment indicators are further used for the multicriteria assessment of thematic areas using MCDMs.

5. The Results of Applying Multicriteria Decision Making Methods

Many MCDMs can be applied in analyzing the implementation of urban mobility measures in cities. Parezanovic et al. [40] used the COPRAS method for assessing mobility measures in line with the selected assessment criteria. Hickman et al. [41] applied multicriteria assessment in exploring the possibilities of developing transport infrastructure in keeping with different scenarios. Podvezko V. and Sivilevičius H. [42] employed the AHP method and examined transport systems through the prism of traffic safety. Other researchers applied MCDM methods in specifying locations to implement mobility measures [43].
MCDM are aimed at creating cumulative indicators for each selected thematic area. The indicator reflects the attractiveness of the area in quantitative measures, expressed in the unit value [39,44,45], which means that the calculated value defines the attractiveness of the thematic area for urban development.
The past conducted research has applied the COPRAS (Complex Proportional Assessment) method in combining the values of all the mobility measures into a single qualitative assessment—the value of the indicator of the method [46]. The TOPSIS (Technique for Order Preference by Similarity to an Ideal Solution) method has been used for determining the distance to the ideal point, whereby the selected best alternative has the smallest distance to the best decision, and the largest distance to the worst decision [47]. The ARAS (Additive Ratio Assessment) method has indicated the best alternative that is closest to the optimal solution [48]. The EDAS (Evaluation Based on Distance from Average Solution) method has determined the best alternative as related to the distance from the average decision [49].
Applying various MCDM methods in solving the same problem frequently shows different assessment results. The Borda [50,51] and Copeland [52,53] methods can be used to identify the most significant alternatives computed by employing MCDM techniques.
Results of assessing the biggest Lithuanian cities in accordance with thematic areas have been obtained using MCDM methods, and are presented in Table 2. In line with different MCDM methods, priority lines differ slightly, and therefore the use of the Weighted average, Borda and Copeland methods assists in calculating the summarized priority lines.
Assessment of the results using the Weighted average, Borda and Copeland methods demonstrates that Vilnius and Panevėžys have collected the same number of ranks in the thematic area T4, and therefore take the first and second place in order of priority. To solve the above-introduced situation, the location of the priority line has been specified by averaging city significance in line with the findings obtained by performing MCDM assessment. Thus, Vilnius is ranked first (0.4636) and Panevėžys is ranked second (0.4325).
Analysis of the assessment results shows that the dominant city differs in each thematic area, and there is not a single city that has the highest ranks in all thematic areas; for example, the rank of Panevėžys in thematic area T3—Traffic safety and transport security is the highest, whereas their rank in thematic area T7—Promotion of alternative fuels and clean vehicles is the lowest.
To identify the city that has the highest rank pursuant to the established ranks of individual thematic areas, the ranks of the thematic areas of each city are summed. The city having the lowest calculated sum of ranks is given the highest rank and, in accordance with the same principle, the city with the highest calculated sum of ranks is given the lowest assessment rank. The obtained results are provided in Table 3.
The overall assessment of SUM disclosed that Vilnius city had the highest rank (sum of ranks was 18), and Šiauliai city had the lowest rank (sum of ranks was 30). Analysis of the sums of the ranks of the Kaunas and Klaipėda cities shows that the SUM of these cities were very similar, and therefore the mobility measures implemented in future are likely to change the situation in the general order of priorities.
The impact of each thematic area on the overall assessment result is different, and thus using the significance of the thematic areas identified by experts helps with combining the individual MCDM methods so as to assess the overall development levels of SUM. In this case, the elements of the decision matrices are the values of the assessed thematic areas derived by applying individual MCDM methods. The maximum values obtained using the MCDM methods are the best results, and therefore all indicators of the thematic areas are maximized during the assessment process. Subsequently, the assessment of thematic areas using individual MCDM methods, and the overall assessment, are performed (see Table 4).
The analysis of the produced results disclosed that Vilnius and Panevėžys collected the same number of ranks, and shared the first and second places in order of priority. To solve the situation, the location of the priority line was specified according to the averages of the values obtained via MCDM assessment. Hence, Panevėžys was ranked first (0.4383), and Vilnius took the second position (0.4231).
The summary of the obtained findings demonstrates that equal overall results were calculated by all three of the Weighted average, Borda and Copeland methods. MCDM assessment showed the highest levels of SUM development in Panevėžys and Vilnius, rather than in other large cities. The values obtained in Vilnius and Panevėžys have been found to vary from those identified in Klaipėda city, which occupied the next place in terms of priority by more than 40%. This shows a gap in the implementation of the sustainable urban mobility measures between the cities.

6. Discussion and Conclusions

A comparison of two types of assessment has shown varying results in term of priority. Differences in the findings demonstrate that ranking significance does not consider the actual level of implementation of the urban mobility measure within the MCDM assessment process. Ranking only states the fact that the appropriate significance of a thematic area of a certain city is the highest compared to other cities, but does not point out the significance of that thematic area in the general transport system. The results of both types of assessment lead to the conclusion that, for overall ranking by aggregating the individual ranks of thematic areas, a city that enacts more mobility measures compared to other cities can be identified. Further, the determination of the significance of the thematic areas established by the experts, and the combination of thematic area values determined via MCDM methods, both assist in distinguishing the cities that are implementing more higher-quality (more significant) mobility measures.
The results of the undertaken assessment show that it is appropriate to use the ranking method in determining the cities occupying the leading positions with regard to individual thematic areas. However, the numerical significance of thematic areas needs to be considered when assessing the overall level of SUM development.
Table 4 shows that the acquired average significance of the cities can be used as an index for SUM development, showing the relative progress of a city in implementing sustainable mobility measures compared to other cities of the same type. For comparing these indexes with each other, the possibility of determining the differences in the relative effectiveness of the SUM development levels in individual cities is suggested. For instance, comparing Panevėžys city (0.4383) with Šiauliai city (0.1139) demonstrates that the effectiveness of the SUM development level in Panevėžys is 3.85-fold higher than that in Šiauliai. Such a comparison is used in practice when planning the development of the common transport system, providing measures to be implemented and calculating clear and comparable indexes for the decisions taken.
The findings do not assume that the development of SUM should mainly focus only on the most significant mobility measure or thematic area, because successful SUM planning is determined by the integrated implementation of mobility measures. However, it should be noted that the smooth implementation of both low and greater mobility measures will result in a higher overall level of developing SUM, and better conditions for the society.
The significance levels of the thematic areas and mobility measures identified during expert consultation can constitute a good guide in assessing the mobility measures selected for implementation. In order to achieve maximum results with the least time and money, it is recommended to implement the mobility measures which, firstly, are appropriate for the local context, and secondly, have a greater relevance to and impact on the mobility of the society. MCDM assessment assists in estimating the effect that mobility measures will have on the transport system, comparing between similar types of cities.
A combination of different MCDM methods and a summary of the obtained results both allow for more accurate results in assessing the current/planned effectiveness of transport systems. This instrument is particularly useful for ‘beginner’ cities, which are starting to step up their implementation of sustainable mobility measures and are looking for practical examples in similar cities. The suggested model demonstrates the effectiveness of the transport system, considering the aspect of consumer satisfaction rather than cost-effectiveness (e.g., using cost–benefit analysis), i.e., the choice and implementation of mobility measures is assessed through the need and impact of infrastructure and services.
The proposed model is not applied to all European cities (e.g., metropolitan areas), and therefore leaves room for further work and research on the list of mobility measures, and the identification of their relevance, for example, to metropolitan areas.

Author Contributions

Conceptualization, J.D. and M.B.; methodology, J.A.; investigation, J.D.; data curation, J.D. and J.A.; writing—original draft preparation, J.D.; writing—review and editing, J.A.; visualization, J.D.; supervision, M.B. All authors have read and agreed to the published version of the manuscript.

Funding

This research was funded by Vilnius Gediminas Technical University.

Conflicts of Interest

The authors declare no conflict of interest.

References

  1. European Commission (EC). White Paper. Roadmap to a Single European Transport Area—Towards a competitive and resource efficient transport system. 2011. Available online: http://eur-lex.europa.eu/legal-content/EN/ALL/?uri=CELEX:52011DC0144 (accessed on 22 February 2020).
  2. European Commission (EC). Communication from the Commission to the European Parliament, the Council, the European Economic and Social Committee and the Committee of the Regions Together towards competitive and Resource—Efficient Urban Mobility. 2013. Available online: https://eur-lex.europa.eu/legal-content/EN/TXT/?qid=1585991520554&uri=CELEX:52013DC0913 (accessed on 22 February 2020).
  3. Rupprecht Consult 2019. Guidelines for Developing and Implementing a Sustainable Urban Mobility Plan, Second Edition. Available online: https://www.eltis.org/sites/default/files/sump-guidelines-2019_mediumres.pdf (accessed on 11 May 2020).
  4. Ministry of Transport and Communications of the Republic of Lithuania (MoTC). National Guidelines of Preparation of Sustainable Urban Mobility Plans. 2015. Available online: https://e-seimas.lrs.lt/portal/legalAct/lt/TAD/a1c919e0c9cc11e4bc22872d979254dd?jfwid=-l5uh8xdz3 (accessed on 6 February 2020).
  5. May, A.D.; Kelly, C.; Shepherd, S.; Jopson, A. An option generation tool for potential urban transport policy packages. Transp. Policy 2012, 20, 162–173. [Google Scholar] [CrossRef]
  6. Sundberg, R. CIVITAS SUPs-Up Manual on the Integration of Measures and Measure Packages in a SUMP for Advanced Cities. 2018. Available online: https://sumps-up.eu/publications-and-reports (accessed on 7 May 2020).
  7. Sundberg, R. CIVITAS SUPs-Up Manual on the Integration of Measures and Measure Packages in a SUMP for Beginner Cities. 2018. Available online: https://sumps-up.eu/publications-and-reports (accessed on 7 May 2020).
  8. Sundberg, R. CIVITAS SUPs-Up Manual on the Integration of Measures and Measure Packages in a SUMP for Intermediate Cities. 2018. Available online: https://sumps-up.eu/publications-and-reports (accessed on 7 May 2020).
  9. Shergold, I.; Parkhurst, G. Demonstrating Economic Benefit from Sustainable Mobility Choices—The EVIDENCE Project. 2017. Available online: https://ec.europa.eu/energy/intelligent/projects/sites/iee-projects/files/projects/documents/evidence_publishable-report_final_2017.pdf (accessed on 7 May 2020).
  10. The Urban Transport Roadmap (UTR). Study on European Urban Transport Roadmap 2030. 2016. Available online: http://www.urban-transport-roadmaps.eu (accessed on 7 May 2020).
  11. KonSULT. Knowledgebase on Sustainable Urban Land Use and Transport. 2016. Available online: http://www.konsult.leeds.ac.uk/ (accessed on 6 February 2020).
  12. May, A.D. CH4LLENGE Manual on Measure Selection: Selecting the most Effective Packages of Measures for Sustainable Urban Mobility Plans. 2016. Available online: http://www.sump-challenges.eu/ (accessed on 11 May 2020).
  13. Chakhtoura, C.; Pojani, D. Indicator-based evaluation of sustainable transport plans: A framework for Paris and other large cities. Transp. Policy 2016, 50, 15–28. [Google Scholar] [CrossRef]
  14. Nocera, S.; Tonin, S.; Cavallaro, F. Carbon estimation and urban mobility plans: Opportunities in a context of austerity. Res. Transp. Econ. 2015, 51, 71–82. [Google Scholar] [CrossRef]
  15. Van Audenhove, F.J.; Koriichuk, O.; Dauby, L.; Pourbarx, J. The Future of Urban Mobility 2.0: Imperatives to Shape Extended Mobility Ecosystems of Tomorrow. 2014. Available online: http://www.uitp.org/sites/default/files/members/140124%20Arthur%20D.%20Little%20&%20UITP_Future%20of%20Urban%20Mobility%202%200_Full%20study.pdf (accessed on 7 May 2020).
  16. Shiau, T.A.; Huang, M.W.; Lin, W.Y. Developing an indicator system for measuring Taiwan’s transport sustainability. Int. J. Sustain. Transp. 2013, 9, 81–92. [Google Scholar] [CrossRef]
  17. Haghshenas, H.; Vaziri, M.; Gholamialam, A. Evaluation of sustainable policy in urban transportation using system dynamics and world cities data: A case study in Isfahan. Cities 2012, 45, 104–115. [Google Scholar] [CrossRef]
  18. MaxExplorer Tool. 2006. Available online: http://www.epomm.eu/index.php?id=2745 (accessed on 11 May 2020).
  19. Arsenio, E.; Martens, K.; Ciommo, F. Sustainable urban mobility plans: Bridging climate change and equity targets? Res. Transp. Econ. 2016, 55, 30–39. [Google Scholar] [CrossRef]
  20. Reisi, M.; Aye, L.; Rajabifard, A.; Ngo, T. Transport sustainability index: Melbourne case study. Ecol. Indic. 2014, 43, 288–296. [Google Scholar] [CrossRef]
  21. Lima, J.P.; Lima, R.S.; Silva, A.N.R. Evaluation and selection of alternatives for the promotion of sustainable urban mobility. Procedia Soc. Behav. Sci. 2014, 162, 408–418. [Google Scholar] [CrossRef] [Green Version]
  22. Saisana, M. Weighting methods. In Proceedings of the Seminar on Composite Indicators: From Theory to Practice, Ispra, Italy, 13–14 January 2011. [Google Scholar]
  23. Mancini, M.T. Urban Planning Based on Scenarios of Sustainable Mobility. Master’s Thesis, São Carlos School of Engineering, University of São Paulo, São Paulo, Brazil, 2011. [Google Scholar]
  24. Silva, A.N.R.; Costa, M.S.; Ramos, R.A.R. Development and Application of I_SUM: An Index of Sustainable Urban Mobility. Transportation Research Board Annual Meeting. 2010. Available online: http://citeseerx.ist.psu.edu/viewdoc/download?doi=10.1.1.1008.9281&rep=rep1&type=pdf (accessed on 29 April 2020).
  25. Costa, M.S. An Index of Sustainable Urban Mobility. Ph.D. Thesis, São Carlos School of Engineering, University of São Paulo, São Paulo, Brazil, 2008. [Google Scholar]
  26. Zhou, P.; Ang, B.; Poh, K. A mathematical programming approach to constructing composite indicators. Ecol. Econ. 2007, 62, 291–297. [Google Scholar] [CrossRef]
  27. Burinskienė, M.; Gaučė, K.; Damidavičius, J. Successful sustainable mobility measures selection. In Proceedings of the 10th International Conference “Environmental Engineering”, Vilnius, Lithuania, 27–28 April 2017. [Google Scholar] [CrossRef]
  28. Shiau, T.A.; Liu, J.S. Developing an indicator system for local governments to evaluate transport sustainability strategies. Ecol. Indic. 2013, 34, 361–371. [Google Scholar] [CrossRef]
  29. Karagiannakidis, D.; Sdoukopoulos, A.; Gavanas, N.; Pitsiava-Latinopoulou, M. Sustainable urban mobility indicators for medium-sized cities. In Proceedings of the case of Serres, Greece, 2nd Conference on Sustainable Urban Mobility, Valos, Greece, 5–6 May 2012. [Google Scholar]
  30. Malasek, J. A set of tools for making urban transport more sustainable. Transp. Res. Procedia 2016, 14, 876–885. [Google Scholar] [CrossRef] [Green Version]
  31. Litman, T. Well Measured. Developing Indicators for Sustainable and Liveable Transport Planning. 2016. Available online: http://www.vtpi.org/wellmeas.pdf (accessed on 22 February 2020).
  32. Rupprecht Consult. CH4LLENGE—Addressing Key Challenges of Sustainable Urban Mobility Planning. 2016. Available online: http://www.sump-challenges.eu (accessed on 11 May 2020).
  33. Litman, T. Sustainable Transportation Indicators—A Recommended Research Program for Developing Sustainable Transportation Indicators and Data. In Proceedings of the 88th Annual Meeting of the Transportation Research Board, Washington, DC, USA, 11–15 January 2009. [Google Scholar]
  34. Greco, S.; Matarazzo, B.; Slowiński, R. Rough sets theory for multicriteria decision analysis. Eur. J. Oper. Res. 2001, 129, 1–47. [Google Scholar] [CrossRef]
  35. Kendall, M. Rank Correlation Methods; Published by Griffin: London, UK, 1970. [Google Scholar]
  36. Kendall, M.; Gibbons, J.D. Rank Correlation Methods, 5th ed.; Oxford University Press: Oxford, UK, 1990; 272p. [Google Scholar]
  37. Zavadskas, E.K.; Peldschus, F.; Kaklauskas, A. Multiple Criteria Evaluation of Projects in Construction; Technika: Vilnius, Lithuania, 1994. [Google Scholar]
  38. Zavadskas, E.K.; Vilutiene, T. A multiple criteria evaluation of multi-family apartment block’s maintenance contractors: I—Model for maintenance contractor evaluation and the determination of its selection criteria. Build. Environ. 2006, 41, 621–632. [Google Scholar] [CrossRef]
  39. Jakimavicius, M.; Burinskiene, M.; Gusaroviene, M.; Podviezko, A. Assessing multiple criteria for rapid bus routes in the public transport system in Vilnius. Public Transp. 2016, 8, 365–385. [Google Scholar] [CrossRef]
  40. Parezanovic, T.; Bojkovic, N.; Petrovic, M.; Pejčic-Tarle, S. Evaluation of Sustainable Mobility Measures Using Fuzzy COPRAS Method. J. Sustain. Bus. Manag. Solut. Emerg. Econ. 2016, 21, 53–62. [Google Scholar] [CrossRef]
  41. Hickman, R.; Saxena, S.; Banister, D.; Ashiru, O. Examing transport future with scenario analysis and MCA. Transp. Res. 2012, 46, 560–575. [Google Scholar] [CrossRef]
  42. Podvezko, V.; Sivilevičius, H. The use of AHP and rank correlation methods for determining the significance of the interaction between the elements of a transport system having a strong influence on traffic safety. Transport 2013, 28, 389–403. [Google Scholar] [CrossRef]
  43. Barauskas, A.; Mateckis, K.J.; Palevičius, V.; Antuchevičiene, J. Ranking conceptual locations for a park-and-ride parking lot using EDAS method. Građevinar 2018, 70, 975–983. [Google Scholar] [CrossRef]
  44. Ginevičius, R.; Podvezko, V.; Podviezko, A. Evaluation of Isolated Socio-Economical Processes by a Multi-Criteria Decision Aid Method ESP. In Proceedings of the 7th International Scientific Conference Business and Management’, Vilnius, Lithuania, 10–11 May 2012. [Google Scholar]
  45. Palevičius, V.; Grigonis, V.; Podviezko, A.; Barauskaite, G. Developmental analysis of park-and-ride facilities in Vilnius. Promet Traffic Transp. 2016, 28, 165–178. [Google Scholar] [CrossRef] [Green Version]
  46. Zavadskas, E.K.; Kaklauskas, A. Pastatų Sistemotechninis Įvertinimas; Technika: Vilnius, Lithuania, 1996; 275p. [Google Scholar]
  47. Hwang, C.L.; Yoon, K. Multiple Attribute Decision-Making Methods and Applications; A State of the Art Survey; Springer: Berlin, Germany, 1981. [Google Scholar]
  48. Zavadskas, E.K.; Turskis, Z. A new additive ratio assessment (ARAS) method in multicriteria decision-making. Technol. Econ. Dev. Econ. 2010, 16, 159–172. [Google Scholar] [CrossRef]
  49. Keshavarz Ghorabaee, M.; Zavadskas, E.K.; Olfat, L.; Turskis, Z. Multi-criteria inventory classification using a new method of Evaluation based on Distance from Average Solution (EDAS). Informatica 2015, 26, 435–451. [Google Scholar] [CrossRef]
  50. Borda, J.C. Memoire sur les Elections au Scrutiny, Histoire de l’Academie Royale des Sciences; Paris, France, 1781; Available online: http://asklepios.chez.com/XIX/borda.htm (accessed on 7 May 2020).
  51. McLean, I. The Borda and Condorcet principles: Three medieval applications. Soc. Choice Welf. 1990, 2, 99–108. [Google Scholar] [CrossRef]
  52. Erlandson, R. System Evaluation Methodologies: Combined Multi-dimensional Scaling and Ordering Techniques. IEEE Trans. Syst. Man Cybern. 1978, 6, 421–432. [Google Scholar] [CrossRef]
  53. Fishburn, P. A Comparative Analyses of Group Decision Methods. Behav. Sci. 1971, 16, 538–544. [Google Scholar] [CrossRef]
Figure 1. City assessment applying MCDM methods.
Sustainability 12 06067 g001
Figure 2. The process of selecting mobility measures [3].
Sustainability 12 06067 g002
Figure 3. The categories of cities according to population and functional purpose.
Sustainability 12 06067 g003
Table 1. The parameters and significance of the expert survey of assessment indicators.
CodeMobility MeasureWeight (ω)RankCodeMobility MeasureWeight (ω)Rank
T1Promotion of public transport0.18131P4-1Awareness Campaign, Events and Promotional Activities0.25611
T2Non-motor vehicle integration0.13894P4-2Car parking management0.15444
T3Traffic safety and transport security0.16232P4-3Parking Charges0.24212
T4Improvement to traffic organization and mobility management0.14773P4-4Car Sharing0.13685
T5City logistics0.08637P4-5Park and Ride0.21053
T6Integration of people with special needs0.11555P5-1A driving ban for lorries 0.17894
T7Promotion of alternative fuels and clean vehicles0.07168P5-2Urban Consolidation Centers0.18953
T8Assessment of demand for Intelligent transport systems0.09656P5-3Access restrictions0.33681
P1-1Conventional Timetable0.20801P5-4New road construction0.29472
P1-2Public transport priority lanes0.18803P6-1Mobility infrastructure for people with disabilities0.32111
P1-3Public transport tickets and fare levels0.09526P6-2Accessibility of the main transport points0.23163
P1-4Rapid public transport transit0.18304P6-3Shared spaces0.17374
P1-5Public transport Terminals and Interchanges/Stops0.12035P6-4Accessible public transport0.27372
P1-6Public transport network0.20552P7-1Alternative fuel public transport 0.30532
P2-1Pedestrian routes, networks 0.25962P7-2Alternative fuel supply infrastructure0.18424
P2-2Cycle Networks0.26321P7-3Low-emission zones0.31581
P2-3Cycle Parking and Storage0.14744P7-4Promotion of alternative fuel vehicles0.19473
P2-4Bike Sharing0.13335P8-1Intelligent traffic light system 0.23512
P2-5Lighting the cycle and pedestrian network0.19653P8-2Integrated Ticketing0.19653
P3-1Traffic cameras 0.15094P8-3Bus priority intersections0.25261
P3-2Safety intersections0.24562P8-4Real Time Passenger Information0.15445
P3-3Safety pedestrian and cycling crossing facilities0.25961P8-5Congestion charging0.16144
P3-4Road Maintenance0.12285
P3-5Low speed zones0.22113
Table 2. Assessment results applying MCDM methods.
City MCDM MethodsSignificance Average ( ω ~ )Location Considering SignificanceLocation Considering AverageLocation as Stated in BORDALocation as Stated in Copeland
COPRASTOPSISARASEDAS
WeightRankWeightRankWeightRankWeightRank
T1—Promotion of public transport
Vilnius0.218820.624220.158820.765520.44182222
Kaunas0.171630.472330.128030.523330.32383333
Klaipėda0.256510.732210.185710.965410.53501111
Šiauliai0.077250.080650.060150.001650.05495555
Panevėžys0.093140.140340.071740.090540.09894444
T2—Non-motor vehicle integration
Vilnius0.287310.523910.188510.776710.44411111
Kaunas0.154730.299730.102840.269430.20673333
Klaipėda0.151740.284140.103430.226940.19154444
Šiauliai0.125650.261250.088450.114850.14755555
Panevėžys0.280820.521020.184120.728520.42862222
T3—Traffic safety and transport security
Vilnius0.159330.187630.126230.178930.16303333
Kaunas0.203020.356020.154020.330720.26092222
Klaipėda0.131750.146340.106450.019850.10115555
Šiauliai0.136340.144550.106640.079040.11664444
Panevėžys0.369710.663410.228910.856610.52971111
T4—Improvement to traffic organization and mobility management
Vilnius0.287510.565320.178020.823610.463611-21-21-2
Kaunas0.122650.167050.066950.026930.09595555
Klaipėda0.162940.338840.120440.250240.21814444
Šiauliai0.170630.436330.147730.236950.24793333
Panevėžys0.256320.597310.198810.677420.432521-21-21-2
T5—City logistics
Vilnius0.447450.125750.035450.00050.05215555
Kaunas0.222620.553820.142120.487420.35152222
Klaipėda0.109230.279730.077530.235630.17553333
Šiauliai0.050740.140340.037940.014340.06084444
Panevėžys0.380710.659710.227911.000010.56711111
T6—Integration of people with special needs
Vilnius0.151940.455940.120940.266640.24884444
Kaunas0.142550.278750.114450.066550.15055555
Klaipėda0.155030.467130.123630.319630.26633333
Šiauliai0.167520.528320.133720.525820.33882222
Panevėžys0.209410.985910.166511.000010.59051111
T7—Promotion of alternative fuels and clean vehicles
Vilnius0.210710.632410.150210.919510.47821111
Kaunas0.156620.521820.114120.522620.32882222
Klaipėda0.104340.270050.075440.151840.15044444
Šiauliai0.114130.365430.083030.203730.19163333
Panevėžys0.098550.274640.072150.072250.12945555
T8—Assessment of demand for intelligent transport systems
Vilnius0.246210.783710.164911.000010.54871111
Kaunas0.091430.346530.061730.319330.20473333
Klaipėda0.177420.487720.119220.659020.36082222
Šiauliai0.041440.215040.027740.067340.08794444
Panevėžys0.029650.146950.019850.000050.04915555
Table 3. The overall assessment of SUM pursuant to the ranks of all thematic areas.
CityT1 RankT2 RankT3 RankT4 RankT5 RankT6 RankT7 RankT8 RankRank SumFinal Rank
Vilnius21315411181
Kaunas33252523253
Klaipėda14543342264
Šiauliai55434234305
Panevėžys42121155212
Table 4. The overall assessment of SUM pursuant to the weights of all thematic areas.
City COPRASTOPSISARASEDASSignificance Average ( ω ~ )Location Considering AverageLocation as Stated in BordaLocation as Stated in Copeland
WeightRankWeightRankWeightRankWeightRank
Vilnius0.245610.529720.183610.733320.4231222
Kaunas0.185740.415940.138940.329840.2676444
Klaipėda0.196830.465130.152330.368330.2956333
Šiauliai0.129550.204350.107450.014550.1139555
Panevėžys0.242520.560910.178620.771310.4383111

