1. Introduction
Urban heat island (UHI) is a well-acknowledged phenomenon strongly affecting cities’ thermal-energy performance and citizens’ wellbeing. It consists of higher temperatures in dense urban environments with respect to the suburban and rural areas caused by anthropogenic heat, reduced heat losses, and increased solar radiation absorption [
1]. Therefore, the resulting positive thermal balance of cities implies increased building cooling energy demand and consumption. On the other hand, this phenomenon has a further negative impact on peak energy demand and buildings’ air conditioning systems’ efficiency while considerably worsening building cooling performance [
2]. As a result, microclimate mitigation strategies have been studied to tackle the effect of climate change related phenomena [
3]. Among these technologies, those widely implemented are urban greenery, cool materials [
4], and water-based evaporative systems [
5]. These strategies can demonstrably improve the outdoor microclimate conditions in urban areas towards more livable cities and, consequently, help reduce buildings’ cooling energy consumption [
6].
Accordingly, these strategies should be taken into account when designing net zero energy (NZE) settlements [
7] and positive energy districts (PEDs) [
8] and communities [
9]. Compared to net/near zero energy buildings (NZEBs), which are currently being worked towards with the goal of building energy efficiency in Europe [
10], the enlargement of the scale of NZE and PE districts empowers the enhancement of energy efficiency and microclimate mitigation solutions’ implementation in common areas and facilities, such as pavements, roofs, and gardens [
11]. Therefore, on the one hand, energy sharing and management can be optimized within the energy community due to improved flexibility. On the other hand, the scale shift can take advantage of the implementation of green and high-reflectance infrastructures in inter-building spaces [
12]. A few studies highlighted the potential of district scale design in terms of energy and environmental benefits. Ascione et al. [
13] applied an integrated urban planning design approach to a zero-energy settlement in Greece showing the significant energy and sustainability improvement achievable for the NZEBs in this settlement. Kilkiş [
14] evaluated the performance of a new model for NZE districts in Sweden in terms of savings in per capita values. Results demonstrated the achievable benefits, up to 6.1 MWh of exergy consumption and 4.2 tons of CO
2 emission savings. Focusing on a solar mixed-use community, Hachem-Vermette et al. [
9] pointed out that coupling thermal collectors with seasonal storage can lead from high-energy performance to net positive energy districts. On the other hand, the role of outdoor microclimate mitigation strategies in reducing the energy demand of buildings within a NZE settlement was shown in [
15]. Mitigated local boundary conditions could involve up to 10% cooling energy need reduction in an Italian case study. Therefore, these strategies can be considered similar to the more traditional energy efficiency solutions at early design stages for NZEBs in net zero and positive energy settlements.
As previously mentioned, the mitigation effect of local conditions associated with settlement scale solutions is able to act on the efficiency of the buildings’ HVAC (heating, ventilation, and air conditioning) systems. The mitigation of boundary conditions involves less severe working conditions for the HVAC systems, thus producing an extra contribution in terms of active energy efficiency potential, such as, for instance, in the case of active cool roof effects [
16]. In particular, air conditioning unit efficiency significantly varies with varying inlet and outlet thermal working conditions [
17]. Therefore, the dynamic behavior of different types of systems was highlighted in existing studies [
18]. Chaiyat [
19] analyzed the variation of air conditioning efficiency in the climate context of Thailand with various configurations by using a thermal performance curve. Priarone et al. [
20] used the curve fit model to estimate the coefficient of performance (COP) and the energy efficiency ratio (EER) of a heat pump installed in an NZEB in Italy for different temperature working conditions. They demonstrated the suitability of this model to accurately represent the real system behavior. However, to the best of the authors’ knowledge, the literature lacks analysis of the variation of air conditioning systems’ efficiency curve due to the outdoor microclimate improvement associated with the previously mentioned mitigation strategies at the settlement scale.
This work exploits building energy dynamic simulation to fill this gap through the evaluation of NZEB energy demand reduction in summer and the further increase of the operational performance of the HVAC system associated with the implementation of outdoor microclimate mitigation solutions in a NZE settlement. The study is carried out within the framework of the ongoing Horizon 2020 ZERO-PLUS project, which has the goal of designing a market-ready, innovative, comprehensive, and cost-effective system for NZE residential settlements in Europe [
21] to demonstrate their multidimensional sustainability. Building upon previous contributions [
15,
22], first, tailored weather files that take into account the potential outdoor microclimate mitigation were generated to be used as input boundary conditions in dynamic simulation. The files were developed considering the evidence of other environmental mitigation studies [
23]. Moreover, the mathematical model of the direct expansion cooling coil of a heat pump was implemented to simulate the performance curve as a function of air temperatures at the evaporator and the condenser side. Therefore, two scenarios were investigated for the outdoor environmental boundary conditions: (i) a reference unmitigated scenario and (ii) a mitigated scenario, which considers the impact of the implementation of microclimate mitigation technologies in the inter-building area of the settlement, such as greenery, cool materials, and water-based evaporative technologies. In addition, other two scenarios enlarging the area of application of mitigation strategies at a district scale were assessed. Building energy performance improvement was evaluated by combining the passive effect on the variation of the energy demand and the active effect on the EER of the direct expansion cooling system, since they occur at the same peak conditions.
2. Methods
The method presented in this work involved microclimate simulation and dynamic simulation of a building’s thermal energy in sequence, as detailed in the following subsections. Weather analysis and site-specific investigation was combined with microclimate computational fluid dynamics (CFD) modelling. Such modelling output, therefore, represents the building’s settlement-specific boundary conditions for the building-scale numerical assessment.
2.1. Weather Files and Influence of Microclimate Mitigation at Inter-Building Scale
The effect of implementing microclimate mitigation strategies, i.e., increase of (i) vegetated areas and (ii) solar reflectance capability of built surfaces, on settlements’ outdoor environmental conditions at the inter-building and district level was analyzed in previous works [
15,
24]. The improved microclimate parameters were quantified through ENVI-met software (ENVI_MET GmbH, Essen, Germany) [
25]. Therefore, starting from the hourly values obtained from these microclimate simulations, weather data sets were generated using a tailored analytic code, and then the Meteonorm tool (Meteotest AG, Bern, Switzerland) [
26] was used as input with weather files for dynamic simulation of a building’s thermal energy. In detail, ENVI-met simulation outputs in terms of direct and diffuse solar radiation, dry-bulb air temperature, and wind speed for one day in winter and one day in summer were used. The combination of the two mitigation strategies providing the maximum effect on the outdoor microclimate conditions were considered. This procedure, used for the generation of the weather files and presented in detail in [
15,
24], is based on the linear and sinusoidal interpolation of the ratio between mitigated and reference unmitigated parameters on a daily and annual basis.
In this study, two of these weather files representing the reference unmitigated outdoor boundary conditions and maximum potential mitigated outdoor boundary conditions were considered. Moreover, the mitigated weather file was further improved to take into account the additional implementation of water pond evaporative technologies. Thus, the three main existing microclimate mitigation strategies are involved. The initial weather data set [
15,
24] was improved and double-checked through the Elements tool of Big Ladder (Denver, Colorado) [
27] by applying an average temperature reduction of 2 K as inferred from the acknowledged study by Santamouris et al. [
23]. The reference and the mitigated weather files were used as input outdoor environmental conditions for the thermal-energy performance assessment of a case study residential NZEB.
2.2. Building Modeling
The building type selected as case study for this analysis is a single-family detached house. A simplified standard building was theoretically modeled for the location of Granarolo dell‘Emilia, Bologna, Italy, where the pilot Italian settlement of the ZERO-PLUS project [
21] is actually located. The building has a two-story rectangular shape with an attic, a sloped roof, and a gross conditioned area of about 200 m
2, in order to be representative of new Italian single-family house constructions.
According to the purpose of this work, the building was modeled within a NZE settlement through the EnergyPlus simulation engine [
28]. Therefore, it meets the requirements of the current Italian regulation for new NZEBs [
29] in terms of thermal-energy performance. Since the regulation also includes requirements for the HVAC system in its definition of NZEB, an iterative procedure was carried out to meet these primary energy consumption requirements for the model. This procedure started from the reference building and its envelope thermal properties to set the characteristics the HVAC system. The building envelope is composed of masonry with wood fiber insulation, characterized by high density for the south-oriented wall and medium density for the other walls. The ground floor and the roof are also thermally insulated. The sloped roof presents high solar reflectance capability and thermal emissivity equal to 0.83 and 0.9, respectively, according to the project indications [
21] and the requirements of the building regulation [
29], thanks to the implementation of cool material as the external coating layer. The windows are triple-glazed with an argon filling, and blinds are considered as shading systems to ensure protection from solar radiation gains during summer. The whole building model and the floor plans are depicted in
Figure 1.
Furthermore, the definition of internal heat gains is essential for HVAC system operation and end-use energy performance, especially during the hot season [
30]. In line with the aim of this study, occupancy profiles were modeled according to the ASHRAE (American Society of Heating, Refrigerating and Air-Conditioning Engineers) standard for residential buildings [
31,
32]. A family of three persons is considered to live in the house, and their metabolic task is defined based on a low–medium activity level. Internal heat gains due to the electrical appliances and lighting, which are the most significant sources, are defined in accordance. Internal load contribution is distinguished as sensible and latent heat, the latter being considered only where relevant. For calculation purposes, the building floors were modeled as a single conditioned thermal zone, while the attic level is an unconditioned room. In line with the goal of the study, only the cooling energy consumption was calculated, after the proper sizing of the air conditioning system at the design supply temperature when setting comfort conditions for the indoor thermal zone equal to around 26 °C for air temperature and 50% for relative humidity [
33].
2.3. HVAC System Modeling
Regarding the HVAC system, a heat pump with a direct expansion (DX) cooling coil and a gas heating coil was selected. Since the operation of the air conditioning system is one of the main focuses of this work, particular attention was paid to its modeling. The system model consists of an air loop with (i) a variable volume fan set to blow through configuration, (ii) a DX cooling coil with a single speed, and (iii) a gas heating coil. Moreover, a dedicated outdoor air system (DOAS) assists its operation and is responsible for the mechanical ventilation needed to ensure the required indoor air quality. A scheme of the considered HVAC system is shown in
Figure 2. A discontinuous mode (on–off) is set for the operation of the HVAC system, since it serves a residential building. In detail, the system operation is expected from morning to evening, with an air supply temperature 10 K lower than the indoor set-point temperature, i.e., equal to 16 °C.
As previously mentioned, the yearly system sizing was carried out before the simulation within both the external weather conditions considered for the calculation, i.e., the reference and the mitigated scenarios, and according to the design conditions for the supply air into the thermal zone. After the system sizing and the related setting of heating and cooling coils’ thermal power, the building thermal-energy performance assessment focuses on summer operation, namely when the effect of the selected microclimate mitigation strategies is mostly perceived.
As of the air conditioning system’s numerical modeling, the generalized least squares method was used for curve fitting to represent the direct expansion cooling coil. Performance curves were developed based on the data declared by the manufacturer. According to [
34], the model is a black-box model, since it does not represent the physical behavior of the system components. Starting from the manufacturer’s performance data, the performance curves were obtained by varying the indoor wet-bulb air temperature at the evaporator and the outdoor dry-bulb air temperature at the condenser. Some of the performance data from the manufacturer of the heat pump considered in this study are summarized in
Table 1. In particular, the total cooling capacity and the energy input ratio (EIR) are representative of the performance of the system. Therefore, the total cooling capacity and the EIR modifier curves, which are functions of temperature, were developed [
35]. These quadratic curves depend on two independent variables: the dry-bulb temperature of inlet air in the air-cooled condenser coil and the wet-bulb temperature of the inlet air in the cooling coil. Accordingly, when varying the outdoor boundary conditions of operation (weather file), the inlet air dry-bulb temperature in the condenser varies along with the system performance. The modified curves’ output was then multiplied by the rated total cooling capacity and the rated EIR [
36] to provide the total cooling capacity and the EIR, respectively, at the specific inlet air temperatures for the operation of the DX cooling coil unit.
Equations (1) and (2) represent the biquadratic curves for the total cooling capacity (
Ccool,tot) and the EIR, respectively:
where
X and
Y are the two independent variables (temperatures), and
are the coefficients of the curves to be determined based on the specific system operation. The parameters of
Ccool,tot and the EIR modifier curves are reported in
Table 2 and
Table 3, respectively. First, the generated curves were validated against the rated values to verify that the curve value at the rated condition established by AHRI [
36] was 1.0. Therefore, the goodness of the curves was evaluated by the calculation of the statistical parameter R
2. This parameter provides the ratio between the sum of the squared deviations of the values of the curve fit from the mean and the sum of the squared deviations of the values of the manufacturer’s data from the mean. The closer the R
2 values are to 1, the better the curve fit. The values of R
2 obtained for the two curves are reported in
Table 2 and
Table 3.
2.4. Settlement Scale Analysis
After the evaluation of the passive influence of microclimate mitigation on building energy demand and the active effect on the air conditioning system’s efficiency of getting air from microclimate affected fluids, the total potential performance improvement was assessed. Both building energy demand reduction and a DX cooling coil operational efficiency increase were expected to take place independently and at the peak outdoor boundary conditions. Therefore, the passive and active microclimate mitigation energy savings were calculated when quantifying the building energy efficiency potential.
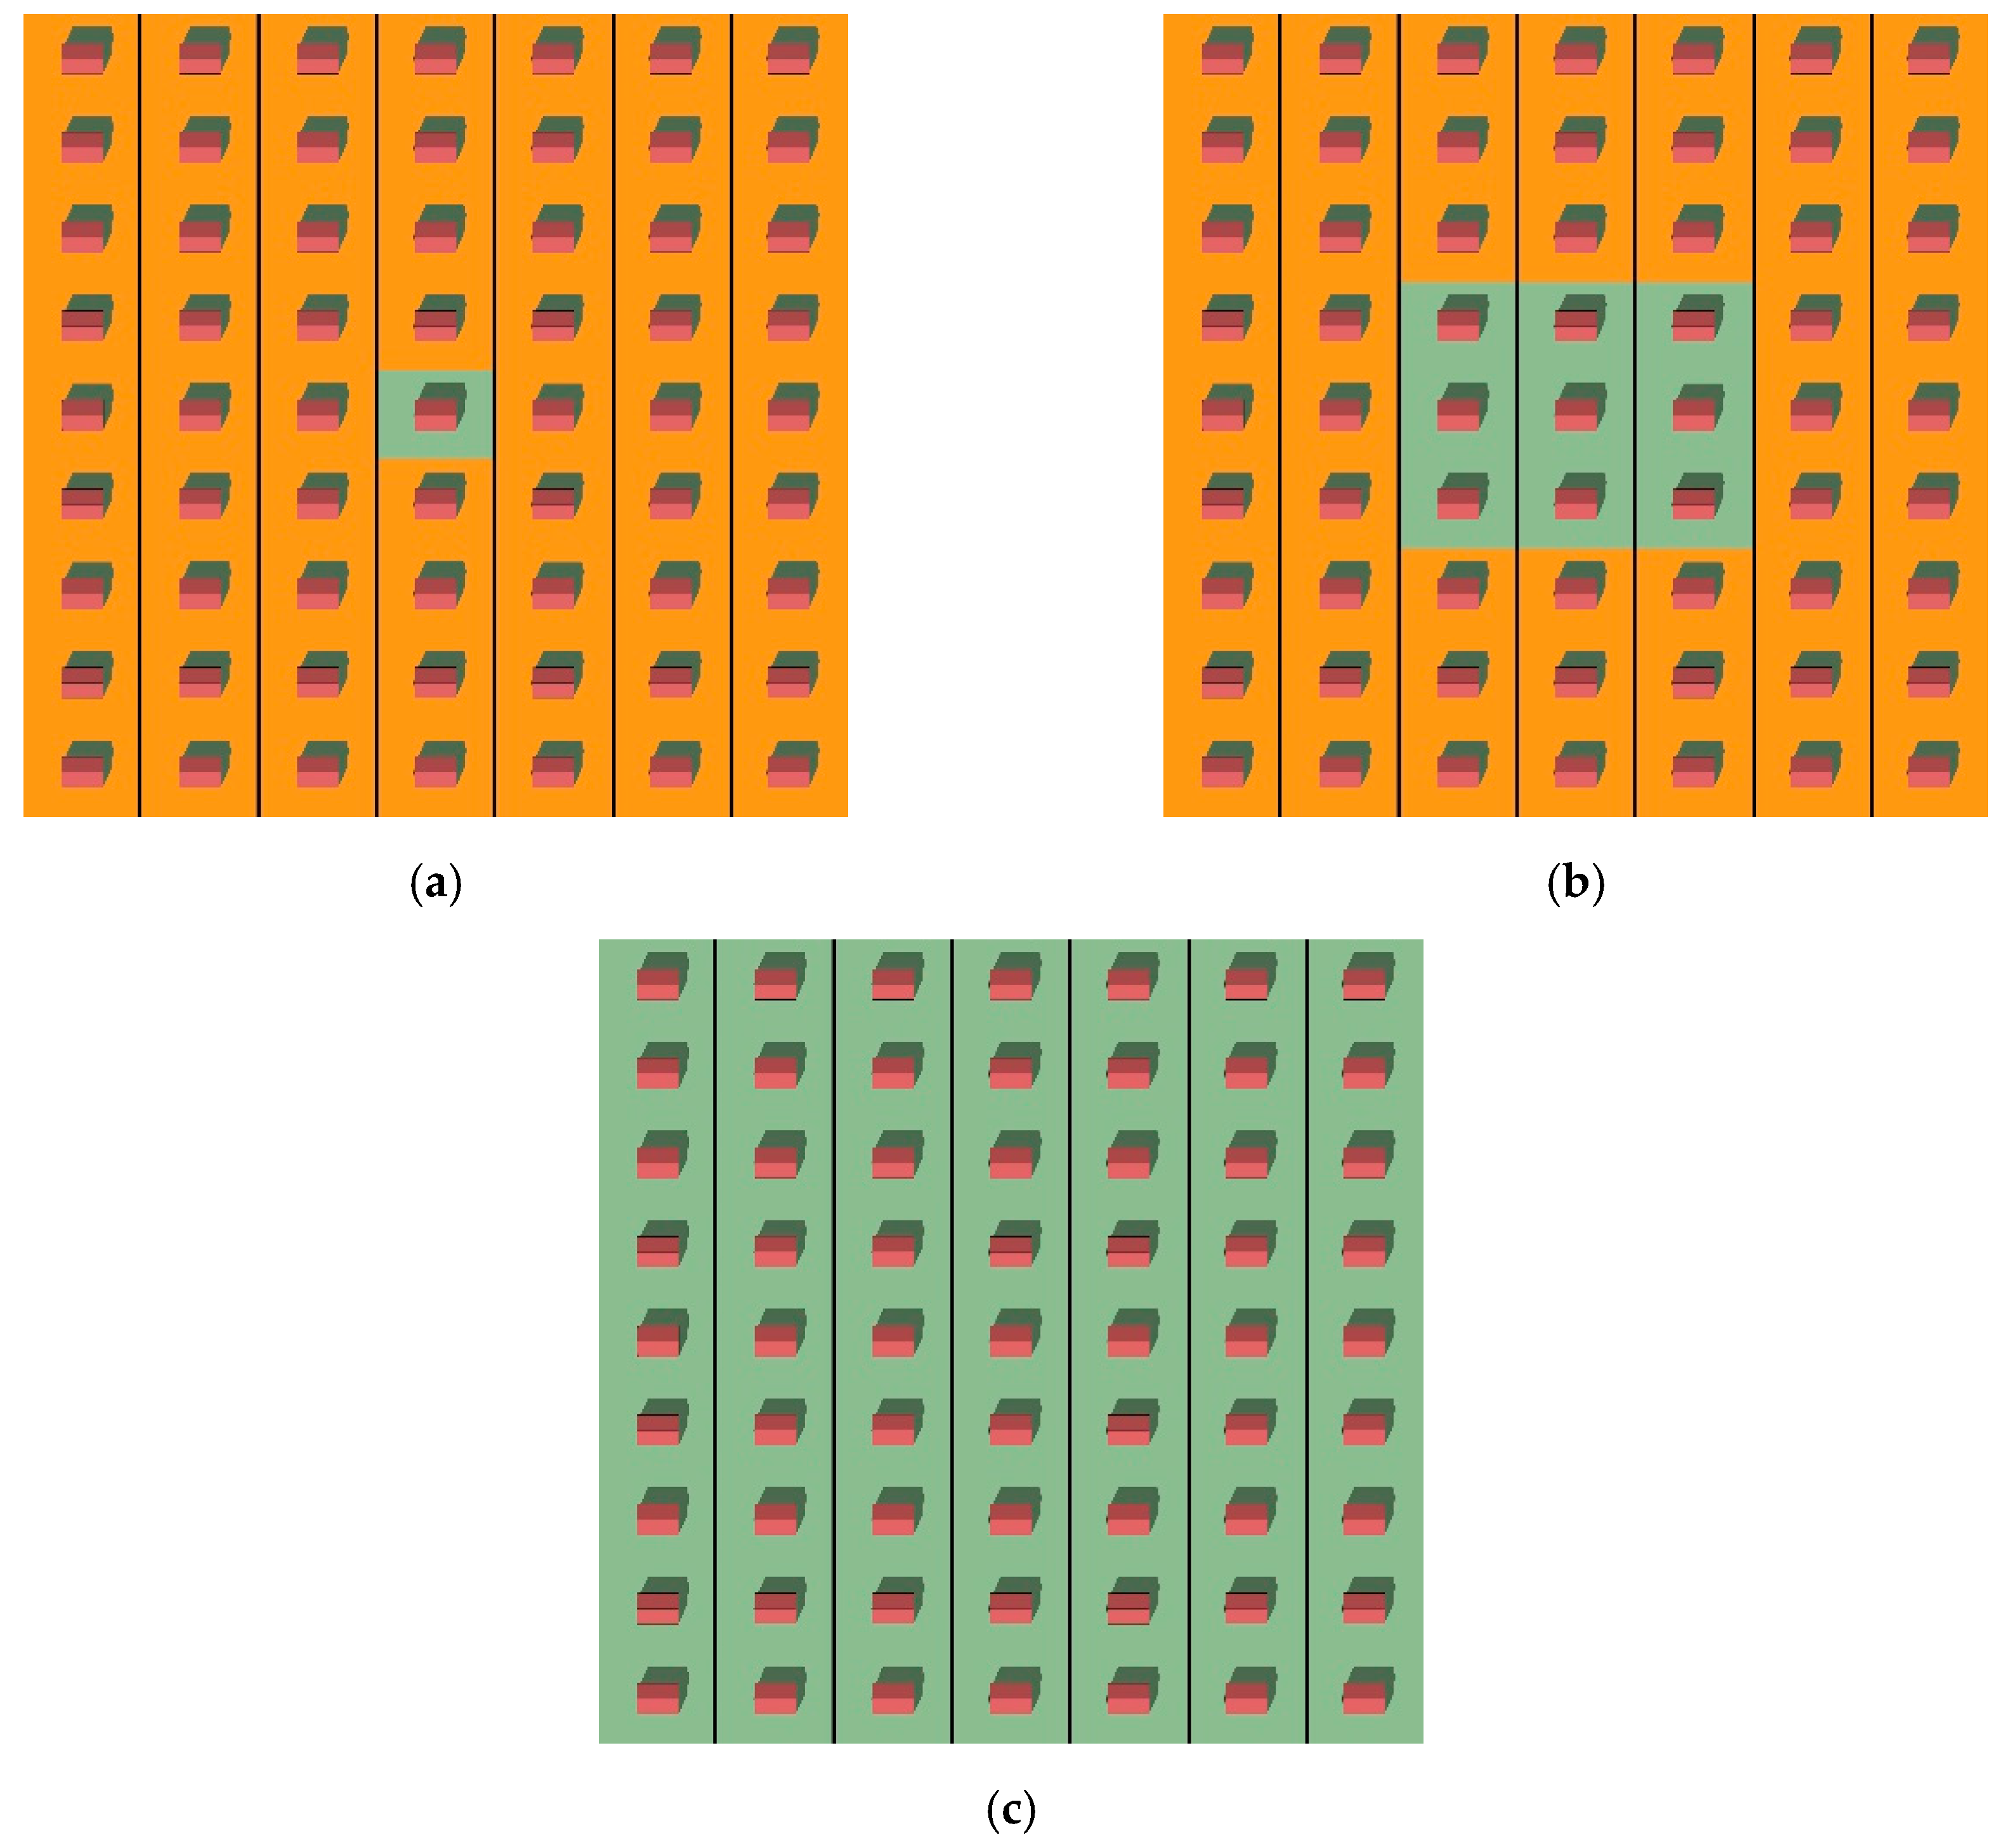
In addition, the influence of the enlargement of the scale of application of mitigation strategies was investigated when shifting from the inter-building to the district level implementation. Accordingly, the same three mitigation strategies, i.e., cool materials, greenery, and water-based technologies, as described in
Section 2.1, were implemented in a wider outdoor area. In detail, the microclimate mitigation strategies were applied firstly in the outdoor area of a single ring of buildings around the case study building, in addition to the area of the case study building, which is located at the center of the model area (mitigated_2rings scenario). Thereafter, the mitigated area was enlarged to model a settlement area with four rings of buildings around the case study building (mitigated_5rings scenario). The settlement with one additional ring consisted of nine buildings, while the one with four additional rings contained 63 buildings [
24], including the case study building, as depicted in
Figure 3. These additional weather files, to be used again as input outdoor boundary conditions for dynamic simulation of the buildings’ thermal energy, were firstly developed in a previous study [
24] and then further improved by using the same exact procedure as summarized in
Section 2.1 and described in detail in [
15,
24]. Among the weather files developed in [
24], only the district scenarios with two rings (i.e., one ring of mitigated buildings around the case study building) and five rings (i.e., four rings of mitigated buildings around the case study building) were considered.
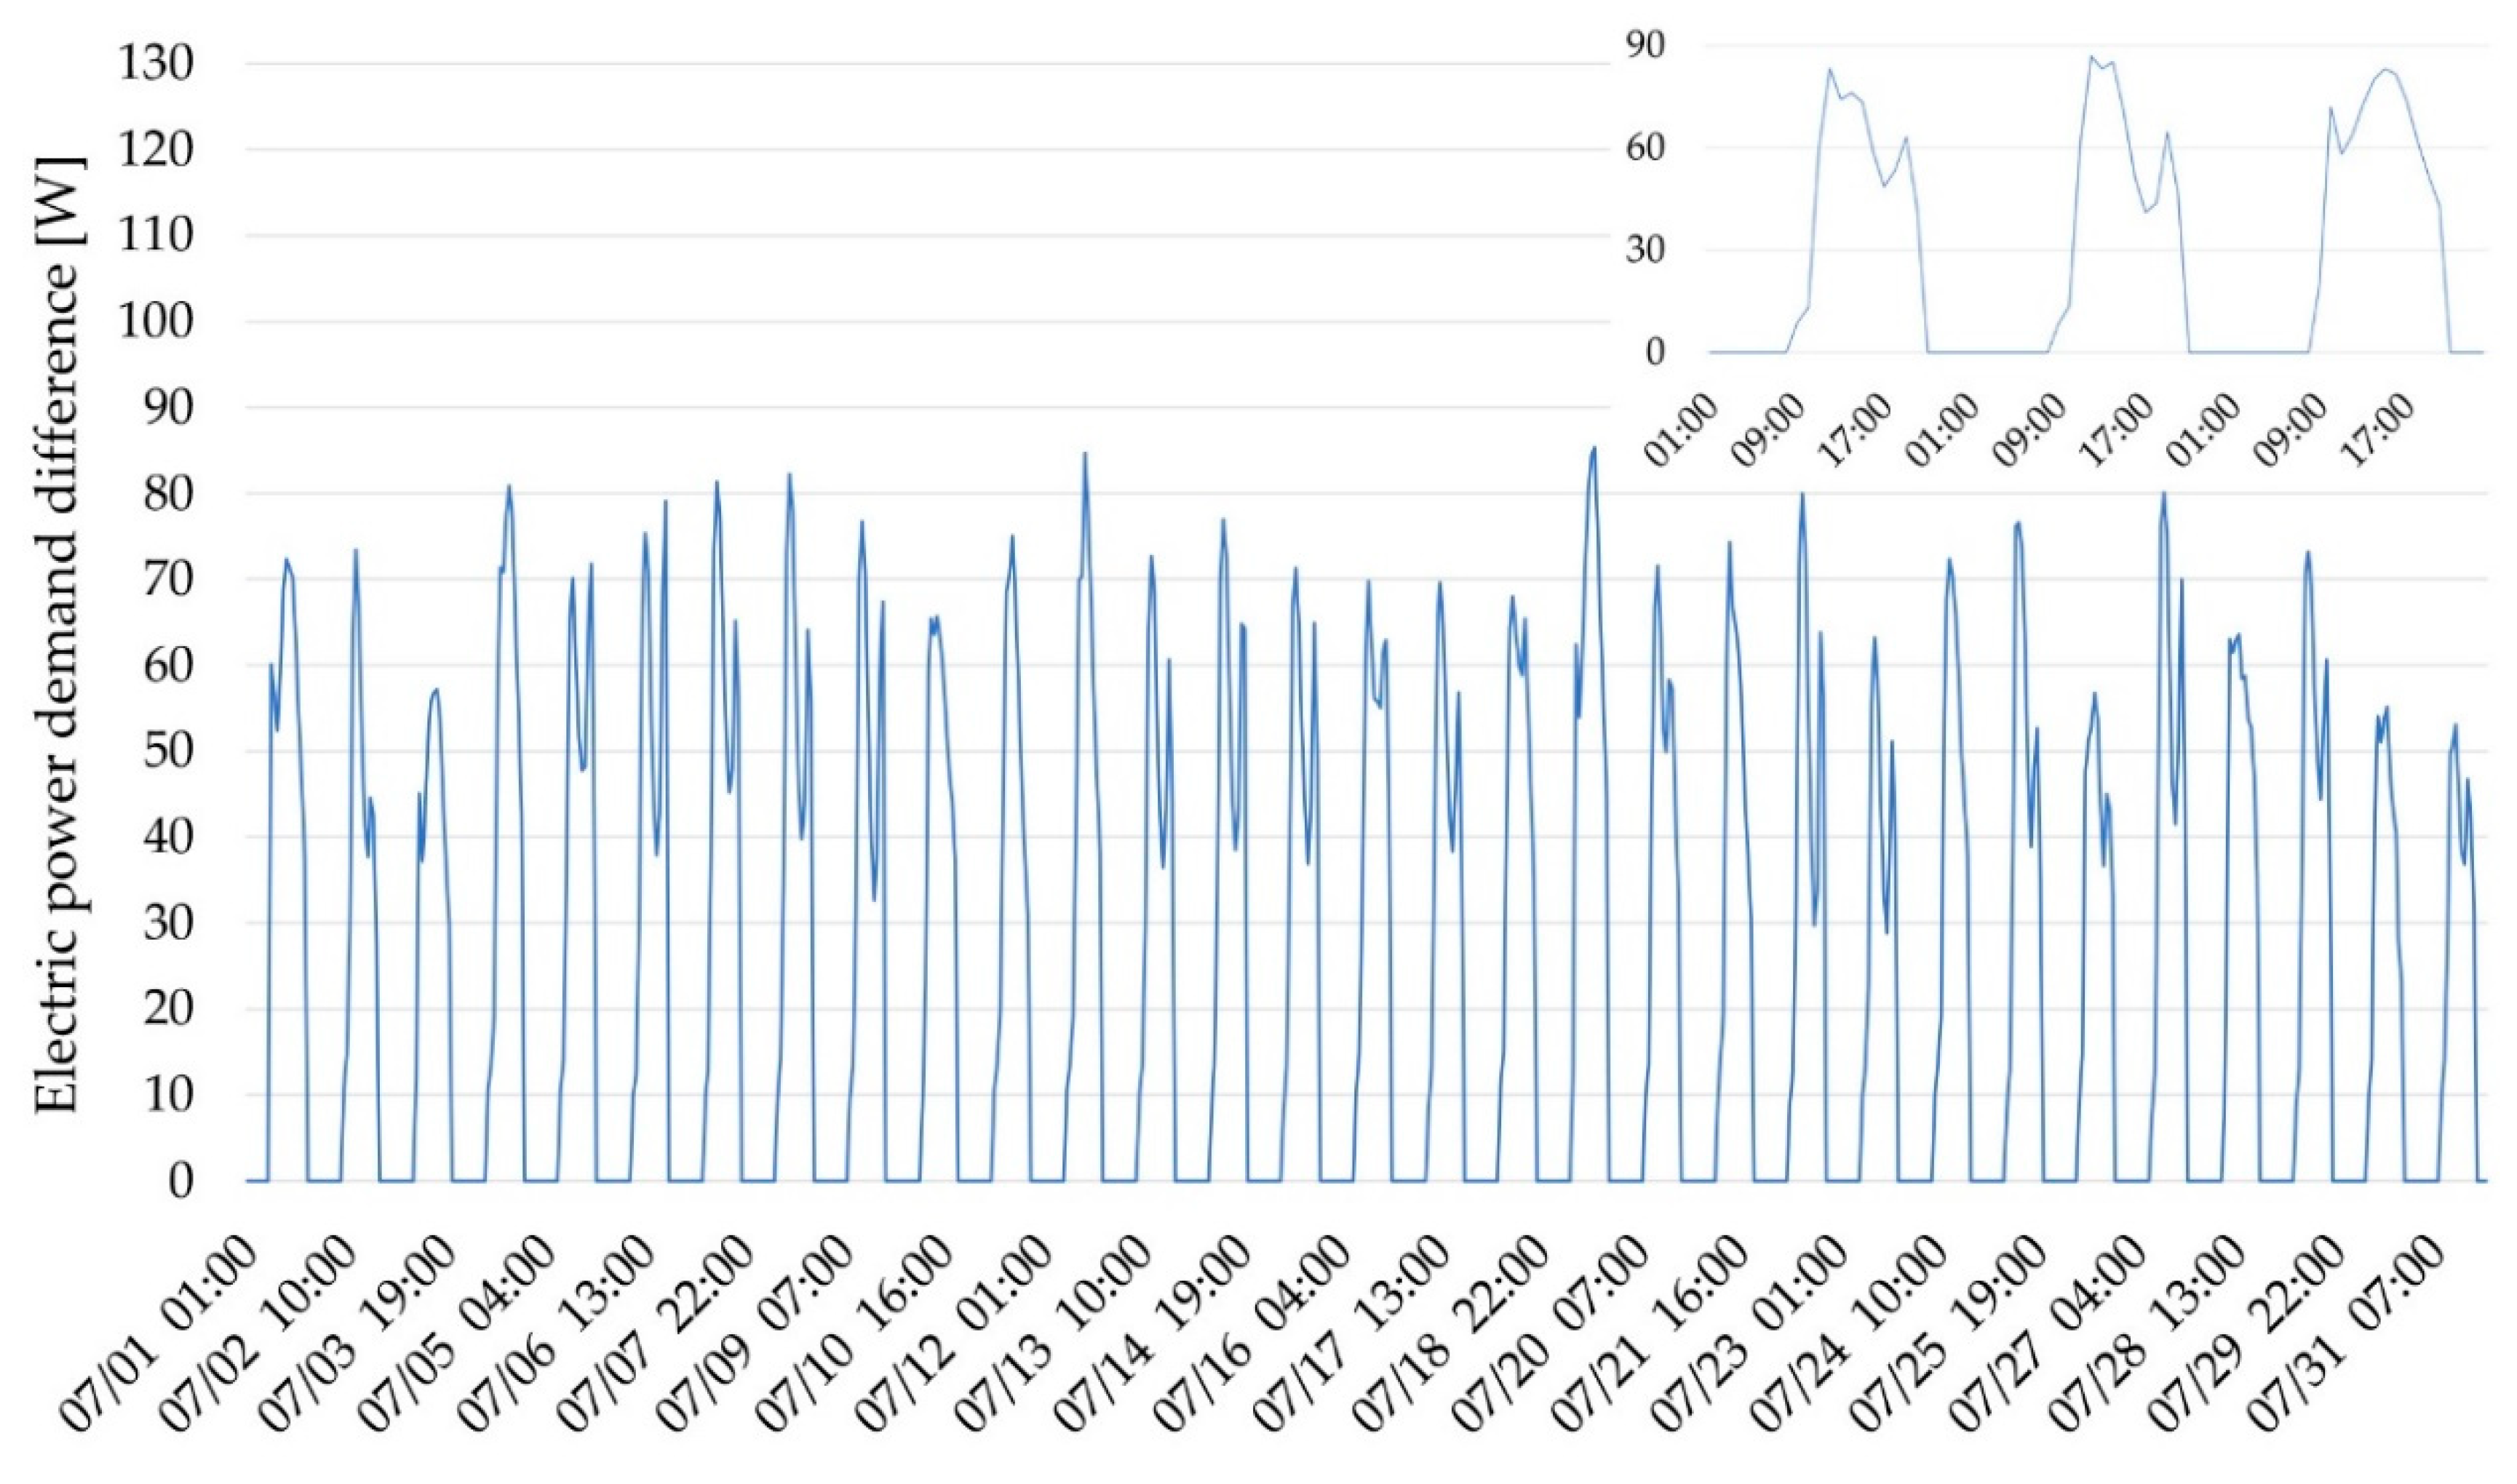
4. Discussion
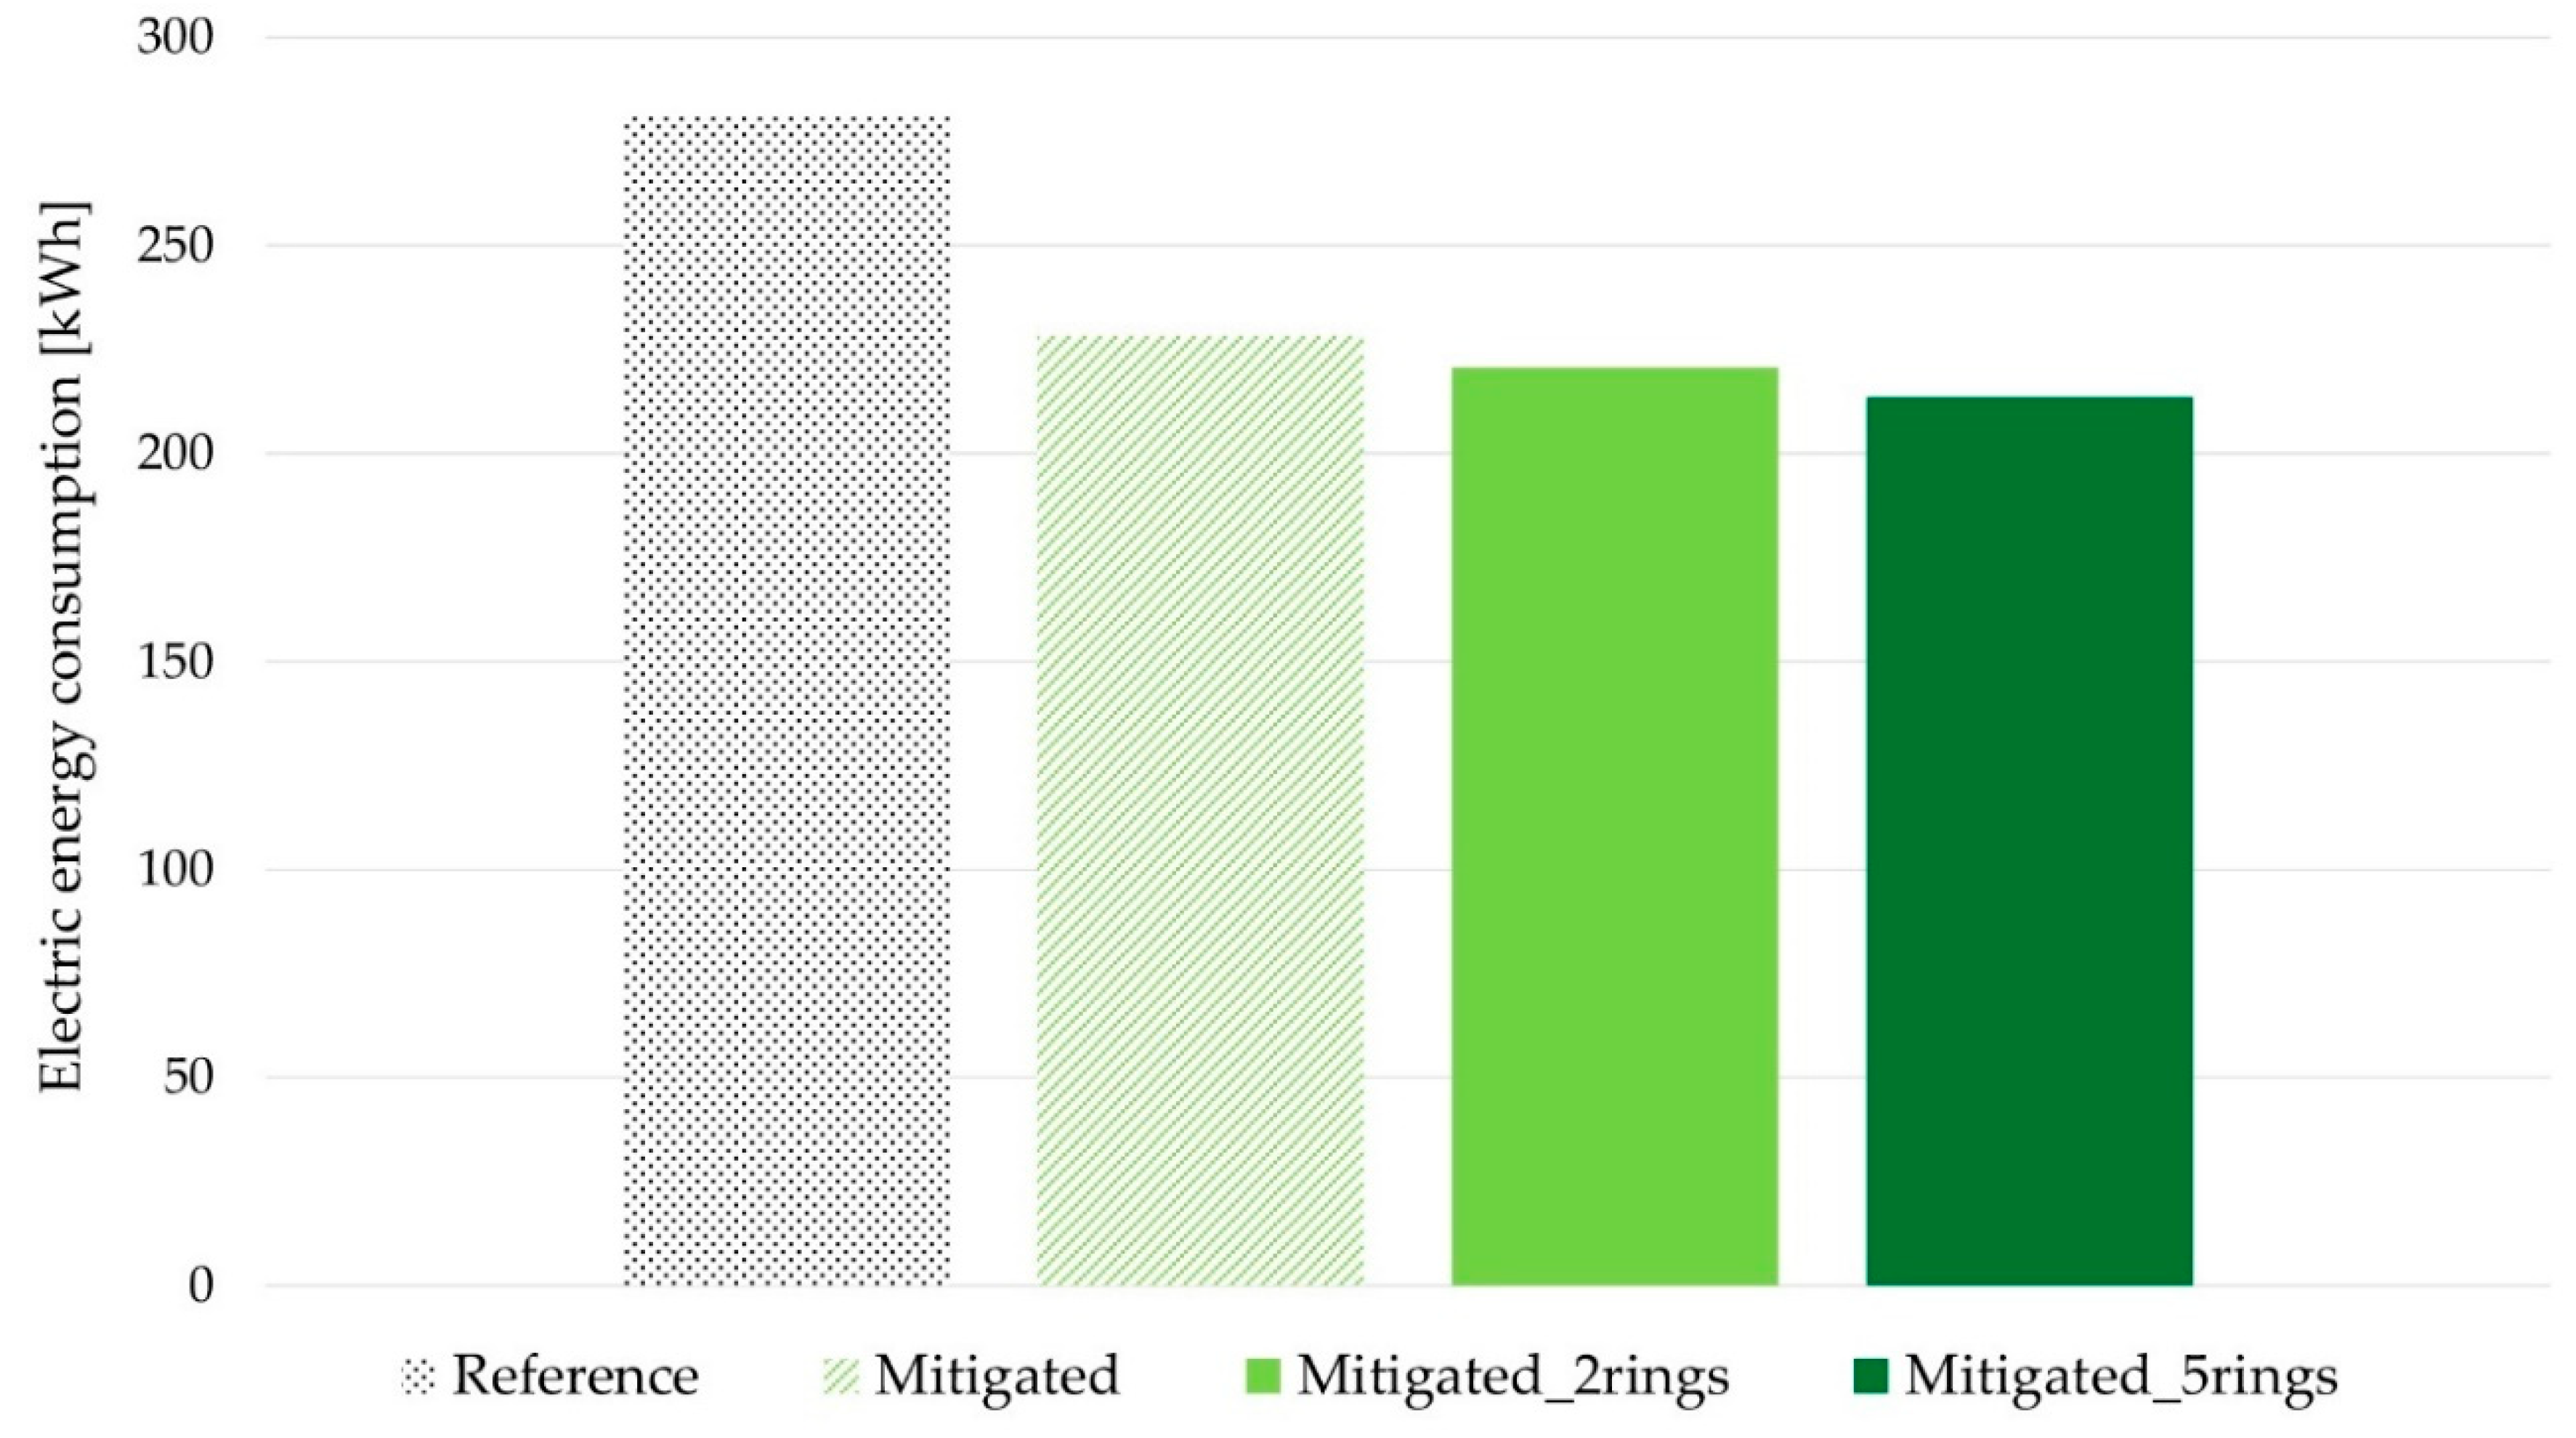
As previously demonstrated, the mitigated outdoor boundary conditions involve the reduction of outdoor air temperature in the hot season, especially in peak days and hours, with a consequent reduction of building energy demand and increase of the EER of the air conditioning system. The combination of these passive and active building energy efficiency effects results in a lower cooling energy consumption in the mitigated conditions compared to the reference conditions as depicted in
Figure 6.
The graph summarizes the electric energy consumption for cooling in the different scenarios in the period of analysis, i.e., from June to August. The total cooling energy saving for the case study building in on/off operation mode in the mitigated scenario is equal to 18.7%, corresponding to an energy consumption decrease equal to 52.6 kWh, which represents the active and passive impact of microclimate mitigation strategies. Furthermore, when enlarging the application of the mitigation strategies from the inter-building to the settlement level, the whole energy benefit is further enhanced. Although the higher cooling energy consumption difference is observed between the reference and the mitigated scenario, a further improvement is achievable thanks to the scale shift. The energy saving in the mitigated_2rings and mitigated_5rings scenarios reaches up to 21.4% (60.1 kWh) and 24% (67.3 kWh), respectively, compared to the reference unmitigated case, meaning up to 6.4% compared to the mitigation at the inter-building scale.
These findings are a confirmation of the results in terms of outdoor microclimate mitigation and passive cooling effect increase when increasing the scale of application of the considered strategies obtained in [
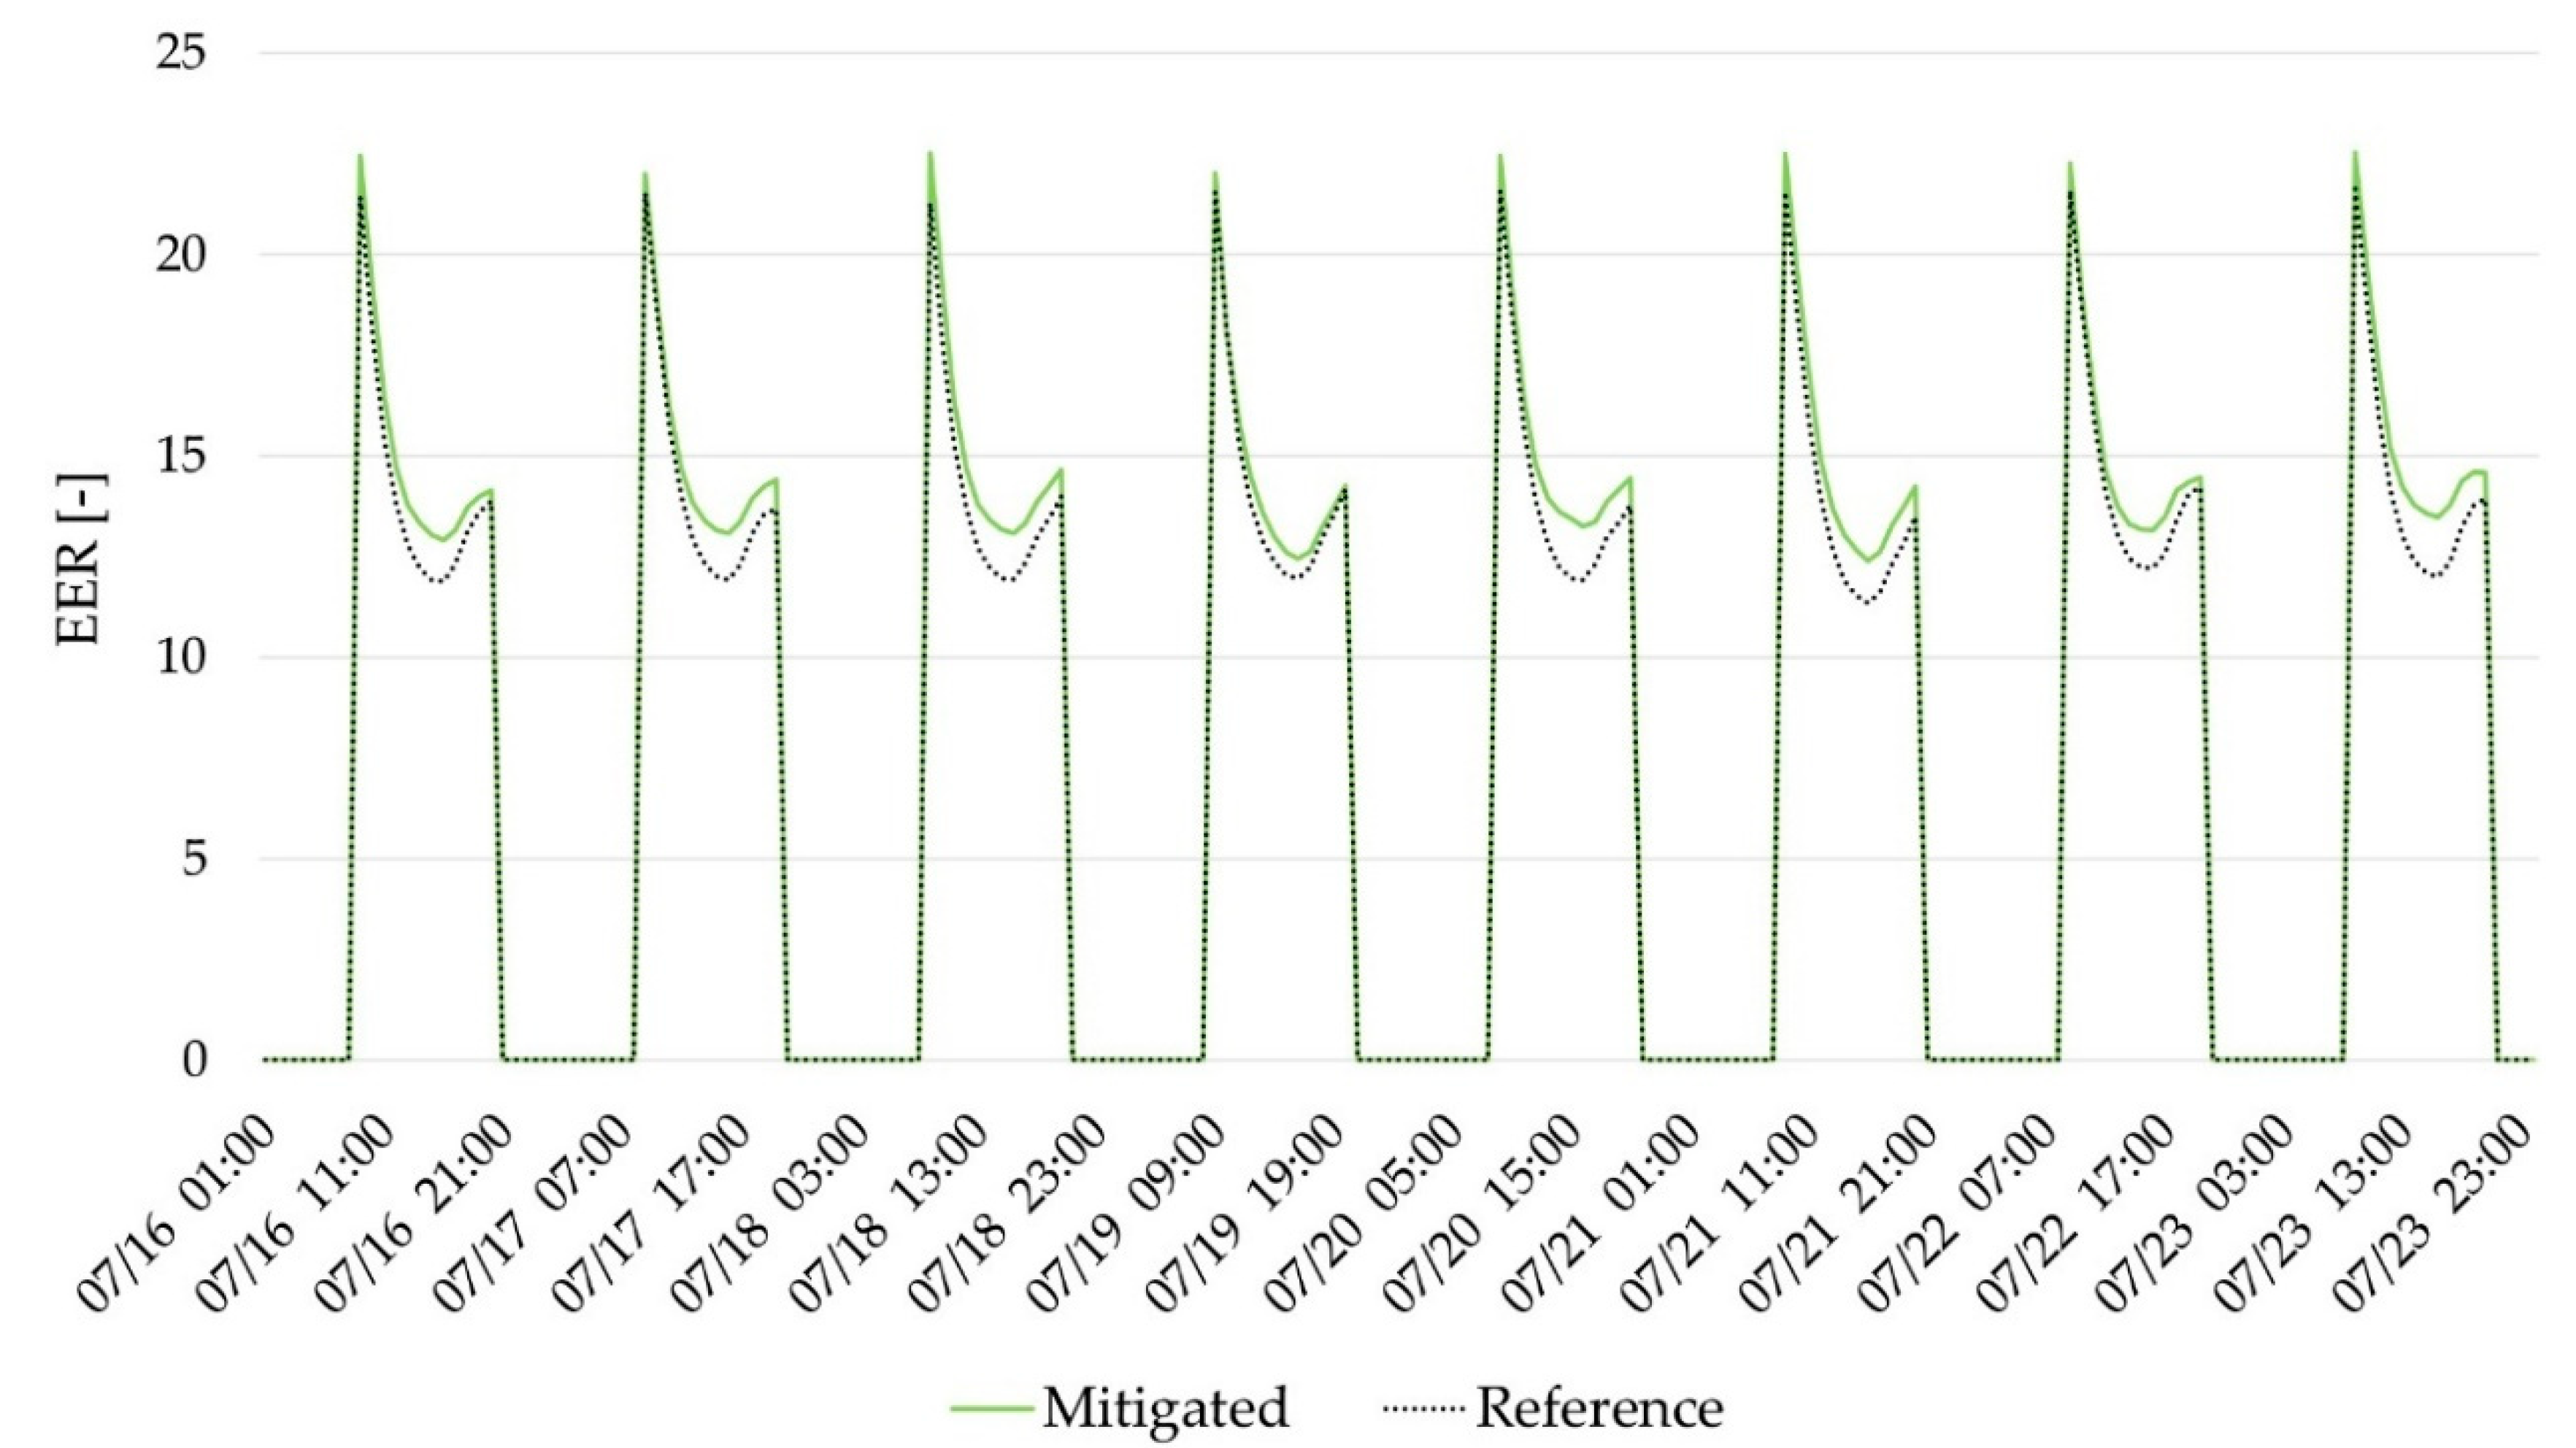
24]. In addition,
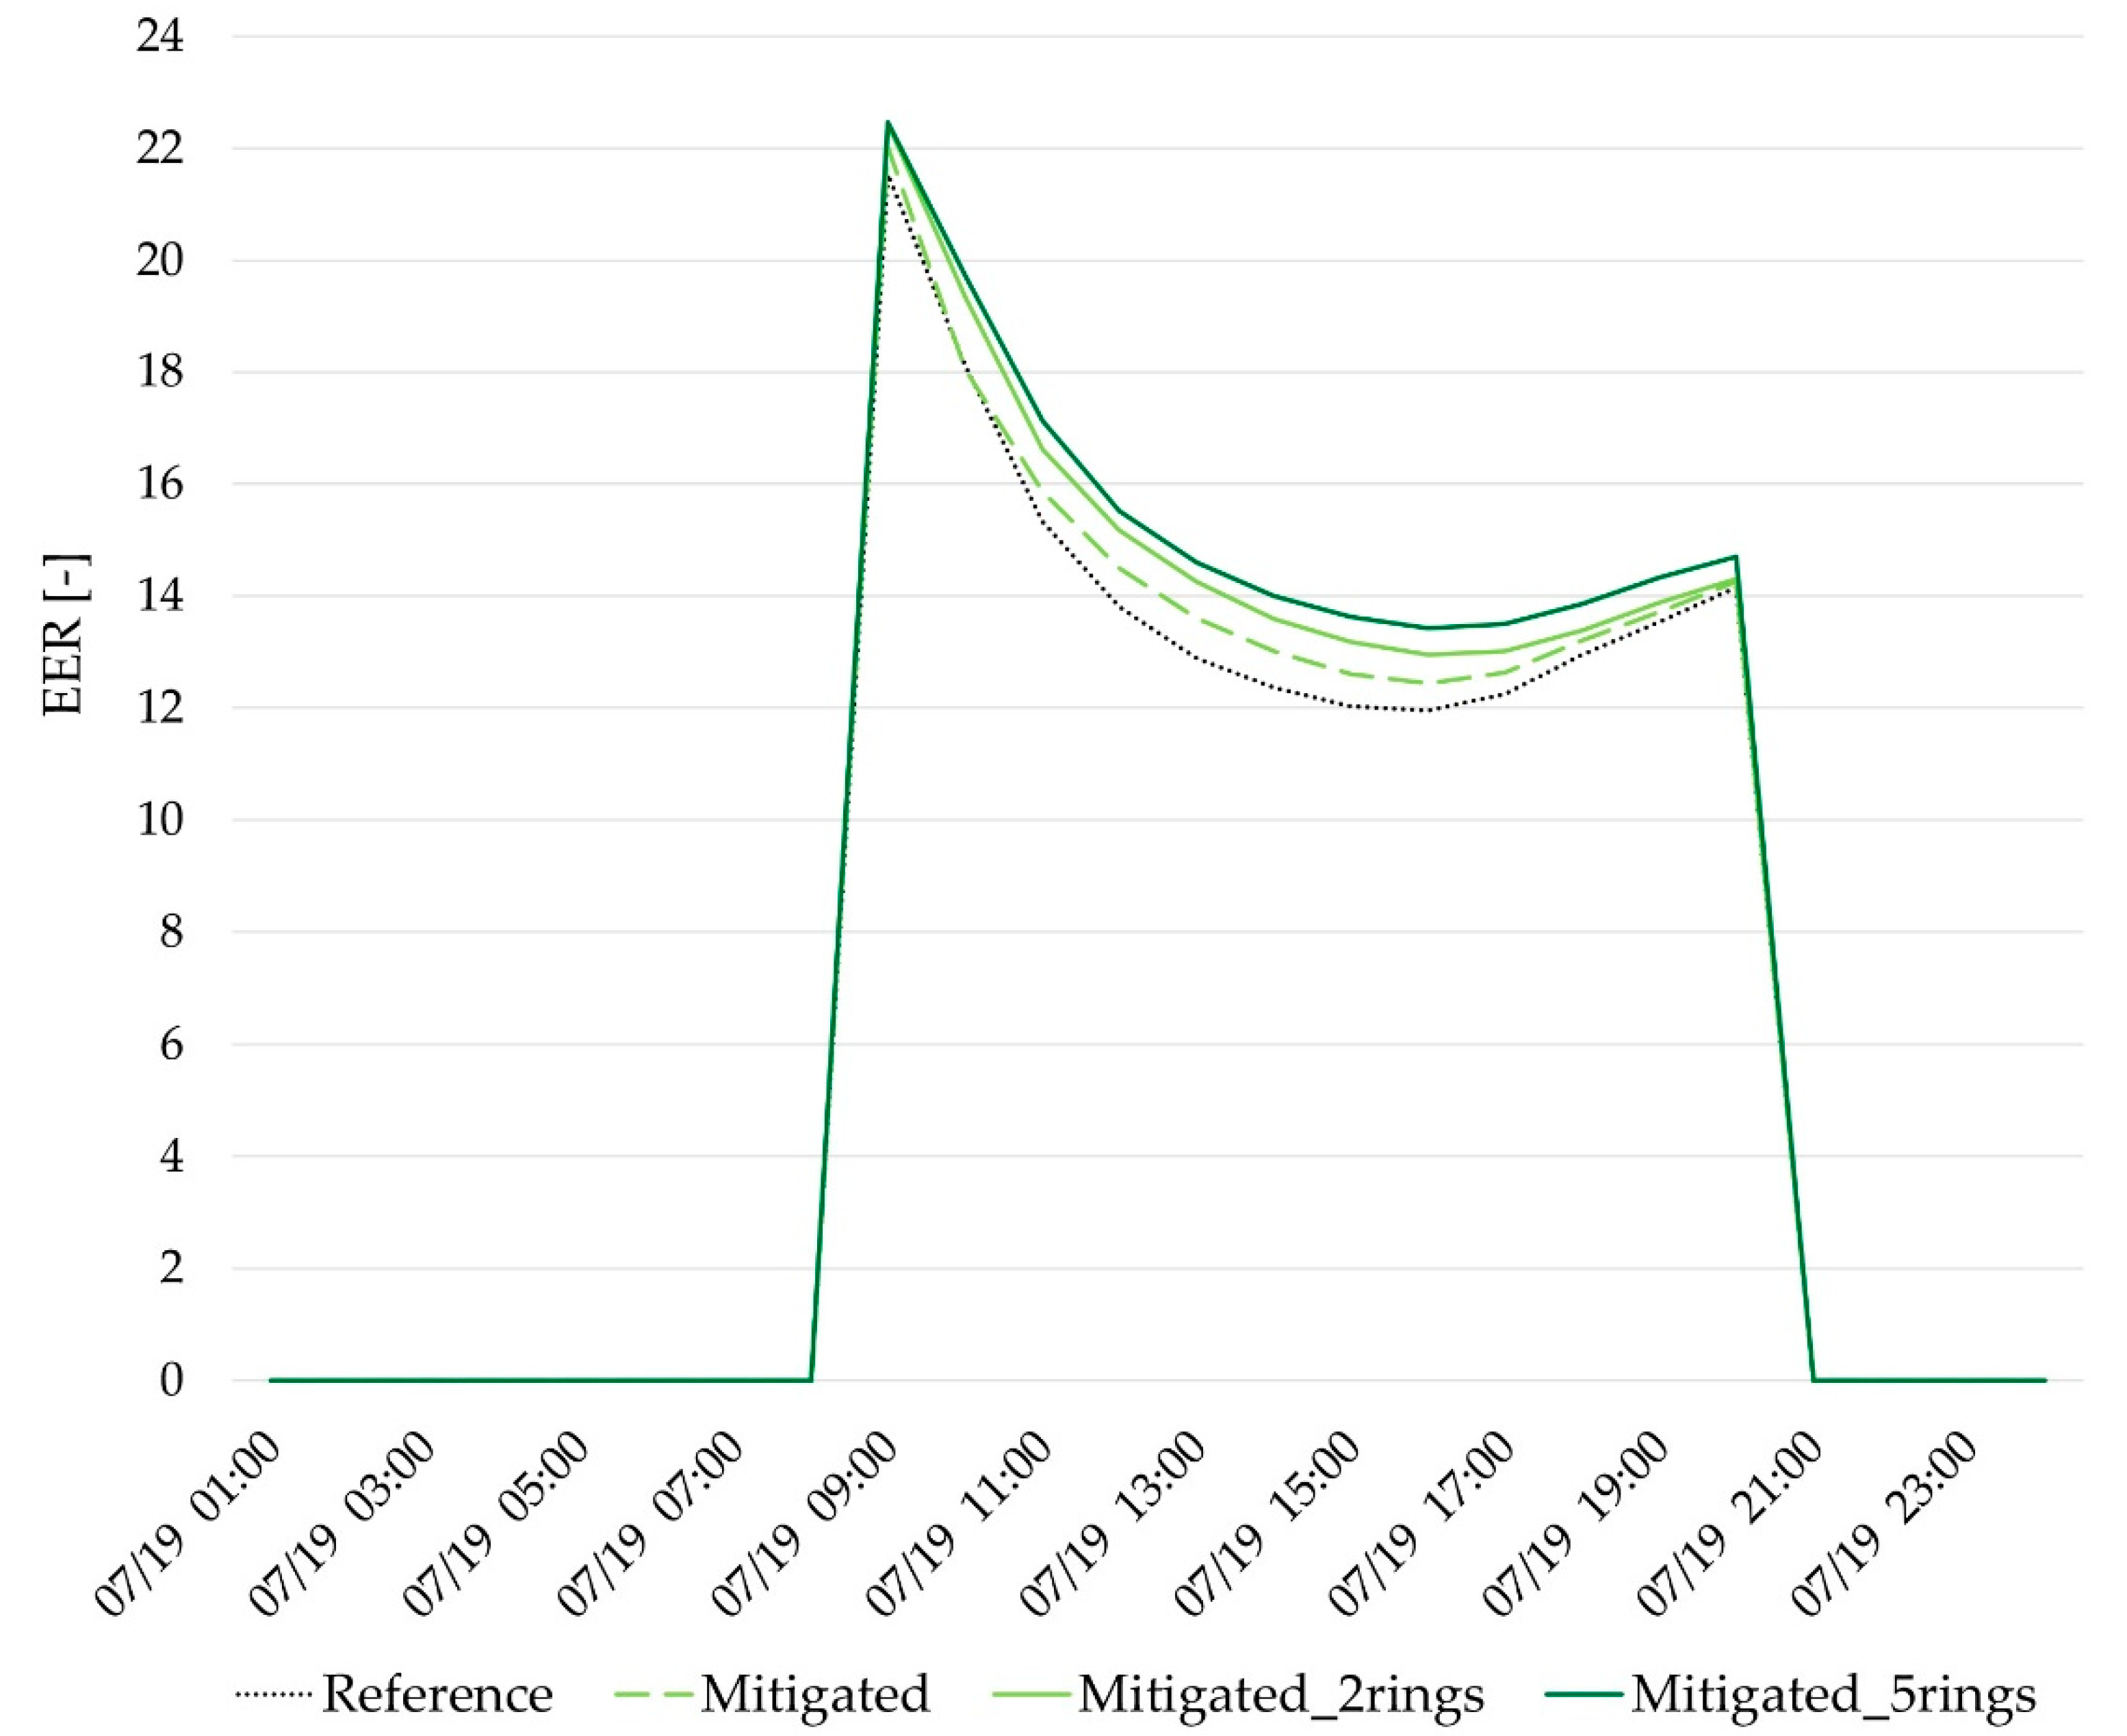
Figure 7 reports the variation of EER in all four scenarios during a representative day in the hottest summer week in July. In accordance with the previous outcomes, the EER of the operating air conditioning system is further progressively increased, especially in the peak operating conditions, when taking advantage of the enlarged mitigation potential. The maximum achievable EER increase is of about 21%.
5. Conclusions
District scale design involves extra energy efficiency potential compared to the single building analysis, including the opportunity to take advantage of microclimate mitigation strategies implemented at the inter-building scale. This work accordingly evaluated the potential benefit of implementing outdoor microclimate mitigation strategies at settlement level in terms of building energy performance improvement in summer. In detail, cooling energy saving benefits were assessed from a twofold perspective: building energy demand reduction due to less severe outdoor boundary conditions (passive benefits) and air conditioning system operational efficiency increase given microclimate mitigation affecting working conditions (active benefits). The study was carried out considering a residential NZEB part of a NZE settlement, according to the ZERO-PLUS project concept, as a case study. Results show that the implementation of microclimate mitigation strategies in the outdoor areas of the settlement provides a non-negligible beneficial effect not only in terms of less severe environmental conditions but also in terms of the efficiency of the operation of the direct expansion cooling system. In particular, the effect of the combination of three mitigation techniques, i.e., cool, green, and water-based infrastructures, quantitatively accounted for in a mitigated weather file inputted into a dynamic simulation of a building, achieved building cooling energy reduction up to 18.7% thanks to the combination of improved EER of the air conditioning system and reduced cooling demand. Moreover, when shifting from the inter-building to the settlement scale of application of the mitigation strategies, the total passive cooling saving was increased up to 24% in the scenario with four rings of residential buildings around the case study building compared to the reference. Specifically, the EER itself may have potentially increased up to 21% in the largest settlement configuration (mitigated_5rings scenario). Therefore, this study highlights the potential passive and active benefits of outdoor microclimate mitigation in terms of building thermal-energy performance achievable thanks to shift of the scale of analysis to the settlement level. The final findings may be of use for policy makers and energy experts in order to better size optimal settlement configurations towards the energy communities of prosumers being developed all around Europe.


