1. Introduction
A considerable amount of freeway congestion is due to non-recurring events and incidents, which has encouraged significant innovation in incident management practices and techniques to minimize the impact of these unforeseen events [
1,
2]. A large variety of traffic incident management (TIM) strategies have been developed. Most of them have focused on freeway incidents because these facilities carry higher volumes of traffic and because of their limited access nature, which restricts drivers’ chances to detour when encountering congestion [
3,
4,
5,
6,
7,
8]. Managing these congestions should be done quickly and without delay, unlike what may occur when operators of TIM manually deploy operational strategies [
9]. Recently, significant emphasis has been laid on the application of advanced information and communication technologies on transportation on the basis of the intelligent transportation systems (ITS) [
9]. They constitute a broad range of different technologies that are applied to transportation to make systems safer, reliable, more effective, and environmentally friendly [
1]. Active traffic management (ATM), a primary component of intelligent transportation systems (ITS), is the ability to dynamically manage recurrent and non-recurrent congestions based on predominant and predicted traffic conditions [
9]. Several TIM strategies from the field of intelligent transportation systems (ITS) have been proposed and applied. Active traffic management (ATM) strategies are increasingly being considered as a valuable and sustainable solution to mitigate traffic congestion and to provide safer and smoother traffic [
8,
9,
10,
11,
12,
13,
14]. A wide range of ATM strategies has been deployed, which includes dynamic lane assignment (D-LA), dynamic hard shoulder running (D-HSR), dynamic lane reversal (D-LR), dynamic merge control (DMC), dynamic speed limits (D-SPL), and dynamic ramp closure (D-RC) [
12]. Among these strategies, dynamic hard shoulder running and dynamic ramp closure are considered promising strategies for freeway facilities [
8,
9,
10,
11,
12,
13,
14,
15,
16,
17].
Ramakrishna et al. (2012) evaluated the effectiveness of using active traffic management (ATM) strategies on freeways in terms of the driver’s behavior and operational impacts [
15]. They found that the implementation of speed harmonization showed a 14% reduction in accidents and a 2%–3% increase in freeway speed; the implementation of hard shoulders showed a 39% increase in travel time, 22% increase in freeway capacity, and 60% decrease in delays; and the implementation of ramp metering showed a decrease of 23% in freeway travel time, a 14% increase in freeway speed, and 11% decrease in accident rates [
16]. Dutta et al. (2018) studied three ATM systems, including advisory variable speed limits (AVSLs), lane-use control signals (LUCS), and dynamic hard shoulder running (HSR), for 2 years on Interstate 66 (I-66) in Northern Virginia, United States. The operational analysis showed that most of the improvements occurred in the HSR sections. In particular, the observed safety benefits in the locations with HSR showed a 31%–38% crash reduction [
12].
The dynamic hard shoulder running (D-HSR) principle is to allow the traffic operations for normal traffic during peak periods to use hard shoulders that are wide enough to accommodate vehicles [
17,
18,
19,
20]. Under the ATM concept, the use of the shoulder lanes requires the existence of dynamic traffic control devices and other relevant technologies in order to inform the drivers as to whether the shoulder lane is open or not in a certain segment and to ensure driver safety during the opening of the shoulder lane. This strategy involves lane control signals, dynamic speed limit signals, dynamic message signs, closed-circuit television CCTV cameras, roadway sensors, and emergency roadside telephones [
19,
20]. D-HSR has been used successfully in Europe and the U.S. to alleviate congestion by increasing the capacity of the roadway [
18,
20,
21,
22,
23]. D-HSR was shown to reduce the delay by 9%–20% when there were bottlenecks [
20]. A 20% increase in the capacity was observed in Germany when implementing the shoulder lane as part of its integrated ITS [
8]. In the Netherlands, temporary right shoulder use increased the overall capacity from 7% to 22% and the traffic volumes by up to 7% during congested periods [
8]. Geistefeldt (2012) studied the driving response of using the hard shoulder and found that truck drivers had a higher willingness to use the hard shoulder as a normal lane compared to passenger car drivers [
20]. A recent study by Ruimin in 2017 optimized HSR by combining it with queue warning in the Netherlands under two typical accident scenarios [
17]. The results showed that the improved model could be effectively used in HSR optimization: the queue total travel delay decreased by 25.05%, while the throughput at the accident point increased by 59.53% [
17].
The ramp management strategy is the “application of control devices, such as traffic signals, signing, and gates to regulate the number of vehicles entering or leaving the freeway, in order to achieve operational objectives” [
23]. Ramp closures change traffic patterns that have been established over a substantial period of time [
13,
14,
15,
16,
17,
18,
19,
20,
21,
22]. Ramp closure is considered to be a feasible option for managing traffic during special events or for controlling traffic in work zones [
23,
24]. Limited research works have evaluated the potential impact of using ramp closures as a traffic incident management strategy, however. For instance, Boyles et al. (2008) proposed a two-phase approach for temporary on-ramp closure during an incident. In their research, they provided an optimizing ramp closure policy in real time through identifying which ramp should be closed and which closing period was optimal [
7].
Although different research works have proven the effectiveness of ATM in improving the safety and mobility of traffic [
7,
8,
12,
13,
14,
15], the impact analysis of these research works has its limitations. First, since driving behavior and operational conditions are often different from country to country, these studies may not reflect the local driving behavior. Second, most previous studies used a simulation-based analysis approach and some simulation models that were used are not flexible enough to consider the characteristics of bottlenecks. Third, limited research has measured the possible effectiveness of these strategies against non-recurrent congestion. Finally, many problems are related to the cost of development and installation of the infrastructure, databases, and support agencies required for the systems to operate effectively [
10]. Consequently, it is necessary to discuss the potential impact of these strategies on different traffic flow patterns with different driving behaviors, and under different incident scenarios, and due to limited funding for such technologies, the economic evaluation is rather essential before any actual implantation.
In the context of Oman, Oman is one of the gulf countries that has seen a remarkable development during the past four decades through rapid economic growth, modernization, and the infrastructure development [
25]. Recently, the country has come up with a common initiative for a smart transport system aimed at improving the efficiency of transport services in the context of growing sustainability concerns through ITS [
26]. Considering the real implementation of ATM in different countries, Oman has not implemented ATM strategies due to the lack of genuine and concrete research to assess the applicability of using such technologies under realistic cases in Oman.
Therefore, in this paper we aim to provide a simulation-based methodological framework for evaluating the sustainability of ATM strategies and their impact on mobility, safety, and environmental impact during non-recurring congestion at Muscat Expressway, Sultanate of Oman. Furthermore, an economic evaluation of these strategies is performed to determine the financial feasibility of their implementation. This study might help decision makers to develop a strategic vision for the use of ITS technologies for sustainable transportation in Oman.
A micro-simulation VISSIM with add-on module VISSIG, as well as a cost benefit analysis (CBA), were used to evaluate the impact of these strategies.
The paper is organized as follows. The next section reviews previous studies of D-HSR and D-RC. The following section discusses the methodologies of the analysis.
Section 3 describes the experimental design, including collecting data for the experiment analysis, building a simulation network, and the design of the ATM scenarios.
Section 4 shows the results of ATM scenarios.
Section 5 summarizes the findings and announces the future work.
2. Literature Review
The dynamic hard shoulder running (D-HSR) principle is to allow usual traffic operations for normal traffic during peak periods to use hard shoulders that are wide enough to accommodate vehicles [
17,
18]. Under the ATM concept, the use of the shoulder lanes requires the existence of dynamic traffic control devices and other relevant technologies in order to inform the drivers whether the shoulder lane is open or not in a certain segment and to ensure driver safety during the opening of the shoulder lane. This strategy involves lane control signals, dynamic speed limit signals, dynamic message signs, closed-circuit television CCTV cameras, roadway sensors, and emergency roadside telephones [
17,
18]. D-HSR has been used successfully in Europe and U.S.A to alleviate congestion by increasing the capacity of the roadway [
16,
18,
19,
20,
21]. D-HSR was shown to reduce the delay by 9%–20% when there were bottlenecks [
18]. A 20% increase in the capacity was observed in Germany when implementing the shoulder lane as part of its integrated ITS [
8]. In the Netherlands, a temporary right shoulder increased the overall capacity by 7% to 22%, and the traffic volumes up to 7% during congested periods [
8]. Geistefeldt (2012) studied the driving response of using the hard shoulder and found that truckdrivers had a higher willingness to use the hard shoulder as a normal lane compared to passenger car drivers [
9]. A recent study by Ruimin in 2017 optimized HSR by combining it with a queue warning in the Netherlands under two typical accident scenarios [
16]. The results showed that the improved model could be effectively used in HSR optimization: the queue total travel delay decreased by 25.05%, while the throughput at the accident point increased by 59.53% [
16]. Dutta et al. (2018) studied three ATM systems, including advisory variable speed limits (AVSLs), lane-use control signals (LUCS), and dynamic hard shoulder running (HSR), for 2 years on Interstate 66 (I-66) in Northern Virginia. The operational analysis showed that most of the improvements occurred on the HSR sections. In particular, the observed safety benefits at locations with HSR showed a 31%–38% crash reduction [
11].
The ramp management strategies are the “application of control devices, such as traffic signals, signing, and gates to regulate the number of vehicles entering or leaving the freeway, in order to achieve operational objectives” [
22]. Ramp closures change traffic patterns that have been established over a substantial period of time [
17,
18,
19,
20,
21]. Ramp closure is considered to be a feasible option for managing traffic during special events or for controlling traffic in work zones [
22,
23]. Limited research works have evaluated the potential impact of using ramp closures as a traffic incident management strategy. For instance, Boyles et al. (2008) proposed a two-phase approach for temporary on-ramp closure during the incident. In their research, they provided an optimizing ramp closure policy in real time through identifying which ramp should be closed and which closing period is optimal [
7].
D-HSR and ramp closure are widely used in managing the recurrent congestion, so it is good to complete the evaluation of the effectiveness of ATM strategies during non-recurrent incidents. Furthermore, economic evaluation is essential to evaluate the feasibility of the implementation of these strategies.
Finally, there is no published study in the field of ATM applications in TIMs in Oman, so this study may be considered as the first scientific research in this field in Oman.
3. Methods
The traditional TIM system required human involvements to manage the traffic during the incidents. However, advances in sensor technologies and traffic control systems have allowed the automatic management of traffic flow using various types of detectors. Therefore, the main idea of our proposed strategies is to automatically manage the traffic flow during the incident without human involvement. In our study will focus on the dynamic hard shoulder running (D-HSR) and dynamic ramp closure (D-RC) among of others ATM strategies.
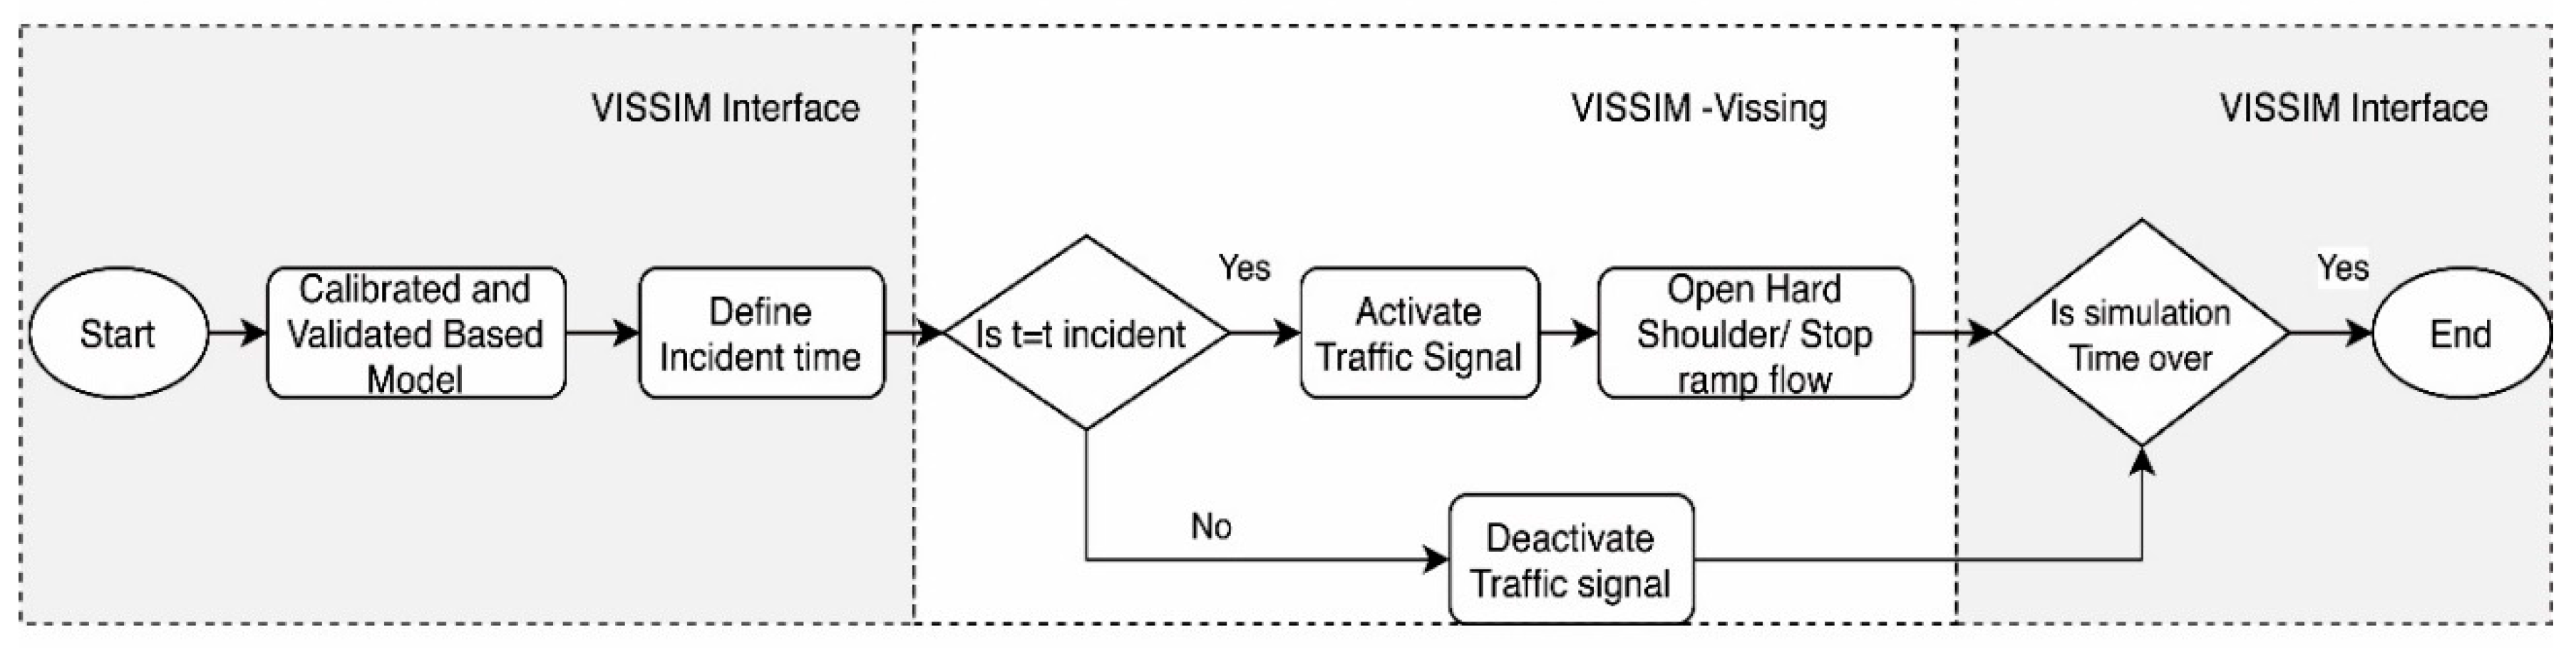
The proposed dynamic strategies were based on a dynamic signal control algorithm [
16]. This algorithm included two main modules. The first module started when the detectors received updated information at every time point. This data were provided to the second module, which activated the dynamic signal controller with a certain time to open the hard shoulder and/or close the specific ramp.
In order to evaluate and quantify the effectiveness of our ATM strategies, the traffic microsimulation package VISSIM [
27,
28] was used. VISSIM is a stochastic time-step microscopic simulation software package developed by PTV AG in Germany. It is a behavior-based simulation model that uses a Wiedemann psycho-physical car-following logic to model traffic on urban streets and freeway environments. It contains multiple parameters that provide flexibility in changing the parameters to replicate traffic operations as observed in the field [
27,
28]. Moreover, it contains the Fixed Control VISSIG, which enables VISSIM to simulate programmable signal control (SC) for group-based signal controls [
28].
In both strategies, the traffic signal control signs were used to control the vehicles using the hard shoulder or stopping on the ramp. When the VISSIM simulation ran, VISSIG interpreted the control logic commands and generated commands for the signal control to be active in the network [
28]. VISSIG called the demand-dependent stages according to data gathered from the Traffic Management Center (TMC). The signal head was positioned at least 1 to 2 m upstream of the start of the connector [
28]. This may have been in the form of hardwire or wireless communications (e.g., radio wave). To allow the informed vehicle to use the hard shoulder during the incident, a two-colored control signal controller with a partial vehicle route was used. The total cycle length for each highway section was equal to the simulation time of that section. The signal cycle lengths depended on the incident duration of each section. For our analysis and as our first scenario, we first assumed that drivers were aware of the ramp closure and opening hard shoulder. Considering the large number of permutations corresponding to different incident scenarios and roadway geometries, each strategy was implemented and evaluated (see next two sections).
Figure 1 presents the dynamic ATM strategies framework.
In practice, the necessary driver notification is possible through different implementation approaches, which include signs, cones, and flaggers (the traditional method implemented by a traffic management operator) or dynamic message signs.
In our study, we assumed that the driver was notified “on the fly” (via variable message sign (VMS), radio, or mobile application) that the hard shoulder was to be used, as well as which ramp would be closed. In addition, the traffic signs at the ramp were dynamically activated.
To evaluate our strategies, we tested various combinations of traffic incidents and response strategies in the study area during peak hours under different traffic conditions, highway patterns, and incident severities.
The microsimulation allowed more detailed measures of effectiveness (MoE) based on fundamental traffic properties [
29,
30]. These MoEs included total throughput (capacity), travel time (is the average time that the vehicles spent on traveling over a specific link), average delay, stopped delay (which is the time a vehicle is stopped in the queue while waiting to pass through the bottleneck area), and number of stops (which represent the stop-and-go shockwaves in the network).
Improving these MoE indicated the improvement of the operation and safety of traffic flow during the incident. Reducing travel time, reducing delay, and increasing throughput intended to improve the traffic mobility, while reducing the number of stops intended to reduce the secondary accidents at the incident area and, therefore, improve safety [
29,
30,
31,
32].
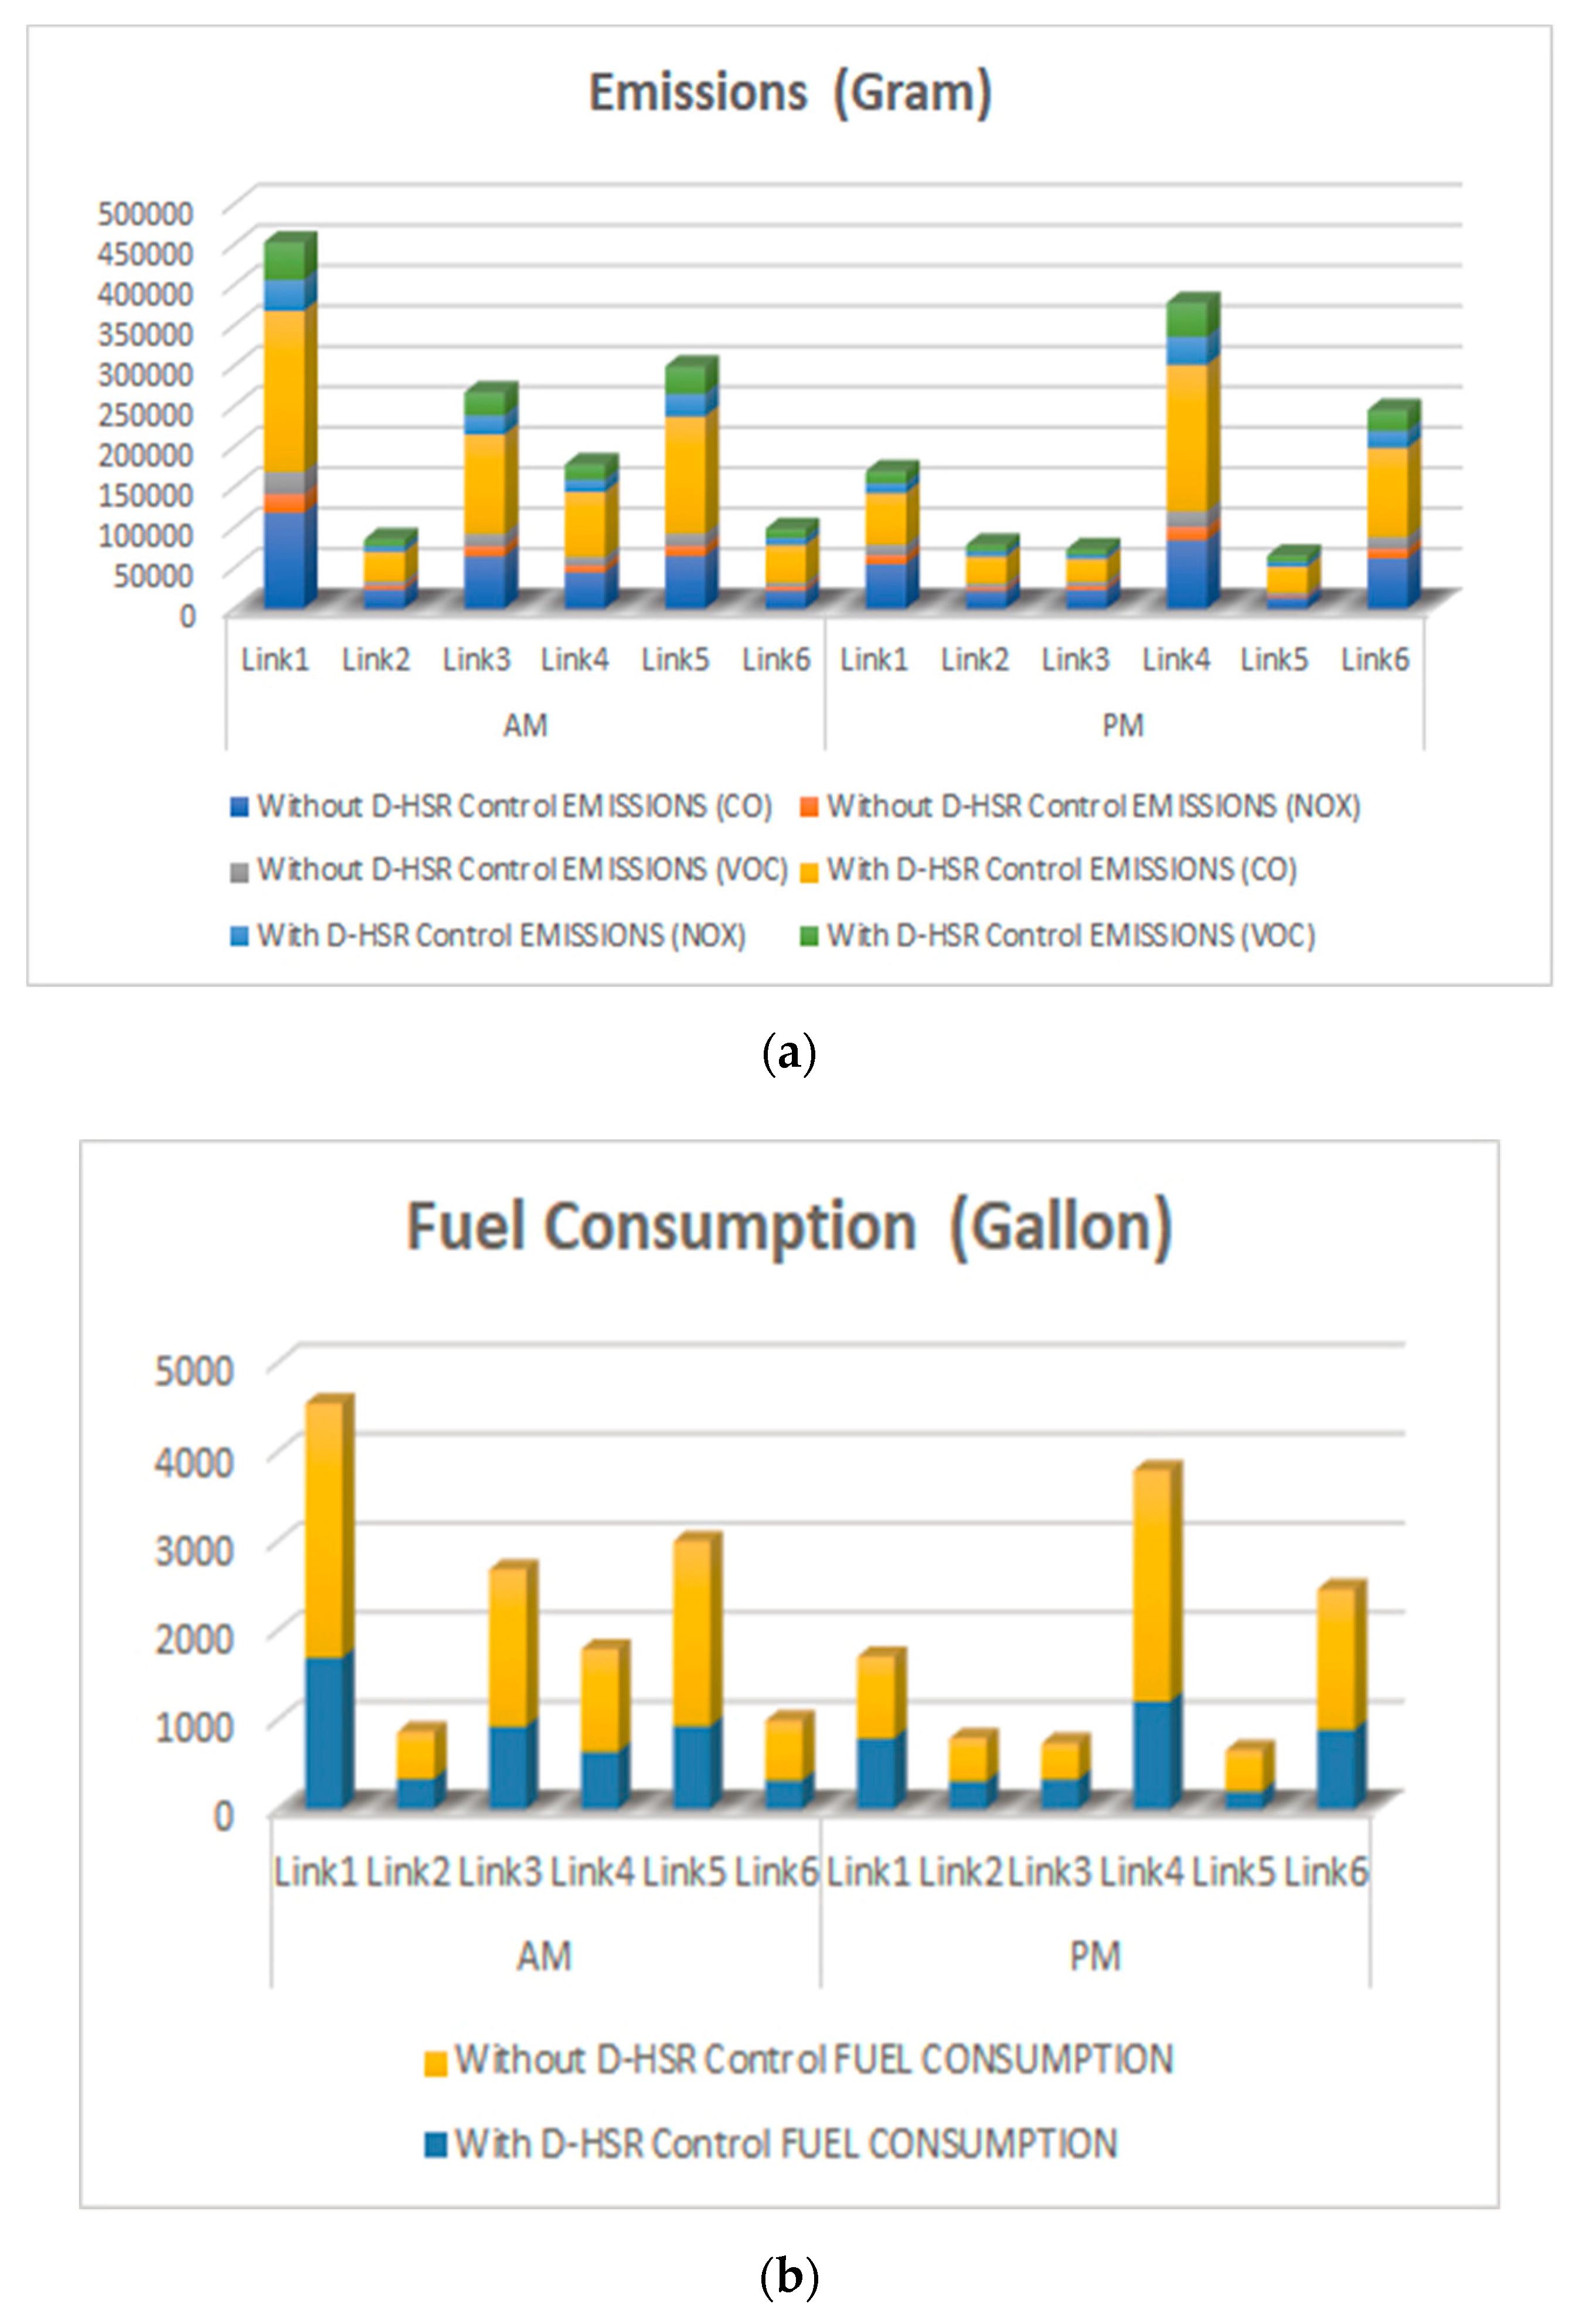
In terms of sustainable and energy-efficient transport system options, fuel consumption and air pollution-relevant emissions created by different models were another important performance measure. Therefore, vehicle emissions, including carbon dioxide (CO2), nitrogen oxides (NOx), and volatile organic compounds (VOCs), as well as fuel consumption, were measured [
29,
30,
31].
Finally, benefit–cost ratio (B/C) and net present value (NPV) methods were used [
32,
33] in order to evaluate the feasibility of implementing the ATM strategies.
3.1. Experimental Design
3.1.1. Study Area and Data Collection
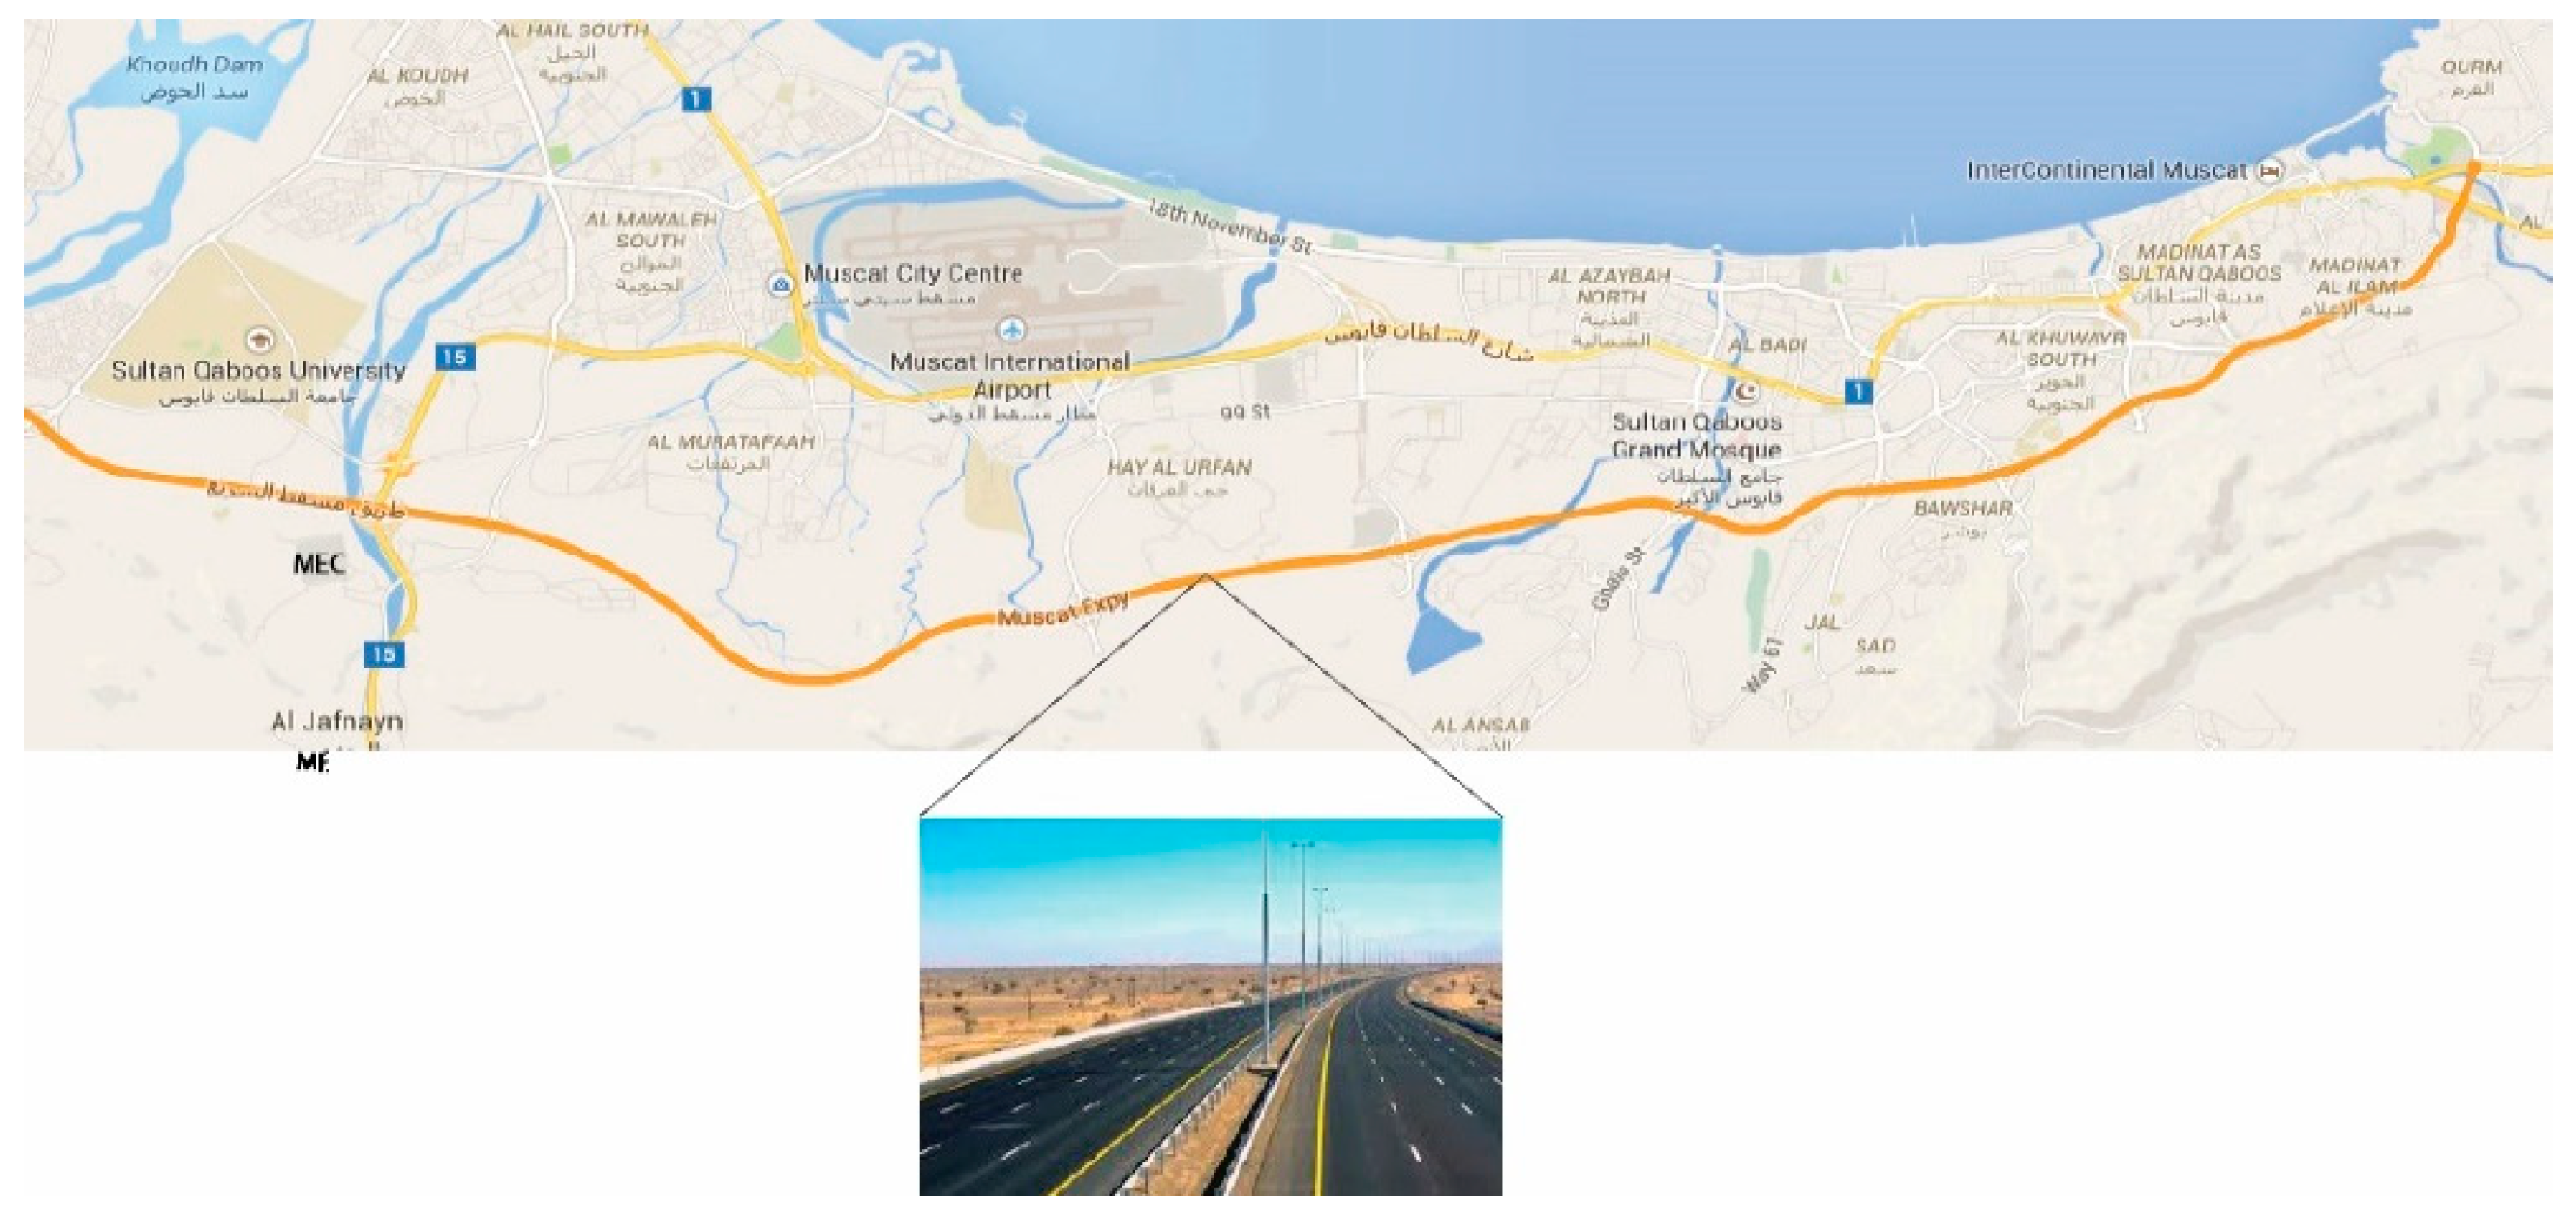
Muscat Expressway is a 54 km long road that joins Rusail and Qurum. The expressway was initiated in 2010 to reduce the traffic burden on Sultan Qaboos Street, which was the only main road at that time [
34,
35]. We focused on a section of around 20 km of the Muscat Expressway that links Qurum and Mubella. The reason for choosing this study area came from Royal Oman Police (ROP) data, which registered the highest number of incidents; the topography and length of these sections represent entire sections of the Muscat Expressway [
36]. Moreover, the site provided several challenges in microscopic modelling, including interchange spacing and merging and diverging areas [
36]. The study area was divided into six sections of on/off ramps with lengths varying between 1.8 km and 5.4 km. Each section consisted of six lanes with three-lane carriageways in each direction. The three lanes were separated by a 12.0 m concrete median with landscape and light poles [
33,
34]. The average lane width was 3.65 m with an inner shoulder of 2.5 m and an outer shoulder of 2.0 m [
33,
34]. The posted speed limit was 120 km/h for passenger cars and 100 km/h for heavy trucks and buses [
33,
34]. The study area is illustrated in
Figure 2.
To microstimulate and evaluate our scenarios, data of highway geometry, traffic volume and traffic composition, and incident characteristics (such as the number of vehicles involved, incident location, number of lane closures, and incident duration) were required. The geometric data and the traffic data were collected from the Supreme Council for Planning and the Muscat Municipality, respectively [
34,
35]. The traffic volume data were obtained from a survey conducted by PARSONS international company for the Muscat Municipality Study between March and May, 2018 [
35]. This span included regular working days (Mon/Tue/Wed) and normal weather conditions covering all three-peak hours and off-peak (AM, LT, PM, Off Peak) [
35]. Peak hours were defined as AM: morning peak hour (07:00 to 8:00), LT: lunch time peak hour (12:00 to 13:00), and PM: evening peak hour (17:00–16:00) [
34,
35]. Off-peak was defined as the time between the previous peaks [
34,
35].
Since the previous studies [
1,
33,
34] have shown that incidents have no significant effects on traffic flow during off-peak hours and the main objective of our study was to evaluate ATM strategies to resolve non-recurrent congestion, our models needed to be tested during peak hours [
33,
34]. The urban planning for the study area showed that Mubella is a residential area in Muscat, and most ministry buildings and companies are located in Alkhwaire and Al Quram. Consequently, the route between Mubella and Quram (North to South) sustains heavy traffic congestion during the morning peak hour (when the people go to work), while the route between Quram and Mubella (South to North) has heavy traffic congestion during the evening peak hour (when they come back to their homes) [
33,
34]. Therefore, our strategies were evaluated during the morning peak hour on the route between Mubella and Qurum and during the evening peak hour on the route between Qurum and Mubella.
The preliminary analysis of the collected data showed that the traffic volume varied between 4430 vehicle/h and 7945 vehicle/h, with heavy vehicle percentages ranging between 7% and 17% [
36].
The average speed varied between 54 km/h and 101 km/h [
34,
35,
36] during a.m. and p.m. peak hours. The incident data were collected from the Royal Oman Police (ROP) records. The data were retrieved and organized for research purposes. The incident duration was calculated as the time from incident detection until clearance, and it was found to be between 15 and 50 min. To develop the microsimulation model, the collected data were checked and verified for allowable error (coefficient of variation (c.v.) and percentage error (e) <5% at t-95) [
29,
30,
31,
36].
3.1.2. Building Base Model
To develop our microsimulation model, we used Google-Earth data, including the driveway, the merge/diverge section, traffic volume, desired speed, traffic characteristics, traffic composition, and a set of static vehicle routes. This scale base model was built using the VISSIM COM interface [
24]. The base model was then calibrated and validated based on the local driving behaviors parameter to ensure that the base was representing the real case conditions. Traffic volume and average speed were used for the calibration process and travel time for the validation process [
29,
30,
31]. The Geoffrey E. Havers (GEH) statistical procedure was used to evaluate the calibration results [
29,
30,
31]. The base model of the whole section was found to be significantly calibrated, and the value of GEH varied between 0.5 and 4 during the p.m. and a.m. peak hours [
36]. Moreover, three statistical analyses (goodness-of-fit measurements) were done to validate the calibrated model: namely, root mean square error (RMSE), mean absolute normalized error (MANE), and a coefficient of correlation (CC). All goodness-of-fit measurements were within an acceptable range (less than 15%) [
29,
30,
31,
36]. Finally, to minimize the impact of the stochastic nature of the VISSIM model, our simulation models were run 10 times [
29,
30,
31,
36] for 4500 to 5400 s, including warm-up and cooling-down periods, which varied from 600 to 900 s [
36].
With these calibrated base models, the incident was simulated as a parking lot that allowed the disabled vehicles or the vehicles involved in an accident to stay in the blocked lane/lanes during the incident time [
28,
29,
30,
31,
32,
33,
34,
35,
36]. To achieve this, the parking lot was active only during the incident time. To allow other vehicles to use the opened lane/lanes, a partial route was used to direct all traffic over a newly created connector during the incident through setting the time interval for the partial route equal to incident time [
28,
29,
30,
31,
32,
33,
34,
35,
36]. In order to model rubbernecking effects within VISSIM, an approximately 50 m reduced speed area was added upstream of the incident with a 30–40 km/h speed limit in adjacent lanes [
36,
37,
38].
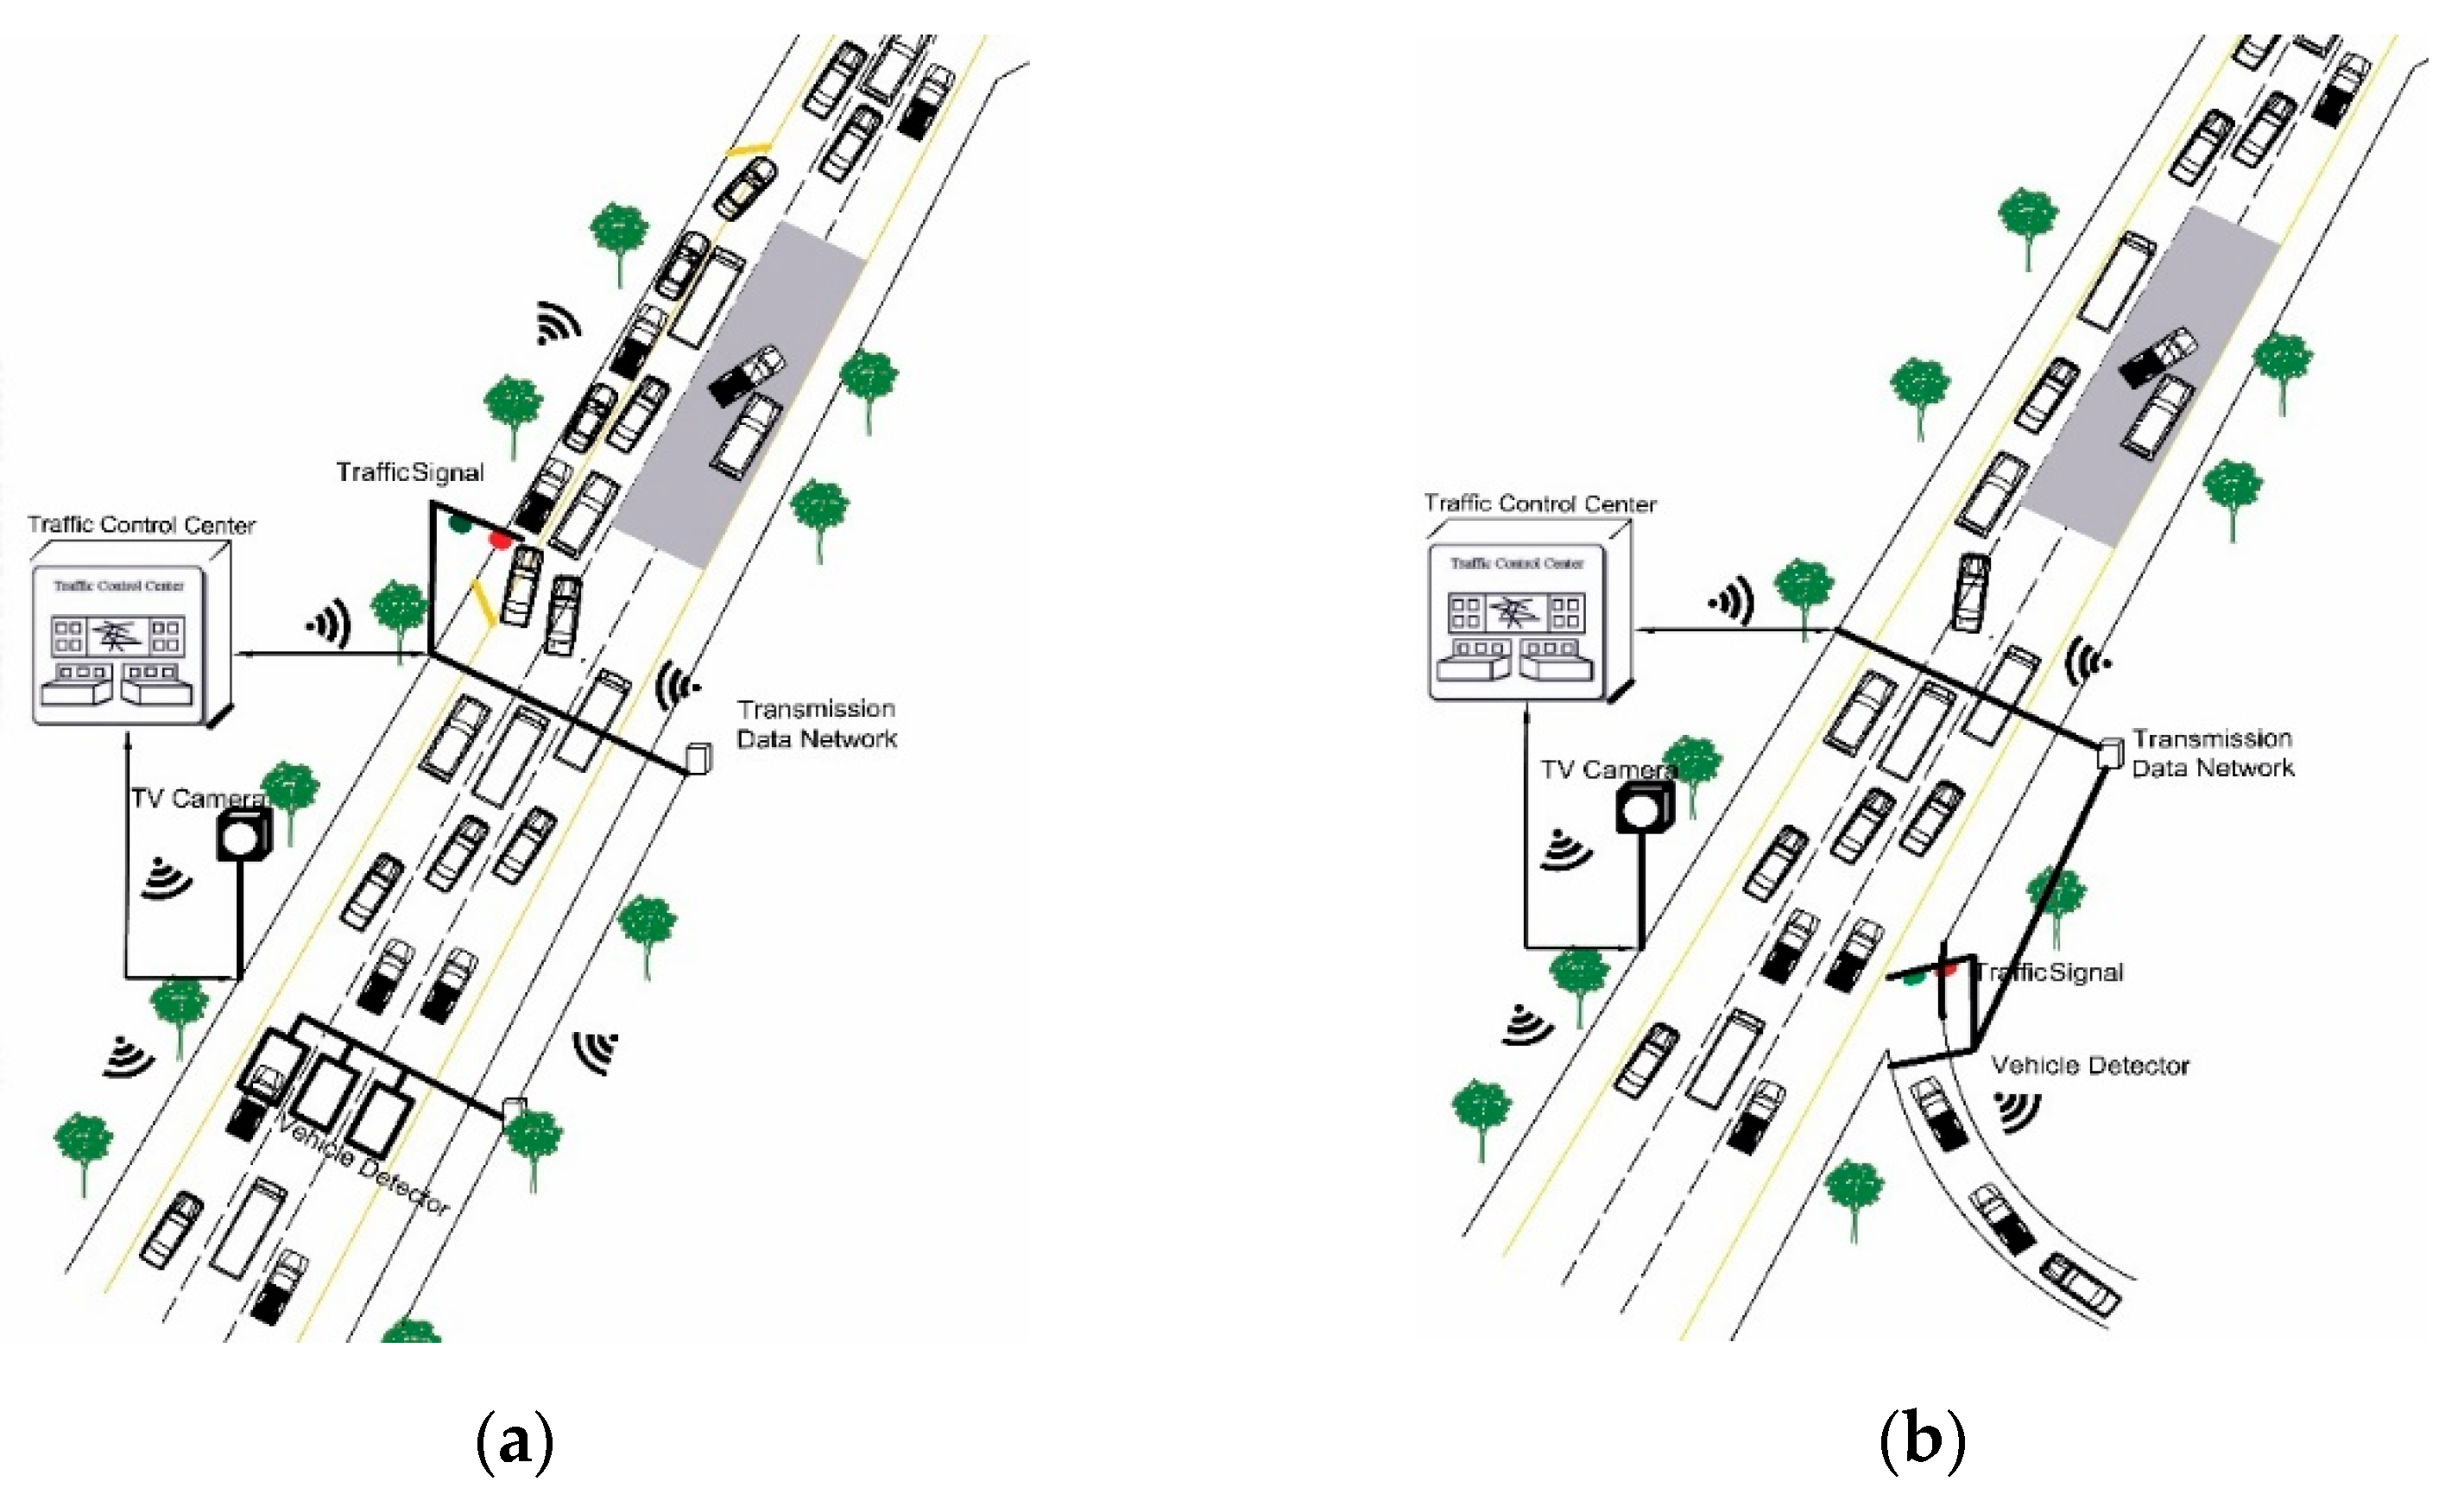
3.1.3. Implementation of ATM Strategies
When an incident blocked the mainline lanes, a section of the shoulder was opened temporarily to allow more vehicles to bypass the incident, thus, avoiding the formation of excessive traffic congestion due to shockwaves or bottleneck before the incident. In our study, we used one shoulder only and kept the second one clear so that the emergency vehicles could still arrive on time (or other TM). We assumed that it was possible to allow the vehicles to use part of the shoulder upstream or downstream of the incident at any location. The part from the shoulder that was open to the vehicles upstream of the incident was between 500 m to 800 m (depending on the section length), while the section downstream of the incident was around 300 m [
7]. As recommended in [
7], the hard shoulder should be closed directly after the incident is cleared. Therefore, the time during which the vehicle was allowed to use the hard shoulder was equal to the incident duration/time.
To ensure the representation of traffic at the hard shoulder during the incident, a reduced speed area of 30–40 km/h speeds was added in the hard shoulder opening section. For traffic signals, the red signal was displayed as long as the hard shoulder was deactivated/closed, while the green signal indicated that the hard shoulder was activated/open (vehicles were allowed to use the hard shoulder). The scenario of the ATM strategies is illustrated in
Figure 3.
While there are several ways to close access to ramps, including mechanized gates, VMSs, temporary barriers, and on-site personnel [
23], this was not the focus of this research. Our study, which was based on dynamic ramp closure, instead used ramp control signals that were modeled using VISSIG. Since our system was dynamic and automated, we assumed that on-ramps would be closed once the incident was verified by TMC, as illustrated in
Figure 3a. The ramp closure duration was very critical, so we found from previous studies that, for maximum performance, the ramp should have been reopened 10%–20% before the anticipated clearance time [
7]. For instance, if the incident duration was one hour, the ramp should have been closed for 50 min.
3.2. Feasibility Study
To assess the financial feasibility of implementing our strategies on Muscat Expressway, Benefit-cost ratio (B/C) and net present value (NPV) methods were used [
32,
39]. The total benefits (B) were calculated as the sum of the vehicle operating cost (VOC), emissions, and travel time savings. Similarly, total costs were determined by the sum of the total initial fixed costs and the annual operation and maintenance costs. The benefit–cost ratio (B/C) and net present worth (NPW) were estimated using a discount rate equal to 5% and a 20-year analysis period [
32,
39]. Vehicle emissions in general are influenced by vehicle age, mileage, size, engine power, and vehicle miles travelled (VMT) [
40,
41,
42]. However, in this study, and for the sake of simplicity, it was assumed that the vehicle type was the only factor influencing the vehicular emissions rates. The unit cost (€/ton) of pollutants was estimated as CO (106.5 €/ton), VOC (563.09 €/ton), and NOx (10,052.22 €/ton) [
40,
41,
42]. To estimate travel time savings during the morning and afternoon peak duration, it was assumed that the trip purpose for all of the automobiles was work-related. The corresponding value of travel time (VOT) for a single occupant vehicle (SOV) was assumed to be
$30/h, while the VOT for automobiles with higher occupancy was equal to the occupancy multiplied by
$30/h; for heavy vehicles, this was in the range of
$100/h [
40,
41,
42]. A similar segment-wise analysis was performed to estimate the vehicle operating cost (VOC) savings. The VOC savings were determined by estimating the fuel cost savings using the American Association of State Highway Transportation Officials (AASHTO) model as described in [
40,
41,
42]. The VOC savings were calculated according to the following equation, where the fuel cost was assumed to be
$3.5 per gallon in [
41]:
VOC savings = Average travel time x the fuel cost per gallon x fuel consumption value [
41].
5. Discussion
The simulation analysis for using D-HSR and D-RC under non-recurring congestion showed positive impacts on traffic operation, safety, and environmental impacts.
The sensitivity analysis for hard shoulder running and ramp closure indicated that the performance of these ATM strategies depended on the time of the incident (during the a.m. or p.m.), peak hour, traffic volume, ramp traffic volume, and traffic composition. The location and severity of the incident also impacted the success of the ATM strategy.
For example, when two lanes were blocked, the strategy showed improvement in the bottleneck throughput (capacity). Nevertheless, it was less efficient in terms of safety and emissions.
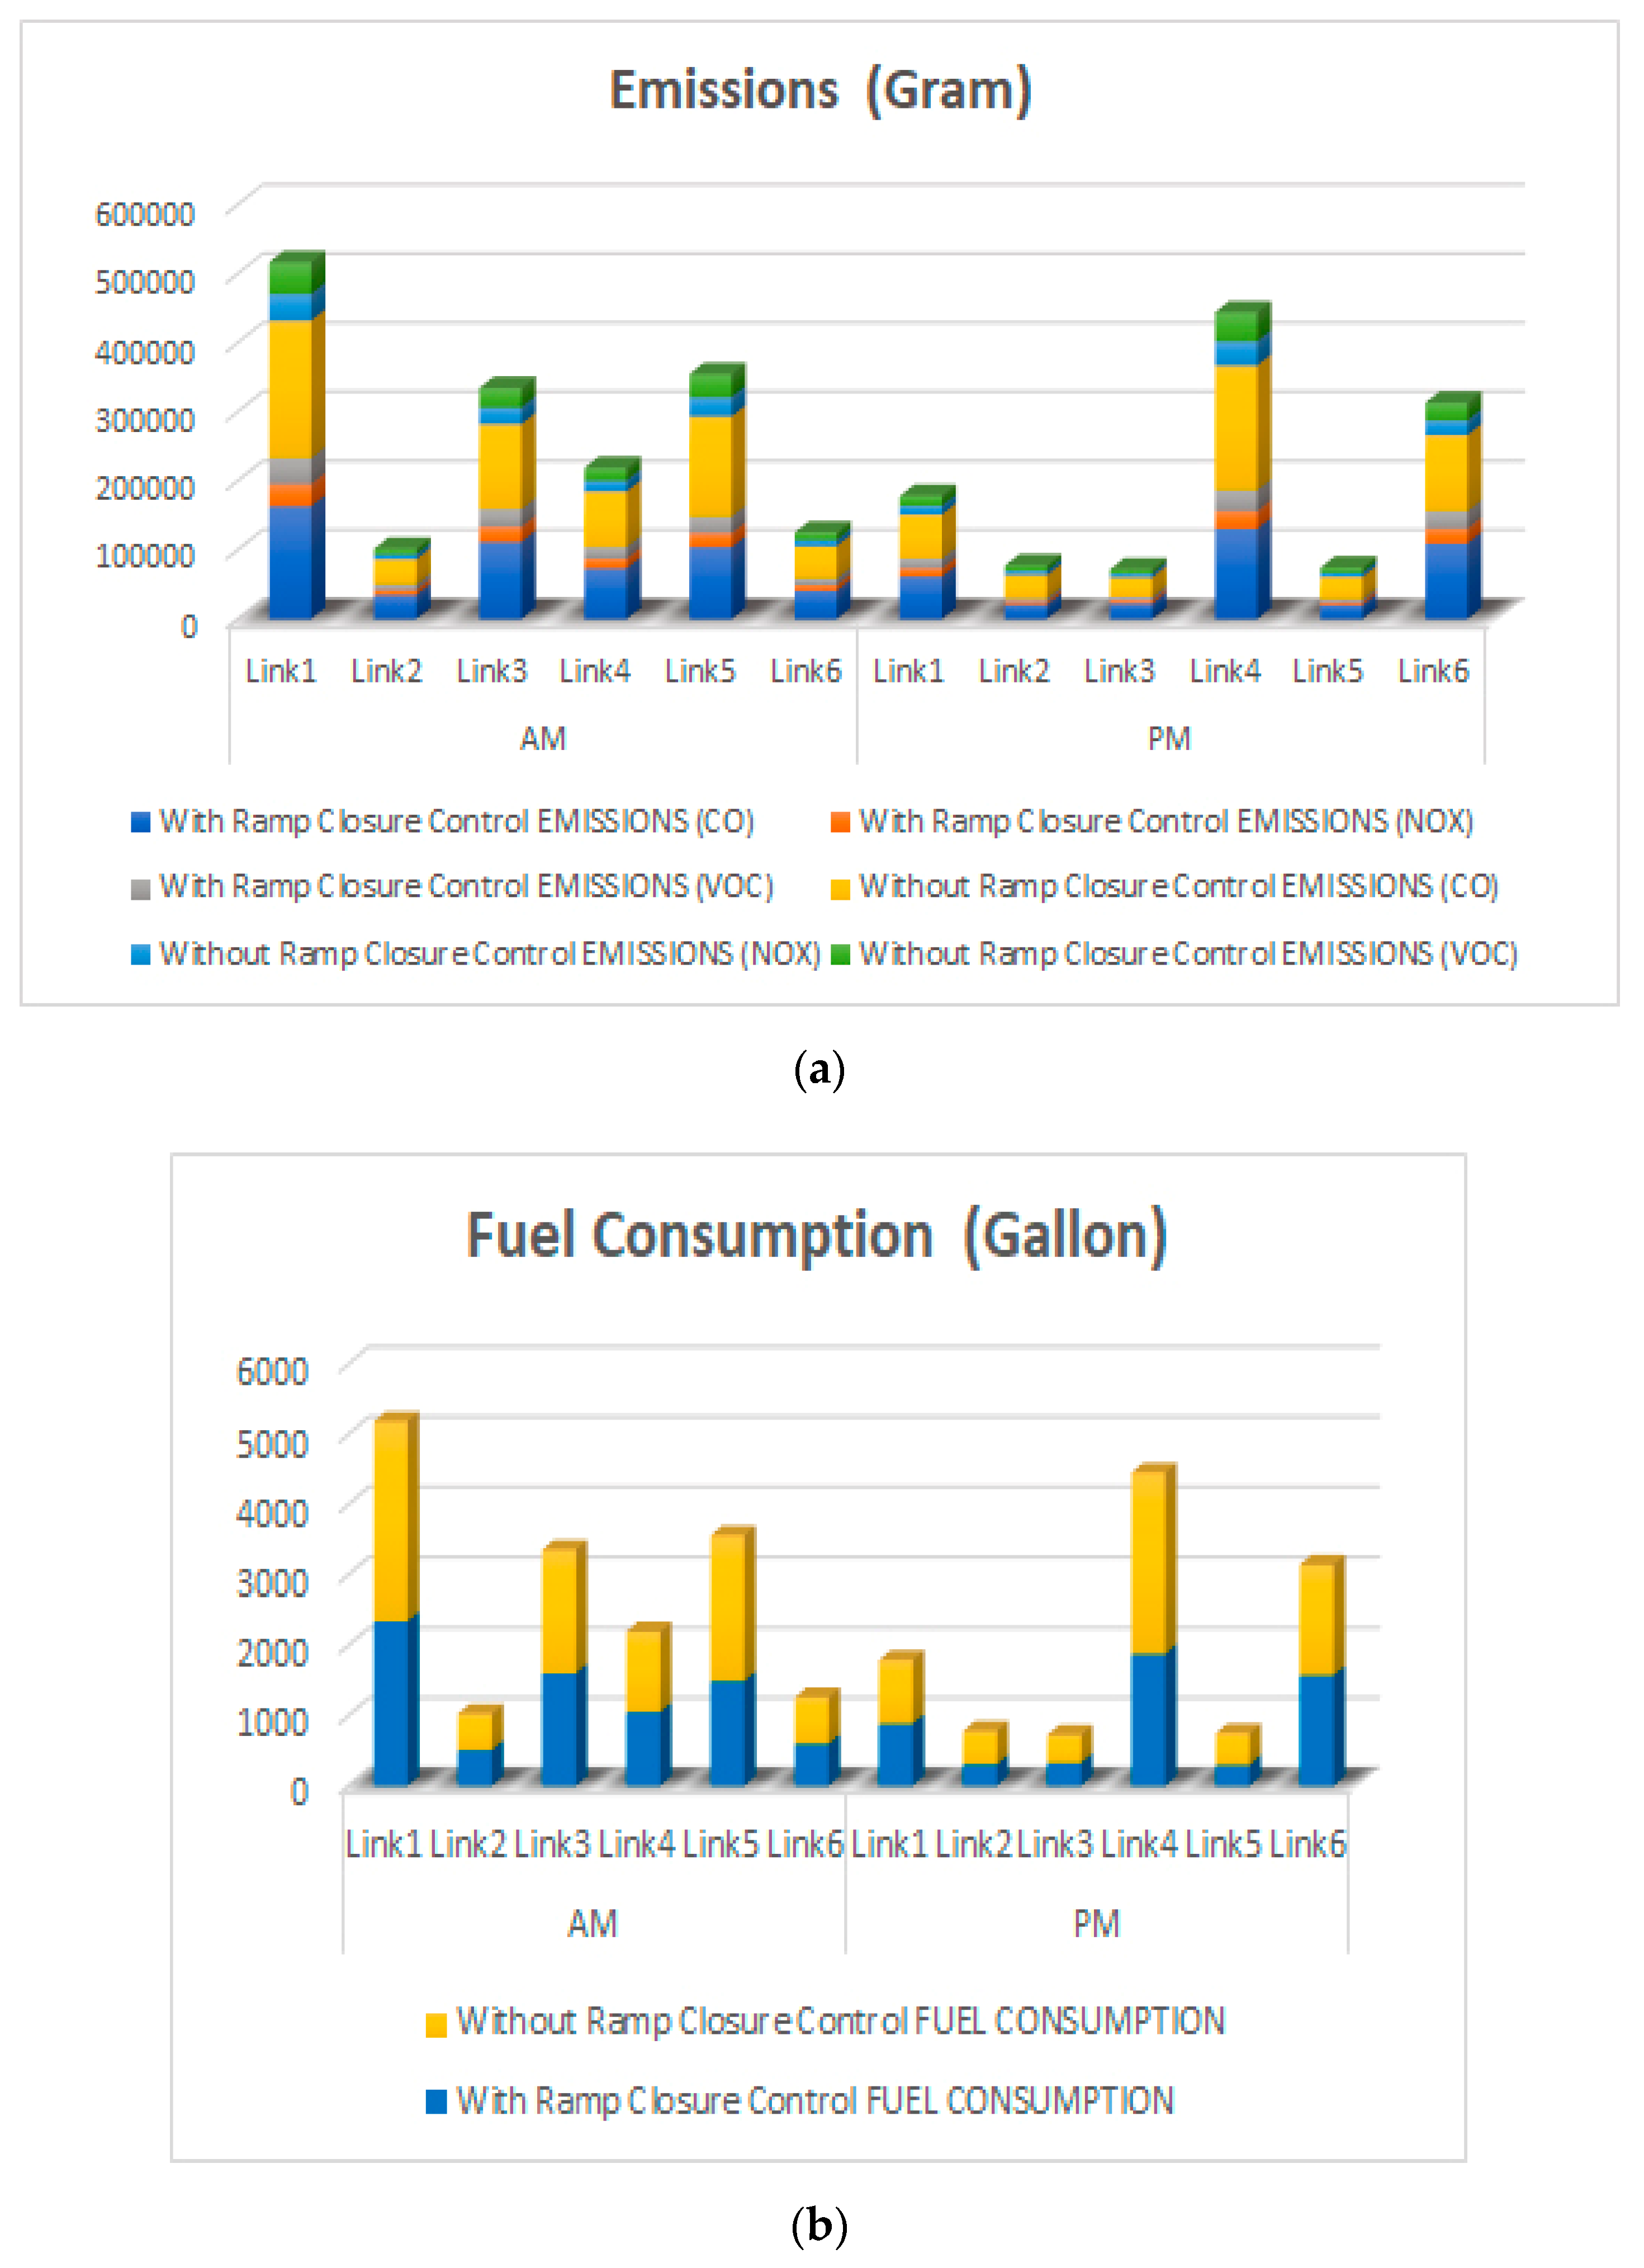
Traffic volume and traffic composition affected the efficiency of the D-HSR strategy, as the general improvement in mobility (throughput, travel time, and delay) during p.m. hours (where the total traffic volume was high and the percentage of heavy vehicles was less than during a.m. hours) was better than during a.m. hours. However, the improvement in safety and environmental impact (emissions/fuel consumption and number of stops) was higher in a.m. peak hours than in p.m. peak hours. Traffic volume affected the efficiency of the D-RC strategy, as the general improvement during the a.m. in all MoE (where the total traffic volume was higher than the traffic volume during p.m. hours) was better than during the p.m., except for the bottleneck throughput.
The results also showed that the NPV was positive for D-HSR and D-RC strategies and equal to $72,798 and $300,625, respectively, and the B/C ratio was found to be 1.53 and 3.2 for D-HSR and D-RC, respectively. This indicates that the economic evaluation has proved the feasibility of these strategies during non-recurrent congestion.
6. Conclusions and Future Work
A detailed microsimulation analysis was performed for two ATM strategies under non-recurring congestion patterns: D-HSR and dynamic ramp closure. These ATM strategies showed positive impacts on traffic operation, safety, and environmental impact.
Studying different types of traffic incident management strategies that are ITS-based requires the agency deploying these strategies to carefully consider the objective, scope, and choice of the best strategy and its feasibility before its deployment. Moreover, the success of ATM strategies mostly depends on the driver’s understanding and behavior in adhering to the ATM method applied.
The simulation analysis for using D-HSR and D-RC under non-recurring congestion shows positive impacts on traffic operation, safety, and environmental effects. Moreover, the economic evaluation has proved the feasibility of these strategies.
To this end, with the increase of different types of traffic incident management strategies that are ITS-based, the agency implementing these strategies has to carefully consider the scope and objectives while choosing the best strategy, as well as its feasibility before deployment.
The success of ATM strategies depends on the driver’s understanding and behavior toward the applied ATM method. Therefore, as future work, we intend to study the driver’s response to the implementation of these strategies. We also plan to develop practical guidelines, recommendations, and frameworks to select the best strategy depending on different contexts. This will help traffic managers and decision makers decide on the optimal integration of innovative and novel methods for handling traffic incidents with existing traffic management practice.


