1. Introduction
The environment is facing a constant threat of pollution and environmental issues due to the rapid growth of the population, man-made activities, industrial facilities and continuous urbanization and industrialization around the world [
1,
2,
3,
4]. Urban areas and natural resources are being polluted with huge amounts of waste produced by either inhabitants or industrial facilities. Such issues have contributed to the usage of sensor networks for environmental surveillance to constantly monitor the environment and detect pollution and its sources. With the emergence of sensor and internet technologies, the computer-based environmental monitoring is becoming more and more popular [
5,
6]. Although monitoring systems and networks have recently been developed and consolidated for environmental monitoring, only a limited number of types of pollution have been monitored and studied with such systems. Moreover, the use of sensor networks to monitor the environment relies on the development of appropriate infrastructures, which in turn incurs a significant financial cost. The sensors cannot be available everywhere and are not always able to collect the detailed waste pollution data as well as manual observations. There is a need for the ability to get a very clear understanding of the environment being tracked in a cost-effective manner.
The growing knowledge of environmental pollution and the effect of pollution on human wellbeing has contributed to a need for increased research into participatory environmental conservation. Goodchild [
7] indicates that a form of sensor network, and in several respects the most important one, consists of humans themselves, each fitted with a certain functioning subset of the five senses and the intellect to collect and analyze what they observe. The author argues that the citizens together form a huge sensor network, where they can observe and sense their environment, and produce and share large quantities of real-time geospatial data of pollutions that are not easily remotely sensed. By viewing the citizens as sensors, Goodchild [
7] considered volunteered geographic information (VGI) as a case of citizen-generated geographic content. Considering humans (people or citizens) as sensors provides a type of collective or participatory environmental sensing. Gouveia et al. [
3] argue that the pollution data generated by responsible citizens are primarily based on their human senses. For example, the five traditionally recognized human senses are able to observe and identify the presence of industrial waste (sight), perceive the smell and recognize the presence of a liquid waste (smell), hear outdoor noise caused by transportation systems (hearing), drink water and detect water contamination (taste), and touch soil and water to recognize contamination (touch). Unlike artificial sensors that can only detect the particular types of pollution in certain situations and locations with a set of fixed instructions, human sensors have the awareness, flexibility and intelligence to reason and identify waste pollution in a real context.
According to Haklay and Servedio [
8], protection of our environment is achieved by public participation, where citizens should be actively engaged in monitoring, protecting and improving their own environment. Johnson and Sieber [
9] argue that local people are obviously closer to the phenomena and familiar with the environmental details, and thus can recognize changes, and report those changes faster than government employees. Citizens are definitely key players in waste pollution monitoring, as they are familiar with the environment and the problems around them better than somebody else and provide a rich source of updated information. In other words, citizens are those who will be affected by the consequences of any waste pollution problem and have to live with the problem. In reality, citizens often have varying degrees of understanding, perception, concerns and attitudes about environmental problems which affects the way they contribute geographic waste pollution data. Human sensors who act as observers could be combined with an artificial sensor to improve accuracy and provide a comprehensive and effective real-time waste pollution monitoring system. Artificial sensing in conjunction with human perception capabilities provides a more complete source of data. More and more people are equipped with smart phones and tablets equipped with artificial sensors. Embedded sensors such as cameras, microphones, and GPS receivers make smartphones attractive devices.
The involvement of citizens in pollution monitoring and decision-making in the context of waste management is seen as an increasingly important step toward environmental protection [
3,
10,
11,
12,
13,
14,
15,
16,
17,
18]. However, there still remains the problem of how to effectively use this citizen-contributed information for waste pollution analyses and decision-making processes. Kiker et al. [
19] argue that the growing volume and variety of information used for environmental decision making and the limited processing ability of decision makers to interpret and synthesize that information highlights the need for employing decision support systems/tools. They suggest that multicriteria decision analysis (MCDA) approaches can be used to establish a decision-making structure that is valuable for environmental decision making. The integration of MCDA and GIS capabilities offers an effective tool for waste management and decision making [
20,
21,
22,
23,
24,
25,
26,
27]. The key reason behind the convergence of GIS and MCDA is that these two fields of research can supplement one another. While GIS is widely known as an efficient and interactive tool with specific capabilities for processing, managing, evaluating and visualizing geographically referenced information for management and decision making, MCDA allows for organizing decision problems, defining, assessing and selecting alternatives [
28,
29,
30,
31].
There has been a considerable growth of literature on the usage of GIS-MCDA in the waste management context [
32,
33,
34,
35,
36,
37,
38]. For example, Feo and Gisi [
35] used a GIS-MCDA procedure as part of a solid waste management system for the site selection of landfills for disposal of hazardous waste materials. Sharifi et al. [
39] presented a GIS-MCDA tool for the determination of optimal landfill sites in Kurdistan Province, Iran. They used GIS and MCDA tools for screening the land alternative sites and identifying the most suitable sites based on experts’ opinions, respectively.
The present study involves developing a volunteered geographic information-based (VGI) decision support system for waste pollution management. It integrates VGI, GIS, and MCDA into a web-based tool for public participation in waste management processes. The system can utilize and analyze citizen-contributed waste pollution data to support decisions that will help improve waste management process. The fundamental motivation behind incorporating VGI into a GIS-MCDA framework is that VGI offers a potential solution for participatory and detailed collection of waste pollution data and can be used as an effective information source during the waste-related decision analyses.
The remainder of the paper is described as follows.
Section 2 provides an overview of the environmental geographic information trends.
Section 3 demonstrates the proposed VGI-based environmental decision support system. In
Section 4, a prototype implementation of the proposed system is provided.
Section 5 discusses the strengths and limitations of the system. Finally, concluding remarks and future outlooks are given in
Section 6.
2. Environmental Geographic Information Trends
A review on the evolution of environmental information will be helpful to recognize the usability of VGI for waste pollution management and decision making. Haklay and Servedio [
8] suggest three generations of environmental data or information according to the role of the experts and the public in information use and production. The first generation concentrated exclusively on authoritative information generated by experts/government organizations for use by them and it was not accessible to the public. In the second generation, the accessibility of environmental information to the public has been highlighted. This generation is characterized by the opening up of environmental data, information and knowledge to the public, with the assumption that environmental information was still produced by specialists and scientists. Now, in the third generation, public can not only consume information but also contribute and produce new environmental information. This era supports participatory information generation, collective intelligence exploitation and information sharing for environmental problems. These problems are best recognized and solved with the involvement of concerned local citizens.
Another trend of environmental information could be discussed based on trends of geographic information mainly from the viewpoint of technological evolution (see
Figure 1). This evolution is adapted from the technological progress of geographic information [
40]. Environmental geographic information has a long history that originates from the traditional environmental paper maps. The second generation of environmental information simulated the traditional paper maps, automating the production and use of maps in the digital world. With the shift from static paper maps to dynamic digital maps and geographic databases, GIS-based environmental applications became prominent. As time went on, GIS became one of the most applied computer-based tools for storing and manipulating environmental data.
Web-based tools opened innovative options for the use and collection of environmental geographic data in a participatory context, changing the model of data collection and use from an expert-driven, time-location limited (certain places and time periods), and closed process to an open, asynchronous, disseminated, and collaborative process [
41,
42,
43]. As the web was developing rapidly and becoming the primary source for information seekers, accessibility to data and information was significantly enhanced. With providing web contents that are accessible, user-friendly, and available to the widest possible range of users, digital environmental geographic information has evolved into web-based geographic information, through which use of environmental data in everyday life was significantly improved. The location- and time-distributed setting of the web offered not only flexibility in the use and collection of environmental data anywhere and anytime, but also provided easy and fast access to the information.
While the early web facilitated the use of environmental geographic data by providing online GIS tools, there was little in the way of user interaction, communication, and contribution in the environmental data production process. Web 2.0 technologies shift web applications from a perceived information display medium that provides web content to many people through websites, to a fully interactive platform that allows collaboration. The rise of Web 2.0 and its related technologies has had a significant impact on the recent evolution of GIS. This advancement has led to the development of Geospatial Web 2.0, which is an evolution of web GIS that focuses on public participation and interaction in geo-spatial systems [
44]. This evolution was characterized by increasing the usability of GIS tools for non-specialists, facilitating wider community usage of GIS technologies and taking advantage of the collective intelligence of the web, building participation-oriented and user-centric GIS platforms, and developing spatial mashups (geo-web services) [
44,
45,
46]. Web 2.0-based GIS enables two-way interaction; that is, a read-write web through which users generate and consume geographical information. Goodchild [
7] argues that VGI is a potential application of Web 2.0 technologies in a geographic context. The author suggests that, first and foremost, VGI is used as a consequence of the growing number of interactions allowed by the emerging human network. Access to the relevant Web 2.0-based GIS tools anyplace and anytime by a human network has remarkably enhanced their level of engagement in using and producing environmental information.
The growing and widespread use of smart phones equipped with artificial sensors such as Global Positioning System (GPS) made them a popular tool for environmental geographic information use and mapping [
47,
48]. The movability capabilities that these apps have and the ability to obtain position information in real time by using GPS turned digital environmental geographic information into mobile geographic information [
2,
49]. The mobile devices allow volunteers to report waste data based on their current location. According to Malczewski and Rinner [
28], web-based GIS tools could provide location-based or location-aware services adapted to the smaller screens of cell phone devices, where one can generate geographic data while they are on the move. Goodchild [
7] suggests that GPS has opened a number of interesting opportunities for VGI activities, such as the production of maps by walking, cycling, or driving. Consequently, a mobile devices equipped with GPS could potentially create appropriate opportunities for participatory waste pollution data collection and monitoring.
Beyond digital, mobile-, and web-based environmental spatial/geographic information, the recent technology, called Ubiquitous GIS, allows for using the environmental geographic information that exists anywhere and anytime. Ubiquitous technologies involve a hung number of small computing devices (e.g., mobile devices and sensors) sprayed and embedded in the environment, connected to each other and to networks, to provide information to users anywhere and anytime. The technologies could provide accessibility to pollution data and facilitate the provision of environmental decision-making services anytime and everywhere in a context-aware manner. Lee [
50] argues that in the ubiquitous geographic information era people should not be only passive consumers but active participants in generating information. The use of environmental VGI in ubiquitous GIS as a rich source of information enhances the services that are to be delivered to users anywhere and anytime. Ubiquitous capture and use of environmental data anytime and anywhere requires active public participation.
3. VGI-Based Environmental Decision Support System
The proposed environmental decision support system synthesizes the capabilities of GIS, MCDA, and VGI to develop appropriate spatial analysis and decision support tools for waste management and decision making (see
Figure 2). Web technologies provide a distributed, publicly available, asynchronous, and interactive platform for waste pollution monitoring and decision-making processes. VGI provides a powerful data source for GIS-MCDA analyses in waste pollution management. Unlike traditional GIS-MCDA methods which involve the use of authoritative, governmental, and static data sources, VGI-driven GIS-MCDA employs detailed, dynamic, and real-time data to support decision-making process [
27,
51,
52]. The waste pollution data contributed through a web-based GIS-MCDA can be analyzed to better support pollution management, planning, and decision-making processes.
3.1. Geo-Referencing of VGI
Geo-referencing of participatory waste pollution data is critical in the GIS-MCDA process. Using a map-centered tool, citizens can take into account different dimensions of waste pollutions and generate relevant geographic data. The map-centered tool holds waste pollution concerns as the messages and comments on the map, which allows for graphical tracking of different solid and liquid waste pollutions via an annotated map. The tool allows citizens to utilize geographic data types (e.g., pints, lines, and polygons) for determining the location, area, and shape of pollution spots and link them to videos, pictures, or text. A waste pollution can be associated with multiple locations and a location can be associated with multiple types of waste pollutions.
A number of approaches can be used for geo-referencing or determining the precise location of waste reports on the map. First, manual location finding requires zooming and searching on a map until finding where a pollution point is located. The place-based approach uses a search tool to locate the place names. This approach does not identify an exact location but is useful for those who need to report an area (district) as a waste pollution problem. Second, geocoding-based search finds locations of pollutions based on addresses. This method creates features that represent the locations of the addresses. For example, if a citizen knows the address of a pollution spot and want to put it on a map, they can use geocoding to find the coordinates.
Third, geo-referencing of waste could be automatically performed using a number of positioning technologies. One of these technologies is Location-Aware Browsing (e.g., Google Location Services) which determines the location of citizen by gathering information about nearby wireless access points and citizen’s IP address. The browser sends this information to a geolocation service provider, e.g., Google Location Services, to get an estimate of citizen location. GPS is another technology that could be used for determining the locations of pollution spots, where people can generate real-time geographic reports of waste pollutions depending on their current location determined using GPS. This technique is particularly beneficial for citizens who need to utilize smart phones to determine the location of a waste pollution in outdoor environment. Similarly, a variety of indoor positioning techniques could be used for reporting waste pollution locations in indoor spaces. There are a number of techniques for indoor positioning, such as Wi-Fi, Bluetooth, and ZigBee approaches. These techniques can be employed by those of citizens who need to submit reports of waste pollution problems in an indoor environment.
3.2. Spatial Analysis
The spatial analysis can be used to model and examine the locations, attributes, and relationships of waste pollutions through analytical and computational procedures to acquire relevant information/knowledge for pollution management or decision making. It involves a range of techniques to synthesize and analyze user-generated waste pollution data, discover patterns of waste pollutions, reveal spatial relationships between waste locations, predict and estimate environmental pollutions based on VGI. The outcomes of spatial analyses rely on the locations of the citizen-generated waste pollution data.
Figure 3 shows a couple of examples of VGI-based spatial analyses for waste pollution management. For example, environmental managers may need to know the reported pollution spots within 1000 m from rivers, the nearest source(s) of pollution to the reported waste spots as the causes of pollutions, discover spatial-temporal patterns, spreads and trends of waste pollution (e.g., hospital waste), trace the sources of reported pollutions on the network (e.g., the stream pipeline networks), calculate the density (or hot spots) of pollution spots, find the common areas of any two selected polluted areas reported by two different people, and aggregate pollution spots by creating polygon features around clusters of proximate pollution point features.
3.3. GIS-MCDA Tools
With respect to the management of waste pollution, VGI-based GIS-MCDA tools have the potential, for example, to identify the optimal sites/locations for garbage bins across city, determine the best site(s) for waste disposal, generate pollution risk maps, and find the best route for garbage trucks to collect waste based on the user-generated geographic pollution information (see
Figure 4). These waste decision problems can make use of the VGI as the data source for one or more criteria, which can be combined with the corresponding weights using a MCDA rule to evaluate alternatives (e.g., the candidate locations for putting garbage bins across the city). In other words, these tools could integrate VGI and the citizens’ or decision makers’ preferences to produce information for waste management. The high-volume, dynamic, rapid, distributed, local, and open nature of VGI provides effective decision analysis results, for example, about the locations of garbage bins. Obviously, the main purpose of VGI-based GIS-MCDA is to enhance waste management and decision making using user-contributed pollution information.
In the GIS-MCDA part of the system, we considered only site suitability analysis as a type of waste management decision problems. It involves selecting the best alternative (e.g., garbage site) from a set of predefined alternatives depending on the criteria and preferences of decision makers (e.g., local citizens and municipal managers), where citizen-generated geographic data of waste pollution is considered as one of the criteria for evaluating the alternatives. To this end, the system uses a GIS-based decision rule that involves two-stage procedures: (1) the MCDA decision rule for assessing and generating rankings of the alternatives based on individual preferences, and (2) the group rule to produce the group rankings of alternatives by summing up the individual rankings [
53,
54]. The MCDA decision rule involves combining relevant criterion values and individuals’ weights using weighted linear combination (WLC) to generate the suitability score for the alternatives.
where
aij is the standardized value of
i-th alternative with respect to the
j-th criterion,
wj is the weight of
j-th criterion, and
Ai is the overall score of
i-th alternative. Accordingly, each of the individual decision makers generates the individual orderings of the alternatives according to the scores.
The individual rankings can be combined into the group rankings through the group rule [
53,
54,
55,
56,
57,
58,
59]. Previous studies suggest that MCDA-based voting models provide an effective method for spatial decision making [
60,
61]. In this study, the Borda count [
62] is used as the group decision rule. With the individual rankings of alternatives and their pairwise comparisons, one can obtain the individual preference set. According to pairwise comparison between
Ai and
Ap, the
p-th alternative gets 1 point if
Ap is favored over
Ai, and 0.5 if there is no difference between the two alternatives based on the decision maker’s opinion.
The score
G (
Ai,
Ap) represents the number of decision makers/individuals who specify the alternative
Ai better than
Ap, but
G (
Ap,
Ai) indicates the number of decision makers who have the reverse favorite. The overall scores obtained by
Ai against
Aj (and vice versa) are presented in a table (see
Table 1). This table is inversely symmetric:
G(
Ai,
Ap) = the total number of individuals—
G (
Ap,
Ai). The Borda score of alternative
i,
G (
Ai), is computed by summing its group scores; that is:
Figure 5 demonstrates the conceptual structure for the group GIS-MCDA via an example. As illustrated, three individuals generate individual decisions (rankings) for three alternative garbage container sites according to their individual preferences and then the Borda method computes the group ranking for the alternatives.
Table 1 shows the Borda score and the corresponding group ranking for the three alternatives. The best (consensus) garbage container alternative site is characterized by the highest Borda score.
4. Prototype Implementation of VGI-Based Environmental Decision Support Tools
A prototype implementation of the VGI-based decision support tool was developed. The prototype is a web-based application developed with the ArcGIS server, Microsoft SQL server, and Java Script.
Figure 6 depicts the architecture of the proposed system. The architecture consists of four layers of users, a graphical user interface (GUI), analysis, and data. Users can be either contributors (e.g., volunteer citizens) or decision makers. Dedicated contributors who act as geographic sensors use their own five sense as well as smartphone artificial sensors such as a camera, GPS, and voice recorder to measure and report a variety of waste pollutions. Environmental decision makers/managers treat citizens/residents as a disseminated set of sensors and use their VGI to support waste management decision-making processes. The detailed, rapid, disseminated, local, immediate, and public nature of VGI provides effective decision analysis results for pollution-related decision and planning analyses. The VGI can be effectively used by spatial analysis and MCDA tools to produce useful information for waste pollution management.
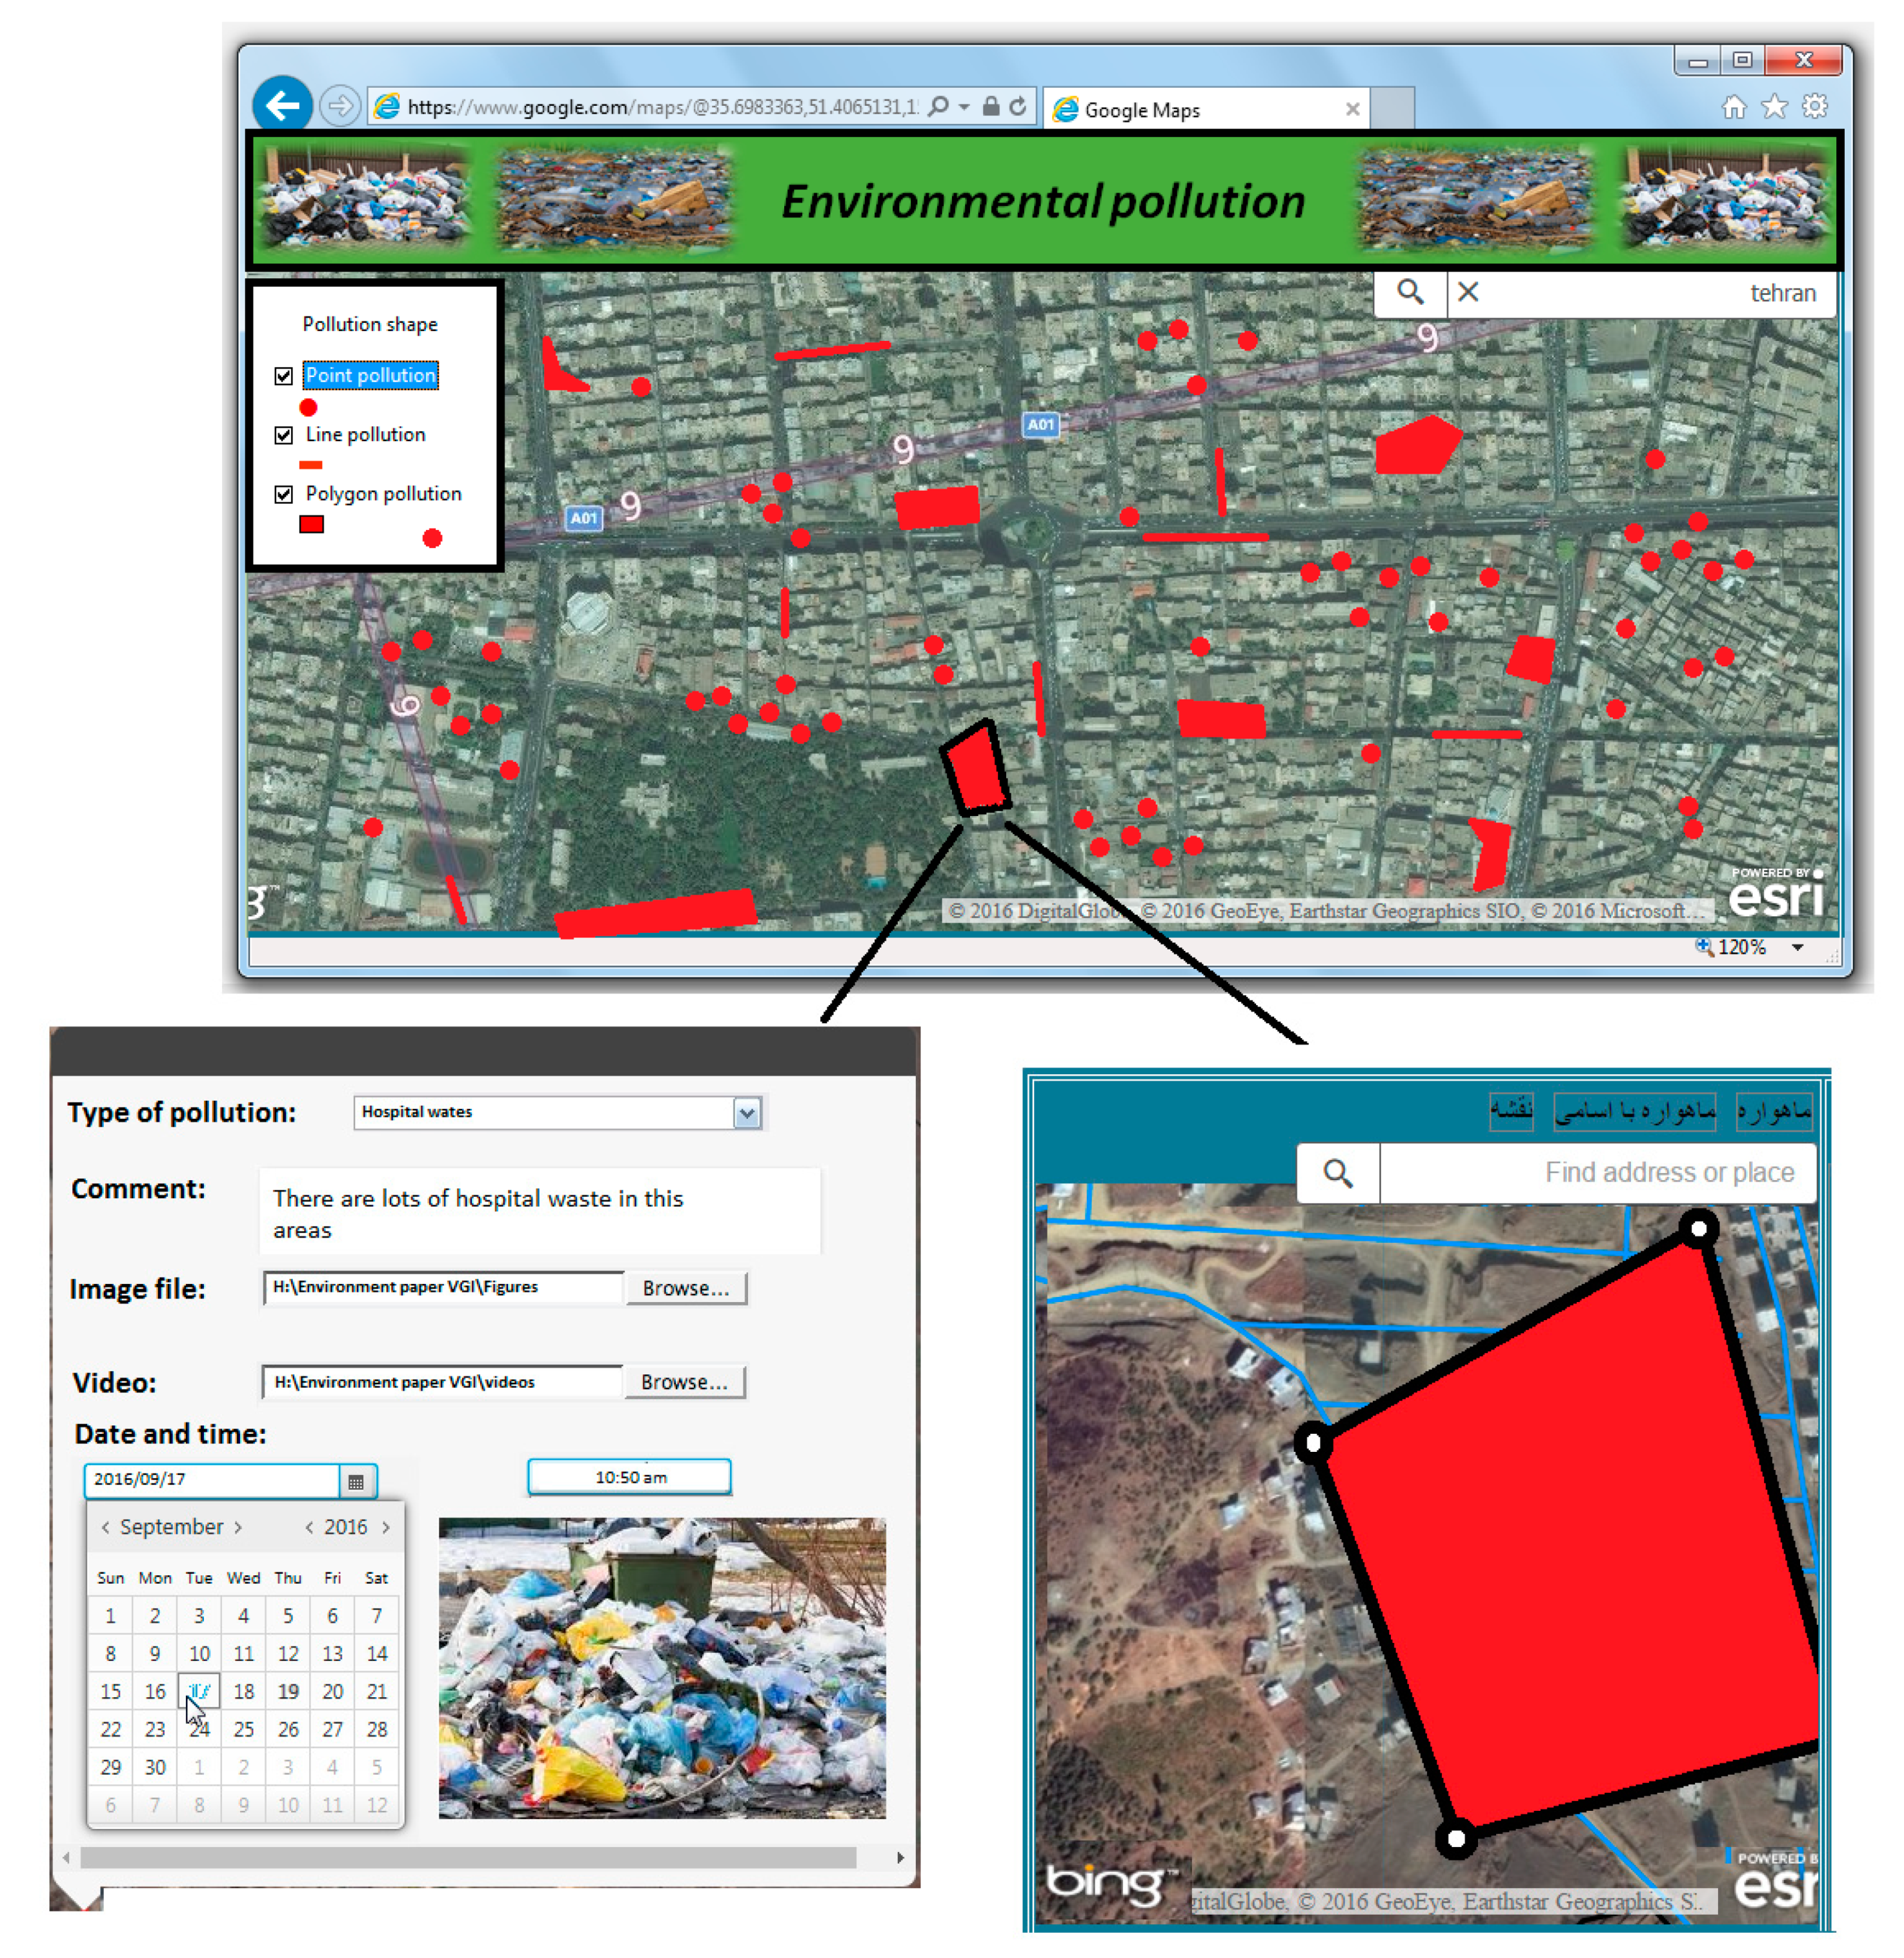
Depending on the people using the system, the system offers different GUIs. The GUI for volunteer citizens provides map-based tools to generate geographically referenced reports of pollutions including location, text, photo, sound and video clips about a particular waste pollution (see
Figure 7). Multiple types of pollution can be referred to a location and the same types of pollution can be associated with a number of locations by the same or different volunteers. Registered users may create and exchange their own pollution-related geographic information using a single interactive map. In other words, the system allows users to specify different location markers on the map with a particular time and date, relate additional information including videos, photos, or text related to the locations, and turn different pollution layers on and off.
The system uses different types of GIS layers. It provides Web Feature Services (WFS) layers, which allows users to have direct access for reading, writing, and updating waste pollution data. It also includes the Web Map Services (WMS), Bing, and Google Maps as the background or Basemap used for locational reference. These maps depict background information such as highways, point of interests, and political boundaries, on which waste pollution data and other WFS layers are placed. Users can add waste pollution information by overlaying them on top of the Basemap. This maps facilitate geo-referencing of the waste pollution VGI.
The analysis layer includes VGI verification and decision support tasks. Typically, the citizen-contributed waste pollution data are identified as differing in quality relative to authoritative environmental data sources, which is a constraint on government adoption for pollution-related decision making and planning [
63]. The volunteers providing the pollution data may differ greatly, from committed and concerned but inexpert and amateur citizens to highly trained and professional citizens. Uncontrolled collection of data can cause concerns regarding its accuracy and usefulness for pollution management and decision making. Consequently, the reliability and quality of volunteered data should be assessed in the analysis layer. Goodchild and Li [
64] suggest a number of methods to assure quality and accuracy of VGI including comparison with reference sources (comparison with source data), crowd-sourcing (the ability of a crowd to identify and correct the errors that an individual might make), social (hierarchy of trusted individuals), and geographic (spatial consistency) approaches. These assessment processes could be performed using either manual or automatic mechanisms. While the manual approach requires one or more experts to inspect, discover errors, and ensure the accuracy of the citizen-generated pollution information (i.e., by direct user contribution), the automatic approach could perform the above approaches with a smaller amount of human interference and effort to verify the quality of data. In this prototype, a manual mechanism is used to detect and remove errors, and ensure pollution data quality.
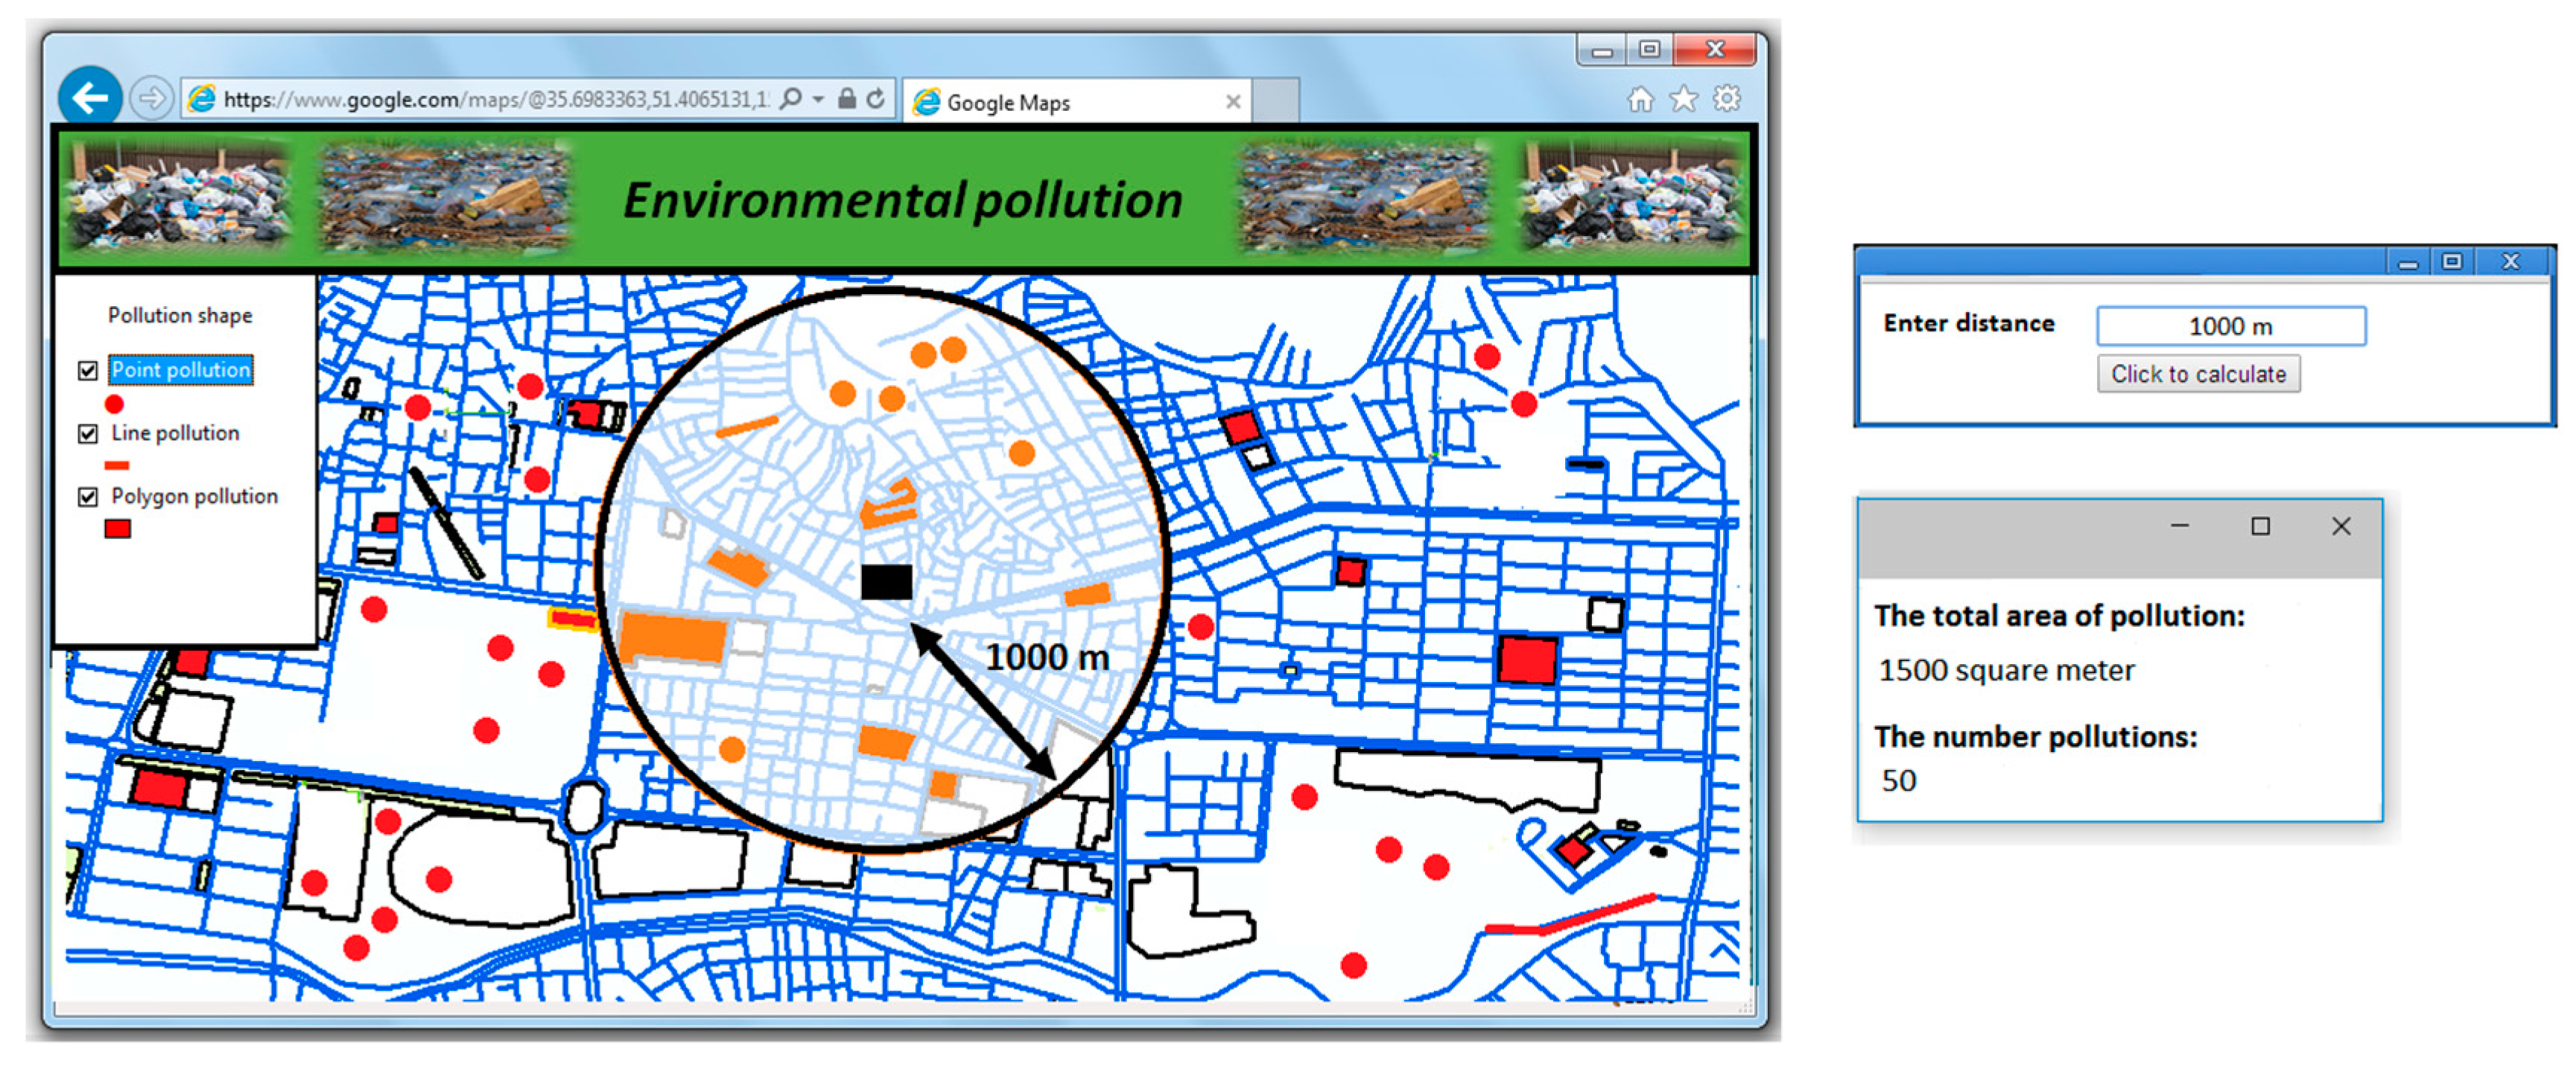
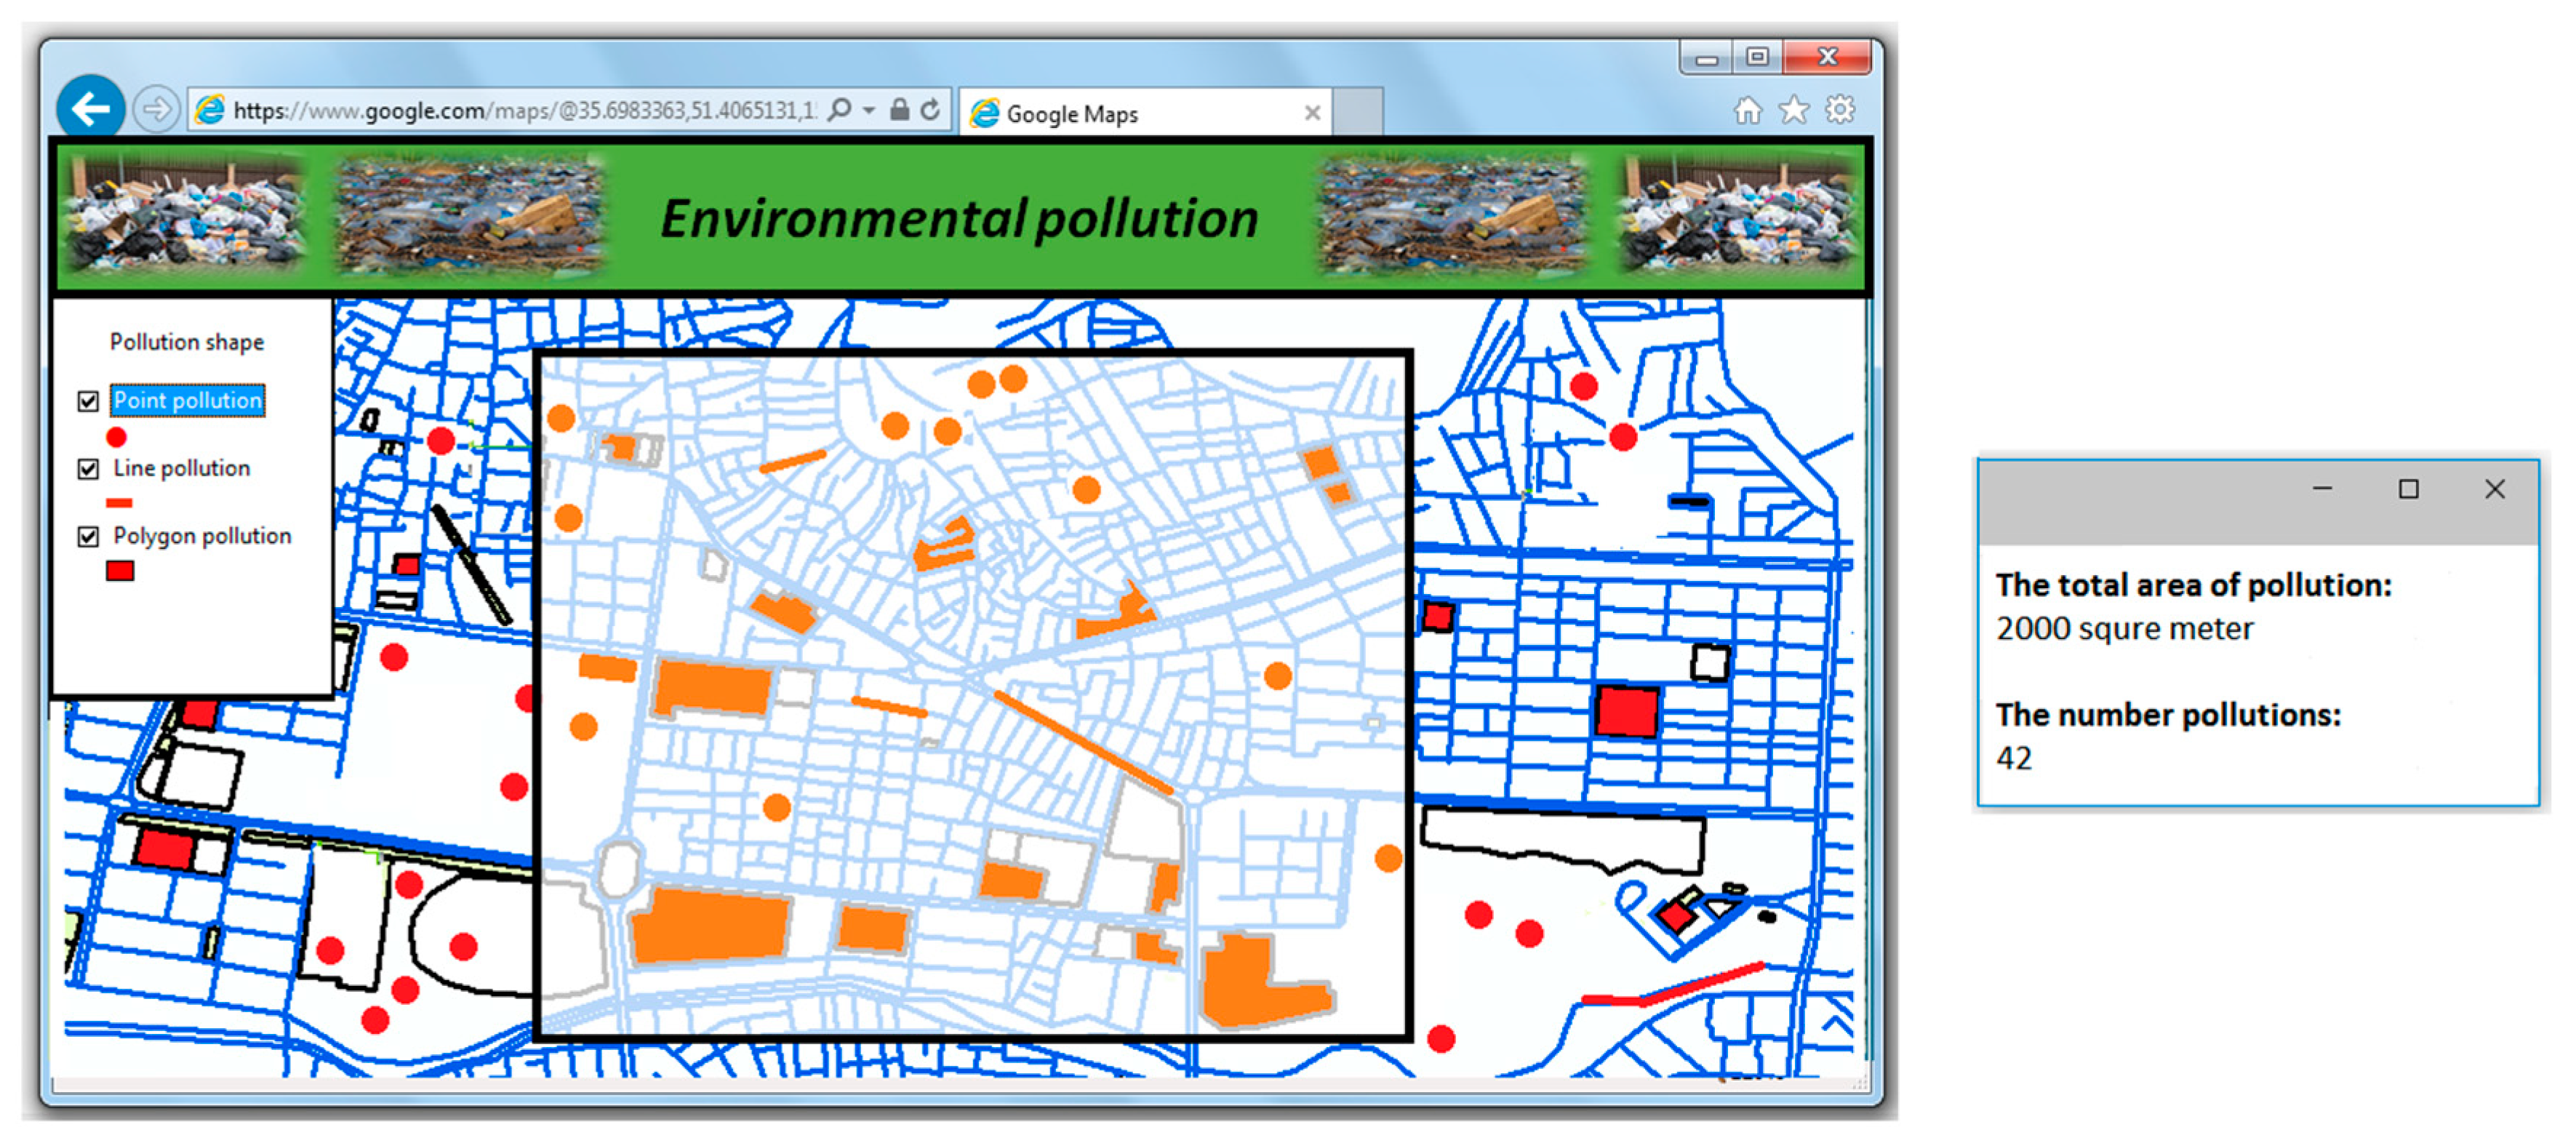
The verified citizen-contributed pollution data can be incorporated into decision analysis processes using the spatial analysis and GIS-MCDA tools (see
Section 3.2 and
Section 3.3). The prototype uses a set of spatial analyses to assist managers and planners in identifying opportunities to improve waste pollution problems. For instance, as shown in
Figure 8 and
Figure 9, land contamination monitoring departments/officers may use one of the tools to determine the locations, number, and total areas of reported pollutions within their district (e.g., 1000 m from their place or a user-specified area). As another example, the environmental protection department can conduct the spatial analysis of nearest distance to find and assign the nearest municipal inspector to a particular reported pollution spot (see
Figure 10).
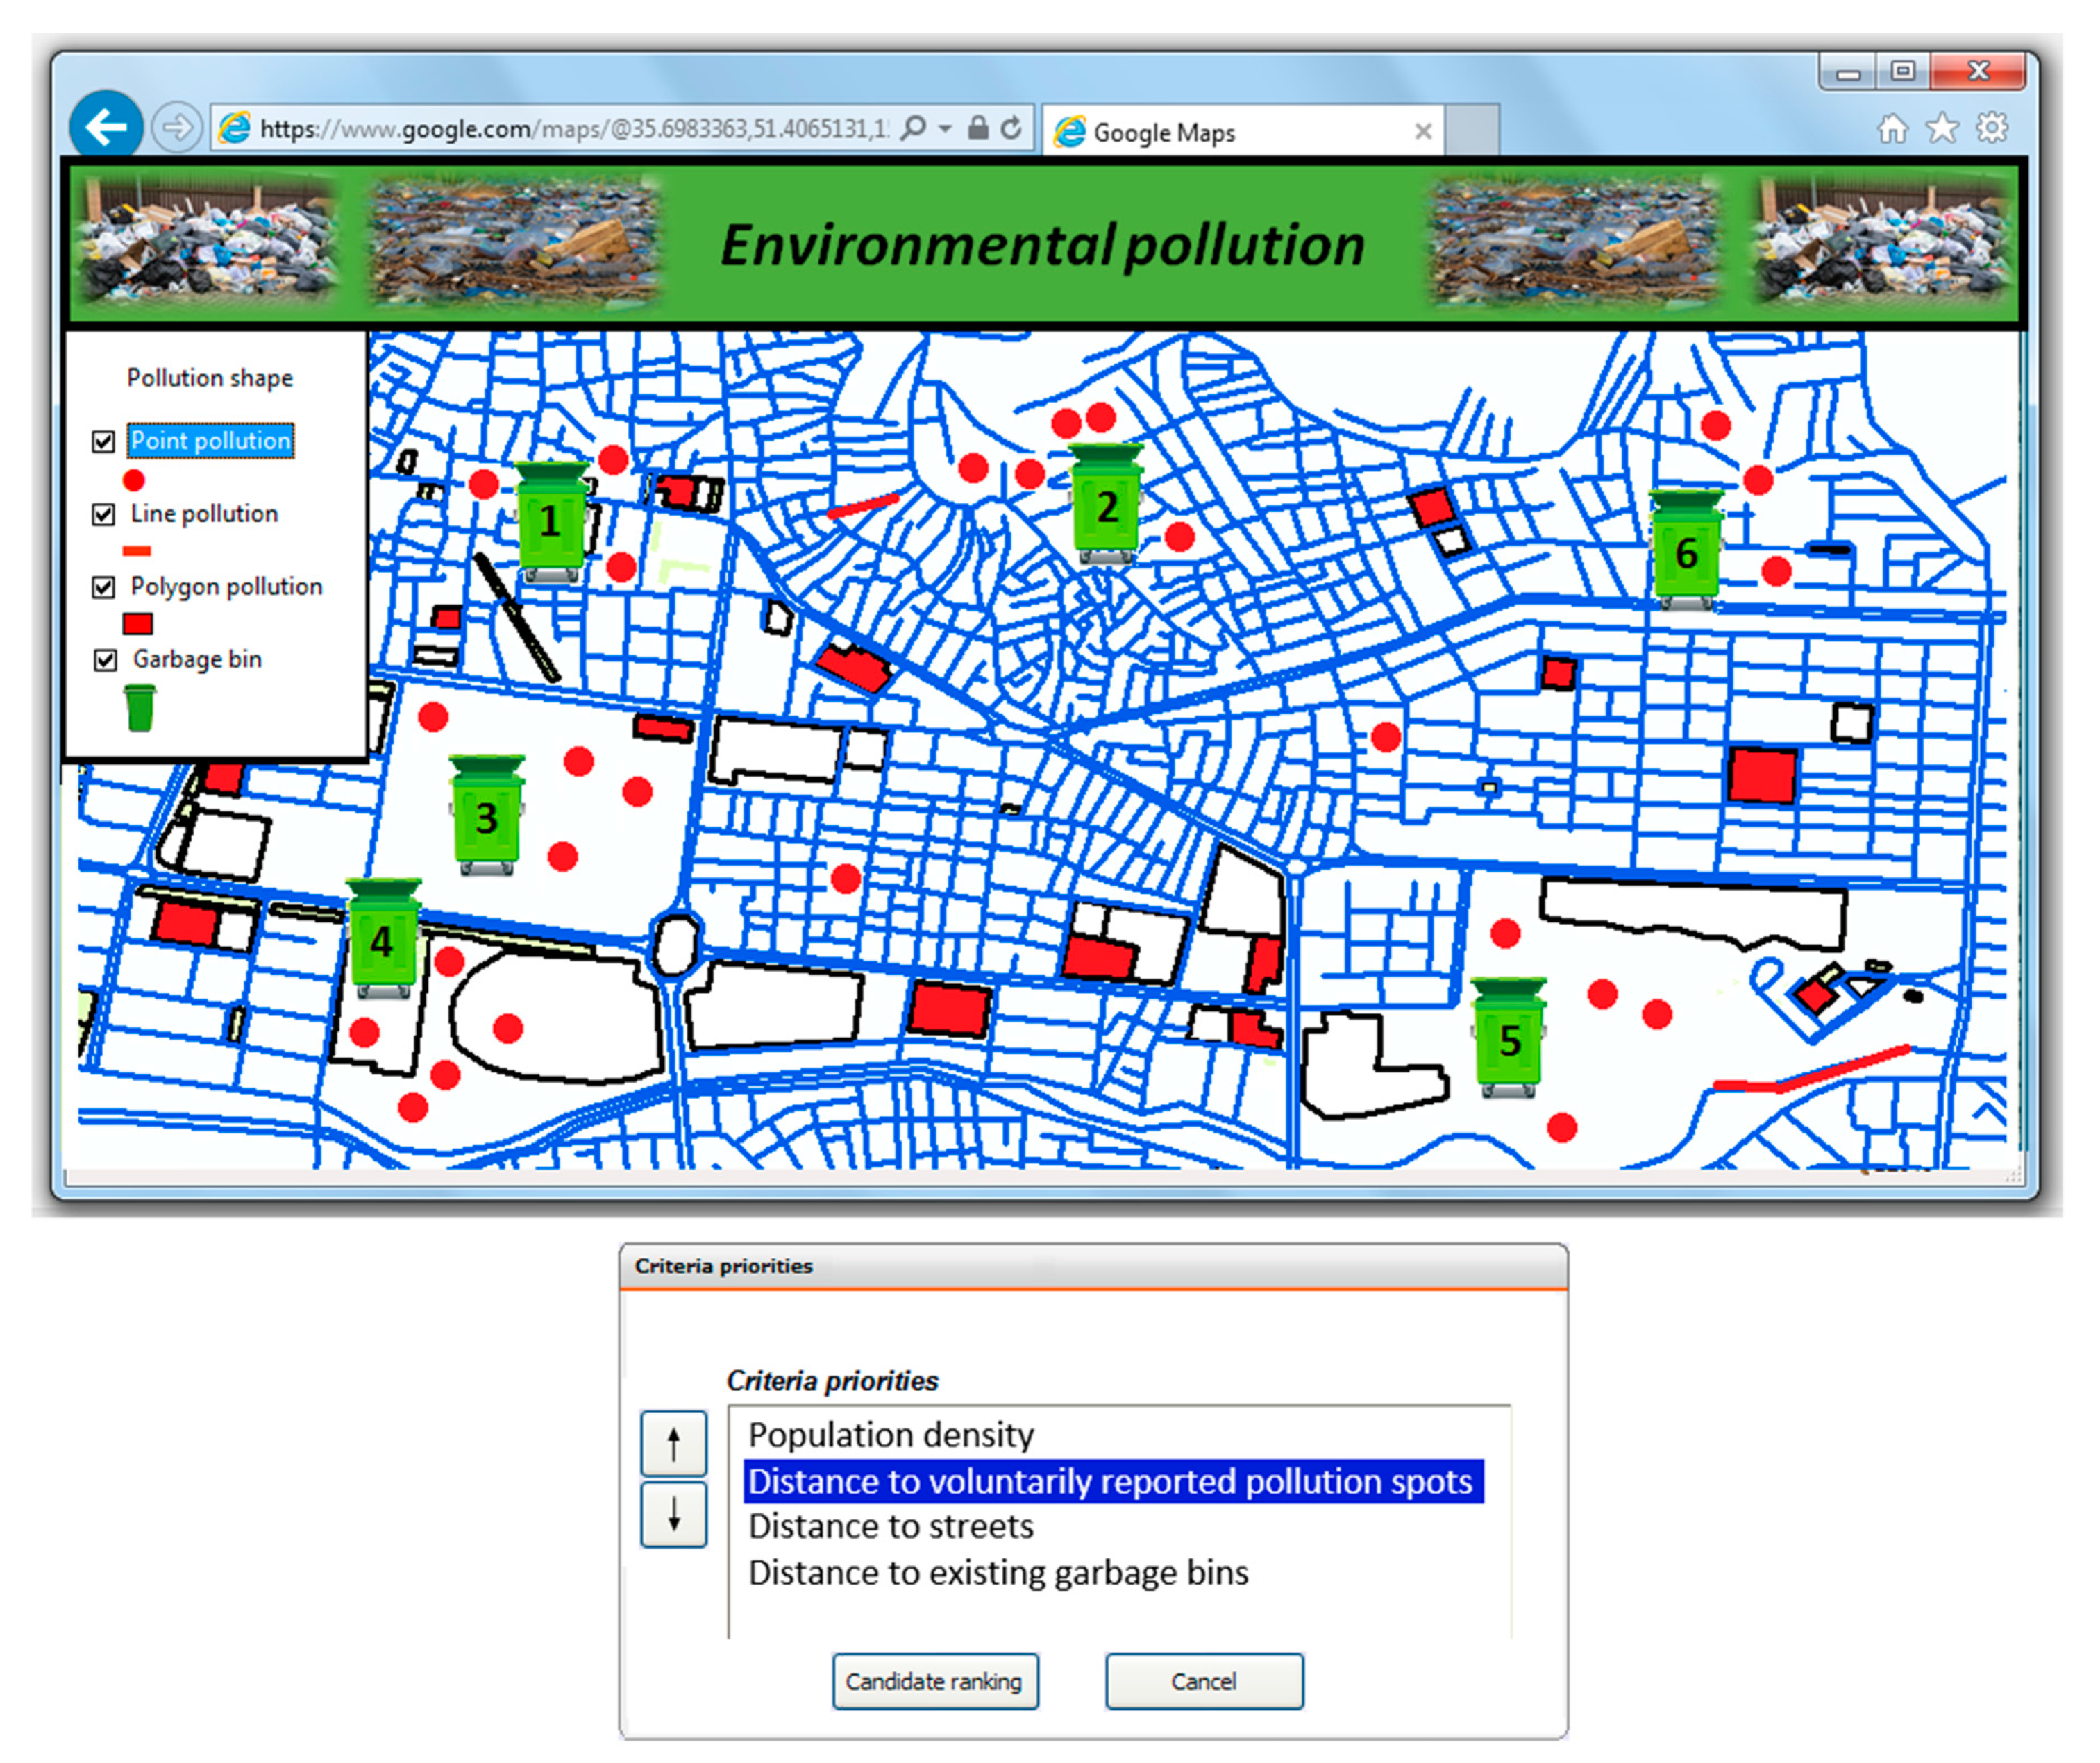
A GIS-MCDA tool was developed to assist in determining optimal locations for new garbage bins (waste containers) to prevent littering on the streets or accumulation of solid waste across a city. Choosing the right place for garbage bins is critical to pollution prevention. The waste management agencies and municipal departments need to easily but efficiently determine the suitable sites for garbage bins. The tool was employed to assess and select the best alternative location(s) for garbage bins according to the criteria, whereby it considers the distribution of reported pollutions as one of the main criteria for determining optimal locations. With the analytical capabilities provided by GIS-MCDA techniques, one can easily and quickly combine the relevant criteria for geographic data, the locations of reported pollutions, and criterion preferences to assess alternative garbage bin sites, and choose the best site.
As shown in
Figure 11, four hypothetical site criteria were used for measuring the suitability score of garbage bin: population density, average distance to voluntarily reported pollution spots, distance to streets, and distance to existing garbage bins. Using the Up/Down arrow keys, citizens (or a particular group of people) choose a higher or lower rank to a particular criterion by moving it up or down, respectively. Once the individual preferences have been specified, the system integrates criterion values and preferences using WLC, and represents the alternative orderings on the map. Finally, users can observe the group rates of candidate garbage bin sites, indicating the score, and in turn, the ranking of each site based on the opinions of all decision makers who have completed the site suitability assessment procedure.
5. Discussion
The use of VGI and VGI-based decision support tools in waste pollution management emphasizes benefits from an environmental, social, economic, and practical point of view. Citizens can act as intelligent, context-aware, conscious, and reasonable sensors to monitor their environment. They could report a potentially fine resolution of data because most of them will submit observations from areas close to home and/or areas that they know very well. From an environmental point of view, such volunteered sensing, monitoring, and reporting of the pollution spots helps to protect the environment and keep it clean, green, and healthy.
Feick and Roche [
65] argue that the contribution of citizens for producing the geographic data and use has a strong value from a social point of view. They suggest that citizen-generated geographic data can raise a culture of public participation where citizens can explicitly and directly monitor how their viewpoints are reflected in a digital mapping system. Considering the citizens as responsible volunteers in the environmental monitoring process can contribute to collaboration between residents and their governments, which is crucial to the success of environmental protection. In addition, the VGI-based decision support system strengthens the democratic fabric of society. In a democratic community, the privilege of a citizen to participate and vote in environmental decision-making contexts is one of the basic freedoms.
From an economic point of view, a rich source of updated information is freely produced. Citizens could generate a variety of detailed spatial data, geographically referenced notes, pictures, and video clips about waste pollutions. Collecting these data by environmental agencies requires a large amount of money. In addition, if citizens are involved in the waste pollution monitoring and decision-making processes, their comments and concerns may be addressed early in the decision-making process where it might be easier to make improvements. Citizens may suggest cost-effective suggestions about urban plans, for example, locating the best place to establish garbage bins.
From a practical point of view, the integration of VGI and decision support tools provides some advantages. The detailed and volunteered environmental pollution-related information can be used as input for spatial analysis and GIS-MCDA tools for waste management and decision-making analyses. Horita and Albuquerque [
66] argue that VGI, or its integration with conventional data, can be considered as an important information source for spatial decision support systems. It provides updated information which ensures that the correct decisions can be made. Utilizing the visual and analytical capabilities of GIS to store, manage, produce, analyze, organize, and represent citizen-contributed geographically referenced information allows for modeling and tackling pollution-related decision-making problems. Decision makers can use GIS to reveal hidden information, analyze the VGI from different perspectives and summarize them into useful information, extract spatial patterns, analyze spatial relationship, identify problematic areas, and recommend possible environmental solutions. As a decision making technique, MCDA could support environmental decision-making processes by structuring pollution-related decision problems as well as generating, assessing, and selecting the geographic alternatives.
Although citizen
-produced data provide advantages for pollution management and decision making, this data may suffer from an inadequate level of quality [
64,
67,
68,
69,
70]. For example, the quality issues associated with volunteered data include spatial accuracy, topological errors, lack of metadata, different timing of updates, synthetic and semantic heterogeneity, data types and media formats, completeness, information redundancy, complexity in indoor spaces, logical consistency, credibility of VGI contributors, local knowledge, lineage, thematic accuracy, and resolution [
71,
72]. Investigations have been undertaken to introduce a systematic approach for the assessment of VGI [
64,
73,
74]. These investigations involve the above criteria for the evaluation of VGI.
Another limitation of the system is concerned with the generation of waste criterion maps from citizen-produced data. Since citizens subjectively produce a wide variety of waste pollution data with varying levels of spatial and non-spatial details, the automatic creation of criterion maps from all these data is not always a straightforward process. In the proposed system, the map for a particular criterion is generated based on the types of waste. However, extracting the relevant pollution data depending on the criterion may require manual efforts to examine the pollution VGI. This would be more complicated when each individual decision maker defines their own specific criteria, where it is required to examine citizen-produced data in detail and use appropriate ones for every specific user-defined criterion.
More advanced VGI-based decision support systems can be developed by integrating with other technologies, such as Spatial Data Infrastructure (SDI), cloud computing, ubiquitous computing, location-based services (LBS), and ontology, each of which could address a different part of the system. Given the increasing volume of pollution data being produced by citizens, often acquired on a 24/7 basis, VGI-based decision support tools should adopt the capacities of cloud computing and big data processing capabilities for pollution data. Granell et al. [
75] suggest that the main advantage of cloud computing is the delivery of easy-to-use services to the volunteers who are not experts and are unfamiliar with the complexity and technical details of the system. Instead of running GIS on citizens’ computer systems and operations, with a cloud-based GIS, the software and services reside within an infrastructure and are made available through web technologies. Ferreira et al. [
76] assert that environmental monitoring and management systems can be facilitated by new information tools arising with a cloud computing paradigm.
The VGI-based decision support tools could be coupled with SDI for the sharing and exchange of volunteered data and thus provide an appropriate platform for comprehensive and consistent waste management monitoring and decision making [
77]. A combined framework of VGI, GIS, MCDA, and SDI could potentially facilitate the sharing and use of pollution information for environmental spatial decision-making, planning, and management processes. The semantic heterogeneity inherent in VGI creates challenges in the data integration process. Resolving semantic heterogeneity among VGI calls for an ontology-based method, where it provides the ability to interpret the meaning of citizen-contributed waste pollution data and appropriately integrate them [
78,
79]. The integration of VGI-based decision support tools with ubiquitous computing technologies (e.g., ubiquitous sensor networks) provides an effective platform for waste pollution monitoring and decision making. The technologies can provide environmental data and facilitate the provision of environmental decision-making services at any time and everywhere in a context-aware manner.
Finally, the capabilities of VGI-based decision support can be combined with LBS techniques to provide a variety of waste management services to government officers and citizens. The major inspiration for integrating these techniques derives from the need to employ information on the user’s current location and VGI as a real-time dynamically updating data source through a mobile device or smartphone as inputs for decision support. For example, waste-related managers and officers can make use of a VGI-LBS decision support tool in their smart phones to find the locations of the nearest 10 reports of waste pollutions, the reports that are located within 30 min from them, and the quickest way to get from their current location to the pollution spots.


