Review

Urease and Nitrification Inhibitors—As Mitigation Tools for Greenhouse Gas Emissions in Sustainable Dairy Systems: A Review

1
Food Chemistry and Technology Department, Teagasc Food Research Centre, Moorepark, Fermoy, Co. Cork, P61 C996 Cork, Ireland
2
School of Biosystems and Food Engineering, Agriculture and Food Science, University College Dublin, Belfield, 4 Dublin, Ireland
3
Teagasc, Johnstown Castle, Y35 Y521 Co. Wexford, Ireland
4
Food Safety Department, Ashtown Food Research Centre, Teagasc, Ashtown, 15 Dublin, Ireland
5
School of Food and Nutritional Sciences, University College Cork, Gaol Walk, T12 YN60 Cork, Ireland
*
Author to whom correspondence should be addressed.
Sustainability 2020, 12(15), 6018; https://doi.org/10.3390/su12156018
Submission received: 9 June 2020 / Revised: 10 July 2020 / Accepted: 21 July 2020 / Published: 27 July 2020

Abstract

:
Currently, nitrogen fertilizers are utilized to meet 48% of the total global food demand. The demand for nitrogen fertilizers is expected to grow as global populations continue to rise. The use of nitrogen fertilizers is associated with many negative environmental impacts and is a key source of greenhouse and harmful gas emissions. In recent years, urease and nitrification inhibitors have emerged as mitigation tools that are presently utilized in agriculture to prevent nitrogen losses and reduce greenhouse and harmful gas emissions that are associated with the use of nitrogen-based fertilizers. Both classes of inhibitor work by different mechanisms and have different physiochemical properties. Consequently, each class must be evaluated on its own merits. Although there are many benefits associated with the use of these inhibitors, little is known about their potential to enter the food chain, an event that may pose challenges to food safety. This phenomenon was highlighted when the nitrification inhibitor dicyandiamide was found as a residual contaminant in milk products in 2013. This comprehensive review aims to discuss the uses of inhibitor technologies in agriculture and their possible impacts on dairy product safety and quality, highlighting areas of concern with regards to the introduction of these inhibitor technologies into the dairy supply chain. Furthermore, this review discusses the benefits and challenges of inhibitor usage with a focus on EU regulations, as well as associated health concerns, chemical behavior, and analytical detection methods for these compounds within milk and environmental matrices.

1. Introduction

Climate change is one of the greatest challenges facing the modern world with global populations expected to rise to 9 billion by the year 2050, creating further pressure to secure food supplies [1]. Climate change is known to cause many negative environmental effects and is accelerated by, and directly linked to, anthropogenic greenhouse gas (GHG) emissions, including carbon dioxide (CO2), methane (CH4), nitrous oxide (N2O), and harmful gas emissions that can negatively impact air and water quality including ammonia (NH3) gas. To ensure maximum sustainable agricultural productivity while mitigating emissions, agriculture must increase carbon-sequestration, reduce GHG emissions, and lessen our dependence on fossil fuels [2]. The Intergovernmental Panel on Climate Change (IPCC) estimates that anthropogenic nitrogen (N) inputs cause 60% of N2O emissions, through the use of fertilizers derived from animal waste.
There is a particular interest in lowering GHG and harmful gas emissions from dairy production, a sector that needs emission mitigation options but also one that is sensitive to the fate of farm inputs. European Union (EU) targets require a 20% reduction in GHG emissions by 2020 and subsequent reductions of 40% by 2030 compared to 1990 emission levels [3,4]. The agricultural sector accounted for approximately 10% of total GHG emissions in 2015 in the EU. Average European agricultural GHG emissions have declined by 20% from 1990 levels to 2015. This reduction was achieved primarily by a 17% reduction in N2O emissions from agricultural soils, through the use of fewer N fertilizers and a 22% decrease in CH4 emissions achieved by reducing livestock numbers [5]. In 2016, the EU’s National Emissions Ceilings Directive (2016/2284) on the reduction of national emissions of certain atmospheric pollutants was introduced and cited five primary air pollutants including NOx, non-methane volatile organic compounds (NMVOCs), sulfur dioxide (SO2), NH3, and carbon monoxide (CO). The use of N-based fertilizers is known to produce GHGs including CO2 and N2O. N2O is known to be particularly damaging to the environment and contributes to the depletion of the ozone layer. Over 170 countries have made various commitments to the Kyoto and Paris agreements as part of the effort to reduce the effects of global warming by lowering GHG and harmful gas emissions [6].
In 2019, the EU produced 151 billion liters of milk. This was followed by the US, India, Russia, China, Brazil, New Zealand, and Australia, who produced 96, 88, 30, 30, 24, 21, and 8.7 billion liters of milk, respectively. In order to meet EU and global commitments, the Dairy industry worldwide must embrace new technologies and strategies that reduce GHGs and harmful gas emissions. As the dairy industry continues to expand, it is evident that the use of inhibitor technologies will be necessary to ensure industry targets can continue to grow while continuing to address sustainability challenges. Inhibitor technologies have been shown to significantly reduce GHG and harmful gas emissions from N fertilizers and slurry [7,8] and these technologies have been identified as promising mitigation options for agriculture [3]. Urease inhibitors work by blocking the active site of urease, slowing down urea hydrolysis, and limiting the amount of N lost to the atmosphere as NH3. Nitrification inhibitors generally work to inhibit soil enzymes, which are responsible for nitrification and denitrification and, ultimately, limit N losses by reducing N2O emissions and nitrate (NO3 ) losses via leaching from soil. It is feasible that the mandatory use of such inhibitors will be passed into legislation in the near future to reduce EU emissions. For example, Germany has already implemented legislation that requires all urea fertilizers to incorporate urease inhibitors or be deeply integrated into the soil on application [9].
Although there are many benefits associated with the use of urease and nitrification inhibitors. In the year 2013, food safety concerns were raised around the use of the nitrification inhibitor Dicyandiamide (DCD), which appeared as a residual contaminant in dairy products [10]. This finding highlights the fact that although these inhibitor technologies may offer useful mitigation options for agriculture, more research is needed to thoroughly risk assess their potential to enter the food chain through grazing cattle. While both urease and nitrification inhibitors have the potential to effectively reduce N losses, it is important to note that although they are often grouped together as “inhibitors”, they are chemically different, and have different modes of action [9]. Many inhibitor products have already been approved and are currently on the market. For some, extensive toxicology and environmental fate studies have been completed. However, further research would be beneficial to ensure that these mitigation tools do not pose any food safety-related issues in future. Such research would include the development of advanced detection methods for these compounds in food matrices, and determine the best practice for use of these products, which could in turn drive the identification and establishment of environmental and food safety maximum residual levels (MRL). These measures would contribute to sustainable growth of the dairy sector while maintaining high-quality milk products.

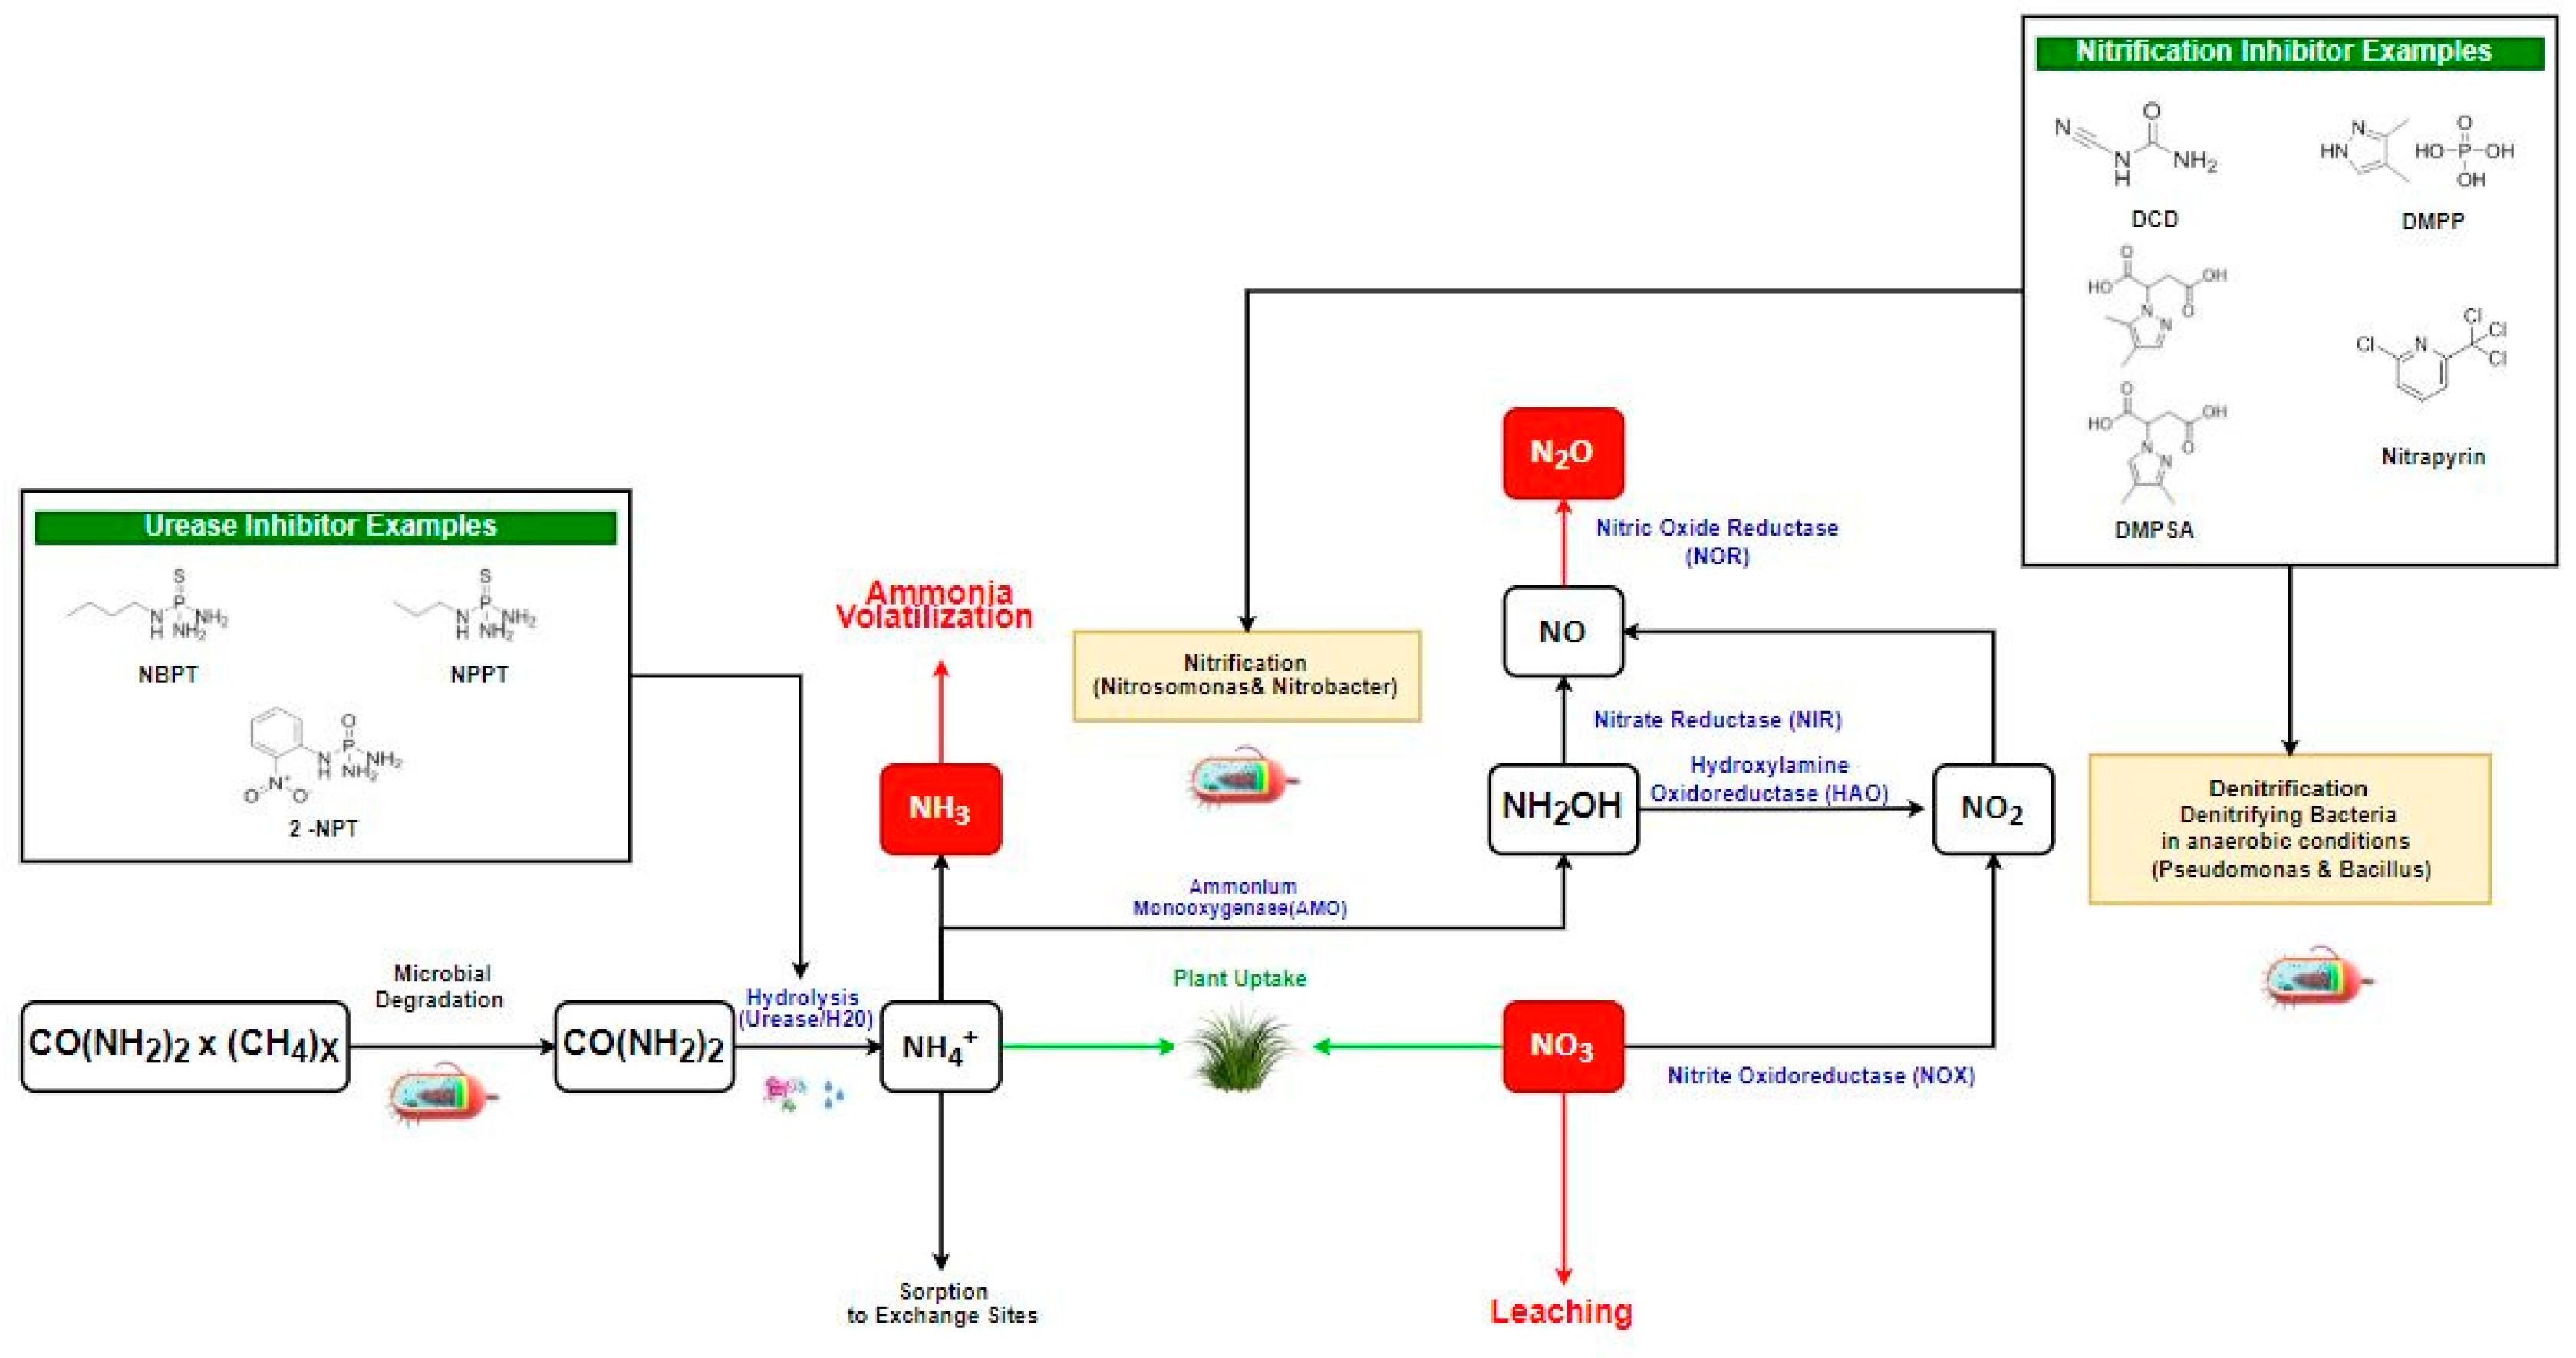
2. Nitrogen-Based Gas Emissions and Their Formation

Intensive agriculture is heavily reliant on N fertilizers in order to meet the demands of a global population, which continues to grow exponentially. Currently, over 70% of N utilized by plants comes from inorganic fertilizer sources [11], which contributes to both GHGs and NH3 emissions. One potent GHG associated with land application of N-based fertilizers is N2O. N2O has a 100-year atmospheric half-life (t ½ the time needed for half of the starting material to decay) and according to the 5th IPCC Assessment report, the global warming potential of N2O is 265–298 times more than CO2 [12]. It is also known to deplete ozone [13]. Ammonium nitrate (AN)-based fertilizers, in particular, are associated with N2O emissions from temperate grassland soils [14], and the NO3 component of AN fertilizers is prone to leaching, which leads to eutrophication and impacts negatively on aquatic environments [15].
The main factors affecting N losses in the form of N2O emissions due to microbial activity include soil structure i.e., water content and drainage, soil temperature and pH, N content, decomposable organic material [16,17], soil redox potential [18], and availability of carbon [19]. N losses can also occur due to NH3 volatilization, which is estimated to result in average global N losses ranging from 16–40% [9]. Agricultural N losses are estimated to account for over 90% of NH3 emissions in Europe [20] virtually all Irish NH3 emissions are attributed to agricultural practices [21]. Factors that influence NH3 losses include soil moisture, soil temperature and pH, wind velocity, soil organic C, and N fertilizer type [22]. The type of N fertilizer utilized is an important determining factor in N loss pathways as it can affect the ratio of soil NO3 to ammonium (NH4+) concentrations [23]. N fertilizer application rate and time of application can also affect the amount of N2O produced [15].
Denitrification represents a significant pathway for N2O emissions and is the main pathway of N2O emissions from Irish soils. Denitrification occurs under anaerobic conditions and is carried out by heterotrophic bacteria that utilize carbon (C) as an energy source and thereby reduce NO3 to nitrogen gas (N2). During denitrification, NO3 acts as an electron acceptor and is reduced to nitrite (NO2) followed by nitric oxide (NO) [24]. Nitric oxide is toxic to bacterial cells and is quickly transformed into N2O, which is eventually converted back to atmospheric N2.
An additional pathway for agricultural N2O emissions is nitrification. During nitrification, NH4+ ions and NH3 are oxidized and converted to NO2 and NO3 by nitrifying bacteria. When NH4+ oxidizes NO2, N2O is produced as an intermediate product and is lost to the atmosphere [24]. Other potential negative impacts of excess N include aquatic acidification, loss of biodiversity, and negative human health impacts such as methemoglobinemia in children (blue baby syndrome) following consumption of water with NO3 concentrations exceeding 10 mg L−1 [25].
Urea (NH2CONH2) is a reactive organic source of nitrogen widely produced industrially as a fertilizer. Urea is a cheaper source of N than AN or ammonium sulfate (AS) [26] and is the most widely utilized fertilizer globally. Emissions of N2O from urea tend to be much lower than AN fertilizer emissions, as the primary source of N provided by urea must undergo two conversions before it can be affected by nitrification or denitrification to produce N2O. In contrast, AN provides NO3 and NH4+ directly to the soil leaving it vulnerable to nitrification and denitrification processes, which, under suitable conditions, leads to rapid loss of N as N2O. However, N losses from urea occur due to NH3 volatilization, which happens when urea is applied to the soil surface and is subsequently hydrolyzed by urease, the ubiquitous soil enzyme, produced by soil bacteria. When urea is hydrolyzed, it forms an unstable intermediate, carbamate, which is quickly transformed into NH3. Volatilization of NH3 (Figure 1) can impact air quality, which can negatively affect human health, cause environmental pollution, and economic losses to farmers [27].
In recent years, mitigation technologies including urease inhibitors and nitrification inhibitors have been explored to reduce emissions and N losses from agricultural fertilizer usage. Urease inhibitors work by blocking the active site of urease, slowing down urea hydrolysis, and limiting the amount of N lost to the atmosphere as NH3. Nitrification inhibitors generally work to inhibit soil enzymes such as N reductase, which are responsible for nitrification and ultimately, limit N losses by reducing N2O emissions, and NO3 losses via leaching from soil. Both urease and nitrification inhibitors can effectively reduce N loss and reduce GHG emissions. However, it is important to note that although they are often grouped together as “inhibitors”, they are chemically different and have different modes of action [9]. Many inhibitor products have already been approved and are currently on the market. For some, extensive toxicological and environmental fate studies have been completed. However, further research would be beneficial to ensure that these mitigation tools do not pose any food safety-related issues in future. Such research would include the development of advanced detection methods for these compounds in food matrices, best practices for the use of these products, and the identification and establishment of environmental and food safety MRL. These measures would contribute to sustainable growth of the dairy sector while maintaining high-quality milk products.

3. Urease and Nitrification Inhibitor EU Regulation

The regulation of fertilizer content and the use of urease and nitrification inhibitors in Europe fall under Regulation (EC) No 2003/2003, which aims to ensure that all fertilizers used in the EU adhere to the same efficacy and safety regulations. This is done by safeguarding technical requirements, which are implemented consistently through all member states. Annex I, of the regulation, further categorizes fertilizers and their additives based on their product function (i.e., inorganic, synthetic, and organic fertilizers, inhibitors, soil improvers, liming agents, etc.) The fertilizer can then be classified as a European Community (EC) product, which stipulates that it is safe for use and possesses the required nutrient content. After EC designation, the fertilizer may be distributed and utilized in EU member states [28]. Regulation (EC) No 2003/2003 states that nitrification and urease inhibitors may be added to nitrogenous EC fertilizer types such as AN and urea fertilizers. The regulation states the minimum and maximum inhibitor augmentation as a percentage mass of the total N content (Table 1). Furthermore, it states that if the fertilizer is augmented with an inhibitor, it must be clearly labelled “with nitrification inhibitor” or “with urease inhibitor”. The seller must also inform the user of the correct rates and timing of application [28]. Various amendments have been made to Regulation (EC) No 2003/2003 in subsequent years including (EU) No 1257/2014 and (EU) 2019/1102. Another EU regulation that ensures the proper registration, evaluation, authorization, and restriction of chemicals (REACH) came into effect in 2007, in order to protect human health and the environment. This regulation also focuses on facilitating the free movement of chemicals in the EU, advancing innovation in the EU chemical industry, and reducing animal testing through its “read-across approach” for chemicals that possess similar physiochemical and/or structural properties and that are likely to have similar toxicological effects. REACH registered chemicals undergo risk assessments for potential hazards. Strict hazard management plans are also in place to ensure REACH compliance. Urease and nitrification inhibitors are also registered under REACH legislation.
Various nitrification and urease inhibitors of commercial interest have REACH status including N-(n-butyl) thiophosphoric triamide (NBPT), N-propyl- thiosphosphoric- triamide (NPPT), N-(2-nitrophenyl) phosphoric triamide (2-NPT), dicyandiamide (DCD), 3,4-dimethyl-1H-pyrazole phosphate (DMPP), 4,5-dimethylpyrazole-1-yl-succinic acid (DMPSA) and Nitrapyrin. Minimum and maximum allowances (inhibitor augmentation (%) by mass of the total N present in the fertilizer) as AN and urea have also been established for NBPT, NPPT, 2-NPT, DCD, DMPP, and DMPSA and are set out in the regulations. Currently, there are no MRLs in place for these inhibitors but it is possible that regulations regarding MRLs will be proposed in the future. The European Food Safety Agency (EFSA) has, however, introduced a tolerable daily intake (TDI) of 1 mg/kg bodyweight for DCD [29]. The implementation of future MRLs could aid in safeguarding the chemical safety of urease and nitrification inhibitors and therefore prevent any future food safety concerns while upholding the quality of dairy products.

4. Urease Inhibitors Types, Mode of Action, and Their Role in GHG Reduction

Hydrolysis of urea is catalyzed by urease, which is produced by soil bacteria and results in the emission of NH3. The urea molecule fits inside the active site cavity of urease, as a monodentate ligand, which ultimately leads to hydrolysis of the urea molecule [34]. There are many types of urease enzyme and urease activity is common in prokaryotes and eukaryotes, including fungi and plants [35].
There are four different ways in which urease inhibitors can inhibit urease enzymes and delay urea hydrolysis. These include (a) reversible competitive, (b) reversible non-competitive, (c) irreversible binding to allosteric sites on the enzyme, and (d) irreversible suicide substrate (also known as mechanism-based inhibition), where the enzyme binds to a substrate analog and forms an irreversible complex via covalent bonding during the normal catalysis reaction (Table 2) [36]. Urease inhibitors generally work by inhibiting the active site of the enzyme to slow down the hydrolysis of urea. Reversible inhibition utilizes non-covalent interactions with urease enzymes in the form of hydrogen bonding and/or hydrophobic interactions. Reversible inhibition may either be competitive, where the inhibitor competes with urea for the urease active site, with the resulting inhibition being proportional to the concentration of urea present; or non-competitive where the inhibitor binds to allosteric sites on the urease enzyme, resulting in a change of shape and inactivation of the enzyme. This inhibition type is not proportional to the concentration of urea present. Irreversible urease inhibitors possessing functional groups that interact with amino acid groups at the active site of the urease enzyme are also available [37].
Urease inhibitors can come in liquid form or as a coating on fertilizer granules. The principal factor affecting the percentage N loss from the soil, due to NH3 volatilization, is the biodegradation rate of the inhibitor. Consequently, the rate of biodegradation and persistence of inhibitors in the soil will determine their performance in mitigation of N losses. In addition, the use of urease inhibitors is also beneficial in controlling soil pH and aids in the prevention of localized zones of high pH, which occur around fertilizer granules of untreated urea. The rise in pH observed around untreated urea granules is due to the fact that NH3 volatilization is pH dependent. Urea hydrolysis requires H+ ions, which are obtained from the soil in a ratio of 2:1 (H+:urea). The consumption of H+ ions during this reaction results in increased soil pH, which drives further NH3 volatilization [9].
Urease inhibitors are classified into two main categories i.e., metal complexes and organic compounds [38]. Insoluble sulfide-forming metals exhibit the most potent inhibition properties due to reactions with sulfhydryl groups of urease. Ag+1 and Hg2+ can completely inactivate urease activity in solutions containing concentrations of up to 10−6 M urease. In general, metal ions follow the following order of efficacy in inhibiting urease activity.
Ag+ ~ Hg2+ > Cu2+ > Cd2+ > NI2+ > Co2+ > Fe2+ > Mn2+
This order can, however, vary depending on the urease enzyme type. These inhibitors are considered to be non-competitive [38]. Other metal complexes reported to exhibit inhibitory properties include organotin (IV), vanadium (IV), bismuth (III), and thiocyanato-coordinated manganese (III) [37].
Organic type inhibitors can generally be divided into two classes of structural urea analogs such as hydroxamic acid and compounds that impact the urea hydrolysis reaction mechanism. The latter include organophosphorus compounds (amides and esters of phosphoric acid including phosphoramides), thiol compounds, quinones, boron compounds, and bismuth compounds [39]. Organophosphorus compounds are the most widely utilized urease inhibitors in agriculture and are defined as organic molecules containing a phosphate molecule. The presence of phosphate is useful as it is a well-known, weak urease inhibitor. Amides and esters of phosphoric acid are slow-binding actors that inhibit urease in a time-dependent manner and are known to be amongst the strongest urease inhibitors. Phosphoramides belong to this chemical class.
Phosphoramides act as strong inhibitors of urease due to their similarities in transition state and enzyme reactions as well as their ability to bind strongly to the active metallocentre site of urease [26]. Phosphoramides can include both simple and complex compounds from phosphoramidite and diamidophosphate to substituted phenyl phosphorodiamidates and N-acyl phosphoric triamides. Phosphoramidite inhibits jack bean urease reversibly (rate constant Ki = 1.9 mM; dissociation rate = 8.4 × 10⁻⁴/sec), with N-acyl phosphoric triamides and phenyl phosphorodiamidates exhibiting comparable rate constants [38]. Phenyl phosphorodiamidates are more active as plant urease inhibitors than microbial urease inhibitors. Some phosphoramides inhibit urease via the formation of chelated complexes in the Nickel (Ni) metallocentre of the urease enzyme. Examples include phosphoric monoamide and phenyl phosphorodiamidates [38]. Kinetic studies have shown that inhibition of urease via phosphoramide-type compounds is achieved via the formation of hydrolysis by-products such as diamidophosphate (DAP). DAP has a tetrahedral structure that almost perfectly replaces all three water molecules present in the enzyme’s active site [40,41].
One interesting group in this class are derivatives of thiophosphoric acid. These compounds must first be oxidized to Oxon analogs in order to function as urease inhibitors. NBPT is a good example of this as it is a precursor urease inhibitor and its Oxon analog (NBPTo) actively inhibits urease. NBPT is also the most commonly utilized agricultural urease inhibitor [40]. Recent studies have demonstrated that NBPT irreversibly binds to urease where it is hydrolyzed, resulting in the production of monoamidothiophosphoric acid (MATP), which then binds to the two Ni (II) ions in the urease active site [26,42]. Other examples of amides and esters of phosphoric acid that exhibit potent urease inhibition include phosphoric triamide (PTA), phenylphosphorodiamidate (PPD), 4-chlorophenylphosphorodiamidate, N (diaminophosphinyl) benzamide, N-(diaminophoshinyl)-4-fluoro-benzamide, and phosphoric acid buffer (pH < 7.5) [40].

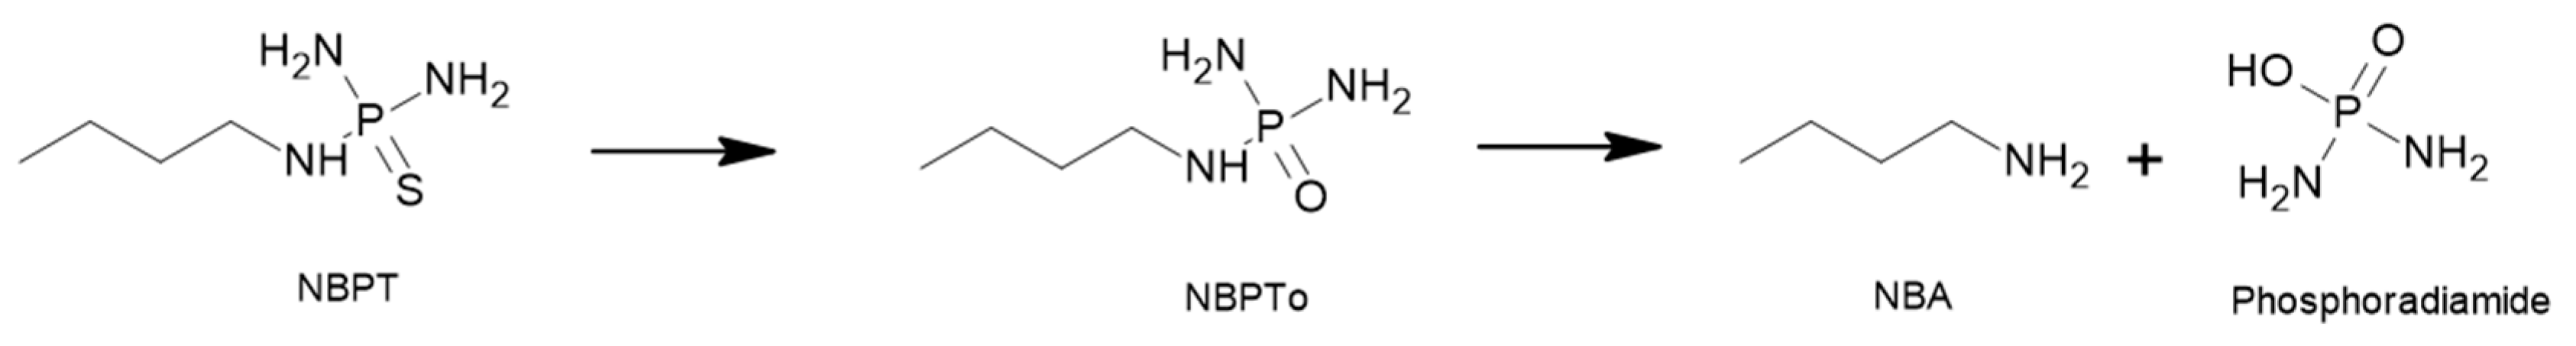
4.1. N-(n-butyl) Thiophosphoric Triamide (NBPT)

The most successful urease inhibitor currently on the market is the phosphoramide NBPT, which was first branded as Agrotain© in the mid-1990s [9]. NBPT has been shown to reduce emission of NH3 by up to 84%, which is comparable to the 83% reduction in NH3 emissions observed when using Calcium Ammonium Nitrate (CAN). Switching from CAN to protected urea also aids in the indirect reduction of N2O emissions [47]. The yield gain via the use of NBPT with urea is cited to vary from 0.8 to 10.2% depending on the crop species [9]. The use of NBPT in conjunction with urea has been found to improve the dry matter yield of perennial ryegrass, by improving the performance of urea. Urea-amended with NBPT produced dry matter yields comparable to CAN fertilizers indicating that the former can aid in the reduction of both N2O and NH3 emissions [48,49].
NBPT inhibits urease by blocking three active sites in the urease enzyme thereby delaying urea hydrolysis and delaying NH3 volatilization. In doing this, NBPT acts as a competitive inhibitor and an irreversible suicide substrate. It is considered a urea analog possessing a structure similar to that of urea. The resulting inhibition is proportional to the concentration of urea present. When NBPT encounters urease, a trident bond is formed with two Ni centers and one O2. A carbamate bridge links the two metals, making it harder for urea to reach the active Ni center of the urease enzyme [9,34,50]. NBPT is an indirect urease inhibitor and is first converted to NBPTo, its Oxon analog, to facilitate urease inhibition, which occurs under aerobic conditions [9]. However, the direct application of NBPTo is not as efficient as NBPT application due to the instability of NBPTo.
Inhibition of urease by NBPT usually lasts three to seven days (d) as new urease enzyme production overwhelms the inhibitor. This is desirable as it allows more time for urea to be incorporated into the soil and reduces the chance of NH3 volatilization. For this reason, NBPT is often added into urea fertilizers. NBPT mitigates NH3 volatilization by controlling the rise in pH that occurs during urea hydrolysis, resulting in the production of two units of NH4+ and CO2 and reduces the soil concentration of NH4+ around the urea granule. These effects impact the equilibrium of NH4+ (soil), NH3 (soil), and NH3 (gas) [51], which results in slower urea hydrolysis and ultimately allows more time for the fertilizer to be incorporated into the soil via rainfall or irrigation and consequently protects the applied N from volatilization [52].
The physicochemical properties of NBPT are shown in (Table 3). Structurally, NBPT is an amphiphilic molecule possessing both a polar phosphoramide region and a lipophilic butyl chain allowing it to interact with both polar and non-polar phases [53,54]. NBPT is considered a surface-active material (a surfactant) with a surface tension of 49.4 mN/m (1.05 g/L at ca. 22 °C). The degradation half-life (DT50) value for NBPT is reported to be 58 min at pH 3.0, 92 d at pH 7.0 and 16 d at pH 11.0 at 25 °C [55]. Engel et al. [56] found that NBPT degraded in acidic to slightly alkaline soils (pH 5.1–7.6) mostly due to chemical hydrolysis.
Major hydrolysis components of NBPT have been identified as N-(n-butyl) thiophosphoric diamide and n-Butylamine (NBA). NBPT is pH labile and chemical hydrolysis appears to be an essential function of its break-down in acidic conditions (Figure 2). Engel et al. [56] determined the half-life of NBPT at pH 4.0. 5.0, 6.0, and 7.2 to be 0.437, 1.60, 42.44, and 487.1 d, respectively, whereas that of NBPTo was 0.0430, 0.203, 6.25, and 57.91 d, respectively. Decay constants for NBPT and NBPTo followed pseudo-first-order kinetics during chemical hydrolysis and were directly related to hydrogen ion concentration. The half-Life of NBPT is 7–10 times greater that of NBPTo because the P=O bond in NBPTo carries a larger positive charge, leaving it more prone to nucleophilic attack from water and susceptible to cleavage of P-N bonds. The study concluded that under acidic conditions chemical hydrolysis is likely the dominant pathway for NBPT and NBPTo breakdown. Under alkaline conditions, biotic breakdown of these compounds via microorganisms becomes more significant [56]. Lower NBPT efficiency in acidic soils was also observed by Tao et al. who related this behavior to both soil pH and microbial activity [62]. This finding is further cited by Dominguez et al. [50].
The European Chemicals Agency (ECHA) has stated that NBPT has a DT50 (t1/2) of 26–30 d at 12–25 °C in soil and a DT50 of 15 d in freshwater. In freshwater sediment, NBPT is cited to persist longer and has a DT50 of 4.5 months at 25 °C [63]. The log Koc (soil adsorption coefficient) value of NBPT was estimated to be below 1.25. Low log Koc values are considered an environmental risk due to their potential to leach from the soil and pollute groundwater. NBPT falls within the log Kow range of 1–2 indicating that it is ‘mobile to highly mobile’, indicating it could potentially be leached from the soil and pose a threat as a groundwater pollutant if present over the recommended usage levels [64]. However, NBPT is applied at low levels when used in conjunction with urea fertilizer i.e., 50 g/ha per application, in addition, it breaks down rapidly in acidic soils [56], making it unlikely to become an environmental pollutant at recommended levels of use. The estimated bioconcentration factor (BCF) for NBPT is 3.162 lipid/kg ww (wet weight). NBPT is not expected, therefore, to bioaccumulate in fish or the food chain as it is well below the REACH BCF threshold value of >2000 L/kg/bw (body weight).
It is important to assess the toxicology of each individual inhibitor in order to evaluate their chemical safety. A summary of available toxicology data for NBPT is shown below (Table 4), which contains data from three separate toxicology studies conducted by The European Chemicals Agency (ECHA) in 1996, and The National Australian Industrial Chemicals Notification and Assessment Scheme (NICNAS) in 1997 and 2011.
In summary, NBPT was found not to be toxic via dermal or oral exposure, as the average LD50 in rats exceeded 2000 mg/kg body weight. To put this in perspective, the highest permitted level of NBPT allowed is 2000 mg/kg urea fertilizer [9,66]. NBPT caused some minor and reversible skin irritation in rabbits; however, skin irritation effects were below hazardous classification. NICNAS toxicology studies concluded that NBPT is of low acute toxicity, is not a skin sensitizer, and is not genotoxic [55]. NBPT meets the criteria to be considered an irritant and is classed as risk phase (R41) under the EU Dangerous Substances Directive (67/548/EEC), which indicates it is a risk for severe eye damage [55,65]. When directly consumed NBPT was found to cause significant reproductive changes in both male and female rats. NOAEL in males and females were found to be 21 mg/kg bw/d and 17 mg/kg bw/d, respectively. The NOAEL value for reproductive toxicity is 17 mg/kg bw/d. Based on these results, NBPT meets the requirements for classification as a category three reproductive toxin as well as causing possible harm to fertility [55].
However, as NBPT utilized in commercial fertilizer, the finished product by regulation can have no more than 0.2% (w/w) on a urea-N basis. For comparison with analytical grade NBPT which is typically in the region of 98% purity. The levels present in commercial fertilizer are 1065 times less concentrated in the case of 46% N urea when treated at the maximum regulatory level making adverse affects from the use of these products unlikely. Indeed, the 2011 NICNAS report also concluded that the exposure during the application of fertilizer products by agricultural workers is minimal. The study reached this conclusion based on a calculation of the likely margin of exposure (MOE) (no-observed-adverse-effect level (NOEAL)/estimated exposure dose for NBPT). MOE is used to assess risk from chemical exposure. NBPT was found to have a low MOE, therefore any risks to fertility through the use of NBPT containing products is likely minimal [55].
Hematology results, at 500 mg/kg/d, revealed liver damage (without chlorosis) however no changes in liver weights were recorded [65]. The ECHA study also found Alanine transaminase (ALT) levels increased in males exposed orally to 500 and 1000 mg/kg, indicating possible damage to the liver. This is in agreement with the NICAS 1997 report, which recorded liver damages in animals exposed to NBPT at this concentration [53]. NICNAS (2011) found that effects on the liver and changes in hematology in males had a NOAEL of 377 mg/kg bw/d. The NOAEL for the female test group was not determined, but the study stated that the LOAEL for females was determined to be 17 mg/kg bw/d due to uterine changes [55]. Decreases in the cholinesterase levels in brains and erythrocytes were observed in the test groups, exposed orally to 500, 1000, and 2000 mg/kg bw. Cholinesterase is vital for the breakdown of the neurotransmitter, acetylcholine, which stimulates post-synaptic nerves, muscles, and endocrine glands. Chemicals that inhibit cholinesterase are considered neurotoxic. NICNAS (2011) reported decreased erythrocyte cholinesterase levels in rats in both high-dose groups exposed orally to 800 and 3200 mg/kg NBPT over two generations. When combining both the 1997 and 2011 repeat dose studies for NBPT, NICNAS concluded that the NOAEL for males is 74 mg/kg bw/d according to neurobehavioral changes observed [55,65]. Biochemical analysis demonstrated decreased levels of aspartate aminotransferase (AST) and alanine aminotransferase (ALT), at 5000 mg/kg bw. Both are valuable biomarkers that indicate liver disease when elevated. Little is known about lower than normal or decreased levels of AST and ALT. However, lower than normal ALT levels have been associated with increased incidences of mortality, especially in elderly patients [67]. Decreased AST levels were also noted in the male medium 1000 mg/kg dosage group. The NICNAS 1997 report concluded that when NBPT is used in conjunction with urea fertilizers, it is present in extremely low quantities (approximately 0.2% (w/w) urea), and should, therefore, pose no significant threat to public health and safety. The report also concluded that any residual presence in food products is also expected to be negligible [65]. EU regulation No. 2003/2003 states that the maximum NBPT inhibitor content as a percentage by mass of the total nitrogen present as urea nitrogen is 0.2%. It can be inferred from the NICNAS 1997 [30] report and the percentage NBPT allowable in fertilizer products that the risk of NBPT residues appearing in EU food products is negligible.
In 2019, van de Ligt, et al. [68] conducted a 28-day study testing the milk of Holstein dairy cows fed three levels of NBPT (1, 5 and 10 mg/kg bw). No NBPT was detected with the exception of one milk sample from a cow exposed to 10 mg NBPT /kg bw/d. However, it was detected at levels below the limit of quantification for this method (50 µg/kg). The lowest level of 1 mg NBPT/kg bw/d feeding equates to a NBPT exposure direct consumption of urea containing 0.1% NBPT. Direct consumption of fertilizer at this level would induce urea toxicity and is extremely unlikely to occur. The study concluded that consumption of NBPT, even at exaggerated levels, is unlikely to cause residual contamination in dairy products and supports the findings of the 1997 and 2011 NICNAS reports carried out by the Australian government’s national industrial chemicals notification and assessment scheme. Even the lowest exposure levels used in this study [68] are highly inflated from the perspective of good agricultural practice.

4.2. N-(n-propyl) Thiophosphoric Triamide (NPPT)

NPPT has gained increasing interest as a new urease inhibitor in recent years and is currently being utilized in a new commercial formulation, in conjunction with NBPT, in a product called Limus®. The formula was introduced by the German company BASF and consists of approximately 25% NPPT and 75% NBPT. Li et al. [69] conducted a 2015 study, which indicated that formulations of 25% NPPT/75% NBPT and 50% NPPT/50% NBPT were more successful at inhibiting soil urease than NBPT alone. This is most likely because the combination of two urease inhibitor types would inhibit a broader range of ureases present in the soil. The effects of Limus® on NH3 volatilization and N utilization on wheat production in northern China exhibited an 83% reduction in NH3 losses compared to unprotected urea [70]. The study also found that the application of Limus® did not significantly affect grain yield [71].
It is notable that the structure of NPPT differs from NBPT by a single methyl group (Table 3). It is therefore likely to behave similarly to NBPT in terms of mode of action, toxicity, and degradation pathways. A summary of available toxicology data for NPPT is shown in (Table 5) from studies conducted by (ECHA).
NPPT is described under classification, labelling, and packaging (CLP) criteria to cause harm if ingested and may cause skin allergies [57]. NPPT was not found to be a skin sensitizer and is classified, under REACH registration as a severe eye irritant. The results of a 28-day study did not suggest any effects from exposure to NPPT on reproductive organs, however, due to ECHA’s ‘read-across’ approach to NBPT, as they are structurally similar, NPPT is suspected to be a reproductive toxin with the potential to cause harm to fertility and/or the unborn child. Studies on developmental toxicity in rats via oral administration of NPPT found the NOAEL to be 100 mg/kg bw/d [57].

4.3. N-(2-nitrophenyl) Phosphoric Triamide (2-NPT)

2-NPT is a relatively new urease inhibitor, which was developed by the SKW Company in the 2000s and has shown much promise in reducing NH3 volatilization [9,72]. The mechanism of action of 2-NPT is thought to be similar to NBPT as it blocks the urease enzyme active site and is, therefore, considered a urea analog-type inhibitor (Table 2). The advantages of 2-NPT include more robust stability than NBPT under high-temperature conditions and it is considered non-toxic to soil bacteria [72]. A 2014 study found that 2-NPT reduced NH3 emissions by 48 to 89% compared to unprotected urea [73]. These findings are supported by the results of a previous 2010 study which observed 49 to 75% reductions in NH3 emissions compared to unprotected urea, when used on spring grass [74].
The physicochemical properties of 2-NPT are described in (Table 3). The compound is predominantly polar in nature. 2-NPT is expected to be metabolized, in vivo, via hydroxylation of N and C atoms, which may be followed by conjugation. Due to its high water solubility and relatively low molecular weight, it is expected that, if ingested, the metabolites of 2-NPT will be excreted primarily in the urine [58]. A summary for the available toxicology data for 2-NPT is shown below (Table 6) and contains data from toxicology studies conducted by ECHA.
In summary, animal studies indicated that 2-NPT is not classifiable as a skin or eye irritant, skin sensitizer, or genotoxin. Currently, no studies have been conducted on endocrine disruption ability, carcinogenicity, or inhalation toxicity [58].

5. Nitrification Inhibitors Types, Mode of Action, and Their Role in GHG Reduction

Nitrification inhibitors are a class of chemicals used to slow down the nitrification process by inhibiting nitrifying bacteria that produce the enzyme ammonia monooxygenase (AMO), hydroxylamine oxidoreductase (HAO) and nitric oxide reductase (NOR). Nitrification occurs in two steps the first step involves the oxidation of NH4+ to hydroxylamine (NH2OH) via the enzyme AMO. NH2OH is then subsequently converted to NO2 via the enzyme HAO. During the second step of nitrification, NO2 is oxidized to NO3 via the enzyme NOR. The NO3 produced during the nitrification process can result in N losses due to leaching or denitrification. The mode of action for most nitrification inhibitors is inhibition AMO during the first step of nitrification [45].
Nitrification inhibitors have gained interest as a possible mitigation strategy for lowering N2O emissions as well as reducing water pollution associated with use of fertilizers. Some examples of nitrification inhibitors include DCD and DMPP, thiourea, carbon sulfide (CS2), thioethers, ethylene: C2-H2, 2-ethynylpyridine, 3-amino-1,2,4-triazole, N-2,5-dichlorophenyl succinamic acid (DCS), 2-amino-4-chloro-6-methyl pyrimidine (AM), nitrapyrine (NP) and ammonium thiosulphate (ATS) [11], and N-[3(5)-methyl-1H-pyrazol-1-yl) methyl] acetamide (MPA) [75].
DCD is a popular nitrification inhibitor that effectively reduces N2O emissions. Decreases in gross nitrification rates in neutral silt loam and alkaline clay by up to 57.9% and 62.4%, respectively, have been achieved using DCD. With a 93.2% drop in N2O emissions from neutral silt loam and 46.8% in alkaline clay soil observed. It also reduced the amount of NO3 accumulation by approximately 20% in both soil types [76]. Reduction of up to 40% is N2O emission rates have also been observed in dry sandy-loam soils [77]. DCD, utilized in conjunction with urea, reduced N2O emissions by 58–78% in grassland and barley fields [78]. DCD is more effective at inhibiting nitrification and lowering N2O emissions in arable soils than in grassland soils. One study described N2O emission reductions of 81% in arable soil and 58% in grass land soil and concluded that this is likely because grassland naturally contains higher concentrations of N than arable soil types [79]. Although DCD was a popular nitrification inhibitor, it is disadvantaged by its high price and high dosages (15–30 kg DCD ha−1), as it is a relatively weak inhibitor [11]. Other disadvantages of DCD include the possibility of phytotoxicity, which often results in leaf tip scorching, and ultimately reduces the aesthetics of leafy green crops thus harming their marketability [80]. Food safety concerns were also raised when DCD was found in milk powder. This has raised concerns regarding the practice of spraying DCD on pastures in order to reduce N leaching [81].

5.1. Dicyandiamide (DCD)

DCD is an inorganic crystalline solid susceptible to biodegradation in soil, yielding urea, CO2, and NH4+. The physicochemical properties of DCD are described in (Table 3). DCD is polar, based on its log Kow value of −1.0 [59], is highly water-soluble and can be prone to leaching from the rooting zone where it is intended to inhibit nitrification. One study conducted by Cahalan, et al. [82] tested the effect of precipitation and application rate on DCD persistence and efficacy in two Irish grassland types (cambisol and gleysol) over eight weeks at application rates of 15 or 30 kg DCD ha−1 during high or low precipitation. High precipitation increased DCD in leachate, with less DCD recovered from soil. Approximately 81% of DCD was degraded in cambisol and was unaffected by the rate of DCD applied. Degradation of DCD in gleysol was affected by application rate and degraded by approximately 67% at 15 kg DCD ha−1 and 46% when DCD was applied at 30 kg DCD ha−1. The study found that degradation rates of DCD in soil were not related to temperature or moisture and it was hypothesized that the differences in degradation rates between cambisol and gleysol may be related to differing organic matter content and associated microbiological activity. Overall, the study observed increasing levels of precipitation correlated with higher leaching of DCD. This effect is also cited by Shepherd et al., 2012 [83].
DCD is bacteriostatic but not bactericidal and acts to inhibit the enzyme AMO [59,84]. AMO is an essential metalloenzyme of nitrifying bacteria, which catalyzes the hydrolysis of NH3 to hydroxylamine and functions ultimately as a substrate for N2O production. Inhibition of AMO occurs as DCD acts as a copper chelating agent and binds to copper-containing parts of the enzyme’s active site [79]. Inhibition of the AMO enzyme reduces N2O emissions because the nitrification process carried out by ammonia-oxidizing bacteria (AOB) is slowed [24,85]. The inhibitory effect causes N to remain in its NH4+ form longer and results in less NO2 and NO3 production. This ultimately reduces N loss via leaching and atmospheric loss of N as N2O. Leaching is prevented as NH4+ is positively charged and can better bind to negatively charged soil particles than NO3, which is repelled, and is, therefore, prone to leaching [86]. This mode of action makes DCD an attractive mitigation tool for reduction of air and waterway pollution [24,87]. In pure nitromonas cultures, DCD exhibits inhibition at concentrations of 200 mg kg1; in contrast, under these conditions, the nitrification inhibitor nitrapyrin only requires 1 mg kg1.
In soil, approximately 10 to 50 mg kg1 are required for the inhibitory effects of DCD inhibition and usually last 4–8 weeks depending on environmental conditions [88]. DCD is a REACH registered substance. Toxicology tests carried out by ECHA indicate that DCD is virtually non-toxic. A summary of the available toxicology data for DCD is shown in (Table 7).
The compound is not considered to be a skin or eye irritant or sensitizer. Repeat exposure toxicity tests for DCD concluded that the NOAEL is greater than 24,000 mg/kg as no clinical effects were observed. No mutagenic effects were observed for DCD.
Environmental tests on DCD indicated that the substance is abiotically stable, highly water-soluble, and not readily biodegradable in water. However, it does biodegrade in soil via biotic and abiotic mechanisms. The DT50 of DCD in surface water is >1000 d and pH has little effect on the hydrolysis of the compound [59,89]. Although ultimately DCD degrades to form relatively benign compounds such as carbon dioxide, H2O, and NH3 [90], caution should be exercised when used near water bodies as DCD may be a potential stressor to aquatic environments. DCD may interfere with aquatic nitrification processes leading to a toxic build-up NH3, which is harmful to aquatic life [91].

5.2. Nitrapyrin

Nitrapyrin was registered for use in the USA in 1974 and has since been a widely utilized in North America as a mitigation tool that extends the rate of ammonium conversion to nitrate during the nitrification process [92]. Nitrapyrin is predominantly utilized to produce corn but is however also used in wheat and sorghum cultivation [92]. Nitrapyrin is a volatile nitrification inhibitor that is usually utilized in conjunction with anhydrous ammonia [88]. Due to the inhibitors volatile nature and relatively high vapor pressure (Table 3), it is not very suitable for incorporation into solid fertilizers and is instead incorporated into the soil via injection usually at a depth of at least 5 to 10 cm [80,88]. Nitrapyrin is a very selective inhibitor which inhibits nitrification due to its bactericidal effect and effects on the metabolism of nitramonas bacteria [92]. The resulting inhibition occurs at concentrations of 1.0 mg kg−1 in pure nitramonas cultures and at concentrations ranging from 10 to 40 mg kg−1 in soil [88]. Nitrapyrin is stable and persistent in cool soils but usually breaks down in warmer soils within 30 days. Its persistence in cooler soils makes it an attractive mitigation option for winter and autumn N fertilizer applications. Nitrapyrin is cited as an extremely effective at limiting nitrogen losses in the form of NO3 leaching from waterlogged soils [88]. One disadvantage of Nitrapyrin is the fact that it is considered an organic chlorine type compound increasing concerns have been raised over the fate of these compounds in the environment [80]. Nitrapyrin exhibits low acute toxicity and is not considered to be genotoxic however the substance is known to be a Category II eye irritant [92]. A summary for the available toxicology data for Nitrapyrin is shown below (Table 8) and contains data from toxicology studies conducted by ECHA.

5.3. 3,4-Dimethylpyrazole Phosphate (DMPP)

The nitrification inhibitor 3,4-dimethylpyrazole phosphate (DMPP) is a supposed Cu-selective metal chelators, which acts to inhibit the AMO enzyme necessary for nitrification [46]. DMPP is suitable for use in conjunction with solid, liquid fertilizer, and slurry. DMPP is a more potent inhibitor than DCD with a much lower application rate of 0.5–1.5 kg ha−1; this, coupled with less mobility in soil due to sorption, gives it a number of advantages over DCD [93]. The nitrification inhibition potential for DMPP is approximately 4–10 weeks depending on climate and soil conditions [80]. The physicochemical properties of DMPP are described in Table 3. It has been extensively tested for both ecological and toxicological effects and has been approved for use [80]. Under the Globally Harmonized System of Classification (GHS), DMPP is known to cause severe eye damage (category 1) and is also known to be harmful if swallowed (category 4) [60].

5.4. 3,4-Dimethylpyrazole Succinic (DMPSA)

DMPSA is a relatively new type of nitrification inhibitor that is more stable in basic conditions than the nitrification inhibitor DMPP due to the presence of a succinic group. The physicochemical properties of DMPSA are described in Table 3. This nitrification inhibitor is suitable for use with CAN and diammonium phosphate (DAP) [94]. Pacholski, et al. [95] found that the use of DMPSA in conjunction with urea and CAN fertilizers reduced N2O emissions by 60–90% when compared to standard untreated fertilizer. The study also found that NO3 was found in considerably lower amounts when DMPSA was utilized as the inhibitor successfully sustained higher levels of ammonium [94,95]. An isomeric mixture of DMPSA is registered for use in the EU, and a summary of the available toxicology data can be found below in (Table 9).
No genotoxic or sensitization were observed. However, DMPSA is considered to be an eye irritant with adverse effect observed and is classed as a Category 1 H318 under GHS [96].

6. Inhibitor Plant Uptake Potential

6.1. Urease Inhibitor Plant Uptake

Urease inhibitors added to N fertilizers can retain N in its NH4+ form, resulting in longer uptake of NH4+, which in turn provides more opportunity for N to be fixed or immobilized in organic or mineral components of soil. Evidence of this has been cited by both Soliman and Monem [97] and Xu et al. [98]. Increases in available N derived from fertilizers in the presence of urease and nitrification inhibitors have also been cited [99]. There is some evidence that NBPT may be taken up by plant roots and this was demonstrated in maize seedlings by limited net urea uptake and reduced ureic-N accumulation [100]. Cruchaga et al. [101] also detected NBPT in pea and spinach plant tissues treated with 100 μM concentrations. The study found that NBPT absorbed by plants caused inhibition of urease activity in pea leaf and roots, as a result of which, urea build-up was observed and was responsible for necrosis of the plant at leaf margins. Earlier studies also found that NBPT utilized at high concentrations of urea (0.5% w/w), and concentrations of 10 µg/g of soil was associated with leaf tip scorch. This effect is hypothesized to be dose-dependent [48,102] and the resulting leaf tip scorch is thought to be caused by a toxic build-up of urea at the leaf tip rather than a cytotoxic effect exerted by the NBPT itself. However, it is unlikely that plants will be exposed to such high levels of NBPT, as the EU maximum inhibitor augmentation for NBPT is 0.02% (w/w) urea. Reports on the capacity of plants to take up NBPT, with consequences on endogenous urease and plant metabolism, have also been cited by Ariz et al. [103]. Cruchaga et al. [101], also found that NBPT taken up by pea and spinach roots is translocated to the leaves; consequently, NBPT could potentially inhibit the activity of endogenous leaf and root urease. The fact that plants can assimilate NBPT is further evidenced by the compound’s relatively low octanol-water partition coefficient value (Kow) i.e., the tendency of a compound to move between aqueous and lipid phases. NBPT has a relatively low Kow of 0.444, which indicates that NBPT is readily soluble in water [53]. It is cited that compounds with Kow values of ≤2 possess the ability for translocation in plant trans-vascular systems. Further studies on the uptake potential of NBPT by plants fertilized with NBPT-treated urea would be beneficial in assessing possible food chain entry points via grazing animals [104].

6.2. Nitrification Inhibitor Plant Uptake

The nitrification inhibitor DCD possesses a Kow value of −1 indicating that in theory, it should be possible for translocation of DCD in the trans-vascular systems of plants. A 2018 study found that plants have the capacity to take up DMPP and DMPSA and these were subsequently found in plant tissues [81]. The study was conducted on clover plants and found that DMPP accumulated in the leaves of the clover where it caused necrosis on the leaf margins. In contrast, DMPSA usually accumulated in the roots and was deemed to be innocuous. Although both inhibitors posed an extremely low risk of phytotoxicity, this was observed only at DMPP concentrations for of 100 mg/kg soil, which is much higher than the estimated maximum amount used in agriculture (0.5 mg/kg soil). DMPSA did not produce phytotoxicity even at dosage levels of 100 mg/kg soil [81].

7. Survival of Inhibitor Compounds in Rumen

7.1. Survival of Urease Inhibitors in the Rumen

There are currently few studies available on the survival of urease inhibitors in bovine rumen. Studies conducted on the ovine rumen have indicated that NBPT can temporarily inhibit microbial urease activity, although, over time, rumen microflora adapted to NBPT administration. At high doses (88.89 mg/kg bw/d), NBPT caused a 77% inhibition of ruminal urease. The study also stated that at these high doses, negative post-absorptive effects may occur, which could affect ruminal nitrogen metabolism, due to metabolites produced from NBPT. It is, however, inconceivable that the rumen should be exposed to this level of NBPT through ingestion of fertilizer while grazing, as the dose administered was much higher than the maximum allowable inhibitor content.
Rumen pH can vary depending on diet; however, it typically ranges from 6.2 and 7.2 [105]. Engel et al. 2015 [56] investigated the effect of pH on NBPT degradation in soil. The study tested both chemical buffer incubations at pH (4.0, 5.0, 6.0, and 7.2) and soil incubations at pH (5.1, 6.1, 7.6, and 8.2). The study concluded that degradation of NBPT and NBPTo in acidic to slightly alkaline environments (pH 5.1–7.6) most likely occurs by chemical hydrolysis and that degradation via microbial action would be dominant in alkaline environments (pH 8.2). Based on such findings, chemical hydrolysis mechanisms would appear to be the likely degradation pathways of NBPT and NBPTo under rumen pH conditions.

7.2. Survival of Nitrification Inhibitors in the Rumen

It is important to establish whether nitrification and urease inhibitors can survive the harsh conditions of rumen digestion, should they be ingested. Research has been carried out in non-lactating, Friesian dairy cows given the nitrification inhibitor, DCD, administered directly into the rumen or mixed with grass silage (GS). DCD recovery rates were >80% of the daily dose in urine, and 2–10% in feces. A small fraction of DCD was unaccounted for, which was probably degraded in the rumen [106,107].
Studies by Welten et al. [107,108] investigated the ability of DCD to mitigate N losses from urine soil patches and the long-term effects of DCD exposure via oral administration over 90 d to dairy heifers. The studies found no significant changes in blood metabolites and most of the DCD administered was excreted in the urine. This is in agreement with the findings of Minet, et al. [109]. Only 1.2% of DCD was excreted in milk after oral administration, which was rapidly eliminated and showed sharp declines in its concentration a few days later. After a five-day withdrawal period, DCD was not detectable. The study concluded that administration of DCD to lactating cattle resulted in low levels of chemical detection in milk [108].
The recommended rate for DCD application in New Zealand prior to 2013 was 10 kg DCD ha−1, which was broadcast-sprayed directly onto pastureland in spring and autumn [110]. This led ultimately to residual DCD contamination in dairy milk powder. Although DCD was later found to be nontoxic at the levels detected, it is a precursor chemical to melamine, which had, notoriously, been used as an adulterant in Chinese milk products and resulted in the deaths of six infants [10]. The detection of DCD even at residual levels caused a problem in the Chinese market, which was exacerbated by the fact that no MRL was in place within Chinese regulations [107]. EFSA has since introduced a tolerable daily intake (TDI) of 1 mg/kg bodyweight for DCD in food products [85].

8. Passage of Contaminants into Milk via the Blood-Milk Barrier

The blood–milk barrier present in the mammary gland is composed of the epithelium of the blood capillaries, which surround and supply the secretory epithelium in the mammary gland, which controls the passage of nutrients into milk. The passage of contaminants across the blood–milk barrier depends mainly on their physicochemical properties. Contaminants such as veterinary medicines, agrichemicals, mycotoxins, and radionucleotides can enter milk from the bloodstream via various mechanisms including passive diffusion and/or the ability to bind to plasma proteins.
The passage of contaminants into milk is determined by various different factors including molecular weight, lipid solubility, protein binding, degree of ionization, volume of distribution, half-life, and pKa of the contaminant. Contaminants with high molecular weights (600 Da and over), low lipid solubility, a large volume of distribution, high protein binding, and short half-lives are less likely to be transfer into milk [111].
Contaminants possessing the ability to diffuse passively across the blood–milk barrier are predominantly small, non-polar molecules; large polar molecules cannot pass the blood–milk barrier via this mechanism. In general, polar molecules have difficultly crossing phospholipid membranes and diffusion alone would occur extremely slowly. For some polar molecules, facilitative diffusion is sometimes possible if they can combine with membrane bound carrier proteins that shield the molecules from the hydrophobic membrane core [112].
An important factor in determining the transfer rate of contaminants from blood to milk is the blood–milk pH gradient. In healthy animals, milk usually possesses a lower pH than plasma. However, in diseased animals, for example animals exhibiting mastitis, changes to the pH gradient may result in milk having an equal or higher pH than plasma. This effect can alter the blood–milk barrier and increase the rate of transfer of contaminants into milk [113]. The amount of contaminant excreted into the milk is further determined by its ability to bind to plasma proteins, along with its molecular weight and lipophilicity.
To assess whether or not an individual urease inhibitor or nitrification inhibitor could impact milk quality and pose a threat to food safety, it is necessary to assess each inhibitor of interest individually, based on their physiochemical properties and their ability to withstand digestion and/or pass through the blood–milk barrier. NBPT possesses both a polar phosphoramide region and a lipophilic butyl chain allowing it to interact with both polar and non-polar phases according to its chemical structure. NBPT, however, possesses a log Pow value of 0.444 indicating a slight preference for the lipid phase. NPPT and 2-NPT are, similarly, slightly lipophilic. In contrast, DCD has a log Pow value of −1.0 (polar) and will preferentially associate with the aqueous phase. There are some advantages to using NBPT over DCD in terms of the potential risk, albeit negligible, of transfer to food products. NBPT has a much lower application rate e.g., 0.29 kg ha−1 compared to 20 kg ha−1 for DCD. It also has a much shorter half-life, as low as <1 d [56] compared to DCD, which is cited to have a half-life of approximately 37 d [23].
However, research is still needed to assess how each inhibitor will behave both within the animal and in various milk matrices [114]. It will also be important, should inhibitors be found in milk, to determine the effects of dairy processing unit operations i.e., heat treatment, membrane separation, evaporation, etc., on these compounds and their associated chemical species within different milk processing streams.

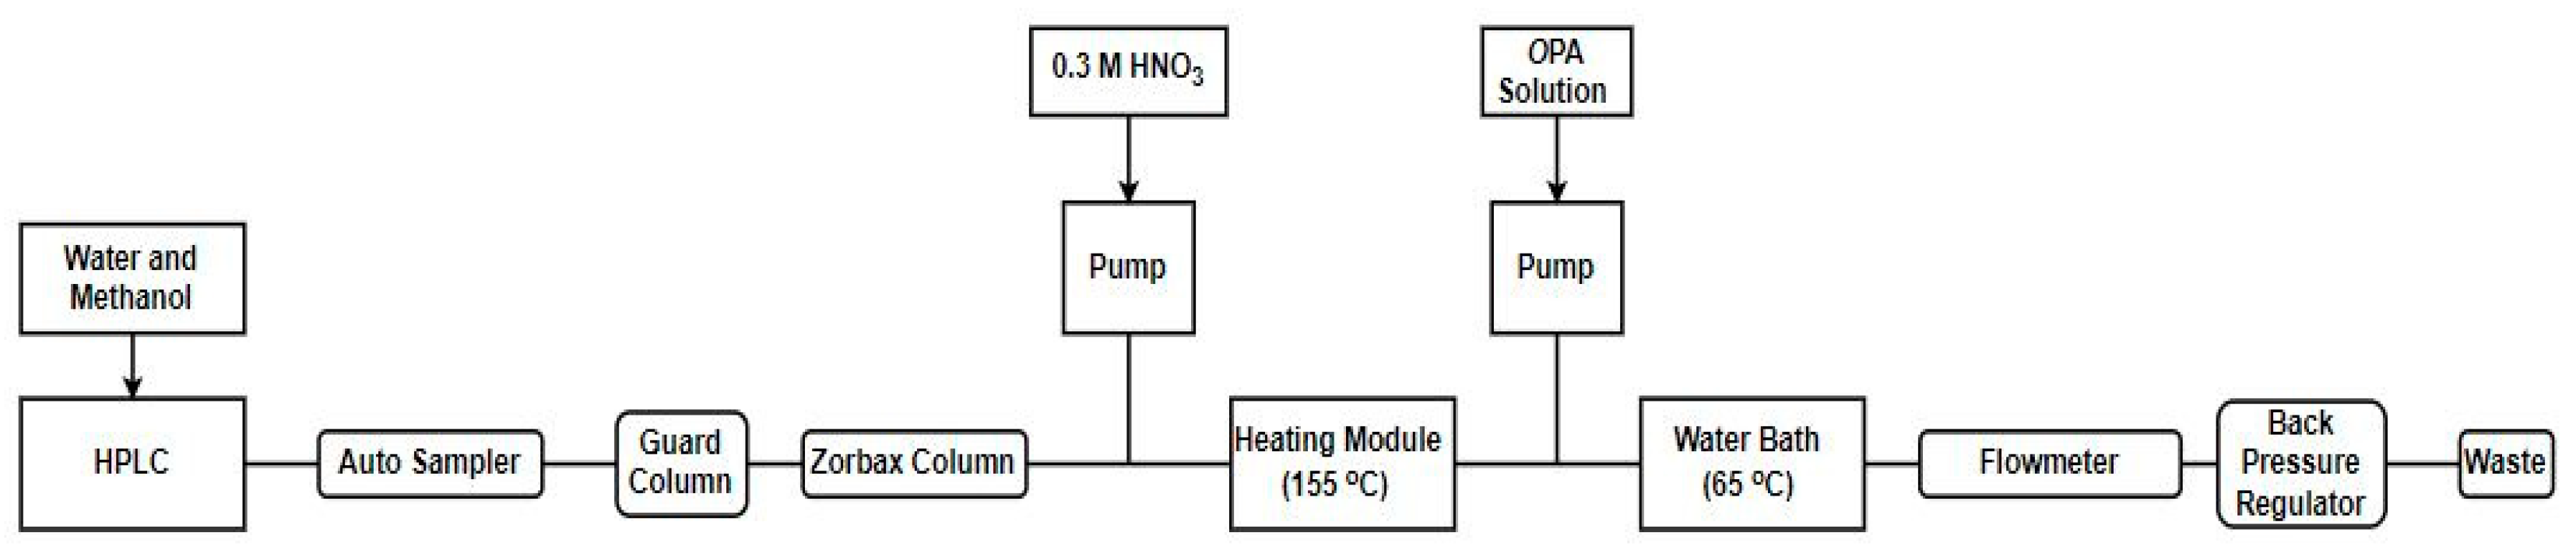
9. Analytical Methods for the Detection of Inhibitors in Complex Milk and Environmental Matrices

Milk contains many matrix components that can interfere with analysis, including fat, proteins, and sugars. Some level of sample preparation is nearly always required in residue analysis to eliminate matrix inference and allow adequate measurement [115]. Numerous methods have been published to analyze urease and nitrification inhibitors in various matrices, but few have been adapted to food samples (Table 10). Many methods have been developed based on HPLC-UV, but this technique is suitable for the analysis of fertilizer formulations; whereas more selective detection systems such as HPLC fluorescence or liquid chromatography coupled to tandem mass spectrometry (LC-MS/MS) are better suited for measuring the lower concentrations that might be found in food or environmental samples.
The majority of chromatographic methods for analyzing urease and nitrification inhibitors including NBPT have been developed for environmental matrices (Table 10). NBPT and NBPTo are polar residues and can be retained on reverse-phase HPLC systems.
Douglass and Hendrickson [116] reported an early method that allowed the simultaneous analysis of NBPT and NBPTo using a C18 separation and post-column derivatization with fluorescence detection (Figure 3). Following separation, the analytes were sequentially hydrolyzed to n-butylamine with nitric acid at 155 °C and then converted to fluorescent derivatives using o-phthaladehyde (OPA). The authors found that a 1000-fold improvement in sensitivity could be achieved using fluorescent detection compared with HPLC-UV.
Douglass and Hendrickson [116] conducted a 14-day stability study in which solutions of NBPT and NBPTo were stored at −20, 4, and 25 °C and found that solutions of NBPT and NBPTo can be stored at room temperature or refrigerated for 14 d. Decomposition was significantly accelerated especially in acidic solutions upon freezing; therefore, methanol must be added to solutions stored below 0 °C to ensure that they do not freeze.
Engel et al. 2015 [56] used HPLC-MS and quantified NBA in soil extracts using a modified OPA and sodium sulfite derivatization protocol. The authors reported that both NBPT and NBPTo were unstable in acid pH hydrolyzing to NBA at room temperature and concluded that NBPT and NBPTo breakdown is highly influenced by pH with chemical hydrolysis being the dominant pathway at pH (5.1–7.6) and microbial hydrolysis becoming the dominant pathway at pH (8.2).
LC-MS/MS has been used by a number of groups for the detection of various inhibitors in fertilizers, water, and food samples. A recent method for the detection of NBPT in milk and various edible tissue samples was established by van de ligt et al. 2019 [68] (Table 10). The authors reported that NBPT residues were found to be unstable in milk samples and required storage at −80 °C to ensure stability. This agrees with the previous findings by Engel et. al. [56]. One possible explanation for the instability of NBPT in milk, could be due to its pH which is generally slightly acidic (pH between 6.5 and 6.7). Thus, pH and temperature control are critical to the analysis of NBPT and NBPTo residues in milk.
Methods for the detection of DCD in various matrices are also summarized in (Table 10). An early HPLC method developed by Schwarzer and Haselwandter was used to detect DCD in soil [120]. This method has been adapted and utilized by Welten et al. [107] to assess excretion routes of DCD in cattle that received repeat oral administration of the compound and how its ultimate excretion in urine influenced its efficacy in soil. Welten et al. 2016 [108] also assessed the oral administration of DCD to lactating dairy cows and its effect and presence as a residue in milk; the study also assessed the efficacy of DCD delivery via a supplementary feed [107,108]. Some more recent techniques for the detection of DCD in milk and infant formula include ultra-fast liquid chromatography-tandem quadrupole mass spectrometry (UFLC-MS/MS) [123], hydrophilic interaction liquid chromatography with tandem mass spectrometry (HILIC-MS/MS) [124,125], UV spectroscopy, and UV spectrophotometry [126,127].
There are also various methods currently available for the analysis of multiple inhibitors. One validated method published in 2018 utilized an LC-MS/MS for the detection of both NBPT and DCD in a urea fertilizer matrix (Table 10). Previous literature stated that NBPT and DCD co-elute during separation and therefore, an Obelsc-R column (4.6 × 150 mm, 5 um particle size) was utilized. Due to the presence of both positively charged (quaternary amine like) and negatively charged (carboxyl type) ions in the columns stationary phase, which aided separation through added electrostatic interactions and repulsions of target analytes, both target analytes were linear over a range of 1.0–15 ppm. The respective limits of detection of each of the target analytes were found to be 25 and 5 μg/kg, with recoveries of 96.7 to 105% [118].
Marco Scheurer et al. (2016) investigated the occurrence and fate of nitrification and urease inhibitors in the aquatic environment (Table 10). The method utilized an LC-ESI-MS/MS with an (Applied Biosystems/MDS Sciex API 5500 Q-Trap triple-quadrupole). The method was developed for the detection of various nitrification and urease inhibitors including DCD, NBPT, 2-NPT, 1H-1,2,4-triazole, and 3 MP, and 3,4-DMPP. Achieving LOQs of 20, 30, 50, 100, and 250 μg/kg, respectively [119].
Other methods for the detection of urease inhibitors include colorimetric detection utilizing gold nanoparticles for the detection of urea, urease, and urease inhibitors [128]. Urease inhibition can also be detected utilizing a fluorometric assay on a multilayer microfluidic chip with immunoaffinity immobilized enzyme reactors [129].

10. Conclusions

The potential of urease and nitrification inhibitors to lower greenhouse gas emissions from the mass application of agricultural fertilizers has long been recognized. Such inhibitor technologies have the potential to greatly improve the sustainability of the grass-fed dairy industry. Although previous research suggests that the risk of inhibitors contaminating milk and dairy products is low, further studies are required to ensure that these additives do not pose any substantial threat to food safety and human health. The development of accurate and robust analytical methods for the detection of urease and nitrification inhibitors at residual levels in foods is also required. Modeling studies are required to predict the fate of urease and nitrification inhibitors in the environment and to identify and map their potential to become residual contaminants. Such research can be used to drive the regulation and implementation of MRLs for dairy products. Helping to ensure sustainable agri-industry growth targets while protecting the environment and safeguarding the quality of dairy products is key to viable farming practices in the future. The correct use of urease and nitrification inhibitors is well documented to promote significant reductions in N2O and NH3 emissions from agriculture and offers enormous potential for the development of a more sustainable dairy industry. Better knowledge on the implications of their use on the environment, food production, and human health can only help to establish their full potential as a means of achieving globally accepted climate change targets.

Author Contributions

Conceptualization, M.P.B.; Investigation, M.P.B.; Writing—Original Draft Preparation, M.P.B., P.J.F and T.F.O.; Writing—Review and Editing, M.P.B., T.F.O., S.A.H., E.C., M.D., C.G.N., P.J.F., K.R. and J.T.T.; Supervision, T.F.O., S.A.H., and E.C.; Project Administration, P.J.F., K.R. and J.T.T. All authors have read and agreed to the published version of the manuscript.

Funding

The authors would like to thank the Department of Agriculture Food and the Marine DAFM for project funding (17F207), Teagasc and University College Dublin.

Conflicts of Interest

The authors declare no conflict of interest.

References

  1. Hertel, T.W. The global supply and demand for agricultural land in 2050: A perfect storm in the making? Am. J. Agric. Econ. 2011, 93, 259–275. [Google Scholar] [CrossRef]
  2. Irish Department of Communications, Climate and Environoment—National Mitigation Plan July 2017 Ireland. Available online: https://www.dccae.gov.ie/en-ie/climate-action/publications/Documents/7/National%20Mitigation%20Plan%202017.pdf (accessed on 9 June 2020).
  3. European Commission. 2020 Climate & Energy Package; European Commission: Brussels, Belgium, 2009. [Google Scholar]
  4. EuropeanCommission. 2030 Climate & Energy Framework; European Commission: Brussels, Belgium, 2014. [Google Scholar]
  5. EuroStat. Agri-Environmental Indicator-Greenhouse Gas Emission; European Commission: Brussels, Belgium, 2017. [Google Scholar]
  6. EPA. Ireland’s Greenhouse Gas Emission Projections 2012-2030; Envionmental Protection Agency: Washington, DC, USA, 2013. [Google Scholar]
  7. Roche, L.; Forrestal, P.; Lanigan, G.; Richards, K.; Shaw, L.; Wall, D. Impact of fertiliser nitrogen formulation, and N stabilisers on nitrous oxide emissions in spring barley. Agric. Ecosyst. Environ. 2016, 233, 229–237. [Google Scholar] [CrossRef]
  8. Minet, E.; Jahangir, M.; Krol, D.; Rochford, N.; Fenton, O.; Rooney, D.; Lanigan, G.; Forrestal, P.; Breslin, C.; Richards, K.; et al. Amendment of cattle slurry with the nitrification inhibitor dicyandiamide during storage: A new effective and practical N2O mitigation measure for landspreading. Agric. Ecosyst. Environ. 2016, 215, 68–75. [Google Scholar] [CrossRef] [Green Version]
  9. Cantarella, H.; Otto, R.; Soares, J.R.; Silva, A.G.; de Brito, S. Agronomic efficiency of NBPT as a urease inhibitor: A review. J. Adv. Res. 2018, 13, 19–27. [Google Scholar] [CrossRef] [PubMed]
  10. Danaher, M.; Jordan, K. Identification of existing and emerging chemical residue contamination concerns in milk. Ir. J. Agric. Food Res. 2013, 52, 173–183. [Google Scholar]
  11. Singh, S.N.; Verma, A. The potential of nitrification inhibitors to manage the pollution effect of nitrogen fertilizers in agricultural and other soils: A review. Environ. Rev. 2007, 9, 266–279. [Google Scholar] [CrossRef]
  12. Change, C. Synthesis Report of the IPCC Fifth Assessment Report; IPCC: Geneva, Switzerlad, 2014. [Google Scholar]
  13. Forster, P.; Ramaswamy, V.; Artaxo, P.; Berntsen, T.; Betts, R.; Fahey, D.W.; Haywood, J.; Lean, J.; Lowe, D.C.; Myhre, G.; et al. Changes in atmospheric constituents and in radiative forcing. Chapter 2. In Climate Change 2007; The Physical Science Basis; IPCC: Geneva, Switzerlad, 2007. [Google Scholar]
  14. Hyde, B.; Forrestal, P.J.; Jahangir, M.M.; Ryan, M.; Fanning, A.; Carton, O.T.; Lanigan, G.; Richards, K.G. The interactive effects of fertiliser nitrogen with dung and urine on nitrous oxide emissions in grassland. Ir. J. Agric. Food Res. 2016, 55, 1–9. [Google Scholar] [CrossRef] [Green Version]
  15. Burger, M.; Venterea, R.T. Understanding Greenhouse Gas Emissions from Agricultural Management; Guo, L., Gunasekara, A.S., McConnell, L.L., Eds.; American Chemical Society: Washington, DC, USA, 2011; Volume 1072, pp. 179–202. [Google Scholar]
  16. Bøckman, O.C.; Olfs, H.W. Fertilizers, agronomy and N2O. Nutr. Cycl. Agroecosyst. 1998, 52, 165–170. [Google Scholar] [CrossRef]
  17. Signor, D.; Cerri, C.E.P. Nitrous oxide emissions in agricultural soils: A review. Pesqui. Agropecuária Trop. 2013, 43, 322–338. [Google Scholar] [CrossRef]
  18. Minick, K.; Pandey, C.; Fox, T.; Subedi, S. Dissimilatory nitrate reduction to ammonium and N2O flux: Effect of soil redox potential and N fertilization in loblolly pine forests. Biol. Fertil. Soils 2016, 52, 601–614. [Google Scholar] [CrossRef]
  19. Florio, A.; Bréfort, C.; Gervaix, J.; Bérard, A.; Le Roux, X. The responses of NO2-and N2O-reducing bacteria to maize inoculation by the PGPR Azospirillum lipoferum CRT1 depend on carbon availability and determine soil gross and net N2O production. Soil Biol. Biochem. 2019, 136, 107524. [Google Scholar] [CrossRef]
  20. Ferrara, R.M.; Loubet, B.; Decuq, C.; Palumbo, A.D.; Di Tommasi, P.; Magliulo, V.; Masson, S.; Personne, E.; Cellier, P.; Rana, G.; et al. Ammonia volatilisation following urea fertilisation in an irrigated sorghum crop in Italy. Agric. For. Meteorol 2014, 195–196, 179–191. [Google Scholar] [CrossRef]
  21. Hyde, B.P.; Carton, O.T.; O’Toole, P.; Misselbrook, T.H. A new inventory of ammonia emissions from Irish agriculture. Atmos. Environ. 2003, 37, 55–62. [Google Scholar] [CrossRef]
  22. Zaman, M.; Nguyen, M.; Blennerhassett, J.; Quin, B. Reducing NH3, N2O and NO3–N losses from a pasture soil with urease or nitrification inhibitors and elemental S-amended nitrogenous fertilizers. Biol. Fertil. Soils 2008, 44, 693–705. [Google Scholar] [CrossRef]
  23. Harty, M.A.; Forrestal, P.J.; Watson, C.J.; McGeough, K.L.; Carolan, R.; Elliot, C.; Krol, D.; Laughlin, R.J.; Richards, K.G.; Lanigan, G.J.; et al. Reducing nitrous oxide emissions by changing June d N fertiliser use from calcium ammonium nitrate (CAN) to urea based formulations. Sci. Total Environ. 2016, 563–564, 576–586. [Google Scholar] [CrossRef] [Green Version]
  24. Gilsanz, C.; Báez, D.; Misselbrook, T.H.; Dhanoa, M.S.; Cárdenas, L.M. Development of emission factors and efficiency of two nitrification inhibitors, DCD and DMPP. Agric. Ecosyst. Environ. 2016, 216, 1–8. [Google Scholar] [CrossRef]
  25. Shibata, H.; Branquinho, C.; McDowell, W.H.; Mitchell, M.J.; Monteith, D.T.; Tang, J.; Arvola, L.; Cruz, C.; Cusack, D.F.; Halada, L.; et al. Consequence of altered nitrogen cycles in the coupled human and ecological system under changing climate: The need for long-term and site-based research. Ambio 2015, 44, 178–193. [Google Scholar] [CrossRef] [Green Version]
  26. Kafarski, P.; Talma, M. Recent advances in design of new urease inhibitors: A review. J. Adv. Res. 2018, 13, 101–112. [Google Scholar] [CrossRef]
  27. Overrein, L.N.; Moe, P.G. Factors affecting urea hydrolysis and ammonia volatilization in soil1. Soil Sci. Soc. Am. J. 1967, 31, 57–61. [Google Scholar] [CrossRef]
  28. COMMISSION REGULATION (EC) No 1107/2008 of Amending Regulation (EC) No 2003/2003 of the European Parliament and of the Council Relating to Fertilisers; European Parliament: Brussel, Belgium, 7 November 2008.
  29. The European Food Safty Authority. Opinion of the Scientific Panel on Food Additives, Flavourings, Processing Aids and Materials in Contact with Food on a request from the Commission related toCreatine monohydrate for use in foods for particular nutritional uses Question number EFSA-Q-2003-12. EFSA J. 2004, 36, 1–6. [Google Scholar] [CrossRef]
  30. REGULATION (EC) No 2003/2003 of the European Parliament and of the Council of 13 October 2003 Relating to Fertilisers; Europian Parliament: Brussel, Belgium, 2003.
  31. European Commission. COMMISSION REGULATION (EU) No 1257/2014 Amending Regulation (EC) No 2003/2003; Eurpoean Parliament: Brussel, Belgium, 2014. [Google Scholar]
  32. The European Chemicals Agency ECHA. Nitrapyrin. Available online: https://echa.europa.eu/substance-information/-/substanceinfo/100.016.076 (accessed on 9 June 2020).
  33. European Commission. COMMISSION REGULATION (EU) 2019/1102; European Parliament: Brussel, Belgium, 2019. [Google Scholar]
  34. Manunza, B.; Deiana, S.; Pintore, M.; Gessa, C. The binding mechanism of urea, hydroxamic acid and N-(N-butyl)-phosphoric triamide to the urease active site. A comparative molecular dynamics study. Soil Biol. Biochem. 1999, 31, 789–796. [Google Scholar] [CrossRef]
  35. Kumari, D.; Qian, X.Y.; Pan, X.; Achal, V.; Li, Q.; Gadd, G.M. Microbially-induced carbonate precipitation for immobilization of toxic metals. In Advances in Applied Microbiology; Elsevier: Amsterdam, The Netherlands, 2016; Volume 94, pp. 79–108. [Google Scholar]
  36. Hadjipavlou-Litina, D.; Gupta, S.P. Design and development of inhibitors of herpes viral proteases and their SAR and QSAR. In Viral Proteases and Their Inhibitors; Elsevier: Amsterdam, The Netherlands, 2017; pp. 441–467. [Google Scholar]
  37. Shah, M.R.; Soomro, Z.H. Urease inhibition. In Enzyme Inhibition and Bioapplications; InTech: London, UK, 2012. [Google Scholar]
  38. Upadhyay, L.S.B. Urease Inhibitors: A Review; NISCAIR-CSIR: New Delhi, India, 2012. [Google Scholar]
  39. Engelking, L.R. Textbook of Veterinary Physiological Chemistry, Updated 2/e; Academic Press: Cambridge, MA, USA, 2010. [Google Scholar]
  40. Krajewska, B.; Ureases, I. Functional, catalytic and kinetic properties: A review. J. Mol. Catal. B. Enzym. 2009, 59, 9–21. [Google Scholar] [CrossRef]
  41. Mazzei, L.; Cianci, M.; Benini, S.; Ciurli, S. The impact of pH on catalytically critical protein conformational changes: The case of the urease, a nickel enzyme. Chem. Eur. J. 2019, 25, 12145–12158. [Google Scholar] [CrossRef] [PubMed]
  42. Mazzei, L.; Cianci, M.; Contaldo, U.; Musiani, F.; Ciurli, S. Urease inhibition in the presence of N-(n-Butyl) thiophosphoric triamide, a suicide substrate: Structure and kinetics. Biochemistry 2017, 56, 5391–5404. [Google Scholar] [PubMed]
  43. Karamanos, R.; Holzapfel, C.; Nybo, B.; Puurveen, D.; Shirtliffe, S. The impact of DCD and NBPT concentration on nitrification and volatilization. In Proceedings of the Soils and Crops Workshop, Saskatoon, SK, Canada, 9–10 March 2019. [Google Scholar]
  44. Ning, J.; Ai, S.; Cui, L. Dicyandiamide has more inhibitory activities on nitrification than thiosulfate. PLoS ONE 2018, 13, e0200598. [Google Scholar] [CrossRef] [Green Version]
  45. Ruser, R.; Schulz, R. The effect of nitrification inhibitors on the nitrous oxide (N2O) release from agricultural soils—A review. J. Plant Nutr. Soil Sci. 2015, 178, 171–188. [Google Scholar] [CrossRef]
  46. Torralbo, F.; Menéndez, S.; Barrena, I.; Estavillo, J.M.; Marino, D.; González-Murua, C. Dimethyl pyrazol-based nitrification inhibitors effect on nitrifying and denitrifying bacteria to mitigate N2O emission. Sci. Rep. 2017, 7, 1–11. [Google Scholar] [CrossRef]
  47. Forrestal, P.J.; Harty, M.; Carolan, R.; Lanigan, G.J.; Watson, C.J.; Laughlin, R.J.; McNeill, G.; Chambers, B.J.; Richards, K.G. Ammonia emissions from urea, stabilized urea and calcium ammonium nitrate: Insights into loss abatement in temperate grassland. Soil Use Manag. 2016, 32, 92–100. [Google Scholar] [CrossRef] [Green Version]
  48. Watson, C.J.; Miller, H. Short-term effects of urea amended with the urease inhibitor N-(n-butyl) thiophosphoric triamide on perennial ryegrass. Plant Soil 1996, 184, 33–45. [Google Scholar] [CrossRef]
  49. Forrestal, P.J.; Harty, M.A.; Carolan, R.; Watson, C.J.; Lanigan, G.J.; Wall, D.P.; Hennessy, D.; Richards, K.G. Can the agronomic performance of urea equal calcium ammonium nitrate across nitrogen rates in temperate grassland? Soil Use Manag. 2017, 33, 243–251. [Google Scholar] [CrossRef]
  50. Domínguez, M.J.; Sanmartín, C.; Font, M.; Palop, J.A.; San Francisco, S.; Urrutia, O.; Houdusse, F.; García-Mina, J.M. Design, synthesis, and biological evaluation of phosphoramide derivatives as urease inhibitors. J. Agric. Food Chem. 2008, 56, 3721–3731. [Google Scholar] [CrossRef] [PubMed]
  51. Rochette, P.; MacDonald, J.D.; Angers, D.A.; Chantigny, M.H.; Gasser, M.O.; Bertrand, N. Banding of urea increased ammonia volatilization in a dry acidic soil. J. Environ. Qual. 2009, 38, 1383–1390. [Google Scholar] [CrossRef] [PubMed]
  52. Engel, R.; Williams, E.; Wallander, R.; Hilmer, J. Apparent persistence of N-(n-butyl) thiophosphoric triamide is greater in alkaline soils. Soil Sci. Soc. Am. J. 2013, 77, 1424–1429. [Google Scholar] [CrossRef]
  53. The European Chemicals Agency ECHA. [diamino(sulfanylidene)-lambda5-phosphanyl](propyl)amine. Available online: https://echa.europa.eu/substance-information/-/substanceinfo/100.127.866 (accessed on 9 June 2020).
  54. Pro, D.; Huguet, S.; Arkoun, M.; Nugier-Chauvin, C.; Garcia-Mina, J.M.; Ourry, A.; Wolbert, D.; Yvin, J.C.; Ferrières, V. From algal polysaccharides to cyclodextrins to stabilize a urease inhibitor. Carbohydr. Polym. 2014, 112, 145–151. [Google Scholar] [CrossRef] [PubMed]
  55. The Australian Governoment Department of Health and Aging; National Industrial Chemicals Notification and Assessment Scheme NICNAS. Existing Chemical Secondary Notification Assessment NA/467S N-(n-butyl) Thiophosphoric Triamide (NBPT) Aging; The Australian Governoment Department of Health and Aging: Sydney, Australia, 2011. [Google Scholar]
  56. Engel, R.E.; Towey, B.D.; Gravens, E. Degradation of the urease inhibitor NBPT as affected by soil pH. Soil Sci. Soc. Am. J. 2015, 79, 1674–1683. [Google Scholar] [CrossRef]
  57. The European Chemicals Agency. NPPT; ECHA: Helsinki, Finland, 2019. [Google Scholar]
  58. The European Chemicals Agency ECHA. N-(2-nitrophenyl)phosphoric Triamide. Available online: https://echa.europa.eu/substance-information/-/substanceinfo/100.105.163 (accessed on 9 June 2020).
  59. The European Chemicals Agency ECHA. Cyanoguanidine. Available online: https://echa-term.echa.europa.eu/da/web/guest/substance-information/-/substanceinfo/100.006.649 (accessed on 9 June 2020).
  60. The European Chemicals Agency ECHA. 3,4-Dimethyl-1H-pyrazol-1-ium Dihydrogen Phosphate. Available online: https://echa.europa.eu/substance-information/-/substanceinfo/100.102.315 (accessed on 9 June 2020).
  61. Marsden, K.A.; Marín-Martínez, A.J.; Vallejo, A.; Hill, P.W.; Jones, D.L.; Chadwick, D.R. The mobility of nitrification inhibitors under simulated ruminant urine deposition and rainfall: A comparison between DCD and DMPP. Biol. Fertility Soils 2016, 52, 491–503. [Google Scholar] [CrossRef] [Green Version]
  62. Tao, L.; Yuanliang, S.; Xuewen, L.; Guolin, L. Degradation and its affecting factors of NBPT in soil. Chin. J. Ecol. 2006, 25, 1082–1086. [Google Scholar]
  63. ECHA, E.C.A. Pre-registered Reach Substances. Available online: https://echa.europa.eu/information-on-chemicals/pre-registered-substances/-/dislist/substance/100.112.861 (accessed on 5 June 2019).
  64. Leo, A.; Hansch, C.; Elkins, D. Partition coefficients and their uses. Chem. Rev. 1971, 71, 525–616. [Google Scholar] [CrossRef]
  65. The Australian Governoment Department of Health and Aging; National Industrial Chemicals Notification and Assessment Scheme NICNAS. N-(n-butyl) Thiophosphoric Triamide (NBPT) Aging; The Australian Governoment Department of Health and Aging: Sydney, Australia, 1997. [Google Scholar]
  66. Silva, A.G.; Sequeira, C.H.; Sermarini, R.A.; Otto, R. Urease inhibitor NBPT on ammonia volatilization and crop productivity: A meta-analysis. Agron. J. 2017, 109, 1–13. [Google Scholar] [CrossRef]
  67. Ramaty, E.; Maor, E.; Peltz-Sinvani, N.; Brom, A.; Grinfeld, A.; Kivity, S.; Segev, S.; Sidi, Y.; Kessler, T.; Sela, B.; et al. Low ALT blood levels predict long-term all-cause mortality among adults. A historical prospective cohort study. Eur. J. Intern. Med. 2014, 25, 919–921. [Google Scholar]
  68. Van de Ligt, J.; Borghoff, S.J.; Yoon, M.; Ferguson, L.J.; DeMaio, W.; McClanahan, R.H. Nondetectable or minimal detectable residue levels of N-(n-butyl) thiophosphoric triamide in bovine tissues and milk from a 28-d NBPT dosing study. Transl. Anim. Sci. 2019, 3. [Google Scholar] [CrossRef]
  69. Li, Q.; Yang, A.; Wang, Z.; Roelcke, M.; Chen, X.; Zhang, F.; Pasda, G.; Zerulla, W.; Wissemeier, A.H.; Liu, X.; et al. Effect of a new urease inhibitor on ammonia volatilization and nitrogen utilization in wheat in north and northwest China. Field Crops Res. 2015, 175, 96–105. [Google Scholar] [CrossRef]
  70. Li, S.; Li, J.; Lu, J.; Wang, Z. Effect of mixed urease inhibitors on N losses from surface-applied urea. Intern. J. Agric. Sci. Technol. 2015, 3, 23–27. [Google Scholar] [CrossRef] [Green Version]
  71. Li, Q.; Cui, X.; Liu, X.; Roelcke, M.; Pasda, G.; Zerulla, W.; Wissemeier, A.H.; Chen, X.; Goulding, K.; Zhang, F.; et al. A new urease-inhibiting formulation decreases ammonia volatilization and improves maize nitrogen utilization in North China Plain. Sci. Rep. 2017, 7, 43853. [Google Scholar] [CrossRef] [PubMed] [Green Version]
  72. Ni, K.; Kage, H.; Pacholski, A. Effects of novel nitrification and urease inhibitors (DCD/TZ and 2-NPT) on N2O emissions from surface applied urea: An incubation study. Atmos. Environ. 2018, 175, 75–82. [Google Scholar] [CrossRef]
  73. Ni, K.; Pacholski, A.; Kage, H. Ammonia volatilization after application of urea to winter wheat over 3 years affected by novel urease and nitrification inhibitors. Agric. Ecosyst. Environ. 2014, 197, 184–194. [Google Scholar] [CrossRef]
  74. Schraml, M.; Gutser, R.; Schmidhalter, U. Abatement of NH3 emissions following application of urea to grassland by means of the new urease inhibitor 2-NPT. In Proceedings of the 18th Symposium of the International Scientific Centre of Fertilizers, Rome, Italy, 8–12 November 2010. [Google Scholar]
  75. Kirschke, T.; Spott, O.; Vetterlein, D. Impact of urease and nitrification inhibitor on NH4+ and NO3 dynamic in soil after urea spring application under field conditions evaluated by soil extraction and soil solution sampling. J. Plant Nutr. Soil Sci. 2019, 182, 441–450. [Google Scholar] [CrossRef]
  76. Lan, T.; Han, Y.; Roelcke, M.; Nieder, R.; Cai, Z. Effects of the nitrification inhibitor dicyandiamide (DCD) on gross N transformation rates and mitigating N2O emission in paddy soils. Soil Biol. Biochem. 2013, 67, 174–182. [Google Scholar] [CrossRef]
  77. Skiba, U.; Smith, K.A.; Fowler, D. Nitrification and denitrification as sources of nitric oxide and nitrous oxide in a sandy loam soil. Soil Biol. Biochem. 1993, 25, 1527–1536. [Google Scholar] [CrossRef]
  78. McTaggart, I.; Clayton, H.; Parker, J.; Swan, L.; Smith, K.A. Nitrous oxide emissions from grassland and spring barley, following N fertiliser application with and without nitrification inhibitors. Biol. Fertil. Soils 1997, 25, 261–268. [Google Scholar] [CrossRef]
  79. McGeough, K.L.; Watson, C.J.; Müller, C.; Laughlin, R.J.; Chadwick, D.R. Evidence that the efficacy of the nitrification inhibitor dicyandiamide (DCD) is affected by soil properties in UK soils. Soil Biol. Biochem. 2016, 94, 222–232. [Google Scholar] [CrossRef]
  80. Zerulla, W.; Barth, T.; Dressel, J.; Erhardt, K.; Horchler von Locquenghien, K.; Pasda, G.; Rädle, M.; Wissemeier, A. 3,4-Dimethylpyrazole phosphate (DMPP)–A new nitrification inhibitor for agriculture and horticulture. Biol. Fertil. Soils 2001, 34, 79–84. [Google Scholar] [CrossRef]
  81. Rodrigues, J.M.; Lasa, B.; Aparicio-Tejo, P.M.; González-Murua, C.; Marino, D. 3,4-Dimethylpyrazole phosphate and 2-(N-3,4-dimethyl-1H-pyrazol-1-yl) succinic acid isomeric mixture nitrification inhibitors: Quantification in plant tissues and toxicity assays. Sci. Total Environ. 2018, 624, 1180–1186. [Google Scholar] [CrossRef] [PubMed]
  82. Cahalan, E.; Minet, E.; Ernfors, M.; Müller, C.; Devaney, D.; Forrestal, P.J.; Richards, K.G. The effect of precipitation and application rate on dicyandiamide persistence and efficiency in two Irish grassland soils. Soil Use Manag. 2015, 31, 367–374. [Google Scholar] [CrossRef] [Green Version]
  83. Shepherd, M.; Wyatt, J.; Welten, B. Effect of soil type and rainfall on dicyandiamide concentrations in drainage from lysimeters. Soil Res. 2012, 50, 67–75. [Google Scholar] [CrossRef]
  84. Zacherl, B.; Amberger, A. Effect of the nitrification inhibitors dicyandiamide, nitrapyrin and thiourea onNitrosomonas europaea. Fertil. Res. 1990, 22, 37–44. [Google Scholar] [CrossRef]
  85. Klotz, M.G.; Stein, L.Y. Research on Nitrification and Related Processes; Academic Press: Cambridge, MA, USA, 2011; Volume 496. [Google Scholar]
  86. Cameron, K.C.; Di, H.J.; Moir, J.L. Nitrogen losses from the soil/plant system: A review. Ann. Appl. Biol. 2013, 162, 145–173. [Google Scholar] [CrossRef]
  87. Di, H.J.; Cameron, K.C. The use of a nitrification inhibitor, dicyandiamide (DCD), to decrease nitrate leaching and nitrous oxide emissions in a simulated grazed and irrigated grassland. Soil Use Manag. 2002, 18, 395–403. [Google Scholar] [CrossRef]
  88. Subbarao, G.; Ito, O.; Sahrawat, K.; Berry, W.; Nakahara, K.; Ishikawa, T.; Watanabe, T.; Suenaga, K.; Rondon, M.; Rao, I.M.; et al. Scope and strategies for regulation of nitrification in agricultural systems—Challenges and opportunities. Crit. Rev. Plant Sci. 2006, 25, 303–335. [Google Scholar] [CrossRef] [Green Version]
  89. Kuo, J. Air Pollution Control: Fundamentals and Applications; CRC Press: Boca Raton, FL, USA, 2018. [Google Scholar]
  90. Hauser, M.; Haselwandter, K. Degradation of dicyandiamide by soil bacteria. Soil Biol. Biochem. 1990, 22, 113–114. [Google Scholar] [CrossRef]
  91. Wilcock, R.; Elliott, S.; Hudson, N.; Parkyn, S.; Quinn, J. Climate change mitigation for agriculture: Water quality benefits and costs. Water Sci. Technol. 2008, 58, 2093–2099. [Google Scholar] [CrossRef] [PubMed] [Green Version]
  92. Espín, S.; García-Fernández, A. Nitrapyrin. In Encyclopedia of Toxicology, 3rd ed.; Elsevier: Amsterdam, The Netherlands, 2014; pp. 519–522. [Google Scholar]
  93. Keiblinger, K.M.; Zehetner, F.; Mentler, A.; Zechmeister-Boltenstern, S. Biochar application increases sorption of nitrification inhibitor 3,4-dimethylpyrazole phosphate in soil. Environ. Sci. Pollut. Res. 2018, 25, 11173–11177. [Google Scholar] [CrossRef] [Green Version]
  94. Huérfano, X.; Fuertes-Mendizábal, T.; Fernández-Diez, K.; Estavillo, J.M.; González-Murua, C.; Menéndez, S. The new nitrification inhibitor 3, 4-dimethylpyrazole succinic (DMPSA) as an alternative to DMPP for reducing N2O emissions from wheat crops under humid Mediterranean conditions. Eur. J. Agron. 2016, 80, 78–87. [Google Scholar] [CrossRef]
  95. Pacholski, A.; Berger, N.; Bustamante, I.; Ruser, R.; Guardia, G.; Mannheim, T. Effects of the novel nitrification inhibitor DMPSA on yield, mineral N dynamics and N2O emissions. In Proceedings of the 2016 International Nitrogen Initiative Conference, Solutions to Improve Nitrogen Use Efficiency for the World, Melbourne, Australia, 4–8 December 2016. [Google Scholar]
  96. The European Chemicals Agency ECHA. Reaction Mass of 2-(3,4-Dimethyl-1H-pyrazol-1-yl)succinic Acid and 2-(4,5-Dimethyl-1H-pyrazol-1-yl)succinic Acid. Available online: https://echa.europa.eu/da/registration-dossier/-/registered-dossier/11890/2/3 (accessed on 9 June 2020).
  97. Soliman, M.S.; Monem, M.A.A. Effect of method of N-application and modified urea on N-15 recovery by rice. Fertil. Res. 1995, 43, 143–148. [Google Scholar] [CrossRef]
  98. Xu, X.; Zhou, L.; Van Cleemput, O.; Wang, Z. Fate of urea-15N in a soil-wheat system as influenced by urease inhibitor hydroquinone and nitrification inhibitor dicyandiamide. Plant Soil 2000, 220, 261–270. [Google Scholar] [CrossRef]
  99. Gioacchini, P.; Nastri, A.; Marzadori, C.; Giovannini, C.; Antisari, L.V.; Gessa, C. Influence of urease and nitrification inhibitors on N losses from soils fertilized with urea. Biol. Fertil. Soils 2002, 36, 129–135. [Google Scholar] [CrossRef]
  100. Zanin, L.; Tomasi, N.; Zamboni, A.; Varanini, Z.; Pinton, R. The urease inhibitor NBPT negatively affects DUR3-mediated uptake and assimilation of urea in maize roots. Front. Plant Sci. 2015, 6, 1007. [Google Scholar] [CrossRef] [Green Version]
  101. Cruchaga, S.; Artola, E.; Lasa, B.; Ariz, I.; Ignacio, I.; Moran, J.; Aparicio-Tejo, P. Short term physiological implications of NBPT application on the N metabolism of Pisum sativum and Spinacea oleracea. J. Plant Physiol. 2010, 168, 329–336. [Google Scholar] [CrossRef]
  102. Krogmeier, M.J.; McCarty, G.W.; Bremner, J.M. Potential phytotoxicity associated with the use of soil urease inhibitors. Proc. Natl. Acad. Sci. USA 1989, 86, 1110–1112. [Google Scholar] [CrossRef] [Green Version]
  103. Ariz, I.; Cruchaga, S.; Lasa, B.; Moran, J.F.; Jauregui, I.; Aparicio-Tejo, P.M. The physiological implications of urease inhibitors on N metabolism during germination of Pisum sativum and Spinacea oleracea seeds. J. Plant Physiol. 2012, 169, 673–681. [Google Scholar] [CrossRef] [Green Version]
  104. Zacharia, J.T. Identity, physical and chemical properties of pesticides. In Pesticides in the Modern World-Trends in Pesticides Analysis; BoD–Books on Demand: Norderstedt, Germany, 2011; pp. 1–18. [Google Scholar]
  105. Constable, P.D.; Hinchcliff, K.W.; Done, S.H.; Grünberg, W. Veterinary Medicine-e-Book: A Textbook of the Diseases of Cattle, Horses, Hheep, Pigs and Goats; Elsevier Health Sciences: Amsterdam, The Netherlands, 2016. [Google Scholar]
  106. O’Connor, P.J.; Hennessy, D.; Lynch, M.B.; Slattery, H.; Lewis, E. The effect of dicyandiamide on rumen and blood metabolites, diet digestibility and urinary excretion. Livest. Sci. 2013, 155, 30–37. [Google Scholar] [CrossRef]
  107. Welten, B.G.; Ledgard, S.F.; Schipper, L.A.; Waller, J.E.; Kear, M.J.; Dexter, M.M. Effects of prolonged oral administration of dicyandiamide to dairy heifers on excretion in urine and efficacy in soil. Agric. Ecosyst. Environ. 2013, 173, 28–36. [Google Scholar] [CrossRef]
  108. Welten, B.; Ledgard, S.; Balvert, S.; Kear, M.; Dexter, M. Effects of oral administration of dicyandiamide to lactating dairy cows on residues in milk and the efficacy of delivery via a supplementary feed source. Agric. Ecosyst. Environ. 2016, 217, 111–118. [Google Scholar] [CrossRef]
  109. Minet, E.; Ledgard, S.; Lanigan, G.; Murphy, J.; Grant, J.; Hennessy, D.; Lewis, E.; Forrestal, P.; Richards, K. Mixing dicyandiamide (DCD) with supplementary feeds for cattle: An effective method to deliver a nitrification inhibitor in urine patches. Agric. Ecosyst. Environ. 2016, 231, 114–121. [Google Scholar] [CrossRef]
  110. Luo, J.; Ledgard, S.; Wise, B.; Welten, B.; Lindsey, S.; Judge, A.; Sprosen, M. Effect of dicyandiamide (DCD) delivery method, application rate, and season on pasture urine patch nitrous oxide emissions. Biol. Fertil. Soils 2015, 51, 453–464. [Google Scholar] [CrossRef]
  111. Kelsey, J.J. Drug Principles in Lactation. Available online: https://www.accp.com/docs/bookstore/psap/p2016b3_sample.pdf (accessed on 20 June 2020).
  112. Peck, T.; Hill, S.; Williams, M. Drug passage across the cell membrane. In Pharmacology for Anaesthesia and Intensive Care, 2nd ed.; Greenwich Medical Media: London, UK, 2003. [Google Scholar]
  113. Fink-Gremmels, J. Mycotoxins in cattle feeds and carry-over to dairy milk: A review. Food Addit. Contam. 2008, 25, 172–180. [Google Scholar] [CrossRef] [Green Version]
  114. Bhal, S.K. LogP—Making Sense of the Value; Advanced Chemistry Development: Toronto, ON, Canada, 2007; pp. 1–4. [Google Scholar]
  115. Rainard, P. Consequences of interference of milk with chemoattractants for enzyme-linked immunosorbent assay quantifications. Clin. Vaccine Immunol. CVI 2010, 17, 848–852. [Google Scholar] [CrossRef] [Green Version]
  116. Douglass, E.A.; Hendrickson, L.L. HPLC Method for the Analysis of the Urease Inhibitor N-(n-butyl) thiophosphoric Triamide and Its Metabolites. J. Agric. Food Chem. 1991, 39, 2318–2321. [Google Scholar] [CrossRef]
  117. Fertilizers, E. Determination of Urease Inhibitor N-(nbutyl) Thiophosphoric Triamide (NBPT) Using High-Performance Liquid Chromatography (HPLC); European Commission: Brussel, Belgium, 2007. [Google Scholar]
  118. Yogesha, S.; Arun, K.; Shetty, S.G.; Ravi, H.; Ramesh, N. Simultaneous quantification of N-butylthiophosphoric triamide and dicyandiamide in urea formulation by liquid chromatography with tandem mass spectrometry. J. Sep. Sci. 2018, 42, 484–490. [Google Scholar] [CrossRef]
  119. Scheurer, M.; Brauch, H.J.; Schmidt, C.K.; Sacher, F. Occurrence and fate of nitrification and urease inhibitors in the aquatic environment. Environ. Sci. Proces. Impacts 2016, 18, 999–1010. [Google Scholar] [CrossRef]
  120. Schwarzer, C.; Haselwandter, K. Rapid quantification of the nitrification inhibitor dicyandiamide in soil samples, nutrient media and bacterial cell-free extracts. J. Chromatogr. A 1996, 732, 390–393. [Google Scholar] [CrossRef]
  121. Shen, Y.; Han, C.; Zhou, X.; Chen, X.; Huang, F.; Zhu, Z. Microwave-assisted extraction and determination of dicyandiamide residue in infant formula samples by liquid chromatography-tandem mass spectrometry. J. Dairy Sci. 2013, 96, 6877–6882. [Google Scholar] [CrossRef] [PubMed] [Green Version]
  122. MacMahon, S.; Begley, T.H.; Diachenko, G.W.; Stromgren, S.A. A liquid chromatography–tandem mass spectrometry method for the detection of economically motivated adulteration in protein-containing foods. J. Chromatogr. A 2012, 1220, 101–107. [Google Scholar] [CrossRef] [PubMed]
  123. Chen, X.H.; Zhou, L.X.; Zhao, Y.G.; Pan, S.D.; Jin, M.C. Application of nanoring amino-functionalized magnetic polymer dispersive micro-solid-phase extraction and ultra fast liquid chromatography–tandem mass spectrometry in dicyandiamide residue analysis of powdered milk. Talanta 2014, 119, 187–192. [Google Scholar] [CrossRef] [PubMed]
  124. Inoue, K.; Sakamoto, T.; Min, J.Z.; Todoroki, K.; Toyo’oka, T. Determination of dicyandiamide in infant formula by stable isotope dilution hydrophilic interaction liquid chromatography with tandem mass spectrometry. Food Chem. 2014, 156, 390–393. [Google Scholar] [CrossRef]
  125. Draher, J.; Pound, V.; Reddy, T.M. Validation of a rapid method of analysis using ultrahigh-performance liquid chromatography-tandem mass spectrometry for nitrogen-rich adulterants in nutritional food ingredients. J. Chromatogr. A 2014, 1373, 106–113. [Google Scholar] [CrossRef]
  126. Zou, H.; Xu, K.; Feng, Y.; Liang, B. Application of first order derivative UV spectrophotometry coupled with H-point standard addition to the simultaneous determination of melamine and dicyandiamide in milk. Food Anal. Methods 2015, 8, 740–748. [Google Scholar] [CrossRef]
  127. Zou, H.; Zhang, W.; Feng, Y.; Liang, B. Simultaneous determination of melamine and dicyandiamide in milk by UV spectroscopy coupled with chemometrics. Anal. Methods 2014, 6, 5865–5871. [Google Scholar] [CrossRef]
  128. Deng, H.H.; Hong, G.L.; Lin, F.L.; Liu, A.L.; Xia, X.H.; Chen, W. Colorimetric detection of urea, urease, and urease inhibitor based on the peroxidase-like activity of gold nanoparticles. Anal. Chim. Acta 2016, 915, 74–80. [Google Scholar] [CrossRef]
  129. Zhang, Y.; Han, X.; He, N.; Long, M.; Huang, J.; Zhang, G.; Wang, Q.; Han, X. Increase in ammonia volatilization from soil in response to N deposition in Inner Mongolia grasslands. Atmos. Environ. 2014, 84, 156–162. [Google Scholar] [CrossRef]
Figure 1. Primary pathways for Nitrogen loss.
Sustainability 12 06018 g001
Figure 2. Breakdown products of N-(n-butyl) thiophosphoric triamide (NBPT).
Sustainability 12 06018 g002
Figure 3. Schematic diagram of HPLC and post-column reaction system as used by Douglass and Hendrickson [116].
Sustainability 12 06018 g003
Table 1. Inhibitor augmentation and corresponding EU regulations.
Inhibitor Augmentation Based on % (w/w) by Mass of the total N Present as AN and Urea
Compound Name Inhibitor Class Min %
(w/w)
Max %
(w/w)
EC No 1RR Status 2TTB 3References
NBPTUrease Inhibitor 0.090.2435-740-7Full 100–1000 tpa[30]
Mixture NBPT and NPPT (ratio 3:1 (1)) 0.020.3700-457-210–100 tpa[31]
2-NPT0.040.15477-690-910–100 tpa[30]
DCDNitrification Inhibitor 2.34.5207-312-8Full10,000–100,000 tpa[30]
Nitrapyrin N/AN/A217-682-2100–1000 tpa[32]
DMPP0.81.6424-640-9100–1000 tpa[31]
Isomeric mixture of 2-(3,4-dimethylpyrazole-1-yl)-succinic acid and DMPSA0.81.6940-877-5100 + tpa[33]
1 European Community number (EC No) unique seven-digit identifier that is assigned under substances under Reach regulation; 2 REACH Registration (RR); 3 Total Tonnage Band (TTB) the amount of substance that can be purchased without notification to the authorities (in tons per annum, tpa).
Table 2. Inhibition classification and properties of urease and nitrification inhibitors of agricultural interest.
Compound NameInhibitor ClassMode of Inhibition ActionInhibitor Chemical ClassInhibition Type Enzyme References
NBPTUrease inhibitor (Urea Analogue)Delays urea hydrolysis via urease inhibition OrganicCompetitive, irreversible (suicide substrate)Urease [9,39]
NPPT[9,39]
2-NPTCompetitive Metal chelator[9,39]
DCDNitrification inhibitor Inhibition of oxidation of NH3 to NO2 via inhibition of ammonia monooxygenase (AMO)OrganicCompetitive Metal chelatorAmmonia monooxygenase (AMO)[43,44]
NitrapyrinNon-competitive, Metal chelator[45]
DMPPMetal chelator[45]
DMPSAExpected to be competitive[46]
Table 3. Physiochemical properties of urease and nitrification inhibitors of agricultural interest.
Compound Class/Use Molecular FormulaMolecular Weight Melting Point Relative Density Vapor Pressure Water Solubility Log PowReferences
Sustainability 12 06018 i001
NBPT
C4H14N3PS167.259.1 °C at 101,300 Pa1.22 ca. at 20 °C0 Pa at 20 °C43.04 g/L at 25 °C pH = 7.26.0.444 at 20 °C[53]
Sustainability 12 06018 i002
NPPT
Urease inhibitionC3H14N3PS153.18691 °C at 101,325 Pa1.253 at 20 °C0 Pa at 20 °C 51.5 g/L at 20 °C 0.3 at 24 °C [57]
Sustainability 12 06018 i003
2-NPT
C6H9N4O3P216.13>260 °C 1.558 at 20 °C0 Pa at 20 °C 1394 mg/L at 20 °C 0.51 at 25 °C [58]
Sustainability 12 06018 i004
DCD
Nitrification inhibition C2H4N484.08210−212 °C1.4040.0045 Pa40 g/L−1.0 at 20 +/− 0.5 °C [59]
Sustainability 12 06018 i005
DMPP
C5H11N2O4P194.2165 °C1.51<10−4 at 20 °C and 50 °C.132 g/L −1 at pH 3 and 25 °C0.92[60,61]
Sustainability 12 06018 i006
DMPSA
C9H12N2O4 150–178 °C at ca. 1013 hPa1.402 at 20 °C0.002 Pa at 25 °C15.7 g/L at 20 °C, pH 1.9<−2.2 at 21 °C, pH 6[60]
Sustainability 12 06018 i007
Nitrapyrin
C6H3Cl4N230.962.5–63.6 °C1.55 at 20 °C0.37–0.64 Pa at 22.8–25 °C20.1–40.1 mg/L at 18.5–20 °C3.325–3.41 at 23.5–25 °C[32]
Table 4. Summary of available NBPT toxicology.
CompoundAnimal ParameterExposure TypeMethod of Administration Dose (mg/kg/bw)SexToxicology Results and Clinical Observations References
NBPTRatLD50 Acute exposureOral2000Male/FemaleLow toxicity via oral and dermal exposure, LD50 in rats exceeded 2000 mg/kg/bw [65]
Dermal
Guinea PigSkin SensitizerAcute exposureintradermal injections-Male/FemaleNot a skin sensitizer. [55]
RabbitOcular toxicity Acute exposureOcular0.1 mL of test material (AGROTAIN, 25% NBPT)Male/FemaleSevere eye irritant with irritation observed on the conjunctiva, cornea, and iris. [65]
RabbitOcular toxicity Acute exposureOcular0.1 mL of NBPT (white powder)Male/FemaleIrreversible eye damage. Scattered or subtle corneal opacity and vascularization noted in the treated eye. NBPT considered an irritant with the potential to cause severe of eye damage. [55]
RatNeurotoxicityRepeat exposure (13 weeks) Oral200, 1000 and 5000MaleDecreased food utilization and lower body weights noted at 5000 mg/kg bw. neurotoxic study observed decreased gripping strength in 5000 mg/kg bw male. No effect observed during ophthalmoscopic examination. [53]
FemaleDecreased food utilization and lower body weights noted at 5000 mg/kg bw. Decreased gripping strength and hunched posture observed in 5000 mg/kg bw females. No effect observed during ophthalmoscopic examination.
HemotologyRepeat exposure (13 weeks)Oral200, 1000 and 5000MaleAt 5000 mg/kg bw increase lymphocyte counts were observed which resulted in significantly lower white blood cell counts. Alanine transaminase (ALT) levels and aspartate aminotransferase (AST) at 500 and 1000 mg/kg bw decreased
FemaleAt 5000 mg/kg bw platelets, were significantly increased. Alanine transaminase (ALT) levels and Aspartate Aminotransferase (AST) at 500 and 1000 mg/kg bw decreased. Phosphorus levels significantly decreased at 200 and 1000 mg/kg bw.
Organ toxcicityRepeat exposure (13 weeks)Oral200, 1000 and 5000MaleIncrease in liver weights at 5000 mg/kg bw. Minimal centrilobular hepatocyte hypertrophy at 5000 mg/kg bw.
FemaleIncrease in uterine weights at 5000 mg/kg bw. Increased in uterine fluid and luminal distension at all dosages. Minimal centrilobular hepatocyte hypertrophy at 5000 mg/kg bw. Increased incidence of foci mineralization in kidney at 5000 mg/kg bw
RatNeurotoxicityRepeat exposure (15 d) Oral0, 250, 500, 1000 and 2000 Male/FemaleDecreases in cholinesterase levels observed in brain tissue and erythrocytes the at 500, 1000 and 2000 mg/kg bw [65]
HematologyRepeat exposure (15 d) Oral0, 250, 500, 1000 and 2000MaleLiver damage observed with no chlorosis at 500 mg/kg bw, no change in liver weight. At 500–2000 mg/kg bw decreased triglycerides observed.
FemaleLiver damage observed with no chorosis at 500 mg/kg/bw no change in liver weight. At 500 mg/kg/bw decreased blood urea & total cholesterol observed.
Organ toxcicity Repeat exposure (15 d) Oral0, 250, 500, 1000 and 2000Male/FemaleSpleen: body weight ratio affected at 500 mg/kg/bw and above.
RatReproductive toxicity Repeat exposure (over two generations) Oral0, 200, 800 and 3200 MaleAbnormalities in sperm counts at 84 mg/kg bw/day(d), male rats exhibited epididymal lesions. The No-observed-adverse-effect level (NOAEL) is 21 mg/kg bw/d. [55]
FemaleIncreases in uterine weight at 88 mg/kg bw/d. NOAEL females 17 mg/kg bw/d. NBPT meets the requirements to be classified as a category three reproductive toxin.
Neurotoxicity Repeat exposure (over two generations) Oral0, 200, 800 and 3200MaleDecreased erythrocyte cholinesterase levels at 800 and 3200 mg/kg/bw. NOAEL males 74 mg/kg bw/d. based on neurobehavioral changes.
FemaleDecreased erythrocyte cholinesterase levels at 800 and 3200 mg/kg/bw.
Hemotology Repeat exposure (over two generations) Oral0, 200, 800 and 3200MaleEffects on the liver and changes in hematology indicate a lowest-observed-adverse-effect level LOAEL of 377mg/kg bw/d.
FemaleLOAEL for females 17 mg/kg bw/d due to uterine changes.
Table 5. Summary of available N-propyl- thiosphosphoric- triamide (NPPT) toxicology.
CompoundAnimal ParameterExposure TypeMethod of Administration Dose (mg/kg/bw)SexToxicology Results and Clinical Observations References
NPPTRatLD50 Acute exposureOral2000Male/Female2000 mg/kg bw.[57]
LD50 Repeat exposure (28 d)Oral200Male200 mg/kg bw. NOAEL 18.1 mg/kg bw
Female200 mg/kg bw. NOAEL 19.8 mg/kg bw.
LD50 Acute exposureDermal 2000Male/Female2000 mg/kg bw.
Developmental toxicity Repeat Exposure Oral 100FemaleNOAEL 100 mg/kg bw.
Table 6. Summary of available 2-NPT toxicology.
CompoundAnimalParameterExposure TypeMethod of Administration Dose (mg/kg bw)SexToxicology Results and CLINICAL OBSERVATIONS References
2-NPTRatLD50 Acute exposureOral>2000 Male/Female>2000 mg/kg bw.[58]
Dermal
RatReproductive toxicity Repeat Exposure Oral0, 45, 135, 450 Male/FemaleNOAEL for parental animals is 45 mg/kg bw/d. NOAEL for reproductive toxicity and toxicity to first-generation pups is 135 mg/kg bw.
RatReproductive toxicity Repeat Exposure (28 d) Oral0, 30, 100 and 300MaleNOAEL 30 mg/kg bw. At 300 mg/kg/bw increased leucocyte count and decreased organ weights for testes and epididymides. Irreversible effects to the micro-orchidia and epididymides. Damage to the testes across all dose groups and high dose groups completely void of spermatozoa.
RatHemotologyRepeat Exposure (28 d) Oral0, 30, 100 and 300Male/FemaleDecreased levels of alkaline phosphatase and aspartate aminotransferase (AST) at high doses.
Rat Organ toxicityRepeat Exposure (28 d) Oral0, 30, 100 and 300MaleIncreased spleen weights. Dose-dependent kidney damage with degenerated tubular epithelium in the medulla of the kidneys observed at high doses. Dose dependent urine glucose increase. Discoloration of urine on day of administration.
FemaleDose-dependent kidney damage with degenerated tubular epithelium in the medulla of the kidneys at high doses. Dose-dependent urine glucose increase. Discoloration of urine on day of administration.
Table 7. Summary of available dicyandiamide (DCD) toxicology.
CompoundAnimal ParameterExposure TypeMethod of Administration Dose (mg/kg bw)SexToxicology Results and Clinical Observations References
DCDRatLD50Acute exposureOral10,000Male/Female10,000 mg/kg bw.[59]
RatLD50Acute exposureInhalation 259 mg/m³ Male/Female259 mg/m³
RatLD50Acute exposureDermal2000Male/Female2000 mg/kg bw.
RatReproductive toxicity Repeat exposure Oral0, 30, 100 and 300MaleNOEAL for Reproductive toxicity 15,000 mg/kg bw
FemaleNOEAL for Reproductive toxicity 15,000 mg/kg bw. Significantly lower body weights in the high dose females exposed to 50,000 mg/kg and slightly lower fertility and pregnancy rates in females in this group, therefore, the LOAEL for reproductive toxicity is 50,000 mg/kg.
RatTwo-year carcinogenicity study Chronic exposureOral Up to 50,000Male/FemaleNo increase in tumours; non-carcinogenic
Table 8. Summary of available Nitrapyrin toxicology.
CompoundAnimal ParameterExposure TypeMethod of Administration Dose (mg/kg bw)SexToxicology Results and Clinical Observations References
NitrapyrinRatLD50 Acute exposureOral 5000 Male/Female5000 mg/kg bw[32]
RatLD50 Acute exposureInhalation 630–3510 mg/m³ Male/Female630–3510 mg/m³
RabbitLD50 Acute exposureDermal2000 Male/Female2000 mg/kg bw.
RatNOEALRepeat exposureOral5 Male/FemaleNOAEL 5 mg/kg bw/day
RabbitNOEALRepeat exposureDermal2000, 2.2 mg/cm²Male/FemaleDermal NOAEL for systemic effects 1000 mg/kg bw/day, Dermal NOAEL for Local effects 2.2 mg/cm²
RatNOEAL Reproductive toxicity Repeat exposure Oral75, 50Male/FemaleNOEAL for Reproductive toxicity 75 mg/kg bw/day
NOEAL for Developmental toxicity 50 mg/kg bw/day
RatNOEAL NeurotoxicityRepeat exposureOral40Male/Female40 mg/kg bw/day
MouseNOAEL carcinogenicity Chronic exposureOral 125 Male/FemaleNOAEL 125 mg/kg bw/day
Table 9. Summary of available 4,5-dimethylpyrazole-1-yl-succinic acid (DMPSA) toxicology.
CompoundAnimal ParameterExposure TypeMethod of Administration Dose (mg/kg bw)SexToxicology Results and Clinical Observations References
DMPSARatLD50 Acute exposureOral >2000Male/Female>2000 mg/kg bw[32,96]
RatLD50 Acute exposureDermal>2000Male/Female>2000 mg/kg bw.
RatNOEALRepeat exposureOral≥1000Male/FemaleNOAEL ≥ 1000 mg/kg bw/day
RatNOEAL Reproductive toxicity Repeat exposure Oral1000Male/FemaleNOEAL for Reproductive toxicity 1000 mg/kg bw/day. No developmental effects were observed.
Table 10. Analytical methods of detection of urease and nitrification inhibitors in various matrices.
Detection Method Target Analytes MatrixSample Preparation Column Mobile Phase Observed Ions Limit of Quantification (LOQ) (μg/kg)References
HPLC & post-column derivatisation with fluorescence detectionNBPT, NBPTo, NBASoilExtracted with deionized water & filtered (0.22 µm)Zorbax-Rx C8 column (4.6 × 250 mm) 40% H2O 60% MeOHN/A1000 [117]
HPLCNBPT and NPPT Urea FertilizerDetailed in EN 1482-1C18 Nucleosil (250 mm × 4 mm, 5 μm)MeCN + H2O 10 + 90N/AN/A[118]
Detailed in EN 1482-1LiChroSpher C18 (250 mm × 4 mm, 5 μm)MeCN + H2O 15 + 85168.2 m/z and 74 m/zN/A
LC-MS/MS (Positive mode)DCD and NBPT Urea FertilizerDilution & filtration (0.45 μm)Obelsc-R column (4.6 × 150 mm, 5 um) (A) 0.05% formic acid + 10mM ammonium acetate + H20 (B) 0.05% formic acid + MeCNm/z values of 85→68 for DCD and m/z 168.2 → 74 for NBPT 25 & 5 respectively [119]
LC-ESI-MS/MS (Positive mode)DCD, NBPT, 2-NPT, 1H-1,2,4-triazole, and 3 MP, and 3,4-DMPPWater Dillution Hypercarb column (150 × 2.1 mm, 5 µm)(A) 0.01% formic acid in H2O & (B) MeOH and 0.01% formic acidm/z vaules 85.0 → 68.0 42.9, 168.1 → 95.0 74.0, 217.0 → 199.9 121.0, 73.0 → 44.0, 83.0 → 42.0 56.1, 97.0 → 56.1 42.0 respectively 20, 30, 50, 100 and 250 respectively [120]
LC/MS/MS (Positive mode)NBPT Milk, Tissues (Liver, Kidney, Mussel, Fat)Homogenization & extracted with acetonitrileLuna C8 column (50 × 2 mm, 3μm)(A) 0.2% formic acid and 0.012% NH4OH in H2O and (B) MeCN.168.1 m/z and product ion 74 m/z 50 in milk samples and 40 in tissue samples [68]
HPLC/ESI/QTOF (Positive mode)NBPT, NBPTo, NBA SoilExtraction with deionised water and centrifugationRRHD (50 × 2.1 mm 1.8 μm) C18(A) 20 mM ammonium formate (pH 6.5) & (B) MeCN[M+H]+ (168.02 m/z), [M+Na]+ (190.063), decay ions: [NBPTo+Na]+ (174.084), [NBPTo+H]+ (152.090), 151.046, and 135.071. NBA derivativem/z = 252.0640.3 nmole g-1 [56]
HPLCDCDSoil extracts, bacterial cultures, culture filtratesDilution, Deprotaination and centrifugationPrepacked cation H+-column (30×4.6 mm)Isocratic elution with 0.025M HeSO4N/A500 [121]
LC/MS/MS (Positive mode)DCD & 15N4-DCDInfant formulaMicrowave-assisted extraction with solid-phase extraction ZIC-HILIC HPLC column (150 × 2.1 mm i.d., 5-µm)(A) 20 mM ammonium acetate (B) MeCN85.0, 68.02, 43.0 89.0, 71.02, 45.03 and 10 [122]
LC/MS/MS (Positive mode)DCD, Urea, Biuret,Cyromazine, Triuret, Amidinourea,Melamine Wheat Flower & Skim Milk Extraction with 0.2% formic acid and MeCN, Centrifugation, Filtration (0.20 μm)ZIC-HILIC (150 mm × 2.1 mm, 5 μm)(A) (95:5 ACN:0.1% formic acid/10 mM ammonium formate in H2O) (B) (50:50 ACN:0.1% formic acid/10 mM ammonium formate in H2O)85.0 → 68.0→ 43.1, 61.0 → 44.0, 104.1 → 61.0 → 44.0, 147.1 → 130.1 → 104.1 → 61.1, 167.1 → 85.1 → 125 → 68.0, 103.1 → 60.1 → 43.1, 127.0 → 85.0 → 68.0(18, 60), (4320, 28800), (54, 240), (18, 180), (18, 180), (54, 240), (162, 480) [123]

