1. Introduction
Nowadays, organisations are forced to compete in utterly complex and globalised environments, facing massive natural, economic, and technological challenges on a daily basis. Addressing these challenges would be impossible without noticeable management of the performance of their business. It is essential to every business, no matter the size, scope, or resources to identify, measure, understand, and control the progress of that performance [
1,
2]. Measurement systems are needed to set organisational goals and to control the improvements by monitoring the effectiveness and efficiency [
3]. A common approach to carry out these measurements is through the use of KPIs metrics. KPIs provide an objective criterion for measuring business activities and project success [
4] and are a remarkably important part of corporate strategy for forecasting, measuring and planning business [
2].
However, it should be noted that performance metrics vary in their purpose, definition, and content. Therefore, different methodologies are used to define and select the business KPI’s, to make sure that they match the competitive environment and strategy. According to Iuga et al. [
2], three important criteria need to be taken into account for the optimal selection: Validity, helpfulness, and relevance; and to ensure that the measurement system is under control a disciplined methodology is needed.
The lean approach has been explored for defining, measuring, and monitoring performance. The methodology focuses on continuous process performance improvement and enables decision making based on real facts and data analysis, information and objective evidence gathered through quantification and estimation methods [
2,
5]. The lean concept is characterised by managing the efficiency and effectiveness of the organisation, by putting the emphasis on customer value and waste reduction.
So, lean consists of a set of principles and tools that have been implemented in a broader range of industries [
6,
7]. Although its origin was within manufacturing, it has also been applied in non-industrial organisations such as services [
8], banking, or healthcare [
9]. Also, lean focus has expanded in a broad range of disciplines like sales, product development [
8], project management (PM), and Research and Development (R&D) [
6,
10]. Although R&D is a new concept, some studies on lean R&D have been published, especially in the field of healthcare [
6,
7,
11].
Despite the fact that the mentioned concepts have been studied, a lack of homogeneous process for identification and measure of KPIs was detected. Although the adoption of KPIs in order to achieve objectives within the production environment is widely spread [
8], there is scarce research published on developing a model to identify the KPIs in project-based companies.
Literature concerning KPI’s in a project-based organization context is generally related to project success [
4,
12,
13]. The measures on which the success or failure of a project is judged are the success criteria and the KPIs are the factors that constitute those success criteria [
4]. Project management KPIs are crucial as they enable the progress of projects to be monitored. It must be ensured that KPIs are aligned with the organisation’s strategies, that the perspectives of all stakeholders are considered and that short- and long-term benefits are covered [
12]. Regarding the relationship between project management performance and project success in project-based organisations the KPI’s of the project management are the most significant variables for the success of a project [
12].
Measuring R&D and innovation (R&D&I) project performance and if a project is successful or not in project-based companies has become a fundamental concern for managers and executives in the last decades. As a result, the issue has been extensively debated in the literature. However, determining whether an R&D&I project is successful is a subtle matter [
14] and a challenging task. If someone is able to reach the top performance on your project, it does not guarantee that particular project will be successful.
R&D&I projects are complex per se, with several dependent phases that makes it even harder to determine project success factors criteria. It is clear that projects usually have multi-dimensions, and that different people involved in the project have different priorities. Therefore, not only should several dimensions for assessing the project success be considered, but also the fact that project success may vary over time based on different people’s interest [
15]. Davis [
16] stated that different project success dimensions (PSDs), such as time, mission and objective, project manager competencies, strategic benefits, and top management support, have different importance for different stakeholders.
This paper justifies and proposes the use of lean principles and techniques to identify KPIs in project-based organisations. A qualitative approach, based on SRL, was adopted, which was used to analyse and compare research about project success and the use of lean for the identification of performance metrics. Using the SLR output, a lean-based KPI model is proposed with the aim of being a guide for the identification of performance indicators in project-based organisations. For the elaboration of this model, Lean Six Sigma process so-called DMAIC (define–measure–analyse–improve–control) as a cycle-based approach [
17] was followed and adapted. Later, the model was validated through a case study in a R&D project-based organisation. Since the focus of this paper is on the identification and categorisation of KPIs, the validation, adequacy, and control of KPIs are recommended as future research.
This research will answer practical questions about how lean tools and principles lead to KPIs identification and which are the benefits from it. Additionally, it will be shown how a model for the identification of KPIs developed with lean will benefit project-based organisations.
In
Section 2, we will expand the research methodology and how it leads us to the Literature Review (
Section 3). Next, in
Section 4, the definition and description of the model will be discussed, followed by the description of the Case study in
Section 5. The results of the utilisation of the model will be shown in
Section 6, and general conclusions and future research will be given in
Section 7.
3. Literature Review Discussion
Lean is defined in many ways, some authors call it methodology, others philosophy [
18], yet there is a common consensus on its approach. In the literature, lean is explored from two broad ways: Strategic and operational. The first is associated with lean principles and goals, while the second refers to practical aspects related to its implementation, tools and techniques [
5].
Lean is based on five fundamental principles: Defining value from the customer perspective, identifying the value streams, making the value flow, implementing pull-based production, and striving for perfection continuously [
5]. It also focuses on waste elimination by improving process performances and value creation [
5,
8,
18]. The term waste in lean context is defined as an event or process that does not reflect customers value or generate any added value to the final output [
2]. Seven types of waste are usually described in lean literature: Transport, inventory, motion, waiting, over-processing, overproduction, and defects [
19]. Other researchers include an eighth kind of waste, the unused people’s creativity [
2]. Cherrafi et al. [
19] highlighted another concept to be considered, which is sustainability (economic, social, and environmental concepts) due to an increase in the environmental and social awareness.
The lean approach to customer value and the elimination of waste leads to the identification of an organisation performance indicators. Waste has a direct impact on performance [
19]; hence, some authors have researched on the definition of KPIs based on these types of waste. Iuga et al. [
2] explored KPIs selection criteria based on the same waste categories. The link between KPIs and the lean waste concept enables a wider perspective on the performance assessment analysis [
18].
3.1. Lean in Project-Based Organisations/R&D
Even though lean in R&D is a rather new approach [
6], there are studies from years ago that have explored the use of lean for performance improvement within this discipline. Marti [
11] explains how Lean Six Sigma leads to a better understanding of crucial customer requirements providing more value to services and to focus on improving critical areas of the R&D process. On the other hand, recent studies have also shown a positive impact in the implementation of lean within this area. Foruhi et al. [
10] demonstrate how lean principles and tools in R&D organisations can improve their key skills by increasing efficiency and reducing waste and therefore costs. Al et al. [
6] developed a model using lean to map and improve the functions of R&D project activities. Foruhi et al. [
10] identified and determined the customer value as the main focus of lean concepts and how can be applied to all disciplines including R&D. Hence, Panat et al. [
20], through a case study, demonstrated the benefits of using lean combined with Six Sigma methodology in the infrastructure and operations of the R&D organisation.
Lean can be used in conjunction with other improvement methodologies such as Six Sigma. Lean Six Sigma has been studied as a business strategy and methodology to measure and improve operational performance [
11]. By integrating the tools, techniques, and principles of both methodologies, it achieves to eliminate defects in processes and improves process performance focusing on customer value [
11,
19]. Lean Six Sigma is also used on projects with the aim of improving the process through workflow creation and elimination of variation [
21].
3.2. The DMAIC (Define, Measure, Analyse, Improve, Control) Methodology
The DMAIC is a Lean Six Sigma method consisted of five process phases: Define, measure, analyse, improve, control. In this study, the central idea behind DMAIC process is used for the creation of a lean KPI model by remaining focused on customer value.
3.2.1. Define Phase
In this phase, the scope of the project is aligned with the organisation strategy to detect in which aspects the performance meets or not the customer needs [
11]. One of the lean tools for identifying the needs and requirements is the voice of the customer (VoC) [
22]. The information captured with the VoC can be used to identify performance indicators.
Through VoC, critical requirements of the client and what he considers as value can be identified. By collecting the customer’s needs, the information can be structured in a hierarchical way prioritized in terms of relative importance and customer perceptions of performance [
22,
23]. In addition to the VoC, there is the voice of the business (VoB), which concerns what the organisation aims to achieve [
17].
3.2.2. Measure and Analyse Phase
During the measure phase, the VoC and VoB specifications are translated into measurable and controllable factors (quantitative data) through the critical to quality (CTQ) tool. The CTQs are specific quantifiable metrics that are linked to the organisation objectives [
24]. This tool displays the customer’s expectations towards the quality of a product. The CTQs are represented with a flow-down tree and when applied for performance indicators, some authors refer to them as CTQ [
25].
Figure 1 shows the generic representation methodology or a project where there is an input (e.g., requirements, statements) provided by a stakeholder (e.g., supplier, customer), where there is a process to deliver an output [
13]. In Lean Six Sigma, there is a similar mapping of a flow process known as SIPOC (supplier, input, process, output, customer) [
20]. This diagram also works as a guide to identify metrics as KPIs. In CTQ context, the outputs are represented by Ys and the factors that impact them, and the inputs by Xs [
21].
The CTQs are considered as performance indicators [
21]. KPIs, within the VoC, correspond to the CTQ characteristics, which are a set of indicators with clear targets and specified limits [
17]. Yang et al. [
25] specified the CTQ-Y as the KPIs of the CTQ. The specifications of the CTQs are the measures of the dependent variable (Y) and the Xs are the key variables or drivers. The factors affecting the CTQ can be represented by the Equation (1).
The current state of the CTQ is specified and the performance measures or key variables (Xs) are searched. In this phase, the potential Xs can be identified through a value stream map (VSM) [
21]. VSM is a process flow chart that identifies the added-value and non-value-added activities in a stream product transformation process [
5]. The VSM reveals hidden issues in the process, brings options to the surface, and enables the potential to maximise performance by eliminating the waste.
After defining and understanding the process, and having specified and documented the performance measurements, we proceed to the analysis phase. In this phase, the critical factors directly related to the Ys are established. The analyses of the data and process activities allow the detection of the main factors that have an impact on quality from the customer’s perspective (value-added) [
11].
3.2.3. Improve and Control Phase
The improve phase is for implementing the proposed methods and improvements [
18]. To control and monitor the progress, Cortes et al. [
18] recommended the use of a web application (e.g., customised dashboard) in order to access the required standards and project management tools. Since the focus of this paper is on the identification and categorisation of KPIs, the validation, adequacy, and control of KPIs are recommended as future research in the Conclusions section.
3.3. Key Performance Indicators (KPIs)
KPIs are metrics used by some organisations to track the success and guide their progress towards specific strategic objectives. In addition to business strategy, it is important to consider the corporate culture since there is a direct connection between the organizational culture and performance. A solid corporate culture drives the performance and each specific feature impacts the strategy’s implementation [
26]. Popa [
26] highlights that in order to develop KPIs, four main factors must be taken into account. First, ensuring that activities are in line with the objectives; second, collecting the required information to improve the activities; third, controlling and monitoring the activities and the people involved; supporting the reports for the stakeholders.
In a project context, the KPIs are linked to the project success or failure [
13]. These indicators have to be measurable and controllable therefore must be quantitative and qualitative [
4,
13]. All organisations are different and have their own needs and objectives, so KPIs must be tailored to each one; nevertheless, a general framework can be useful as a guide [
4]. Kerzner [
13] stated that a KPI’s most crucial attribute is that it is actionable, meaning that actions can be taken to correct any unfavourable trends.
Within the literature review, several descriptions of KPIs categories were detected. Cortes et al. [
18] cite five strategic KPIs categories: Cost, quality, flexibility, stock, and lead time. With these categories, they aimed to capture the company strategic goals and enable the alignment of strategic, tactical, and operational performance. Ogunlana [
4] identified several authors that included other performance measurements in addition to the classic iron triangle (time, cost, and quality): Customer satisfaction and overall satisfaction of stakeholders.
Within projects, Kerzner [
13] identifies time, cost, resources, scope, quality, and actions as core metrics for project management KPIs. Additionally, Ogunlana [
4] delves into performance measurements adding the capacity of the project team to manage project risks and solve problems found in projects in order to evaluate the success of the project. The authors also mentioned other research that suggested measuring project success by the technical performance efficiency of execution, managerial and organisational implications, personal growth, manufacturers’ ability, and business performance.
Furthermore, España et al. [
1] argues that conventional metrics such as cost, schedule, quality, and security should be used to support the system improvement and not as isolated parameters that request an individual response. The authors explain that evaluating together cost and schedule indicates whether the system is stable or corrective actions are needed, while the cost in conjunction with safety parameters suggest if the work is planned and performed correctly [
1].
Ogunlana [
4] highlight as future research to focus on the integration of the organisations KPIs with the following aspects: “
operational (time, cost and quality), life cycle (maintenance capacity, energy consumption and user satisfaction), strategic (inter-organisational co-operation, organisational learning) and socio-economic (social and human development)”. Moreover, the authors assured that the criteria for measuring the success of the projects should be based on strategy, sustainability, and safety. Yang et al. [
25] describe two categories of KPIs: Financial (e.g., increased sales and decreased material, inventory, and transport costs) and operational (e.g., cycle time, utilisation rate, delivery time, forecast accuracy). All the categorisation mentioned by the authors is summarised on
Table 1. These categories are an example of the categories that may be considered within an organisation.
Cortes et al. [
18] proposed a Lean Six-Sigma framework based on lean indicators for management support during lean implementation intending to lead tactical and operational decisions for performance improvement and maintenance. Lean tools such as the “five whys” and the root cause and effect analysis can be used for establishing performance indicators and for identifying improvement metrics.
The work of Dombrowski et al. [
8] proposed specific criteria of a measurement system for performance indicators in product development context. The criteria to be taken into account consists in: Relevance for the enterprise targets, quality data (based on the validity and timeliness of data), compatibility with the hierarchy, variability (react quickly to changes), periodicity, visualisation, and effort. Furthermore, Kerzner [
13] describes six fundamental characteristics for project-oriented KPIs: Predictive (future), measurable (quantitative), actionable (changes to correct), relevant (relationship to project success/failure), automated (reports minimise human error), and few in number (those needed).
Table 2 shows the characteristics that the KPIs should accomplish according to the literature analysed.
3.4. Project Success
As has been said, project success as the heart of project management, and the factors that affect it, is a commonly discussed topic in research in project management that has been studied by practitioners and academics since 1960s (it started with the definition of success in terms of the iron triangle, time, cost and quality [
27]; and remains relevant to the present day); however, there is not a unified definition [
15]. Moreover, we can distinguish two different components: Project success factors: Elements of a project that if influenced, increase the like hood of success (e.g., stakeholder, risk and quality management, etc.) and project success criteria: Measures used to judge on the success or failure of a project (e.g., stakeholder satisfaction, cost, scope, time, etc.) [
28].
The first impression of project success is a project implemented among the constraints of time, cost, and quality; however, project success is more than implementing the project within this iron triangle. Constrains and exceeds from those boundaries do not mean that the project was or not successful. Public opinion considers the Sydney Opera House as a successful project, even if it was 14 times over budget and time [
29]. Some researchers carried on upon that project and other similar ones led to highlighting two main issues. First of all, the differences in the perception of project success among different stakeholders, and secondly, the fact that project success is beyond controlling the iron triangle constraints and that more dimensions should be considered.
Based on questions like “What factors lead to project management success?” or “What factor lead to a successful project?”, Cooke-Davies [
30] defined the success criteria (SC) as indicators for measuring the success or failure of the projects, and identified 12 factors that are in one way or another, critical to project success. As well, Lim and Mohamed [
28] helped to define the success factors as the set of principles or standards for judgement about the success of a project. Among the top frequently cited on the literature we can identify support from senior management [
31], clear and realistic objectives [
27,
32], strong/detailed plan kept up to date [
33], good communication/feedback [
30], among others. Top management support was introduced as SF by Müller and Turner [
31], and by Pinto and Slevin [
27], project ownership [
34]. Also, Chan et al. [
35] stated that project team commitment, contractor competencies, risk and liability assessment, client competencies, users’ needs, and constraints imposed by users are project success factors (PSFs).
There are plenty of studies about the PSFs, each of which represented a wide range of success factors; however, these factors are usually listed or in a very general way or, with such specificity that can only be applied to a particular variety of projects. Nonetheless, in their research, Belassi and Tukel [
33] stressed grouping success factors and explain the interaction between them, putting aside the focus from the identification or specificity of such individual factors.
Although varied PSFs are introduced through numerous studies, Cooke-Davies [
30] stated that finding the projects’ real success factors is important. However, some of this PSFs are extremely important and must exist to ensure the project success; these are called critical success factors (CSFs). In their work, Fortune [
36] carried out a review of a series of publications that focused on CSFs, allowing them to identify which were the most frequent success factors mentioned on theoretical or empirical studies and the different stages of the project where these factors were evaluated, letting them conclude that the evaluation of some success factors on different phases of a particular project can help to determine if it is going to be successful or not. Pinto and Slevin [
27,
32] represented a list of CSFs, including: Technical tasks, client acceptance, power and politics, communication, client consultation, top management support, urgency, environmental events, and characteristics of the project manager, troubleshooting, and personnel recruitment.
As illustrated in
Table 3, various factors contribute positively or negatively to project success. Nevertheless, analyses of all success factors are extremely hard. Therefore, some authors grouped the CSFs under “success dimensions”, which make the evaluation and interpretation of project success more understandable. Different authors offered different dimensions to be used as criteria to judge project success.
4. Defining a Lean-Based KPIs Identification Model
In this study, a model for the identification of KPIs in a project context was developed. For the design of the model, the theoretical concepts previously analysed were used as a basis. Additionally, concepts from success factors and lean models related to performance measurement identified in other studies were considered in the design of the model.
Leading KPIs are established in a way that impacts the most relevant results of the organisation. Although the main indicators vary from one organisation to another, a process based on lean thinking can determine the KPIs of a company. The first step for defining the KPIs is to identify the organisation strategic objectives and the different impacted levels [
18]. Cortes et al. [
18] proposed a KPI classification, based on the work of Pakdil and Leonard [
43], and Gopinath and Freiheit [
44], in line with the main lean fundamentals. Roberts and Latorre [
45] in their research made a critical analysis of the KPI measurement system. The model proposed is based on selecting the categories from SLR, so the needs identified from the customers (VoC) and the organisational strategies and objectives (VoB) can be set in an organised form. Once that process is completed, the identification of the parameters to be measured as a driver to accomplish the future KPI. Next, the identification of the CTQs gives the information required to raise the performance indicators. Following this, we propose a tie in a measurement to that indicator (e.g., number of, percentage of, amount of, etc.), and finally, the organisation goal must be set. The proposed model to defining and establishing KPIs for projects is resumed in
Table 4.
5. Case study—CFAA (Advanced Manufacturing Centre for Aeronautics)
Looking for strategies to increase the innovative capacity of universities and thus boost the local economy, the collaboration between companies and universities has been an institutional strategy used to guide ideas, inventions, and innovations generated in universities and transmit them to the industrial and social network [
46]. The machine-tool and advanced aeronautical manufacturing sectors have been some of the strategic areas for the economy of the Basque Country in Spain over the last few decades, generating a turnover of up to 3.83 billion Euros [
47]. In this context, the creation of a Research, Development, and Innovation (R&D&I) Centre with focus on advanced aeronautical manufacturing technologies that could integrate these two sectors with the University and allow the easy and fast transmission to the industrial production ecosystem associated with the value chain was a fairly straightforward decision [
48]. The result was the Centre for Advanced Manufacturing in Aeronautics (CFAA, in Spanish), an open and shared space for researchers, students, and professionals of the sector, companies, and research centres at national and international level, where applied knowledge, technologies and new methodologies for the previously mentioned sectors are being developed.
CFAA was created to operate within the structure of the University of the Basque Country /Euskal Herriko Unibersitatea (UPV/EHU), and emerges from the agreement signed between the UPV/EHU and a group of aeronautical and machine tool companies, and is supported in its origin, constitution, and in the acquisition of facilities and machinery by the Regional Government of Bizkaia and by the Society for Competitive Transformation (SPRI)
The R&D&I projects carried on at CFAA are located between Technology Readiness Level (TRL) 5–7 [
49], which guarantee a quick knowledge transfer, and promote mutual benefits to companies and universities from a micro up to a macro-economic point of view, so that universities obtain funding to conduct their research and train staff to enable them responding positively to the demands of the labour market [
50]. In addition, it advocates for fostering the relations between companies from different sectors, and in the university–business axis [
51,
52].
Current Situation
The role of the CFAA within the projects is, on the one hand, to filter out projects that are in line with their strategy, and from those that result, test their economic, scientific, and technical feasibility in an industrial environment designed and equipped to simulate a real factory. On the other hand, CFAA on its own, and thanks to the interaction of different scientific groups, proposes, develops, and tests advanced manufacturing technologies, techniques, and applied knowledge, born from state-of-the-art research.
CFAA is a project-based organisation, where the success of their projects takes great relevance and a determinant role in the present and future opportunities for the Centre, in the form of being able to participate, or present itself to European calls, taking part in international and specialised clusters, or attracting young and professional talent. However, some studies carried on CFAA had demonstrated that there are still significant improvement opportunities to measure and improve the rate of success in this Centre [
53].
To date, almost 300 projects have been carried out with a success rate close to 70%, meaning that the results obtained are being used by the company (or group of companies) that leads the project. This result is thanks to close co-operation between researchers, technicians, University experts, project managers and company staff, collaborating on the prevention of wrong pathways taken at early stages of the project.
Since its inception, CFAA has been committed to boosting scientific activity and contributing to various scientific publications e.g., journals with different impact rates, conferences, book chapters, etc. From 2017, the impact of the CFAA and its manufacturing groups is reflected on more than 140 scientific publications (March 2020) which have generated more than 840 citations. Also, 11 doctoral theses have been developed. Currently, CFAA is working on the implementation of a project management methodology developed ad hoc for the Centre, whose objective is to manage projects, programmes, and portfolios, and push the organisation towards more agility and efficiency [
54].
Despite the good state of the CFAA regarding its scientific production, use of resources, collaboration with institutions, and participation in co-operation projects at European level, several of the general objectives set for the Centre [
55] and those described in the Centre’s Quality Manual, are not being adequately studied, described, and measured.
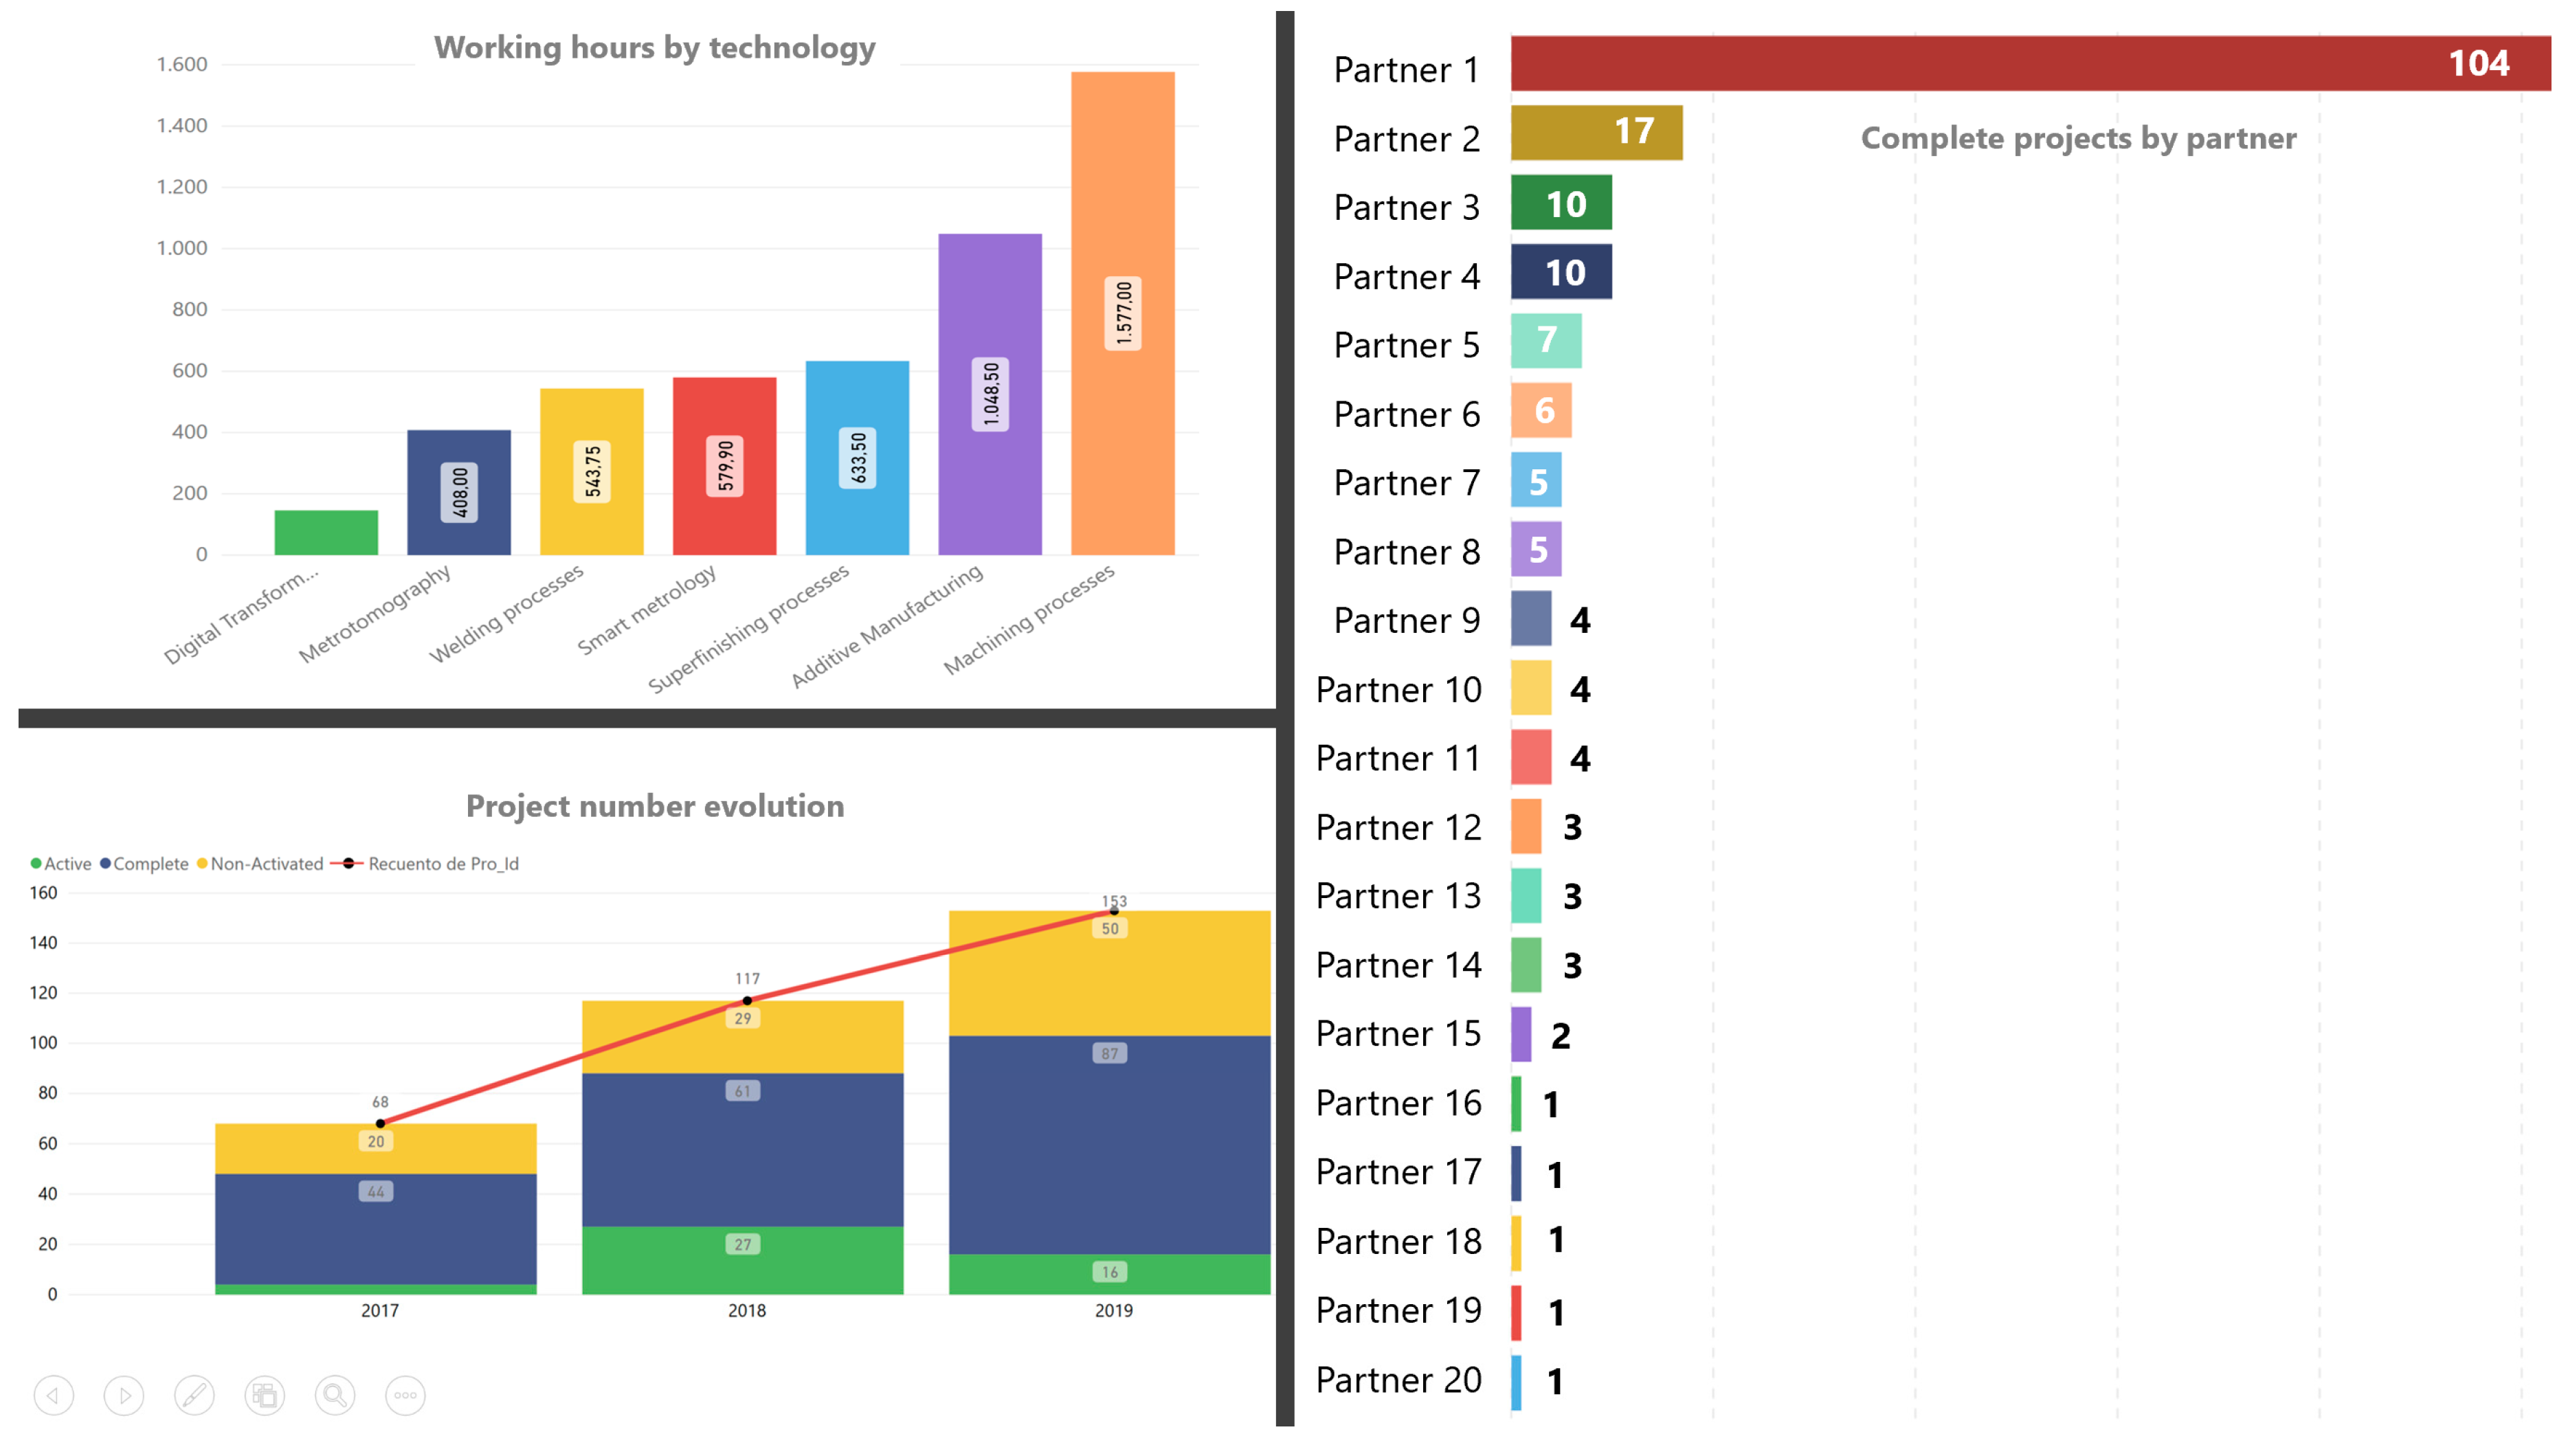
To date, a few quantifications of consumed hours in projects, number of projects developed, and hours spend using the resources of the CFAA, are being measured (
Figure 2). Leaving room for a new set of KPIs oriented to measure the performance of organisational and production needs.
6. Applying the Lean-Based KPIs Identification to the Case Study
Burimova et al. [
56] carried on a study in order to obtain a clear picture of what “Success” means for CFAA and their most important stakeholders. The study was constructed following one of the most critical remarks behind project success, which is that the success of the project depends on which area (or dimension) is inspected, therefore these areas need to be addressed individually, including not just the business side, but also people management. Consequently, it is crucial to define and evaluate the success criteria at different dimensions. For that study, the success dimensions chosen were:
Project Management Success Dimensions (PMSD): Focus on the aspects that are necessary for the right management of the project, e.g., control of time, cost and scope, compliance of quality standards, resources and stakeholder’s management, etc.
Delivery Activities Success Dimensions (DASD): Focus on the processes that are used to create the deliverables.
Deliverable Success Dimensions (DSD): Describing the output of the project, including the success criteria needed to verify that the final result of the project matches the scope.
Operations Success Dimensions (OSD): Includes the success criteria needed to verify that the operation ensures that the ongoing process of the project is carried on in an appropriate way.
Once the study was conducted, the resume of the results of the most important success factors can be seen at
Table 5.
The results have shown that the most important success factors are related to the safety of the workplace, also if the project goal was achieved and how the customer feels about the quality of the different deliverables. These results are quite valuable as an input of the strategic needs that CFAA must necessarily focus on.
The analysis of the organisation strategies and needs were found seeking for CFAA documents with relevant information that may guide the identification of performance indicators, e.g., data from a survey about project success for stakeholders and personnel from the organisation, and a benchmarking with a similar Centre like CFAA. Later, a stakeholder validation was carried out to find out their perception of the performance indicators.
6.1. Ruhrvalley Innovation Cluster
As has been mentioned before, the performance parameters used by centres alike need to be analysed in order to compare and understand the rationalisation of their measurement parameters from a more mature point of view. For this research, “ruhrvalley” was chosen among different innovation centres due to different aspects:
- –
Region: The companies that conform the ruhrvalley innovation cluster are SMEs focused on small but very advanced niches that some of them, regardless of their size, stand as world markets leaders in their domain.
- –
Cluster: ruhrvalley was formed to provide wider solutions in areas like eMobility, renewable energy systems, and digital transformation.
- –
Impacts: The expected impact on solutions for urban mobility and energy systems, and the innovation community in the region, develop a strong innovation profile for universities and development of technology-driven start-ups and SMEs on the region.
- –
Collaboration: An effective interaction model between leading universities and research centres, scientific and industrial associations, and important players from society and politics [
65].
ruhrvalley seeks a combination of applied research, academic education with a strong application focus (high TRL), industry co-operation, and a strong rivet on innovation and entrepreneurship [
66], as does CFAA. Sastoque et al. [
51] mentioned that CFAA and ruhrvalley have had a strategic matching to increase an impact of R&D results in the scientific community. They also have some contextual factors in common, like their location, due to both of them being placed in industrial urban areas under processes of digital transformation through technology- and innovation-driven approaches. Regarding the TRL, ruhrvalley goes one step further than CFAA, with TRL 6–7 for CFAA and TRL 6–8 for ruhrvalley. Also, they both focus on Industry 4.0 technologies.
6.2. KPIs Construction
In order to assemble the KPIs for CFAA, the classification was made based on the study carried by Wolff and Nuseibah [
65] and divided on four different scopes: Innovation, region, research and development, and university. Next, the strategic needs for each one of those scopes were inferred from the information sources previously mentioned
Table 6.
At the end of the analysis of the information gathered, besides these 12 strategic needs, 51 operational needs and 56 internal factors (drivers) were also identified. However, for this paper, the result of the study of the strategic and operational needs for the scope of innovation will be shown.
The CTQ started by identifying the critical Xs for the first strategic need (Y): Creating and marketing new services, product lines, and technological capabilities. Next, the specific measurements required to fulfil the quality requirements were previously identified. A target value for each of the measurements must be set according to the organisation expectations (
Table 7;
Table 8).
7. Conclusions and Future Research
Lean thinking can lead to knowing an organisation in a deeper way, asking questions that were overlooked, and reaching conclusions of highly strategic value for the company. In this research, through an SLR, the literature on the process of KPI definition was analysed through a lean approach in project-based organisations.
Through the concepts gathered in the SLR, a classification of KPIs was identified, and a lean-based model was developed to define the KPIs. This model was applied to a case study conducted within a R&D project-based organisation (CFAA). Following a series of steps based on lean tools and principles, the model worked as a guide for the identification of KPIs. The DMAIC methodology phases were used in order to keep an organised process flow for the model implementation.
The first step was to establish the current status of the company as well as explore the stakeholders needs and requirements with the VoC. To complement the initial information and to determine the strategic needs (VoB), the company quality manual was reviewed. The literature highlights the importance of KPI formulation based on strategic business objectives as well as corporate culture. Although this is the starting point towards the identification of performance indicators, the scope of this research does not include the analysis of corporate strategy and culture. Furthermore, it was considered useful to benchmark with a similar leading organisation (ruhrvalley) in order to get baseline performance indicators. After obtaining the data to define the CTQs, we proceeded to measure and analyse the internal factors, measurements, targets, and performance indicators that constitute the KPIs.
The result was a series of qualitative and quantitative KPIs that evaluates the strategic and operational needs of a project-based organisation and helps to understand and improve their performance criteria. However, those defined KPIs cannot be unmovable. The continuous changes in the market or the research methodologies require KPIs to be constantly redefined and updated, in order to ensure that KPIs are suitable for the current environment of the organisation [
18].
The scope of this research was limited to proposing a model for the identification of KPIs using the lean approach, therefore for future research, it is suggested to continue with the following actions of validating, communicating, reporting, and controlling the adequacy of the KPIs. “Visual management” is a suitable technique to manage the quality of the KPIs [
2]. For managers and project managers, the use of KPIs “dashboards” are recommended during to report, monitor, and control the KPIs [
11].
As a next step, a project plan must be developed to ensure the right applicability of the KPIs at CFAA and a system to measure their effectiveness in the organisation. Additionally, the integration of the information coming from different areas of the organisation (IoTs, edge computing devices, project reports, etc.) to ensure the correct functioning of the KPIs should be assured. It is a process as important as the formulation of the KPIs itself, for the use of dashboards, scorecards, and reports that show information almost in real time is highly recommended.
The result of this research is of high value for project-based organisations, especially those new ones that are not apprised of how to correctly formulate a series of KPIs, or whose path is still not clear.

 ,
, 


