Article

Too Costly to Disregard: The Cost Competitiveness of Environmental Operating Practices

College of Business, Korea Advanced Institute of Science and Technology (KAIST), Seoul 02455, Korea
*
Author to whom correspondence should be addressed.
Sustainability 2020, 12(15), 5971; https://doi.org/10.3390/su12155971
Submission received: 4 June 2020 / Revised: 19 July 2020 / Accepted: 22 July 2020 / Published: 24 July 2020
(This article belongs to the Special Issue Business Analytics and Data Mining for Business Sustainability)

Abstract

:
Achieving the dual goal of improved environmental and financial performance has become a universal business concern. Our study distinguishes between firms’ environmental behaviors and their environmental performance, a distinction that has been largely disregarded in previous empirical studies that analyze the association between environmental performance and financial performance. As an improvement in environmental performance itself does not necessarily guarantee positive financial returns, our study pays particular attention to the value-added nature of preemptive environmental activities, investigating the effects of plant-level pollution prevention activities (PPAs) on environmental performance and financial performance in terms of cost competitiveness and market valuation. Drawing on detailed environmental information about 18,743 chemical plants in the U.S. and analyzing a multi-level panel dataset constructed bottom-up from plant-level data to their parent firms’ performance data, we find that more intensive PPAs are associated with both superior environmental performance and improved cost competitiveness but do not necessarily lead to higher market valuation. Our study illuminates the specific environmental activities and conditions linked to environmental and financial performance, thereby offering managers practical guidance in pursuing both sustainable and profitable businesses under increasingly stringent environmental standards.

1. Introduction

Under increasingly stringent domestic environmental standards, companies attempting to make inroads into the global market are required to have environmentally sustainable operations and thus need to invest in various pollution abatement measures and programs. The main challenge facing such companies is that the continued upscaling of production leads to increases in the cost of pollution abatement activities, which in turn require decision makers to choose prudent environmental measures that minimize opportunity costs or maximize the financial return of their environmental investments [1,2]. The relevant question for these firms is how to prioritize different pollution abatement activities to serve both their economic and environmental objectives, which may seem to compete with each other.
One Korean chemical company, Hanwha Chemical, faced this conflict between economic imperatives and environmental responsibility in the late 1990s. With the continued upscaling of production, its pollution treatment costs increased, which soon became a major concern for top management who had actively supported various investments in pollution abatement since 1991. At this crossroads, Hanwha switched to a new environmental strategy that optimized their existing production processes to increase product yield while reducing energy consumption rather than continuing to invest in post-treatment measures. Launching the Cleaner Production (CP) program in 2001, the company phased in various pollution prevention measures over the next four years, first in its pollution-intensive production lines and later in all its facilities. The CP program focused on improving enterprise-wide productivity by saving on raw material inputs and energy costs. During 2003–2004, Hanwha incurred about USD 0.7 million in costs to implement 28 CP program measures for process improvements, which reportedly generated an economic return of about USD 19.4 million. Specifically, the material input per unit of production declined by about 13.2% between 1999 and 2003, and the rate of waste recycling in existing facilities increased dramatically from 5.2% to 8.8% over the same period [3,4]. Similar stories of the financial benefits of pollution abatement efforts paying off have also been reported by relatively mature enterprises that recognized early the importance of clean production and thus achieved considerable environmental improvements through intensive pollution prevention research and development. For example, DuPont, helped by the U.S. Environmental Protection Agency (EPA), undertook a major modification of its production process in 1991–1992 to prevent or reduce pollutant emissions, which cost about USD 3.8 million. In return, the company reduced pollutant discharges by about 50% while generating cost savings of about USD 15.8 million per year in the form of avoided environmental compliance costs [2,5].
After a long-standing academic debate over whether it pays to be good or green [6,7,8], the recent proliferation of empirical studies examining the association between corporate environmental performance—or, more broadly, corporate social responsibility (CSR)—and financial performance seems to support the positive linkage between the two constructs (e.g., [9,10,11,12,13,14]). Recent meta-analyses of such studies, however, have pointed out that these rich empirical results are still inconsistent and inconclusive [15,16]. Although several studies have addressed potential interventions or moderating factors [6,16,17] and methodological issues [15,17,18] that have made those empirical results incomparable, their results do not adequately explain why and how this apparent linkage operates. By itself, the statistical association between environmental outputs and financial performance also does not provide specific insights that managers can use to identify potential drivers appropriate for their businesses or to understand the underlying mechanisms of a positive relationship between their environmental management, target environmental performance, and expected financial performance. It is thus not surprising that decision makers are often not sure how to prioritize different types of corporate environmental measures in pursuing both sustainable and profitable businesses.
To better understand what environmental investments or actions may influence which processes within the corporate value chain and whether those impacts are material enough to be captured by key financial indicators, our study examines the plant-level pollution prevention activities (PPAs) documented by the U.S. Toxic Release Inventory (TRI) as a potential explanatory variable for environmental performance and financial performance of those plants’ parent firms. Drawing on detailed information about 18,743 chemical plants in the U.S. and their parent firms, we investigate the relationships between environmental practices, environmental performance, and financial performance at both the plant and firm level to make sense of the relationship between PPAs and financial performance in terms of cost competitiveness and stock market valuation.
Our hypotheses and theoretical explanations for the results are based primarily on natural resource-based view theory [19,20]. Taking a resource-based view of firm performance, relevant literature has suggested that companies adopt pollution prevention activities in order to realize significant savings in resource use and waste-processing requirements while reducing production lead time through the simplification or removal of unnecessary steps [19,20]. Several descriptive case studies taking this approach have shed light on the role of environmental management “best practices” in firms’ resource-use efficiency and cost competitiveness [5,21]. Despite there being a number of qualitative or case-based studies of pollution prevention activities [14,22], we find little empirical evidence that explicitly accounts for firms’ environmental behaviors as explanatory variables for their environmental performance and that links these variables to economic or financial performance measures.
To help fill this gap in the current literature, our study is intended to shed light on the specific environmental practices underlying the association between environmental performance and financial performance and the mechanism by which the return on environmental management practices may accrue. In particular, it examines the value-added nature of preemptive environmental activities undertaken to prevent or reduce process-related toxic releases, thereby distinguishing between firms’ environmental behaviors as an explanatory variable and their output-based environmental performance, a distinction that has been largely disregarded in previous empirical studies. Our results demonstrate a positive and direct relationship between preemptive environmental practices and firms’ cost competitiveness: more intensive pollution prevention activities resulted not only in superior environmental performance but also in improved manufacturing cost efficiency. In addition, our results challenge the conventional wisdom that there is a tidy linear relationship between environmental management and environmental performance, and indicate that the financial returns of PPAs may not necessarily be apparent, depending upon the choice of financial performance measures that represent varying degrees of connectedness to the anticipated impacts of the PPAs. Our study highlights that the selection of the appropriate financial measure does matter [17,22,23], which is consistent with the previous argument that “researchers… have not used measures of firm performance that are not closely related to the anticipated effects of these practices on competitiveness, such as cost advantage” (p. 666 of [22]).
The next section provides the theoretical background of the study and discusses firms’ representative pollution prevention activities and their potential business implications. Section 3 develops the hypotheses tested by the study. Section 4 describes the methods of the study, including its data set, variables, and estimation models. Section 5 presents and analyzes the results, and the final section discusses the results and their implications for managers.

2. Theoretical Background

As noted, a number of earlier studies have sought to establish a linkage—either positive or negative—between firms’ social performance and financial performance [6]. The results of these studies, however, have been inconclusive and the subject of long-standing academic debate. Whereas Friedman (1970) considered CSR a management agency problem (i.e., from the perspective of costs only), Freeman (1984) argued that it is a long-term investment strategy to promote improved relationships with stakeholders that helps reduce a firm’s transaction costs [7,8] and thereby increase market opportunities. The general consensus among the surge of recent empirical studies examining the association between corporate environmental performance or CSR and financial performance is that firms’ activities and costs for meeting their environmental or social responsibilities should be viewed as assets rather than liabilities.
Several researchers have explored possible explanations for seeming inconsistencies or disagreements in the current rich body of empirical studies [15,16]. A few ‘contingency’ studies or meta-analyses have investigated particular conditions or moderating factors that may help explain the possible association between environmental and financial performance. Barnett and Salomon [6], for example, suggested that whether it pays to be good depends upon how well firms are able to capitalize on their social responsibility efforts. A meta-analysis by Dixon-Fowler et al. [17] identified potential moderating factors in the relationship between environmental and financial performance, such as environmental performance types, firm characteristics, and methodological issues, and noted that the lack of comparability is aggravated by “a lack of consensus and norms in empirical studies regarding the selection of the appropriate environmental performance, financial performance, and control variables necessary to examine these relationships” (p. 354). The heterogeneity in data sources, data quality, collection methods, and analysis methods of previous studies has also been examined in meta-analyses by Shahgholian [15], who observed that the main trend has been to examine the linear relationship between output-based environmental performances such as GHG emissions and accounting-based variables such as return on assets (ROA) and return on equity (ROE), and by Hang et al. [16], who pointed to the time horizon issue as a potential cause of mixed empirical results.
Although the various intervening factors and lack of methodological norms may help explain the mixed results, the literature remains silent about direct sources of the relationship or causality between environmental actions and financial results. This research stream, therefore, has provided corporate managers with limited guidance as to what specific types of efforts they should put forth to improve environmental performance while maintaining market competitiveness [14,17]. The fundamental questions of why and how particular types of environmental actions relate to the specific financial performance thus remain unsolved.
Table 1 summarizes the type of environmental, CSR, and financial performance measures employed by previous empirical studies selected and their major results.
Several descriptive case studies have shed light on the role of environmental management best practices on firms’ resource-use efficiency and cost competitiveness [5,19,21]. Dorfman [5], reviewing various source-reduction programs conducted by major corporations to eliminate waste at the source level, found that such low-cost, low-technology activities can result in both superior environmental performance and cost savings. In a case study, Porter and Linde [21] argued that the cost of complying with environmental regulations can be minimized through innovations that deliver competitive benefits by encouraging firms to employ a range of inputs more productively, which can more than offset the increase in the environmental compliance costs. Hart [19] suggested that companies can adopt pollution prevention activities to realize significant savings in resource use and waste-processing requirements while reducing production lead time through the simplification or removal of unnecessary steps. Beyond such qualitative or case-based prescriptive studies, we found little empirical evidence that explicitly accounts for firms’ environmental behavior (e.g., pollution prevention activities) as an explanatory variable for their environmental performance and that links these variables to relevant financial performance measures. Among the exceptions, and of particular relevance to our study, is a study by Christmann [22], which surveyed 88 managers in the U.S. chemical industry to examine the effects of environmental best practices on corresponding cost advantages, focusing on the moderating role of the firms’ complementary assets as a proxy of their absorptive capability to employ such practices. The study found that these best-practice pollution prevention programs had a statistically insignificant cost savings effect, although that result might be attributable to the study’s use of subjective performance measures. Klassen and Whybark [14] also examined the relationship between environmental management performance and attendant manufacturing performance by conducting a self-reported survey of 83 plant managers in the U.S. furniture industry, evaluating how well the individual plants were performing relative to their competitors. Although the study employed relatively direct measures of manufacturing performance (e.g., delivery speed and throughput time) and environmental management (e.g., pollution prevention index), those relied on the managers’ perceived performance of their own firms, which is subjective and prone to self-reporting bias.
Unlike these survey-based approaches, our study conducts an extensive quantification of facility-level pollution prevention activities and toxic releases in the U.S. chemical industry and the parent firms’ financial performance. Our study develops a multi-level empirical model offering an integrated account of the relationship between environmental management practices and their associated environmental and financial performances. A study by King and Lenox [34] is perhaps most closely related to ours in its use of the TRI database at the plant level, in their case to empirically identify how and why managers tend to underinvest in waste-prevention methods from an information gap perspective. Complementing these data with another source of toxicity information (the Reportable Quantities list), King and Lenox employed statistically constructed estimators representing the amount of emission reductions achieved by different types of chemical waste management (prevention, treatment, and transfer), uncovering that only the waste prevention variable was associated with financial returns on assets (ROA) and Tobin’s q.
In contrast, we employ the complete list of pollution prevention activities reported in the TRI, which includes whether the individual chemical plants conducted PPAs and, if they did, which type and how many PPAs they undertook. We seek to trace the extent to which PPAs influence both environmental performance and associated financial performance by employing a range of performance measures that we encounter when moving up the value chain: environmental impact (i.e., toxic chemical releases), cost competitiveness (i.e., COGS ratio), and market valuation (i.e., Tobin’s q). In particular, to capture the effects of environmental inputs or activities on a closely connected financial performance measure [22,23], we introduce the cost-of-goods-sold ratio—an indicator of firms’ production cost efficiency or cost competitiveness—as an alternative to the commonly used net-income-based financial indicators (e.g., return on investment) or stock return indicators (e.g., abnormal returns).

3. Hypotheses Development

In this section, we introduce the core variable of our study, Pollution Prevention Activities (PPAs); discuss the characteristics of various types of PPAs and their implications; and develop hypotheses concerning the environmental and financial returns to the corporate environmental practices (PPAs).

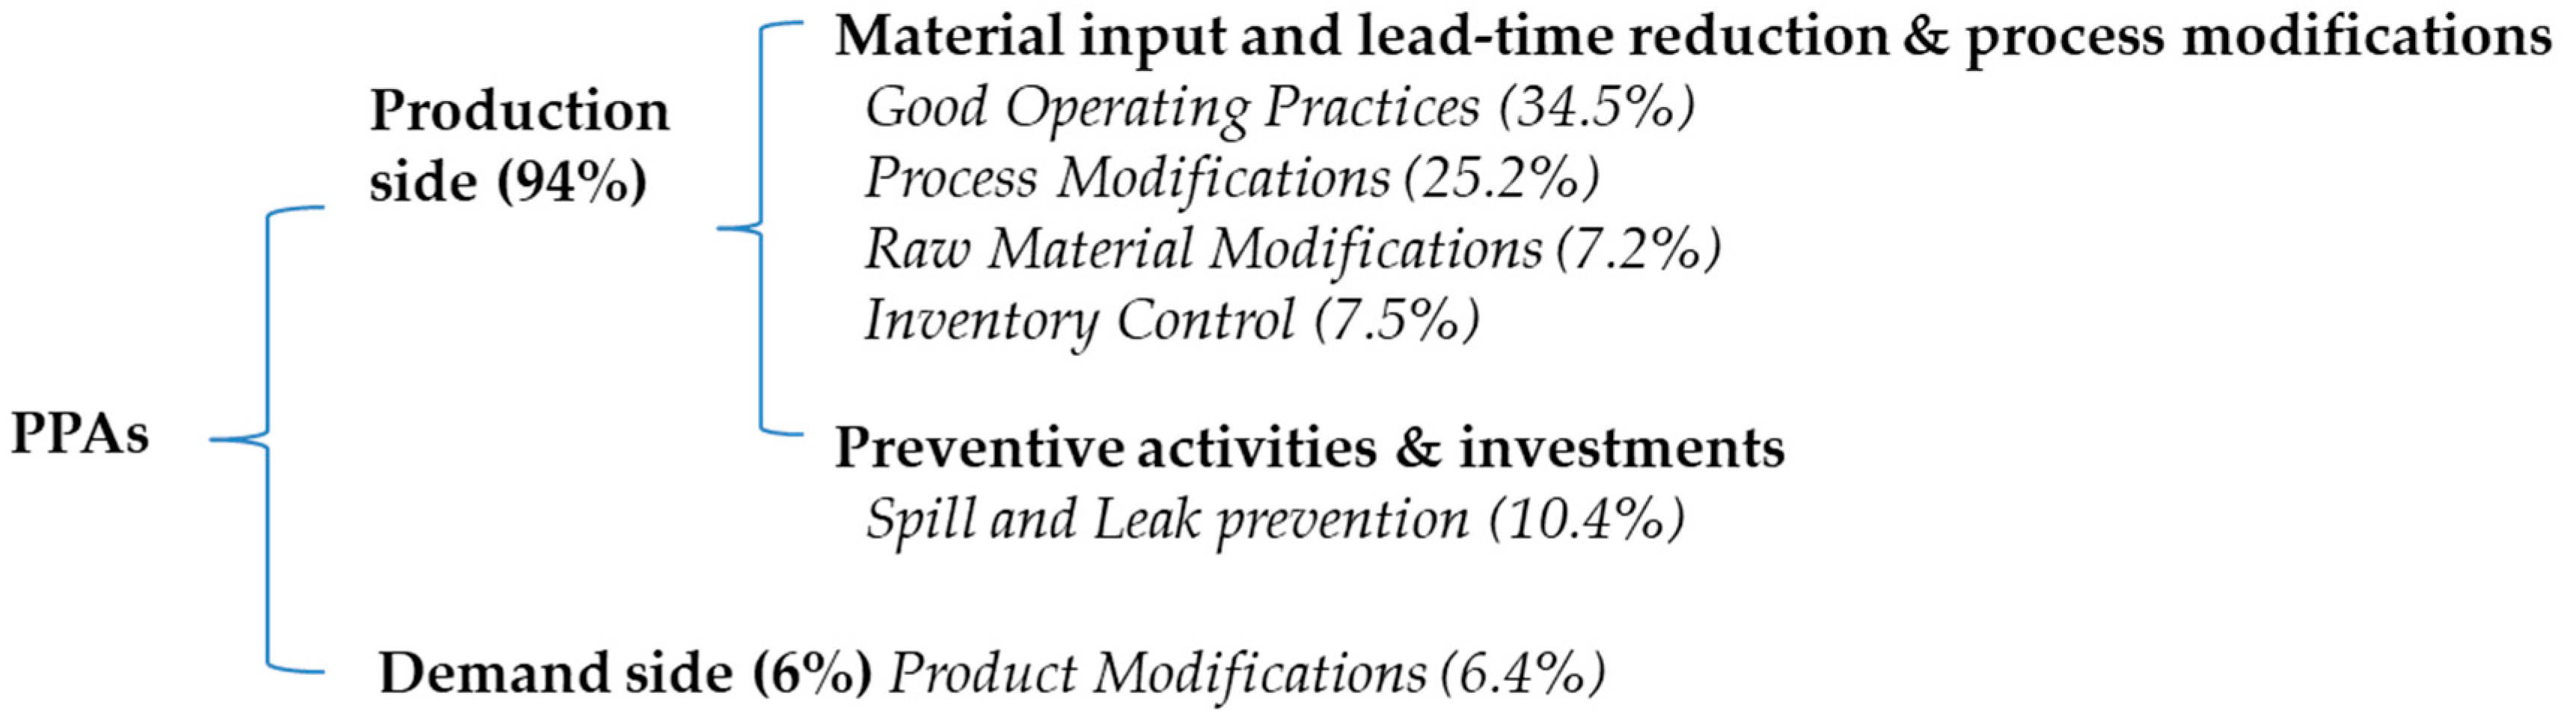
3.1. Toxic Release Inventory (TRI) and Pollution Prevention Activities (PPAs)

The Toxic Release Inventory (TRI) is a publicly accessible database provided by the United States Environmental Protection Agency (EPA), which contains detailed information on the disposal and releases of more than 760 toxic chemicals by more than 21,000 U.S. industrial facilities [35]. Facilities are mandated to report to the TRI if they have at least ten full-time employees and produce or use more than a designated amount of TRI-identified toxic chemicals. With the passage of the Pollution Prevention Act of 1990, the EPA began to require companies to report descriptive information about the various pollution prevention activities (PPAs) they undertook to reduce toxic releases in order to share information about good environmental practices.
Pollution prevention activities (PPAs) refer to corporate practices that reduce or eliminate the generation of pollutants through increased efficiency in the use of raw materials, energy, water, or other resources or the protection of natural resources by conservation [35]. Residual pollution that cannot be prevented or reduced is to be recycled or treated in an environmentally safe manner, but such post-processing activities, often referred to as end-of-pipe treatments, do not fall into the EPA’s PPA categories. In 2018, 1270 out of more than 21,000 industrial facilities (6% of all facilities in TRI) reportedly undertook 3120 pollution prevention activities. In the chemical industry, which is the focus of our analysis, a total of 737 out of 3454 chemical facilities (21.4% of all chemical plants) reported 2803 pollution prevention activities in the same year [36]. Among the eight PPA categories identified by the EPA (Figure 1) and discussed below, the most common are good operating practices, process modifications, and spill and leak prevention. In addition, the most common sources of PPAs are reported to be internal team management, employee engagement, and internal audits, which supposedly would not require substantial investments.
Good operating practices accounted for more than 35% of all pollution prevention activities reported in 2018, comprising such activities as increasing the frequency of planned maintenance, continuously adjusting the batch schedule to minimize changes in product quality, and reducing operator-controlled scrap through hands-on technical training. LINDE LLC, for instance, reported that more frequent planned maintenance of packing and gasket materials resulted in decreased emissions and raw material use. The second most common type of PPA was process modifications, including modifying production processes to reduce the use of toxic materials, such as solvents, using solvents for an additional cycle before disposal, installing a printing press that recovers solvents more efficiently, optimizing chemical reaction conditions, and replacing toxic materials with non-toxic ones. An example of spill and leak prevention, the third major type of PPA, was BASF Corporation’s implementing of a new employee-recommended policy that reduced spills by electronically identifying all hoses used to transfer chemicals and testing them annually.
The PPAs also included raw material modifications, exemplified by a new process adopted by RENCO Group that largely eliminated the use of a high xylene-content material through the use of flame and plasma surface treatments and better formulations of water-based painting technology. An example of another PPA type, inventory control, was Honeywell’s just-in-time inventory system, which reduced the use of lead by 22% via minimizing raw material storage and potential waste streams from expired or out-of-specification products. Surface preparation and finishing refers to such activities as modifying spray systems or equipment, substituting coating materials, and improving application techniques. Cleaning and degreasing refers to such practices as improving rinse equipment design and operation, replacing solvents or other materials with mechanical stripping/cleaning devices, modifying containment procedures for cleaning units, and improving draining procedures. Unlike the abovementioned process-related activities, product modifications is a demand-oriented PPA, such as Superior Brass and Aluminum Casting’s work with customers to replace its previous alloy containing a maximum of 6% lead with a new alloy containing a maximum of 0.09% lead. Product modifications also encompass the restructuring of existing businesses or product portfolios, such as a disinfectant producer who switched from using a 2-phenylphenol–based cleaning product to developing alternative products free of the chemical.
The eight types of PPA can be broadly grouped into production- and demand-side activities, with the production-side activities accounting for approximately 94% of the total reported number of PPAs (Figure 2). Although product modifications as a general category would have a more pronounced impact on firms’ sales and market positions than other activities, product modifications that lead to pollution prevention accounted for a relatively minor fraction (6%) of the reported PPAs. In sum, the chemical firms’ activities to improve their environmental performance mainly concerned improvements in production processes, from incremental efforts to reduce material inputs and lead time to relatively challenging activities such as modifying processes, the latter of which may involve a departure from their conventional production and operating practices. Compared to conventional environmental management activities focusing on posterior waste treatments, these PPAs are likely to have a more direct influence on firms’ cost structures and value chains. They can also have a favorable impact on a business’s bottom line because they typically do not require a large financial investment or radical organizational changes but rather relatively incremental improvements made in the spirit of Total Quality Management (TQM).

3.2. Hypotheses

Three sets of hypotheses were developed to test the relationship between our major constructs in a systematic manner, which is shown in Figure 3. The first of these sets (H1) concerns the direct effects of the PPAs on the firms’ financial performance in light of cost competitiveness and market value, which is the main focus of our study. The second set of hypotheses (H2) posits the relationship between PPAs and environmental performance, in particular whether and to what extent various PPAs undertaken by individual plants contribute to their environmental performance and how the association might vary with the type of business. The third set of hypotheses (H3) addresses the association between the parent firms’ environmental performance and their financial performance.
Prior literature suggests that the use of pollution prevention technologies or practices increases the efficiency of production [37] via better utilization of inputs, savings from recycling or reusing materials, and reduction of waste disposal costs [22], and reduces production lead time by enabling the simplification or removal of unnecessary operational steps and the adoption of higher-quality monitoring equipment [21]. These pollution prevention activities, which in many cases involve relatively modest investments and organizational changes, would have the potential to improve profitability. Porter and Linde [21], for instance, argue that stringent environmental regulations can inspire innovations that help organizations minimize costs and ultimately become more competitive in the market. This counter-intuitive finding that preventive environmental actions or investments can actually provide a competitive advantage can be better understood by adding the dimension of “competing for the future” [19] to a resource-based view of the firm. Hart [19] proposes a natural-resource view of the firm, arguing that, by employing pollution prevention measures as one among the three types of natural environmental strategies, companies can realize significant savings, resulting in a cost advantage.
Considering the complete set of PPAs in our study, however, the ways and degrees to which specific PPA types might affect a firm’s production costs seem less clear. This is particularly true for those PPAs that might present more pronounced trade-offs rather than synergies between environmental and economic performances. Good operating practices, for instance, would clearly endow companies with increased resource management efficiency by lowering requirements for raw material use without incurring much, if any, additional cost. The potential impact of financial returns to process modifications, however, may seem more ambiguous, as the activities would involve additional capital expenditures and other costs associated with employee training and temporary quality compromises, especially when the firm has already optimized its production processes. PPAs categorized as raw material modifications would also require substantial added costs, as hazardous materials are often replaced by more environmentally friendly but expensive ones, although inventing new treatment technologies or discovering better formulations may prove less expensive. Similarly, spill and leak prevention activities, which do little to reduce material inputs, may require supplementary investments to improve monitoring capabilities. Product modifications, which involve restructuring in production processes and businesses, are not likely to result in an immediate improvement in financial performance, either.
Nonetheless, our examination of the U.S. chemical sector indicates that the PPAs conducted by the chemical plants involve mainly activities associated with reductions in material input or production lead time and process modification rather than product modifications or spill and leak prevention (Figure 2). As a result, the PPAs are expected to directly reduce the material costs that account for the largest share of the cost structure of the chemical industry and possibly also reduce other costs of production due to the improvement of process efficiency, contributing to profitability. Given that implementing such process-related PPAs may result in non-trivial improvements in resource use efficiency and process innovations without necessitating large additional investments, the programs are likely to pay off and strengthen firms’ cost competitiveness in spite of the mixed financial implications of the diverse PPAs addressed above.
We therefore hypothesize that the PPAs in the chemical sector will have a positive influence on production costs and consequently on gross profits, with the effect being prominent enough to enhance the cost competitiveness of firms undertaking the PPAs and possibly their market valuation as well. Although the effect of a firm’s PPAs on market valuation is less straightforward than their effect on cost competitiveness, we do not dismiss the reasonable likelihood that more intensively undertaking PPAs may lead to higher profit streams and thus higher financial market valuations for firms through the cost competitiveness channel or through the development of inimitable organizational resources as a source of competitive advantage on a longer-term basis. According to Feldman et al. [38], “investment in environmental management leads to substantial reduction in perceived risk of a firm” which, if all else is equal, would drive up the firm’s stock price. A number of studies have also hinted at ways in which disclosure of environmental information in news reports might affect market valuation. For example, Konar and Cohen [39] found that negative media attention as a “pollution company” via the public disclosure of TRI data had a negative effect on firms’ stock price, and Klassen and McLaughlin [13] conducted an event study analysis to see whether the arrival of news on high toxic emissions or environmental performance awards resulted in significantly negative or positive abnormal returns to the listed firms.
Although few examine the effects of environmental practices on market value, an exception is King and Lenox [34]. Estimating the amount of emission reductions achieved by prevention, treatment, and transfer chemical waste management activates, they found that only waste prevention was associated with market valuation as expressed by Tobin’s q. Our hypotheses thus explicitly consider the mechanisms by which environmental management activities can improve financial performance in terms of cost competitiveness and market valuation, respectively:
Hypothesis 1A.
The more intensive a firm’s pollution prevention activities, the greater its manufacturing cost competitiveness due to the associated improvement of production process and resource-use efficiency.
Hypothesis 1B.
The more intensive a firm’s pollution prevention activities, the greater its financial market valuation due to improved profit prospects.
To further establish the triadic linkage between environmental practices, environmental performance, and financial performance, the study next tests whether chosen PPAs do indeed improve environmental performance and, if so, how the relationship between them might be explained. Surprisingly few studies have empirically tested the relationship between environmental managerial activities and performance. Although one might easily presuppose a strictly positive association between environmental actions and outcomes, this may not be the case, as PPAs, particularly those installed under strict environmental regulations, can be used as a means to increase the level of output, offsetting any environmental improvement achieved by the PPAs. We thus assert that this relationship needs to be empirically tested at the level at which the action takes place and bears fruit; the ties between the two can be reliably identified without introducing other confounding factors only when environmental outcomes are measured as closely as possible to where those environmental actions are mainly undertaken. This perspective is also consistent with a resource-based view of firms, which suggests that “the type of environmental technology implemented would be linked directly to the presence of specific strategic resources, possibly at the plant level”, and that because “the strength, value, and competitive advantage of continuous improvement varies between plants within the same firm, the use of pollution prevention technology is also likely to vary” (see p. 601 of [14]). Our study draws on the plant-level data provided by the TRI to test this relationship.
We also suggest that business-specific circumstances need to be explicitly taken into account in establishing the link between corporate environmental activities and environmental performance. Earlier studies have noticed the role of organizational assets or antecedents that influence organizations’ environmental strategies, including managerial commitment and the type of industry [40,41], learning effects [42], and ownership structure [41]. Unlike previous multiple industry studies conducted at the more aggregate three-digit NAICS level (standard industry code), we instead limit our analysis to a range of chemical industry subsectors at the four-digit NAICS level in our attempt to tease out the potential interaction effect of business type and environmental strategy on environmental performance. Our conjecture is that business types can moderate the impact of chosen PPAs on environmental performance to a degree depending upon the inherent pollution intensity of the business and its cost profiles. In other words, the degree to which individual PPAs chosen by plant managers contribute to their environmental performance would vary across business subsectors within the chemical industry, which comprises widely varying products, cost structures, pollution intensities, and available pollution abatement options. Our plant-level hypotheses are as follows:
Hypothesis 2A.
A plant’s pollution prevention activities will positively affect its environmental performance.
Hypothesis 2B.
The more pollution- and manufacturing cost-intensive the business category to which a plant belongs, the greater the effect the PPAs will have on its environmental performance.
Lastly, our study examines the relationship between environmental performance and financial performance at the firm level in terms of cost competitiveness and market valuation. Although a resource-based view of the firm may provide a theoretical entry point to that relationship by highlighting the connection between firms’ proactive environmental managerial capability and their financial performance [20], we note that higher environmental managerial capability or prudent environmental practices that provide competitive advantages may not necessarily be conditioned on higher environmental performance. Thus, legitimacy theory and stakeholder theory may provide more plausible explanations of the process by which superior environmental performance may lead to improved market performances in terms of stock market valuation. According to legitimacy theory, a systems-oriented view of the organization and society within which firms are influenced by, and in turn have influence upon, the society in which they operate [43], a firm’s survival can be threatened if society perceives that the firm has breached its social contract [44], while stakeholder theory asserts that information can be employed by a firm to gain the support and approval of its stakeholders or to deflect their opposition and disapproval. Together, these theoretical frameworks suggest that firms with superior environmental performance are likely to incur lower direct and indirect costs from environmental regulations or lawsuits and to achieve more favorable contract terms and relationships with their supply-chain partners, eventually leading to higher market valuation. This premise is supported by a few empirical studies that suggest that investors may perceive a firm’s poor environmental performance as a potential cost or liability and respond accordingly [12,13], resulting in a decreased market value.
We test firm-level hypotheses regarding the positive relationship between environmental and financial performance to complete the triadic linkage between environmental practices, environmental performance, and financial performance, while at the same time maintaining logical consistency with the above two sets of hypotheses. Our firm-level hypotheses are given as follows:
Hypothesis 3A.
The higher a firm’s environmental performance, the higher its manufacturing cost competitiveness.
Hypothesis 3B.
The higher a firm’s environmental performance, the higher its market value.

4. Methods

4.1. Data Collection and Sampling

We tested the above hypotheses using data from two authoritative sources: the Toxic Release Inventory (TRI) to determine the chemical manufacturing facilities’ environmental practices and performance, and the COMPUSTAT database to determine the financial performance of the facilities’ parent companies. We limit the scope of the subject to the chemical industry, not only because the industry is a heavy emitter of toxic chemicals but because, given that the financial performance of firms is influenced in large part by the overall profitability of the industry to which they belong, doing so also limited unwanted idiosyncratic effects that might be introduced by examining vastly different industries and their business practices. This choice nonetheless allowed us to maintain a reasonable degree of heterogeneity in firms’ environmental behavior, as the chemical sector also encompasses a range of similar but qualitatively different businesses, ranging from petrochemical firms producing intermediate goods for other industries to pharmaceutical and medical businesses delivering high value-added final consumer products. The chemical industry also offered a particular advantage for the purposes of this study in that the costs of production, material costs in particular, account for a majority of the sector’s cost profiles, meaning that the extent to which our core variable of interest, PPAs, may affect the firms’ profitability might be especially salient. Finally, the chemical industry is highly representative of the TRI data pool because it is the second-largest emitting sector (around 15% of total toxic releases in 2012), following the metal mining sector (40%), which together with the electronic utilities sector (14%) account for about two-thirds of total U.S. toxic releases.
Having chosen the chemical industry as the subject of our study, we first drew on the TRI database to examine the relationship between PPAs and environmental performance across facilities. We retrieved chemical facility data from 2007 to 2013, which totaled 52,067 unbalanced facility-level observations. Because some plants consisted of multiple facilities, we aggregated the data from all facilities constituting each plant, resulting in a total of 18,743 observations for our analysis after eliminating observations with missing values. The second and even more time-consuming step was to match these plants with their publicly held parent companies as registered in the COMPUSTAT database in order to test the effects of the PPAs and environmental performance on the financial performance of those firms, our ultimate concern. Due to the absence of company code compatibility between the TRI and the COMPUSTAT, we had to match plants with their parent companies through multiple criteria, including not just their name but other information such as company type, addresses, and sub-industry and/or businesses they operate. We excluded companies that fell short of any of those conditions or lacked the full financial dataset necessary for calculating their market value, Tobin’s q, in our study. Accordingly, among the 2038 parent chemical companies of the 10,504 plants, we were able to identify 108 that were publicly held companies operating at any time during the 2007–2013 period and whose financial information was thus archived in the COMPUSTAT database. This matching process allowed us to construct a panel of 455 firm data to test the relationship between the firm-level constructs.

4.2. Variables

4.2.1. Financial Performance

Financial performance measures in the literature can be divided into accounting-based and market-based measures [15]. Our study employed both accounting and market-based measures to represent the firms’ profitability and market values, respectively. To capture the impact of firms’ environmental practices on their profit margins, specifically their gross profitability, we chose the cost-of-goods-sold ratio (COGS ratio; COGS divided by sales), which indicates production cost efficiency. The cost of goods sold (COGS) reported in COMPUSTAT is the production costs consisting of the total cost of materials, labor, and utility service, etc. In the chemical industry, the contribution of material costs to its COGS is typically almost 80% of COGS, with the share of COGS exceeding 80% of sales [45]. Therefore, even a small change in the cost structure of a chemical firm could have a substantial effect on its profitability, meaning that improvements in the COGS ratio would be definitely a major consideration in managerial decision making.
Given the need to employ measures “that are closely related to the anticipated effects of these practices on competitiveness, such as cost advantage” (p. 666 of [22]), we chose the cost-of-goods-sold (COGS) ratio instead of conventional net-income based measures (e.g., ROA, ROE), anticipating that PPA would have a greater effect on cost savings than on more distant market gains [13]. Although it would have been appropriate to employ more disaggregated financial information, such as material costs, to capture the effects of “savings achieved through reductions in resource usage, prevention of pollution or waste recycling” (p. 87 of [23]), this detailed information was not publicly available; therefore, we utilized the total production cost efficiency measure, i.e., the COGS ratio.
To quantify the financial performance of the chemical firms, we also chose Tobin’s q, which is widely used as a measure of the stock market’s valuation of a firm’s intangible assets in the spirit of efficient market hypotheses [46]. Following Bharadwaj et al. [47] and Konar [12], we employed the method proposed by Chung and Pruitt [48] to construct Tobin’s q from the COMPUSTAT database. We expected that this forward-looking performance measure would reflect the stock market’s response to a firm’s environmental management activities to the extent that these activities are believed to generate long-term intangible competitive advantages.

4.2.2. Environmental Performance and Pollution Prevention Activities (PPAs)

Our choice for an environmental performance proxy, the amount of toxic release, is widely used in the literature (e.g., [12,13,32]). For our purposes, this choice was a more suitable and objective instrument than the other index-based performance metrics used in previous CSR studies [49,50], as all plants registered in the TRI are required to report their annual amount of individual toxic releases and to undergo a third-party certification process. Specifically, we utilized the toxicity-weighted yearly toxic releases provided by EPA (the TRI data pool) after normalizing them by sales [12,51], which is considered a more appropriate hazard-specific performance measure than simple total toxic releases [34,52,53].
The key latent construct of interest in this study is a firm’s PPAs as a driver of environmental performance and as a potential source of added value in its financial performance. Our analysis employed both the categorical dummy variable (PPA) indicating if plants or firms conducted one or more PPAs and the yearly PPA counts (PPA intensity) as a broad proxy for the intensity of the PPAs for the year of interest. The PPA intensity variable is the log number of the eight types of PPA conducted by facilities operated by the firm. Although this count information is conceptually not the same as the intensity of PPAs, we find the variable correlates very highly with other PPA information, such as PPA diversity (how many of the TRI’s eight types of PPA the firm conducts) and PPA consistency (whether a firm performs PPAs consistently throughout the years analyzed) and thus is representative of the intensity of PPAs.

4.2.3. Control Variables

In our plant-level model, we controlled the scale of the plants by the total amount of production-related waste managed (total waste generation) and the number of toxic chemical materials (no. of toxic chemicals). We also controlled the influence of production fluctuations with year dummy variables and the production index from the TRI database (change in production) and of broad business characteristics by employing business category dummies. In our firm-level model, we employed several key control variables that are believed to affect the profitability of individual firms, such as firm size, capital intensity, and R&D intensity [6,13,54]. Net income and the financial leverage were also added to the firm-level model as proxies for firms’ returns and financial risks, respectively [34,55,56]. Table 2 identifies the constructs, names, and quantification of the variables.

4.3. Model Specifications

Considering skewed distributions of the key variables, we employed semi-log regression models for our analysis. Potential systematic effects of the year and business category were controlled for by using year dummies and sub-industry dummies. The plant-level models associate the facilities’ PPAs with their environmental performance as follows:
l o g T W T R i t = α 0 + α 1 P P A i t + X A + ε i t
l o g T W T R i t = γ 0 + γ 1 P P A i t + γ 2 8 P P A i t × B I Z t y p e i + X Γ + ε i t
where the dependent variable l o g T W T R i t is the log toxicity-weighted chemical releases of factility i at year t; the independent variable P P A i t is the dummy indicating whether the facility performs PPA; P P A i t × B I Z t y p e i is the interaction variable to see moderating effects of PPAs by business sector; X A and X Γ are the vectors of control variables (total waste amount, number of toxic chemicals reported, production changes, business sector dummies, year dummies) for each model; and ε i t is the error term following the normal distribution assumptions.
The firm-level models associate the firms’ environmental performance or PPAs with their financial performance either in COGS ratio or Tobin’s q. Regarding the COGS-based models, we attempted to avoid the possible autocorrelation that the cost measure may present, controlling a within-firm AR(1) process by incorporating the lagged COGS variable. The firm level models are as follows:
C O G S i t = α 0 + α 1 s n T W T R i t + α 2 C O G S i t 1 + X A + ε i t
T o b i n s q i t = β 0 + β 1 s n T W T R i t + X Γ + ε i t
C O G S i t = γ 0 + γ 1 P P A i n t e n s i t y i t + γ 2 s n T W T R i t + γ 3 C O G S i t 1 + X Γ + ε i t
T o b i n s q i t = δ 0 + δ 1 P P A i n t e n s i t y i t + δ 2 s n T W T R i t + X Δ + ε i t
where the dependent variable C O G S i t represents the cost of goods sold per sales, that is, the cost competitiveness of firm i at year t; another dependent variable, T o b i n s q i t , reflects the firm’s market value; the independent variable P P A i n t e n s i t y i t is the log number of PPAs conducted; s n T W T R i t is the sales-normalized toxicity-weighted toxic release of firm i at year t; X A and X Γ are vectors of control variables (firm size, capital intensity, R&D intensity, business sector and year dummies) for the cost models; X Γ and X Δ are vectors of control variables (firm size, capital intensity, R&D intensity, net income, leverage, business sector and year dummies) for the market models; and ε i t is the error term following the normal distribution assumptions.
Descriptive statistics and bivariate correlations for the facility- and the firm-level estimation models are shown in Table 3 and Table 4, respectively.

5. Results

5.1. PPAs and Financial Performance: Firm-Level Analysis

The empirical models explored in our study consistently indicate the positive relationship between firms’ pollution prevention activities and cost competitiveness (Table 5). The PPA intensity is negatively correlated with the sales-normalized production costs (COGS ratio) at a 5% level of significance in CModels 1 and 2 or at a 1% level in CModel 3, supporting Hypothesis 1A that the more intensive a firm’s pollution prevention activities, the greater its manufacturing cost competitiveness will be. Doubling the PPA intensity leads to reductions in the COGS ratio of, on average, 1.5 and 0.9 percentage points, respectively. The reductions translate into reductions in production costs of 134 million USD and 83 million USD for the average firm (with the mean sales of USD 8982 million). The intuition is that as a firm engages in PPAs more intensively, it is more likely to experience an improvement in production processes and resource-use efficiency, which will promote the firm’s cost competitiveness even after controlling the influence of its environmental impact (snTWTR). The results thereby provide empirical support for the existence of a competitive advantage offered by pollution prevention activities as proposed by resource-based views of firms [19,20] and for earlier descriptive and anecdotal studies concerning the potential cost advantages of adopting environmental best practices [5,14,21,22,57].
The empirical results, however, do not support Hypothesis 1B, which proposes that as a firm’s PPAs become more intensive, its market valuation will become more favorable (see CModel 4 in Table 5). The results of alternative estimation models for Tobin’s q are similar to those of OLS fixed estimation (CModel 4) and thus are not displayed in the table. The apparent decoupling between cost competitiveness and market valuation is possibly attributable to several causes. First, due to persistent information asymmetry in the capital market, investors may fail to perceive the firm’s cost competitiveness garnered by the PPAs, which was pointed out by King and Lenox [34] as a reason for common underinvestment in waste-prevention methods. Second, the firm’s cost competitiveness obtained by the PPAs may not be strong enough to boost its market prospects, which in this study are measured by Tobin’s q. Recall that the PPAs, which are defined by the EPA as source reduction managerial activities, mainly consist of production-related innovation activities to reduce or avoid the generation of toxic chemical releases in production processes. As the above analysis indicates, our cost-competitiveness measure of COGS ratio more closely captures the anticipated effects of the ‘process-focused best practices’ [22] than other ‘distant’ performance measures do. In this sense, broader financial indicators or net income-based performance measures, which reflect more comprehensive operating and non-operating business performances (e.g., financing and interest expenses), may not be the best choice to capture the anticipated effects of the PPAs. As such incongruent effects of the PPAs on various financial performance measures seem important and worthy of discussion, this issue is further investigated in Section 5.4.2.
The effect of the control variables overall support our intuition that firm size and R&D intensity have positive associations with cost competitiveness, with some variations across the models probably due to the relatively high correlations between some financial measures (e.g., firm size and net income), even though no multicollinearity issue is identified in the VIF test. In addition, the sector-specific effects on profitability (cost structures) and market valuation are found to be different and prominent. For instance, the soap, cleaning, and toilet preparation sector has a lower COGS ratio (more profitable) and higher Tobin’s q (market premium) on average compared to the base dummy sector (basic chemical). Yet, no statistically significant interaction effects between PPAs and business sectors appear in our financial performance model.

5.2. PPAs and Environmental Performance: Plant-Level Analysis

Our empirical evidence confirms the linkage hypothesized by the plant-level model (Table 6). First, the results support Hypothesis 2A, that a plant’s employment of PPAs will positively affect its environmental performance (TWTR). Although only a few control variables were used due to the paucity of plant-level information, the effects of PPAs are statistically significant and robust over our environmental performance models; the coefficient for the PPA variable estimated from the random effect model (see PModel 3 in Table 6), in which variation across plants is allowed to be random, is consistent with the results of the fixed effect model (PModel 1). In the dynamic panel model incorporating the lagged dependent variable (PModel 4), the PPAs were also found to have a statistically significant negative relationship with TWTR, indicating that, all else being equal, plants undertaking any form of PPA release about 26% less toxic waste on average than those undertaking none. As expected, this impact diminishes to 14% in the dynamic panel model. On average, the differences in toxicity-weighted toxic releases between PPA-performing plants and non-PPA-performing plants translated into TWTR reductions of 8320 million pounds and 4561 million pounds in PModel 1 and Pmodel 4, respectively. Control variables such as total waste generation and change in production are shown to strongly correlate with the environmental performance variable TWTR, all in the expected direction (e.g., the increase in production is associated with the increase of TWTR).
Second, the effect of the PPAs on toxic releases differs by the business sector to which the individual plants belong, suggesting that the environmental returns on corporate environmental management activities, which in our case are PPAs, do not materialize by the same amount for all business subsectors within the same broad industry category (PModel 5, Figure 4). This result is also largely consistent with Hypothesis 2B, which proposes that the more pollution- and manufacturing-cost-intensive the business category to which the facilities belong, the greater the effects of PPAs on environmental performance. This relationship broadly confirms those in previous firm-level studies treating business type as a moderator (for example, see [40]), which indicate sector differences in the environmental impacts of corporate environmental practices. Specifically, Figure 4 illustrates that the interaction effects between PPAs and business sector are prominent for the pesticide and fertilizer and other agricultural chemical sectors, followed by the paint and coating, with environmental returns to PPAs significantly augmented for these sectors. No statistically significant interaction effects are found for the basic chemicals (including petrochemical business) and consumer durables sectors, such as pharmaceutical and medicine and soap, cleaning, and toilet preparation. Put differently, for these PPA-insensitive sectors, the introduction of PPAs might not prove particularly effective in improving environmental performance in comparison to PPA-sensitive sectors. Interestingly, the PPA-insensitive consumer durables sectors exhibit a similar or higher proportion of PPA adoption compared to the average of the entire chemical sector (Table 7), implying that these sectors may be implementing PPAs for reasons other than environmental improvements.

5.3. Environmental Performance and Financial Performance: Firm-Level Analysis

Our analysis of the potential firm-level linkage between environmental and financial performance indicates that a firm’s environmental performance (TWTR) is indeed positively associated with its COGS ratio and negatively associated with its Tobin’s q value (Table 8). These findings support Hypotheses 3A and 3B, which propose that higher environmental performance explains a firm’s cost competitiveness and improved market value. Specifically, the association between a firm’s TWTR and COGS ratio is statistically significant at the level of 1% (CModels 5–7), supporting our previous argument about the cost advantages of achieving high environmental performance, as purported by the stakeholder theory. With regard to market value, the results indicate that a firm’s TWTR is negatively associated with its Tobin’s q, although the coefficient of interest is marginally significant at a level of 10% (CModel 8 in Table 8). This finding is largely consistent with the conclusions of prior studies (for example, see [12]) that investors perceive a firm’s poor environmental performance as a potential cost or liability and respond accordingly, which results in a decreased market value.
In addition, we find that the coefficients of the business sectors for financial performance are significant and their signs are mixed, suggesting a variance in the salience of cost structures and/or market value within the chemical industry at large. For example, the pharmaceutical and medicine business sector shows higher profitability (low COGS ratio) and market valuation (high Tobin’s q) compared to the basic chemical sector (benchmark), mainly due to the high value-added nature of its business portfolio. This relatively high financial performance might explain why the pharmaceutical and medicine sector exhibits a relatively high proportion of PPA adoption despite its not being considered a heavy emitter (Table 7). No significant interaction effects between business sectors and TWTR are found at the firm level.

5.4. Further Analysis

5.4.1. Another Environmental Performance Measure

To test the robustness of our choice of environmental performance measure, TWTR, we conducted the same analysis based on another environmental performance measure, a simple sum of the amounts of chemical releases, in line with previous studies examining market responses to environmental information disclosures [12,13,58]. Given that the media and other institutions typically report on individual firms’ environmental performance based on this relatively simple toxic release information, these data may constitute a perverse incentive; as Bae et al. put it, “behavior responds congruently to what the information measures” (p. 176 of [52]).
The simple alternative measure of environmental performance did not change the main insights drawn so far, although this can be partly explained by the high correlation (0.88) between TWTR and the simple toxic releases measures. Some of the coefficients of key variables were found to be greater or more statistically significant than those based on TWTR. Notably, while the association of TWTR with Tobin’s q is marginally significant at the 10% level, the association of the simple toxic release with Tobin’s q gains statistical significance at the 1% level along with its higher magnitude of coefficient (Table 9). This may suggest a potential disconnect between the way the environmental activities are undertaken and reported and the way the actual benefits of those activities accrue for the public, the latter of which relates to Hypotheses 2A and 2B on the association between PPAs and environmental performance. For example, a firm might focus on reducing a set of toxic chemicals that is relatively easy to abate in absolute amounts, no matter how toxic they actually are, so as to improve the firm’s environmental performance in the form of simple toxic releases. Our ad-hoc comparison of the firms’ rankings in terms of the two environmental performance indicators also supports this alleged disconnect—only four companies in our list of the top 10 polluters on the basis of TWTR remain in the list based on the simple toxic releases.

5.4.2. Other Financial Performance Measures

So far, this analysis has employed two broad types of financial performance: one measure indicating cost competitiveness of firms (COGS ratio) and the other representing market value (Tobin’s q). That the above results reveal that firms’ environmental management practices are positively associated with their cost competitiveness but that the association with market value is not significant at the firm level may suggest the existence of a boundary of influence exerted by the environmental practices. In this section, we thus scrutinize the extent to which firms’ PPAs can influence their financial returns by employing various key financial performance indicators measured along the value chain.
Our analysis indicates that the effects of the key variables on three other commonly used financial performance measures—EBIT (earnings before interest and taxes), net income, and ROA (return on assets)—all remain statistically insignificant (Table 10). One possible explanation is that the value-added nature of environmental management practices—which not only improve firms’ environmental performance but also make their primary operations and productions more efficient—may make it easier to establish an alignment between such practices and improved financial performance with a COGS ratio than with those relatively distant performance measures. As we move up a firm’s business value chain, from the level of production or operation at which PPAs are practiced to the level of other key business activities such as sales, marketing, and financing, the influence of the PPAs is likely to diminish due to many other confounding factors unrelated to the PPAs. This suggests that such distant financial indicators as net income or ROA, which capture the collective influence of all operating and non-operating business activities and market conditions, are not the best choice for measuring the influence of PPAs. The same is true for Tobins’ q, which is also exposed to the ebb and flow of the securities market.

5.4.3. Endogeneity

So far, our study has not made a convincing case for the causal relationship between PPAs and cost competitiveness, although it has provided circumstantial evidence, given that PPAs are found to be positively associated with production costs (COGS) via the efficient use of raw materials and/or improvement in process efficiency. We note that the causality argument may suffer from potential endogeneity arising from omitted variables and/or simultaneity bias. Since we utilize the authoritative TRI database for environmental information and COMPUSTAT for financial performance, we posit that the potential endogeneity from the measurement error is not material in our study. We note that there is a legal obligation for U.S. chemical facilities to file an accurate and complete Form R in which individual chemical wastes and PPAs are reported with detailed evidence documents, such as material purchase invoices, in compliance with the TRI reporting instructions.
The first potential omitted variable bias can persist even though we have employed the OLS fixed-effect model to control year and business sector-specific effects and also the autocorrelation model (dynamic panel) to control other firm-specific unobservables possibly associated with the level of the dependent variable (COGS ratio). In order to uncover the causal relationship, we construct instrument variables for our key explanatory variable, PPA intensity, to conduct the 2SLS analysis. Two instrument variables are employed: the cumulative number of PPAs implemented for each firm between 2007 and 2013 (cumppa) and the PPA intensity variable of the previous year (lagppa). We consider these two instruments valid as they are likely to induce changes in the instrumented variable (PPA intensity) without generating independent effects on the dependent variable. In fact, the proposed instruments strongly correlate with the instrumented variable, yet not with the error term of the model according to the IV relevance test—high F values of 51.03 and 56.44 are indicated for the cumppa and the lagppa variable, respectively. The Durbin–Wu–Hausman test also does not reject the null hypotheses that the instrumented variable is exogenous. The 2SLS analysis shows similar results to those of base models overall, indicating that the coefficients for the instrumented PPA intensity variable are largely similar to those of the OLS fixed but greater than the dynamic panel model (Table 11).
Second, the simultaneity bias may also be present in our earlier models, as corporate decision-making may concern both the deployment of PPAs and financial status—for example, and most prominently, a firm’s managers may decide whether or not to undertake PPAs depending upon its financial performance. We cannot conduct the Granger causality test because our panel data has a small number of years, which is inappropriate for constructing the vector auto regression (VAR) model as the pre-requisite for the causality test.
Although most PPAs considered in our study constitute incremental environmental practices rather than capital-intensive investments, it is still possible that firms lacking in capital or organizational resources may tend to avoid altering their existing operational practices to produce superior environmental performance because of the associated risk of a short-term fall in productivity. To address this concern along with selection bias, we examined the statistical difference in various business indicators between the two subgroups split by whether or not the firms have implemented any PPAs. Overall, no systematic differences in business indicators are observed between the two subgroups (Table 12). An additional binary propensity analysis also indicates no significant influence of those business indicators on the deployment of PPAs, alleviating the possibility of endogeneity in our models that might arise from the selection bias in our data.

5.4.4. Mediation Effect

Having established and tested the triadic linkage between environmental practices, environmental performance, and financial performance (illustrated in Figure 3), we explore whether or not a firm’s environmental performance mediates the relationship between the intensity of its environmental activities and its anticipated financial performance. If the mediation effect holds, a firm’s environmental activities would influence its financial performance mainly through the activities’ effect on the environmental performance. To test for this mediation effect, we performed the standard procedure proposed by Baron and Kenny [59], in which the coefficient for the PPA intensity, which is treated as a predictor of the financial performance outcome, would diminish with the introduction of the candidate mediator variable (i.e., environmental performance). Our test, however, found no statistically significant mediation effect between the predictor and the tested mediator variable and the outcome variable. Instead, the incorporation of the candidate mediator slightly augmented the coefficient of the predictor, PPA intensity, without affecting the statistical significance of the effects of the environmental activities and the environmental performance in their separate models.

6. Discussion and Conclusions

Our analysis shows that preemptive environmental practices such as PPAs had a direct and positive effect on firms’ cost competitiveness as measured by the cost of goods sold: more intensive pollution prevention activities, which generally involve improved efficiency in processes or raw material management, resulted not only in superior environmental performance but also in improved cost competitiveness. This value-added nature of the firms’ environmental practices, however, was not prominent enough to result in higher market valuations. Additional analyses employing such other financial performance indicators as net income or operating profits also resulted in statistical insignificance. These results may imply limits on the extent to which PPAs may influence firm performance or a potential disconnect in the linkage between environmental management activities, environmental performance, and associated financial performance. At the plant level, we found that the impact of PPAs on environmental performance is positive overall, but differs widely by business sectors within the U.S. chemical industry. The effect of PPAs on environmental performance is most prominent for the pesticide and fertilizer sector, whereas the interaction effects are not significant for the consumer goods sector, such as soap and cleaning and pharmaceutical firms.
Our study thus offers managers several practical implications for prioritizing a wide range of environmental or sustainability strategies and assessing those programs’ performance. First, it affirms that environmental practices such as PPAs are environmental “low-hanging fruit” [19]—environmental activities and operations that can help reduce waste generation at low or even negative costs—and thus can be considered viable and cost-effective options for manufacturers, particularly for businesses with high pollution intensity and a high proportion of material costs. Our findings suggest that the PPAs have a substantial impact on both environmental improvements (decreased toxic emissions) and financial returns (increased manufacturing cost savings). Because the process of implementing PPAs extends from identifying opportunities to reducing toxic emissions (such as reducing or replacing toxic raw materials, shortening or simplifying the production lead time or processes, and adopting new technologies) to measuring, rewarding, and reporting target performances, it requires not just financial resources but employees’ behavioral changes in existing practices, manuals, and beliefs. Given that the major ideas and solutions of PPAs tend to be initiated by internal employees in operations [35] and the vast majority of PPAs are production-related activities (see Figure 2), operation managers and their close cooperation with procurement and R&D departments seem to play a critical role in benefiting from PPAs. Further, management should note that stakeholder engagement, in the form of encouraging employees’ initiatives and participation and in voluntarily reporting to community and regulators, and continuous improvement are both inherent to PPAs and strengthen an organization’s capabilities as a proactive, sustainable business entity.
Second, our findings indicate that managers can be assured of positive financial impacts of environmental management under two conditions: (i) when these practices directly serve the improvement of primary operations, such as the production processes analyzed in this study, and (ii) when the chosen financial measurement of the anticipated impact of the PPAs is well suited to capturing such improvements at the firm level [22]. Managers in particular are encouraged to utilize disaggregated financial indicators collected and analyzed from their managerial accounting systems, such as material cost efficiency, utility cost efficiency, changes in sales of new eco-friendly products, and marginal production cost per unit.
Collectively, our results point to the fact that there is no simple formula for environmental management—the improvement of environmental performance itself does not necessarily guarantee a positive financial return, and the financial return on PPAs may not necessarily be apparent, depending upon the financial performance measures chosen. Rather, the study highlights that the particular nature of environmental management activities and the selection of target performance indicators that properly trace the extent to which corporate environmental practices can have a direct influence are the key factors to be considered. Although business-specific solutions vary by a firm’s specific sector and characteristics, including the stage of its environmental management system, we expect the linkages uncovered by this study to be commonly applicable to all companies pursuing the balance between environmental and financial performances. These findings and recommendations can help corporate decision makers better evaluate their existing environmental program portfolios and identify business-specific value-creating practices.
Our study makes two major original contributions to the literature. First, unlike previous empirical studies examining the association between environmental performance and financial performance, it explicitly accounts for firms’ potential source activities as an explanatory variable for their environmental performance and links these variables to relevant financial performance measures. By so doing, it illuminates potential drivers or environmental inputs that explain the inconclusive or mixed results of the relationship between environmental and financial outcomes [15] and the related causality issue [16]. In addition, by uncovering the differentiated impact of PPAs on toxic releases by subsectors within the chemical industry, our findings challenge the conventional notion that there is an unconditionally linear relationship between environmental management and environmental performance.
Second, this study provides empirical support for the existence of competitive advantages offered by pollution prevention activities as proposed by resource-based views of the firm [19,20]. Our study corroborates earlier findings concerning the potential cost advantages of adopting environmental best practices offered by descriptive studies [5,14,21,22,57]. It has substantiated the cost advantages by using a multi-level panel dataset constructed bottom-up from the plant-level environmental data to their parent firms’ performance data, and objective, standardized financial performance measures closely related to source activities [22,23] and thus suitable for analyzing individual firms’ cost competitiveness.
As with all studies, our analyses are not without limitations. First, we identified a positive relationship between PPAs and cost competitiveness in the case of PPAs within the U.S. chemical industry. Although the chemical industry encompasses a range of various businesses, the question of whether these results can apply to other industries with different types of environmental performance and management options and cost structures remains to be scrutinized. Our study thus points to the need for additional research to examine other value-added environmental practices and their impact on associated environmental and financial performance as appropriate to the various contexts of different industries. Nonetheless, the “source-connectedness” of the positive relationship between environmental management and financial performance established by the study appears broadly applicable and suggests that researchers should take care to employ source-relevant and objective environmental and financial performance measures in designing their studies. Second, although organizational capabilities such as environmental management systems or innovative cultures are not the focus of our study, they are one of the key factors affecting the relationship between corporate environmental practices and financial performance. Thus, future research examining the potential moderating role of intangible elements relevant to this relationship will enrich knowledge in the field. Finally, this study did not examine even more proactive types of environmental management activities, such as demand-oriented activities (e.g., product restructuring) or “product stewardship” more broadly [19], which remain understudied [60]. We hope this study will spur additional empirical research into how different types of environmental management activities may influence environmental and financial performance, investigating synergies and tradeoffs, and why certain firms choose particular types of activities but not others.

Author Contributions

Conceptualization, S.Y.; data curation, S.Y.; formal analysis, S.Y. and J.E.; funding acquisition, J.E.; investigation, S.Y., J.E., and I.H.; methodology, S.Y., J.E., and I.H.; resources, J.E. and I.H.; supervision, I.H.; validation, J.E. and I.H.; visualization, S.Y.; writing—original draft, S.Y.; writing—review & editing, J.E. All authors have read and agreed to the published version of the manuscript.

Funding

Eom’s research was supported by the National Research Foundation of Korea Grant funded by the Korean Government (NRF—2018S1A3A2075175).

Conflicts of Interest

The authors declare no conflict of interest.

References

  1. Lee, G. A New Option for the Sustainable Future: Cleaner Production Technology. Available online: https://unep.or.kr/sub/sub05_01.php?mNum=5&sNum=1&boardid=planet&mode=view&idx=415 (accessed on 24 July 2020).
  2. Hong, S. The Environment Management Era: Reduce Costs through Cleaner Production. Available online: https://www.donga.com/news/article/all/20031007/7989035/1 (accessed on 24 July 2020).
  3. HanwhaChemical Sustainability Report 2005; Hanwha Chemical Corporation: Seoul, Korea, 2005; pp. 1–29.
  4. HanwhaChemical Sustainability Report 2003; Hanwha Chemical Corporation: Seoul, Korea, 2003; pp. 1–32.
  5. Dorfman, M. Source Reduction: Environmental dividends from cutting chemical waste. Pollut. Prev. Rev. Autumn 1992, 1992, 403–414. [Google Scholar]
  6. Barnett, M.L.; Salomon, R.M. Does it pay to be really good? Addressing the shape of the relationship between social and financial performance. Strateg. Manag. J. 2012, 33, 1304–1320. [Google Scholar] [CrossRef]
  7. Freeman, R. Strategic Management: A Stakeholder Perspective; Pitman: Boston, MA, USA, 1984. [Google Scholar]
  8. Jones, T.M. Instrumental stakeholder theory: A synthesis of ethics and economics. Acad. Manag. Rev. 1995, 20, 404–437. [Google Scholar] [CrossRef]
  9. Matsumura, E.M.; Prakash, R.; Vera-Munoz, S.C. Firm-value effects of carbon emissions and carbon disclosures. Account. Rev. 2014, 89, 695–724. [Google Scholar] [CrossRef]
  10. Chapple, L.; Clarkson, P.M.; Gold, D.L. The cost of carbon: Capital market effects of the proposed emission trading scheme (ETS). Abacus 2013, 49, 1–33. [Google Scholar] [CrossRef]
  11. Johnston, D.M.; Sefcik, S.E.; Soderstrom, N.S. The value relevance of greenhouse gas emissions allowances: An exploratory study in the related United States SO2 market. Eur. Account. Rev. 2008, 17, 747–764. [Google Scholar] [CrossRef]
  12. Konar, S.; Cohen, M.A. Does the market value environmental performance? Rev. Econ. Stat. 2001, 83, 281–289. [Google Scholar] [CrossRef]
  13. Klassen, R.D.; McLaughlin, C.P. The impact of environmental management on firm performance. Manag. Sci. 1996, 42, 1199–1214. [Google Scholar] [CrossRef]
  14. Klassen, R.D.; Whybark, D.C. The impact of environmental technologies on manufacturing performance. Acad. Manag. J. 1999, 42, 599–615. [Google Scholar]
  15. Shahgholian, A. Unpacking the relationship between environmental profile and financial profile; literature review toward methodological best practice. J. Clean. Prod. 2019, 233, 181–196. [Google Scholar] [CrossRef]
  16. Hang, M.; Geyer-Klingeberg, J.; Rathgeber, A.W. It is merely a matter of time: A meta-analysis of the causality between environmental performance and financial performance. Bus. Strategy Environ. 2019, 28, 257–273. [Google Scholar] [CrossRef]
  17. Dixon-Fowler, H.R.; Slater, D.J.; Johnson, J.L.; Ellstrand, A.E.; Romi, A.M. Beyond “does it pay to be green?” A meta-analysis of moderators of the CEP–CFP relationship. J. Bus. Ethics 2013, 112, 353–366. [Google Scholar] [CrossRef] [Green Version]
  18. Dragomir, V.D. How do we measure corporate environmental performance? A critical review. J. Clean. Prod. 2018, 196, 1124–1157. [Google Scholar] [CrossRef]
  19. Hart, S.L. A natural-resource-based view of the firm. Acad. Manag. Rev. 1995, 20, 986–1014. [Google Scholar] [CrossRef] [Green Version]
  20. Russo, M.V.; Fouts, P.A. A resource-based perspective on corporate environmental performance and profitability. Acad. Manag. J. 1997, 40, 534–559. [Google Scholar]
  21. Porter, M.E.; Van der Linde, C. Green and competitive-ending the stalemate. Harv. Bus. Rev. 1995, 73, 120–134. [Google Scholar]
  22. Christmann, P. Effects of “best practices” of environmental management on cost advantage: The role of complementary assets. Acad. Manag. J. 2000, 43, 663–680. [Google Scholar]
  23. Jasch, C. Environmental performance evaluation and indicators. J. Clean. Prod. 2000, 8, 79–88. [Google Scholar] [CrossRef]
  24. Bragdon, J.H.; Marlin, J. Is pollution profitable. Risk Manag. 1972, 19, 9–18. [Google Scholar]
  25. Fogler, H.R.; Nutt, F. A note on social responsibility and stock valuation. Acad. Manag. J. 1975, 18, 155–160. [Google Scholar]
  26. Blackburn, V.L.; Doran, M.; Shrader, C.B. Investigating the dimensions of social responsibility and the consequences for corporate financial performance. J. Manag. Issues 1994, 6, 195–212. [Google Scholar]
  27. Barth, M.E.; McNichols, M.F. Estimation and market valuation of environmental liabilities relating to superfund sites. J. Acc. Res. 1994, 32, 177–209. [Google Scholar] [CrossRef]
  28. Hughes, K. The value relevance of nonfinancial measures of air pollution in the electric utility industry. Acc. Rev. 2000, 75, 209–228. [Google Scholar] [CrossRef]
  29. Clarkson, P.M.; Li, Y.; Richardson, G.D. The market valuation of environmental capital expenditures by pulp and paper companies. Acc. Rev. 2004, 79, 329–353. [Google Scholar] [CrossRef]
  30. Jacobs, B.W.; Singhal, V.R.; Subramanian, R. An empirical investigation of environmental performance and the market value of the firm. J. Oper. Manag. 2010, 28, 430–441. [Google Scholar] [CrossRef]
  31. Fisher-Vanden, K.; Thorburn, K.S. Voluntary corporate environmental initiatives and shareholder wealth. J. Environ. Econ. Manag. 2011, 62, 430–445. [Google Scholar] [CrossRef] [Green Version]
  32. Connors, E.; Johnston, H.H.; Gao, L.S. The informational value of Toxics Release Inventory performance. Sustain. Acc. Manag. Policy J. 2013, 4, 32–55. [Google Scholar] [CrossRef]
  33. Jacobs, B.W. Shareholder value effects of voluntary emissions reduction. Prod. Oper. Manag. 2014, 23, 1859–1874. [Google Scholar] [CrossRef]
  34. King, A.; Lenox, M. Exploring the locus of profitable pollution reduction. Manag. Sci. 2002, 48, 289–299. [Google Scholar] [CrossRef] [Green Version]
  35. EPA. Exploring the Toxic Release Inventory’s Pollution Prevention Information; EPA: Washington, DC, USA, 2013.
  36. EPA. TRI National Analysis 2018; EPA: Washington, DC, USA, 2020; pp. 1–191.
  37. Schmidheiny, S.; Timberlake, L. Changing Course: A Global Business Perspective on Development and the Environment; MIT Press: Cambridge, MA, USA, 1992; Volume 1. [Google Scholar]
  38. Feldman, S.J.; Soyka, P.A.; Ameer, P. Does Improving a Firm’s Environmental Management System and Environmental Performance Result in a Higher Stock Price? ICF Kaiser: Washington, DC, USA, 1996. [Google Scholar]
  39. Konar, S.; Cohen, M.A. Information as regulation: The effect of community right to know laws on toxic emissions. J. Environ. Econ. Manag. 1997, 32, 109–124. [Google Scholar] [CrossRef] [Green Version]
  40. Banerjee, S.B.; Iyer, E.S.; Kashyap, R.K. Corporate environmentalism: Antecedents and influence of industry type. J. Mark. 2003, 67, 106–122. [Google Scholar] [CrossRef]
  41. Darnall, N.; Edwards, D., Jr. Predicting the cost of environmental management system adoption: The role of capabilities, resources and ownership structure. Strateg. Manag. J. 2006, 27, 301–320. [Google Scholar] [CrossRef]
  42. Zhu, Q.; Sarkis, J. Relationships between operational practices and performance among early adopters of green supply chain management practices in Chinese manufacturing enterprises. J. Oper. Manag. 2004, 22, 265–289. [Google Scholar] [CrossRef]
  43. Gray, R.; Kouhy, R.; Lavers, S. Corporate social and environmental reporting: A review of the literature and a longitudinal study of UK disclosure. Acc. Audit. Acc. J. 1995, 8, 47–77. [Google Scholar] [CrossRef]
  44. Deegan, C. The legitimising effect of social and environmental disclosures—A theoretical foundation. Acc. Audit. Acc. J. 2002, 15, 282–311. [Google Scholar] [CrossRef]
  45. The Bank of Korea. Financial Statement Analysis for 2012; The Bank of Korea: Seoul, Korea, 2012; pp. 149–183. [Google Scholar]
  46. Malkiel, B.G.; Fama, E.F. Efficient capital markets: A review of theory and empirical work. J. Financ. 1970, 25, 383–417. [Google Scholar] [CrossRef]
  47. Bharadwaj, A.S.; Bharadwaj, S.G.; Konsynski, B.R. Information technology effects on firm performance as measured by Tobin’s q. Manag. Sci. 1999, 45, 1008–1024. [Google Scholar] [CrossRef]
  48. Chung, K.H.; Pruitt, S.W. A simple approximation of Tobin’s q. Financ. Manag. 1994, 23, 70–74. [Google Scholar] [CrossRef]
  49. Orlitzky, M.; Schmidt, F.L.; Rynes, S.L. Corporate social and financial performance: A meta-analysis. Organ. Stud. 2003, 24, 403–441. [Google Scholar] [CrossRef]
  50. McWilliams, A.; Siegel, D. Corporate social responsibility and financial performance: Correlation or misspecification? Strateg. Manag. J. 2000, 21, 603–609. [Google Scholar] [CrossRef]
  51. Clarkson, P.M.; Overell, M.B.; Chapple, L. Environmental reporting and its relation to corporate environmental performance. Abacus 2011, 47, 27–60. [Google Scholar] [CrossRef]
  52. Bae, H.; Wilcoxen, P.; Popp, D. Information disclosure policy: Do state data processing efforts help more than the information disclosure itself? J. Policy Anal. Manag. 2010, 29, 163–182. [Google Scholar] [CrossRef]
  53. Toffel, M.W.; Marshall, J.D. Improving environmental performance assessment: A comparative analysis of weighting methods used to evaluate chemical release inventories. J. Ind. Ecol. 2004, 8, 143–172. [Google Scholar] [CrossRef] [Green Version]
  54. Brynjolfsson, E.; Malone, T.W.; Gurbaxani, V.; Kambil, A. Does information technology lead to smaller firms? Manag. Sci. 1994, 40, 1628–1644. [Google Scholar] [CrossRef] [Green Version]
  55. Morck, R.; Yeung, B. Why investors value multinationality. J. Bus. Ethics 1991, 64, 165–187. [Google Scholar] [CrossRef]
  56. Dowell, G.; Hart, S.; Yeung, B. Do corporate global environmental standards create or destroy market value? Manag. Sci. 2000, 46, 1059–1074. [Google Scholar] [CrossRef] [Green Version]
  57. Massey, R.I. Program assessment at the 20 years mark: Experiences of Massachusetts companies and communities with the Toxics Use Reduction Act (TURA) program. J. Clean. Prod. 2011, 19, 505–516. [Google Scholar] [CrossRef]
  58. Hamilton, J.T. Pollution as news: Media and stock market reactions to the toxics release inventory data. J. Environ. Econ. Manag. 1995, 28, 98–113. [Google Scholar] [CrossRef]
  59. Baron, R.M.; Kenny, D.A. The moderator-mediator variable distinction in social psychological research: Conceptual, strategic, and statistical considerations. J. Personal. Soc. Psychol. 1986, 51, 1173–1182. [Google Scholar] [CrossRef]
  60. Hart, S.L.; Dowell, G. Invited editorial: A natural-resource-based view of the firm: Fifteen years after. J. Manag. 2011, 37, 1464–1479. [Google Scholar] [CrossRef]
Figure 1. Types of pollution prevention activities [36].
Sustainability 12 05971 g001
Figure 2. Classifications of PPAs as of 2018.
Sustainability 12 05971 g002
Figure 3. Theoretical model and hypotheses.
Sustainability 12 05971 g003
Figure 4. The sector-specific interaction effects of PPAs on environmental performance. Notes: The numbers in the figure are TWTR levels compared to plants that do not perform PPAs for each business sector with other variables being controlled. The base level of business sector is Basic Chemical Manufacturing (NAICS 3251). The level of confidence interval is 95%.
Sustainability 12 05971 g004
Table 1. Summary of Empirical Studies on Environmental and Financial Performance.
StudyMeasure of Environmental PerformanceMeasure of Financial PerformanceEmpirical Association
Bragdon and Marlin [24]Evaluation indexEPS growth, ROE, ROCPositive
Fogler and Nutt [25]Evaluation indexPrice earnings (P/E) ratioNeutral
Blackburn et al. [26]Evaluation indexROA, abnormal return, EPSPositive
Barth and McNichols [27]Remediation cost of superfund sitesMarket value of equityPositive
Klassen and McLaughlin [13]Toxic releases/reward disclosureStock abnormal return (CAR)Positive a
Hughes [28]SO2 (sulfur dioxide) emissionMarket value of equityPositive
Konar and Cohen [12]Toxic releases and disclosureAbnormal returnPositive
Clarkson et al. [29]Environmental capital expendituresMarket value of equityConditionally negative
Johnston et al. [11]SO2 emission allowancesMarket value of equityPositive
Jacobs et al. [30]Announcements of diverse environmental information disclosureAbnormal returnMixed
Fisher-Vanden and Thornburn [31]Voluntary corporate environmental initiatives (investments)Abnormal returnNegative, mixed
Connors et al. [32]Toxic releases and disclosureAbnormal returnConditionally positive
Chapple et al. [10]Carbon emissions intensity disclosureAbnormal returnPositive
Matsumura et al. [9]Carbon emissions and disclosureMarket value of equityPositive
Jacobs [33]GHG emissions reductionsAbnormal returnPositive and diminishing
a Positive sign indicates that higher environmental performances (e.g., lower toxic releases or carbon emissions) are associated with better financial performances (e.g., higher abnormal returns or ROE).
Table 2. Model Variables.
ClassificationVariableDefinition
Cost competitivenessCOGSCost of goods sold divided by sales (COGS and sales of firms are retrieved from COMPUSTAT).
Market valueTobin’s q(logarithm of) The firm’s capital market value at the end of the year divided by the replacement value of its assets. *
Environmental practices (pollution prevention activities)PPA
PPA intensity
Dummy variable distinguishing whether the facilities perform the PPAs.
(logarithm of) Number of PPAs conducted by firms (aggregated number of PPAs conducted at facility level).
Environmental performanceTWTR
snTWTR
(logarithm of) Yearly total toxicity-weighted toxic release by facilities, in lbs **.
(logarithm of) Total toxicity-weighted releases divided by firms’ sales, in lbs per million USD.
Control variablesTotal waste generation No. of toxic chemicals
Change in production
(logarithm of) Total amount of toxic wastes (toxic releases to be managed before treatment), in lbs.
Number of toxic chemicals that the facilities report.
Categorical variable indicating change in yearly production that the facilities report.
Firm size(logarithm of) Total assets, in millions USD.
R&D intensityR&D expenses divided by sales (ratio).
Capital intensityCapital expenditure divided by sales (ratio).
Net income
Leverage
(logarithm of) Net income, in millions USD.
Long-term debt divided by total assets (ratio).
* Tobin’s q = (MVE + PS + DEBT) ÷ TA; MVE = (closing price of share at the end of the financial year); × (number of common shares outstanding); PS = liquidating value of the firms’ outstanding preferred stock; DEBT = (current liabilities Current assets) + (book value of inventories) + (long-term debt); TA = book value of total assets. ** Toxicity Weighted Toxic Release is “Total On and Off-Site Releases (Toxicity × Pounds)” provided by the U.S. Environmental Protection Agency (EPA).
Table 3. Descriptive Statistics and Correlations of Plant-Level Variables.
VariableMeanStd. Dev.N1234
TWTR14.604.9919,2921.000
PPA0.160.3721,240−0.058 *1.000
Total waste generation10.273.6920,0440.478 *−0.041 *1.000
Change in production2.320.9220,2220.168 *0.025 *0.186 *1.000
No. of toxic chemicals4.775.9121,2400.592 *−0.051*0.609 *0.261 *
Spearman’s coefficients, * p < 0.05.
Table 4. Descriptive Statistics and Correlations of Firm-Level Variables.
VariableMeanStd. Dev.N12345678
Cost competitiveness (COGS)0.590.205501.000
Market value (Tobin’s q) a0.510.37474−0.597 *1.000
snTWTR b12.874.635420.548 *−0.473 *1.000
PPA intensity1.601.313140.151 *−0.236 *0.415 *1.000
Firm size8.401.69557−0.445 *0.12−0.163 *−0.0211.000
R&D intensity−3.721.08468−0.623 *0.347 *−0.342 *−0.172 *0.354 *1.000
Capital intensity−3.130.60552−0.181 *0.155 *0.099−0.214 *0.182 *0.0241.000
Net income5.671.87474−0.546 *0.348 *−0.232 *−0.0670.908 *0.397 *0.230 *1.000
Leverage0.230.125560.138 *−0.1030.251 *0.0540.173 *−0.207 *0.0780.121
Spearman’s coefficients, * p < 0.05; a log transformed; b log transformed toxicity-weighted toxic release normalized by sales.
Table 5. Firm-Level PPA Analysis of Financial Performance.
Corporate-Level ModelsCModel 1CModel 2CModel 3CModel 4
EstimationOLS FixedGLS RobustDynamic PanelOLS Fixed
VariablesCOGSCOGSCOGSTobin’s q
PPA intensity−0.0150 **−0.0150 **−0.00931 ***−0.00416
(0.00630)(0.00641)(0.00330)(0.0164)
snTWTR0.00471 **0.00471 *0.00330 ***−0.0139 **
(0.00200)(0.00251)(0.00106)(0.00544)
Firm Size−0.0285 ***−0.0285 ***−0.00201−0.234 ***
(0.00457)(0.00644)(0.00249)(0.0263)
R&D intensity−0.0327 ***−0.0327 **−0.0241 ***0.00164
(0.0104)(0.0131)(0.00543)(0.0274)
Capital intensity0.01450.0145−0.0216 ***0.0833 **
(0.0117)(0.0251)(0.00594)(0.0344)
COGSt−1 0.681 ***
(0.0304)
Net income 0.223 ***
(0.0239)
Leverage 0.253
(0.166)
Business Sector
Resin, synthetic rubber, fibers0.105 ***0.105 ***0.01860.0266
(NAICS 3252)(0.0240)(0.0217)(0.0127)(0.0654)
Pesticide, fertilizer, others−0.104 ***−0.104 ***−0.01870.261 ***
(3253)(0.0335)(0.0256)(0.0166)(0.0812)
Pharmaceutical and medicine−0.244 ***−0.244 ***−0.0603 ***0.283 ***
(3254)(0.0317)(0.0289)(0.0183)(0.0812)
Paint and coating−0.0105−0.0105−0.002740.126 *
(3255)(0.0262)(0.0206)(0.0133)(0.0700)
Soap, cleaning, andtoilet prep.−0.116 ***−0.116 ***−0.0309 **0.267 ***
(3256)(0.0273)(0.0311)(0.0141)(0.0683)
Others0.002690.002690.01200.0386
(3259)(0.0267)(0.0223)(0.0135)(0.0692)
Not categorized0.113 **0.113 ***0.0404 *
(0.0471)(0.0249)(0.0239)
Constant0.839 ***0.839 ***0.03731.482 ***
(0.0793)(0.196)(0.0489)(0.235)
Business sector fixedYESYESYESYES
Year fixedYESYESYESYES
Observations279279235218
R-squared0.7380.7380.9430.582
Notes: Standard errors in parentheses, *** p < 0.01, ** p < 0.05, * p < 0.1. The base level of business sector is NAICS 3251 (Basic Chemical Manufacturing including Petrochemical, Industrial gas, and other basic chemical manufacturing). The year dummy variables are controlled but not displayed in the table. “Not categorized” refers to the firms in diverse business sectors within the chemical industry (325).
Table 6. Plant-Level Analysis of Environmental Performance.
Plant-Level ModelsPModel 1PModel 2PModel 3PModel 4PModel 5
EstimationOLS FixedGLS RobustRandom EffectsDynamic PanelPPA# Business Interaction
VariablesTWTRTWTRTWTRTWTRTWTR
PPA−0.259 ***−0.259 ***−0.225 ***−0.142 ***−0.188
(0.0793)(0.0816)(0.0533)(0.0457)(0.145)
Total waste generation0.373 ***0.373 ***0.530 ***0.0754 ***0.372 ***
(0.00967)(0.0123)(0.0109)(0.00580)(0.00969)
No. of toxic chemicals0.267 ***0.267 ***0.204 ***0.0581 ***0.267 ***
(0.00579)(0.0134)(0.00596)(0.00353)(0.00579)
Change in Production0.251 ***0.251 ***0.112 ***0.197 ***0.249 ***
(0.0333)(0.0349)(0.0164)(0.0195)(0.0333)
TWTRt−1 0.831 ***
(0.00413)
Business Sector
Resin, synthetic rubber, fibers−0.411 ***−0.411 ***−0.215−0.131 **−0.370 ***
(0.0931)(0.0913)(0.156)(0.0533)(0.100)
Pesticide, fertilizer, others0.2120.212 *0.492 *0.05520.398 ***
(0.132)(0.125)(0.264)(0.0752)(0.144)
Pharmaceutical and medicine−3.588 ***−3.588 ***−2.633 ***−0.668 ***−3.663 ***
(0.134)(0.133)(0.258)(0.0785)(0.147)
Paint and coating−2.075 ***−2.075 ***−1.306 ***−0.280 ***−1.996 ***
(0.0888)(0.0850)(0.163)(0.0521)(0.0976)
Soap, cleaning, andtoilet prep.−1.543 ***−1.543 ***−0.925 ***−0.144 *−1.556 ***
(0.130)(0.113)(0.227)(0.0750)(0.144)
Others−1.117 ***−1.117 ***−0.515 ***−0.160 ***−1.212 ***
(0.0894)(0.0965)(0.130)(0.0518) (0.0977)
PPA interacted with:
Resin, synthetic rubber, fibers −0.287
(0.267)
Pesticide, fertilizer, others −1.128 ***
(0.356)
Pharmaceutical and medicine 0.412
(0.358)
Paint and coating −0.426 *
(0.229)
Soap, cleaning, and toilet preparation 0.0321
(0.332)
Others 0.474 **
(0.232)
Constant9.796 ***9.796 ***8.328 ***1.102 ***9.801 ***
(0.147)(0.152)(0.152)(0.0933)(0.147)
Business sector fixed effectsYESYESYESYESYES
Year fixed effectsYESYESYESYESYES
Observations18,54518,54518,54514,71918,545
R-squared0.3630.363N/A0.8310.364
Notes: Standard errors in parentheses, *** p < 0.01, ** p < 0.05, * p < 0.1. The year dummy variables are controlled but not displayed in the table. The results of PPA# business sector interaction are based on the OLS fixed model. The base level of business sector is Basic Chemical Manufacturing including Petrochemical, Industrial gas, and other basic chemical manufacturing (NAICS 3251).
Table 7. Breakdown of Plants that Performed at least One PPA during the Study Period.
Business SectorsTotal Number of PlantsNumber of PPA Performing PlantsShare of PPA Performing Plants (%)
Basic chemicals708695313.5
Resin, synthetic rubber, and artificial synthetic fibers282038813.6
Pesticide, fertilizer and other agricultural chemicals133319514.3
Pharmaceutical and medicine118521518.2
Paint and coating347767219.3
Soap, cleaning, and toilet preparation148925317.0
Others385065617.1
Total21,240333215.7
Note: Number of facilities reporting PPA once or more during 2007–2013.
Table 8. Firm-Level Environmental Performance Analysis of Financial Performance.
Corporate ModelsCModel 5CModel 6CModel 7CModel 8
EstimationOLS FixedDynamic PanelGLS RobustOLS Fixed
VariablesCOGSCOGSCOGSTobin’s q
TWTR0.00345 **0.00181 ***0.00345 ***−0.00717 *
(0.00144)(0.000604)(0.00130)(0.00393)
Firm size−0.0394 ***−0.00182−0.0394 ***−0.294 ***
(0.00427)(0.00184)(0.00753)(0.0252)
R&D intensity−0.0214 **−0.0219 ***−0.02140.0308
(0.00893)(0.00395)(0.0188)(0.0268)
Capital intensity0.0334 ***−0.0145 ***0.0334 **0.0591 *
(0.0114)(0.00456)(0.0167)(0.0322)
COGSt−1 0.777 ***
(0.0224)
Net income 0.254 ***
(0.0227)
Leverage 0.124
(0.145)
Business Sectors
Resin and synthetic rubber0.109 ***0.002450.109 ***−0.0637
(0.0257)(0.0103)(0.0186)(0.0675)
Pesticide and fertilizer−0.121 ***−0.0113−0.121 ***0.196 **
(0.0310)(0.0123)(0.0316)(0.0804)
Pharmaceutical and medicine−0.219 ***−0.0291 **−0.219 ***0.220 ***
(0.0268)(0.0118)(0.0268)(0.0725)
Paint and coating−0.0337−0.0109−0.0337 *0.0343
(0.0252)(0.00987)(0.0178)(0.0659)
Soap and cleaning and toilet preparation−0.108 ***−0.0290 ***−0.108 ***0.298 ***
(0.0259)(0.0104)(0.0274)(0.0674)
Others−0.0168−0.00171−0.0168−0.116 *
(0.0267)(0.0105)(0.0190)(0.0658)
Not categorized0.115 **0.01750.115 ***
(0.0559)(0.0215)(0.0230)
Constant1.003 ***0.01161.003 ***1.828 ***
(0.0703)(0.0348)(0.155)(0.220)
Business sector fixedYESYESYESYES
Year fixedYESYESYESYES
Observations455367455334
R-squared0.6140.9460.6140.518
Notes: Standard errors in parentheses, *** p < 0.01, ** p < 0.05, * p < 0.1. The year dummy variables are controlled, but not displayed in the table. “Not categorized” refers to firms with diverse business sectors within the chemical industry (325). The results of GLS estimation using robust standard error for Tobin’s q are very similar to those of OLS fixed estimation (CModel 8) and thus are not displayed in the table.
Table 9. Effect of Alternative Environmental Performance Measures on Market Value (Tobin’s q).
Hypotheses RelevantH2BH2BH3BH3B
Explanatory VariablesToxicity-Weighted TRSimple Toxic ReleaseToxicity-Weighted TR/PPA IntensitySimple TR/PPA Intensity
Environmental performance−0.00717 *−0.0276 ***−0.0139 **−0.0196 ***
(0.00393)(0.00638)(0.00544)(0.00749)
PPA intensity −0.00416−0.00762
(0.0164)(0.0160)
Size−0.294 ***−0.300 ***−0.234 ***−0.247 ***
(0.0252)(0.0246)(0.0263)(0.0265)
R&D intensity0.03080.02740.001640.00850
(0.0268)(0.0261)(0.0274)(0.0270)
Capital intensity0.0591 *0.0638 **0.0833 **0.0721 **
(0.0322)(0.0312)(0.0344)(0.0338)
Net income0.254 ***0.250 ***0.223 ***0.227 ***
(0.0227)(0.0222)(0.0239)(0.0239)
Leverage0.1240.09590.2530.204
(0.145)(0.142)(0.166)(0.164)
Constant1.828 ***1.921 ***1.482 ***1.476 ***
(0.220)(0.213)(0.235)(0.234)
Business Sector FixedYESYESYESYES
Year FixedYESYESYESYES
Observations334334218218
R-squared0.5180.5400.5820.582
Notes: Standard errors in parentheses, *** p < 0.01, ** p < 0.05, * p < 0.1. The business sector and year dummy variables are controlled but not displayed in the table.
Table 10. Effect on Alternative Financial Measures.
Financial Measures (DVs)IndicationCalculationsCoefficient of PPA IntensityCoefficient of Environmental Performance
EBIT ratioOperating profitEarnings before interest and taxes/salesInsignificantInsignificant
Net income (ratio)The final(net) profit(log) Net income/salesInsignificantInsignificant
ROAAsset efficiencyNet income/average assetsInsignificantInsignificant
Notes: All results of significance are based on the level of 10% (p < 0.1).
Table 11. Summary Results of Estimation for 2SLS Models.
VARIABLESOLS FixedDynamic Panel2SLS2SLS
COGS RatioCOGS RatioIV (cumppa)IV (lagppa)
PPA intensity−0.0150 **−0.00931 ***−0.0139 ***−0.0144 ***
(0.00630)(0.00330)(0.00394)(0.00410)
TWTR(EP)0.00471 **0.00330 ***0.00365 ***0.00382 ***
(0.00200)(0.00106)(0.00104)(0.00112)
Firm size−0.0285 ***−0.00201−0.00188−0.00333
(0.00457)(0.00249)(0.00240)(0.00259)
R&D intensity−0.0327 ***−0.0241 ***−0.0242 ***−0.0244 ***
(0.0104)(0.00543)(0.00523)(0.00540)
Capital intensity0.0145−0.0216 ***−0.0228 ***−0.0229 ***
(0.0117)(0.00594)(0.00575)(0.00615)
COGS t−1 0.681 ***0.676 ***0.641 ***
(0.0304)(0.0294)(0.0313)
Constant0.839 ***0.03730.03860.0693
(0.0793)(0.0489)(0.0468)(0.0499)
Observations279235235210
R-squared0.7380.9430.9430.941
Standard errors in parentheses, *** p < 0.01, ** p < 0.05, * p < 0.1. The business sectors and the year dummy variables are controlled but not displayed in the table.
Table 12. Summary Statistics of the Treatment and Differences.
No PPA (0)Yes PPA (1)(0)–(1)
COGS ratio0.6020.5990.002
(0.055)(0.028)(0.056)
(ln)Tobin’s q0.8350.6220.212
(0.117)(0.044)(0.103) **
Firm size (in sssets)7.7078.494−0.787
(0.337)(0.277)(0.446)
(ln)R&D intensity−3.162−3.6940.531
(0.308)(0.174)(0.332)
(ln)Capital intensity−3.250−3.050−0.199
(0.213)(0.098)(0.206)
Operating income (ratio)0.1300.147−0.017
(0.039)(0.010)(0.326)
(In)Net income5.1145.884−0.771
(0.481)(0.302)(0.544)
Leverage0.3500.2560.094
(0.047)(0.187)(0.043) **
ROE0.4890.2020.286
(0.185)(0.024)(0.143) *
Standard errors in parentheses, *** p < 0.01, ** p < 0.05, * p < 0.1.

