Article

Evaluating Sustainable Intensification of Groundnut Production in Northern Ghana Using the Sustainable Intensification Assessment Framework Approach

1
International Institute of Tropical Agriculture, P.O. Box TL 06, Tamale 03720, Ghana
2
Universal Developers Consultancy, P.O. Box ER 670, Tamale 03720, Ghana
3
International Center for Tropical Agriculture (CIAT), Nairobi 823-00621, Kenya
4
International Institute of Tropical Agriculture, P.M.B 5320, Ibadan 200001, Nigeria
*
Author to whom correspondence should be addressed.
Sustainability 2020, 12(15), 5970; https://doi.org/10.3390/su12155970
Submission received: 17 June 2020 / Revised: 3 July 2020 / Accepted: 5 July 2020 / Published: 24 July 2020

Abstract

:
The sustainable intensification of crop production system requires the efficient use of resources. A 3-year on-farm experiment was conducted to determine the sustainability of plant density for groundnut production in Northern Ghana using the sustainable intensification assessment framework (SIAF). The SIAF allows the assessment of the sustainable intensification potential of the agricultural system in five domains: productivity, economics, environment, human, and social. The experiment was laid out in a strip plot design with six groundnut varieties (early maturity type: Chinese, Yenyewoso, and Samnut 23, and late maturity type: Azivivi, Mani pinta, and Samnut 22) as the horizontal plot factor and four plant densities (22, 15, 11, and 9 plant/m2) as the vertical plot factor. Using the SIAF as a guide, data on grain and fodder yield (productivity), net income and benefit cost ratio (economic), vegetative cover at 30, 40, and 50 days after planting and harvesting and biological nitrogen fixation (environment), calorie and protein production (human), and technology rating by gender (social) were recorded to calculate the sustainability indices of the treatments. The results showed that the sustainability indices for the Yenyewoso and Mani pinta groundnut varieties were above 1 in all the regions, indicating that both groundnut maturity types are sustainable for cultivation in the Northern regions of Ghana. Planting both groundnut maturity types at a density of 22 plant/m2 increased the sustainability index threefold compared with the farmer practice (9 plant/m2) and 79% compared with the 11 and 15 plant/m2. This suggests that planting groundnut at a density of 22 plant/m2 will sustainably intensify groundnut production in Northern Ghana and similar agro-ecologies across West Africa.

1. Introduction

The population of sub-Saharan Africa will double from 1.3 to 2.5 million people by the year 2050 [1]. However, the increase in population growth in sub-Saharan Africa does not match with the increase in food production [2]. World Bank [3] reported that the increase in food production in sub-Saharan Africa is from the expansion of agricultural land areas, which is not sustainable. Vanlauwe et al. [2] reported that the sustainable intensification of the small holder farming system is a must in sub-Saharan Africa due to the increasing population growth. The scope of sustainable intensification is highly contested and evolving as multidisciplinary approaches are coming to the foreground [4,5]. The initial definition of sustainable intensification focuses generally on generating more agronomic production or income without degrading the natural resource base [6,7]. The recent definition of sustainable intensification includes social and human aspects to the initial definition [8,9]. Musumba et al. [9] developed a sustainable intensification assessment framework (SIAF) for assessing the sustainability potential of the agricultural production system. The SIAF measures the sustainability of a production system using indicators from five domains: namely, productivity, economic, environment, human, and social domains. Snapp et al. [5] used the SIAF to evaluate the sustainability of the maize–legume cropping system in Malawi, where they found that the integration of legume into the maize cropping system was more sustainable than the sole maize cropping system in terms of productivity, economic, environment, human, and social domains at plot level. Apart from the above study, there is limited information in literature on the application of the SIAF. Therefore, it is very important to fill this gap by providing practical evidence to scientists on how to use the SIAF to evaluate the sustainability of an intensification practice across multiple domains at plot level.
Groundnut (Arachis hypogea) is one of the most important edible oil and protein leguminous crops of tropical and semi-arid tropical countries [10]. In Ghana, it is a cash crop with about 90% of smallholder farming households involved in its production and about 85% of its total production from the Northern part of the country [11,12]. The grains are a good source of protein (25%–34%), cooking oil (48%–50%), and vitamins [10], and the fodder are of nutritional quality for livestock feed [13]. However, achievable yields on farmers’ fields are less than 50% of the potential due to low soil fertility, weed infestation, and poor agronomic practice, such as low plant density [12]. The typical plant density on farmers’ fields is less than 10 plant/m2 in Northern Ghana [14]. Farmers either plant groundnut in rows or haphazardly at wider spacing on flat lands, especially in the Northern and Upper West regions or on mounds in the Upper East region [11]. Previous studies on the effect of plant density on groundnut production focused on productivity, environment, and economic aspects with limited attention to the human and social aspects [14,15,16]. Similarly, to the knowledge of the authors, there is no study in the literature that has evaluated the sustainability of plant density on groundnut production across the five domains of sustainable intensification. The adoption of optimum plant density that improves yield, income, and nutrition while conserving the natural resource base can sustainably intensify groundnut production. This paper reports the results of a study to identify the optimum plant density for groundnut production in Northern Ghana and evaluate its sustainability at plot level using the SIAF [9].

2. Materials and Methods
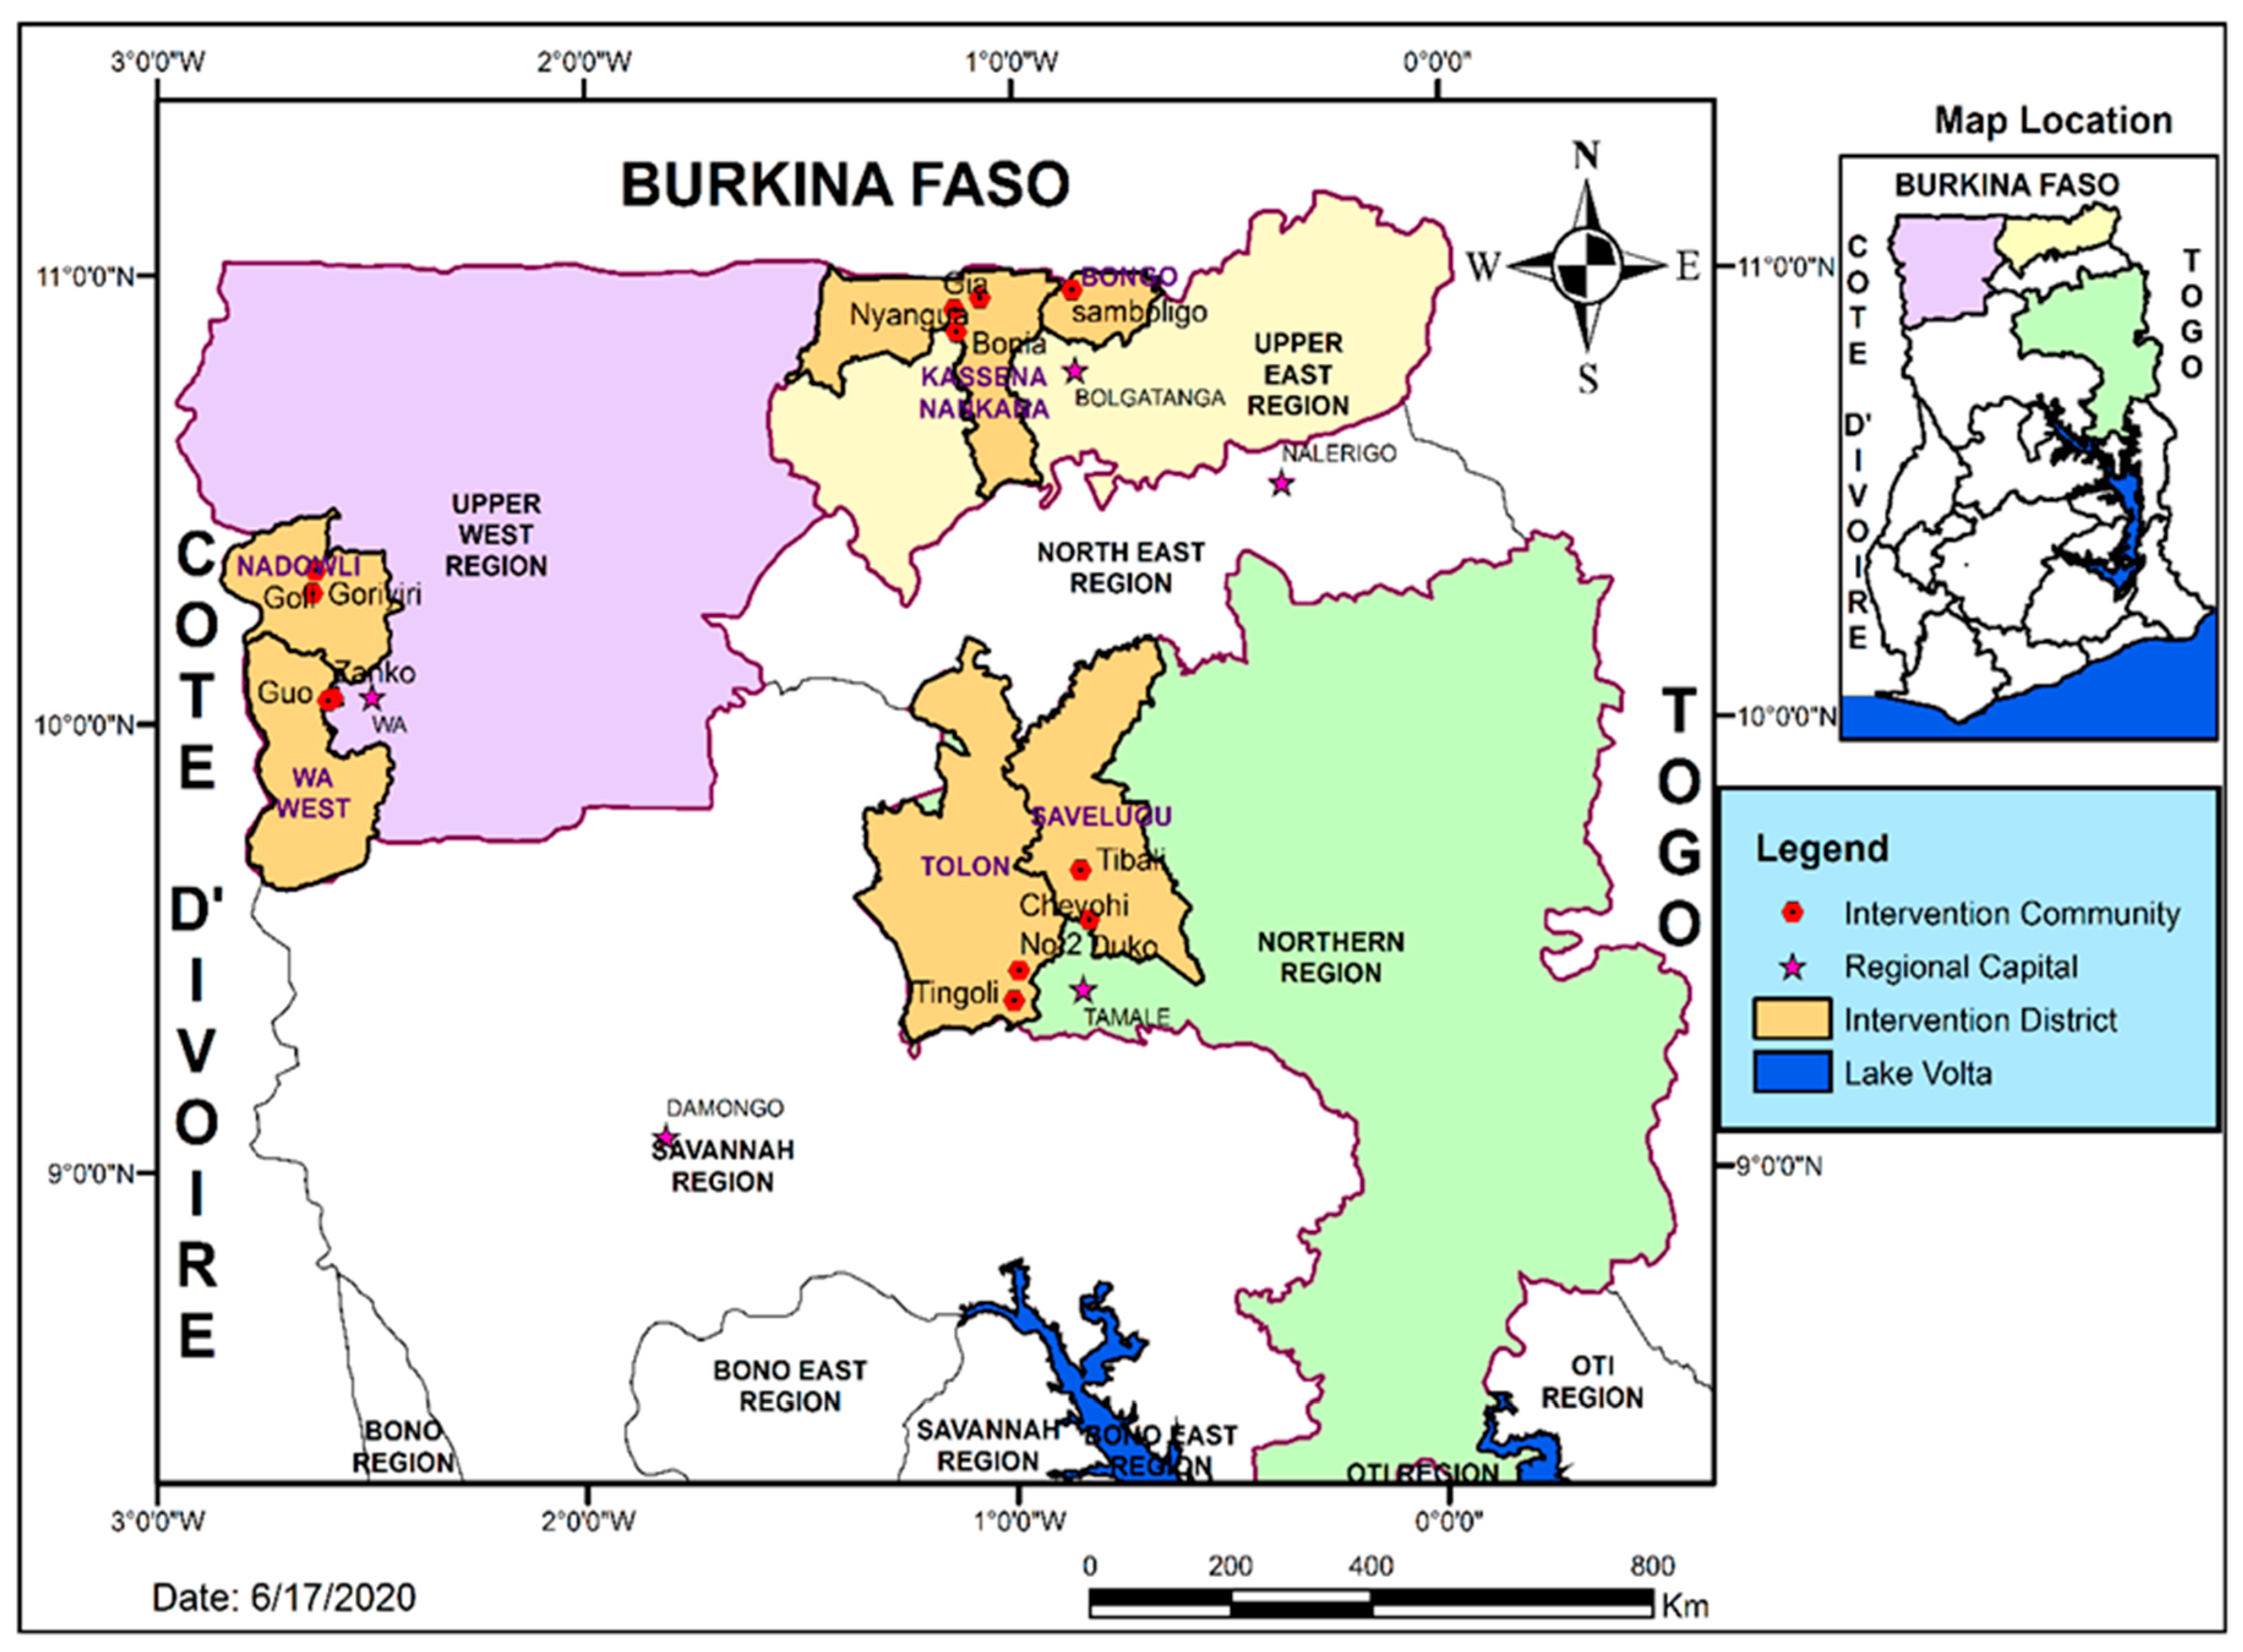
2.1. Study Area

On-farm experiments were conducted in the Northern (Cheyohi No. 2, Tingoli, Duko, and Tibali communities), Upper East (Samboligo, Nyangua, Gia, and Bonia communities), and Upper West (Zanko, Guo, Goli, and Goriyiri communities) regions of Northern Ghana during the 2016, 2017, and 2018 cropping seasons (Figure 1). These regions have a mono-modal rainfall pattern with a 10-year (2007–2016) average annual rainfall of 1122, 927, and 817 mm, respectively [12]. The mean monthly temperatures for the three regions are high throughout the year, with mean monthly figures of 25–38 °C for minimum and maximum temperatures, respectively. The top soil (0–20 cm) properties of the experimental sites varied in texture (loam–sandy loam), pH (5.6–6.3), total nitrogen (0.5–0.9 g/kg), and organic matter (9.5–16.7 g/kg) for the Northern region; texture (loamy sand–sandy loam), pH (5.3–6.4), total nitrogen (0.3–0.4 g/kg), and organic matter (7.1–12.9 g/kg) for the Upper East region; texture (sandy loam–loamy sand), pH (6.2–6.7), total nitrogen (0.8–1.5 g/kg), and organic matter (5.5–16.9 g/kg) for the Upper West region [17].

2.2. Experimental Design and Agronomic Management

A strip-plot design with four communities per region as replicates was used. The horizontal treatment plots were six improved groundnut varieties (early maturity types: Chinese, Yenyawoso, and Samnut 23, and late maturity types: Azivivi, Mani pinta, and Samnut 22). The vertical treatment plots were four plant densities (22, 15, 11, and 9 plant/m2). The horizontal treatment plot size was 70.2 m2, while the size of the vertical treatment plot varied depending on the plant density in order to achieve an equal number of eight rows of plants per plot. The size of the plot for the vertical treatments was 9.6, 14.4, 19.2, and 24 m2 for the plant densities of 22, 15, 11, and 9 plant/m2, respectively. The improved groundnut varieties and plant densities were adopted and modified based on the recommended plant density for groundnut production in Northern Ghana [14]. We used the 9 plant/m2 to represent the farmer practice, since typical plant density on farmers’ fields is less than 10 plant/m2 [14]. These communities were selected based on intervention sites for the Africa Research In Sustainable Intensification for the Next Generation (Africa RISING) project in the three Northern regions of Ghana. At the regional level, each community was used as a block, where a replicate of the experiment was established as a technology park for farmers to participate, observe, and learn about the technology. Thus, the experiment was replicated four times in each region. The experiment was managed by researchers with farmers participating at every level of field activity to the end of the experiment.
The experimental fields were ploughed with a tractor in the Northern and Upper West regions and with bullocks in the Upper East region in line with the common land preparation practice in the areas. The groundnut seeds were planted one seed per hill at the spacing of 30 × 15, 45 × 15, 60 × 15, and 75 × 15 cm2 for the plant densities 22, 15, 11, and 9 plant/m2, respectively. Weeding was done manually 3 weeks after planting for all the plots and before the initiation of pegs in the 15, 11, and 9 plant/m2 plots in line with good agronomic practices.

2.3. Assessment of Sustainable Intensification

We adopted the SIAF developed by Musumba et al. [9] to assess the sustainability of increasing plant density for groundnut production in Northern Ghana. It provided a systematic guide for the selecting and measuring of indicators under the five domains (productivity, economic, environment, human, and social), which were useful in answering research questions and the sustainability of the agricultural intensification practices. Generally, the application of the SIAF is summarized into three main processes which involves: (1) the selection and measurement of indicators under the five domains, which are key to answering research questions; (2) the transformation of these measured indicators into unitless scores to bring indicators with different units onto one scale; and (3) the aggregation of indicators under each of the five domains.

2.4. Selection and Measurement of Indicator by Domains

2.4.1. Productivity

We measured grain and fodder yields in this domain. Groundnut pods from plants in the two middle rows of each plot were harvested at physiological maturity in order to reduce edge row effect. The pods were oven-dried at 65 °C to a moisture content of 12% and cracked to remove the grains. The grains were then measured as grain yield. Similarly, the plants from the two middle rows were cut at ground level and oven dried at 65 °C to a constant weight before measuring fodder yield.

2.4.2. Economic

In this domain, we calculated net income and benefit cost ratio (BCR) to determine the profitability of the treatments, since the economic profitability of a technology is a key factor in motivating farmers to adopt new technologies. We used the groundnut grain price data collected by ESOKO (ESOKO is a social enterprise that collects data on agricultural commodity prices in Ghana (http://www.esoko.com)) from Tamale Metropolitan main market (about 20 km from study communities in the Northern region), Navrongo main market (about 10 km from study communities in the Upper East region), and Wa Municipality main market (about 30 km from study communities in the Upper West region) to compute the farm-gate gross monetary value of the output at harvest (October–December). Farm-gate prices are more appropriate to compute profitability at a farm level, while market prices cause upward bias as they include transport costs and market transaction costs [18]. Therefore, we adjusted the prices collected from ESOKO by 30% to compute the farm-gate prices [19]. The total cost of inputs for production constituted the costs of labor, seed, fertilizer, insecticide, and ploughing. The costs of labor for planting, weeding, fertilizer application, harvesting, and processing were based on key informant interviews. The key informants were leaders of the community-based farmer organization. The groundnut seed price data were collected from Seed Production Association Ghana (SEEDPAG) within the respective study areas. The price data of fertilizer was collected from agrochemical input shops in the main markets of the respective study areas. All cost and benefits were measured in Ghana cedi (GHC).

2.4.3. Environment

We measured groundnut canopy cover to determine the ground area covered by the groundnut canopy. This indicator had the potential of smothering weeds and reducing surface runoff to protect the soil [20]. A quadrat of 0.5 × 0.5 m was placed three times randomly in the two middle rows of each plot to estimate the percentage of vegetative cover for each plot at 30, 40, 50, and 60 days after planting (DAP) and at harvest [21]. We also measured the biological nitrogen fixation for the treatments using the nitrogen difference method [22]. This data was collected during the 2018 cropping season.

2.4.4. Human

In this domain, we calculated the total calorie and protein production of each treatment as a measure of food security and nutrition indicators. The quantity of grain yield produced by a treatment contributed to the total calorie and protein production. We used secondary data on the calorie and protein content of all groundnut varieties from the United States Department of Agriculture, Agriculture Research Services National Nutrient Database for Standard Reference to estimate the total calorie and protein production of each treatment (https://ndb.nal.usda.gov/ndb/foods/show/16087).

2.4.5. Social

Community field days were organized at the experimental fields at the physiological maturity of the crops for farmers to share experiences among themselves, get feedback from farmers, and allow participating farmers to select their preferred improved groundnut variety and plant density. The evaluation of the treatments was done in two groups, separating the male from the female farmers. This was done to allow the female farmers to feel comfortable among themselves in expressing their opinion about the technologies. A total of 312 female and 388 male farmers participated in the evaluation of the treatments. The farmers evaluated the treatments based on the following criteria: days to physiological maturity, cultural practice, such as weeding frequency and man hours for weeding, number of plants standing at harvest, and number of pods per plant. The preference of farmers for the treatments were estimated in percentages. Data were collected during the 2018 cropping season.

2.5. Transformation, Aggregation of Indicators, and Sustainability Indexing

We determined the minimum and maximum limits for each measured indicator and used it to convert the indicator values into unitless scores using Equation (1) [23]:
S i = V a V l V h V l
where Si is the ith indicator, Va is the actual value of the indicator in the dataset, Vl is the lowest possible value of the indicator, and Vh is the highest possible value of the indicator. The scored values were in the range of 0 to 1, with 0 as the least and 1 as the highest indicator strength. The transformed values of indicators (scores) were aggregated under each of the five domains using the arithmetic mean approach [23]. The scores for each of the five sustainable intensification domains were used to calculate the sustainability indices for the treatments. Considering the five sustainable intensification domains as a pentagon with three triangles (Figure 2), we found the area of each of the three triangles and calculated the sustainability index as the sum of the areas for the three triangles [9,24,25]:
T 1 = 3 4   ( SP + SH + HP )
T 2 = 3 4   ( HP + HEv + EvP )
T 3 = 3 4   ( PEv + PE + EEv )
Sustainability   index = T i
where i is 1, 2, and 3. In order to have a sustainable system, the sustainability index should always be positive and greater than one; the higher the value, the more sustainable the system [24,25].

2.6. Statistical Analysis

The General Linear Model of the Statistical Analysis System for windows [26] was used to analyze productivity, economic, environment, and human domains data. The cropping seasons were considered as replicates in the statistical analysis, with the aim of identifying treatments whose average over the three years would be stable and high [27]. Least significant difference (LSD) was used to separate treatment means of significant differences at the probability level of 0.05 (p < 0.05).

3. Results

The groundnut variety by plant density interaction had no significant effect on all the indicators in the three Northern regions (Table 1, Table 2 and Table 3). However, the measured indicators showed significant response to the groundnut variety and plant density across the three regions. Hence, the results were presented on the variety and plant density effect on indicators across the three regions. Similarly, the sustainability of the treatments was also evaluated on the variety and plant density basis across the three regions.

3.1. Productivity

The grain and fodder yields varied significantly among the groundnut varieties across the three regions (Table 1, Table 2 and Table 3). Generally, the grain and fodder yield from the Upper West and Northern regions were higher than those from the Upper East region. The Mani pinta variety recorded higher (p < 0.05) grain and fodder yields among the varieties across the three regions. Similarly, planting late maturing groundnut varieties yielded higher (p < 0.05) grain and fodder yields compared with the early maturing groundnut varieties. Planting groundnut at a density of 22 plant/m2 increased (p < 0.01) grain and fodder yields compared with the other plant densities across the three regions (Table 1, Table 2 and Table 3).

3.2. Economic

The Upper East region had the least net income and BCR among the three regions (Table 1, Table 2 and Table 3). The Mani pinta variety had a higher (p < 0.05) net income and BCR across the three regions. The late maturing varieties had a higher (p < 0.05) net income than the early maturing varieties in the three regions. With regards to the plant density, planting groundnuts at a density of 22 plant/m2 increased (p < 0.01) net income and BCR more than the other densities in all the regions (Table 1, Table 2 and Table 3).

3.3. Environment

The groundnut variety had a significant effect on canopy cover at 30, 40, 50, and 60 DAP in the Upper East region, while in the Upper West region, the groundnut variety affected canopy cover at 40 and 50 DAP (Table 2 and Table 3). However, the plant density showed a significant response to canopy cover at 30 DAP to harvest in the three regions (Table 1, Table 2 and Table 3). Planting groundnut at a density of 22 plant/m2 increased (p < 0.05) canopy cover at 30, 40, 50, and 60 DAP and at harvest compared with the other plant densities in the three regions (Table 1, Table 2 and Table 3).
The groundnut variety and plant density showed a significant response to biological nitrogen fixation in the three regions (Table 1, Table 2 and Table 3). The biological nitrogen fixation for the treatments were in the range of 21–69 %/ha across the three regions. The late maturing groundnut varieties fixed more (p < 0.01) biological nitrogen into the soil than the early maturing varieties. Similarly, planting groundnut at a density of 22 plant/m2 recorded a higher (p < 0.05) biological nitrogen fixation than the other plant densities in all the regions.

3.4. Human

The calorie and protein production varied among the groundnut varieties and plant densities in all three regions (Table 1, Table 2 and Table 3). Generally, the Upper East region had the least calorie and protein production compared with the other two regions. The Mani pinta variety consistently had a higher (p < 0.05) calorie and protein production across the three regions. The late maturing groundnut varieties produced more (p < 0.05) calorie and protein than the early maturing varieties. Similarly, planting groundnut at a density of 22 plant/m2 increased (p < 0.05) the calorie and protein production more than the other plant densities across the regions.

3.5. Social

The rating of groundnut varieties and plant densities varied between the male and female farmers across the three regions (Table 1, Table 2 and Table 3). The Yenyawoso variety was the most preferred groundnut variety compared with the others by the male farmers in the three regions. Similarly, most of the female farmers in the Upper East preferred the Yenyawoso variety, but in the Upper West and Northern regions, most of the female farmers preferred the Chinese variety. Generally, the majority of the farmers preferred the early maturing groundnut varieties than the late maturing ones. Planting groundnut at a density of 22 plant/m2 was the most preferred plant density by both male and female farmers in the three regions.

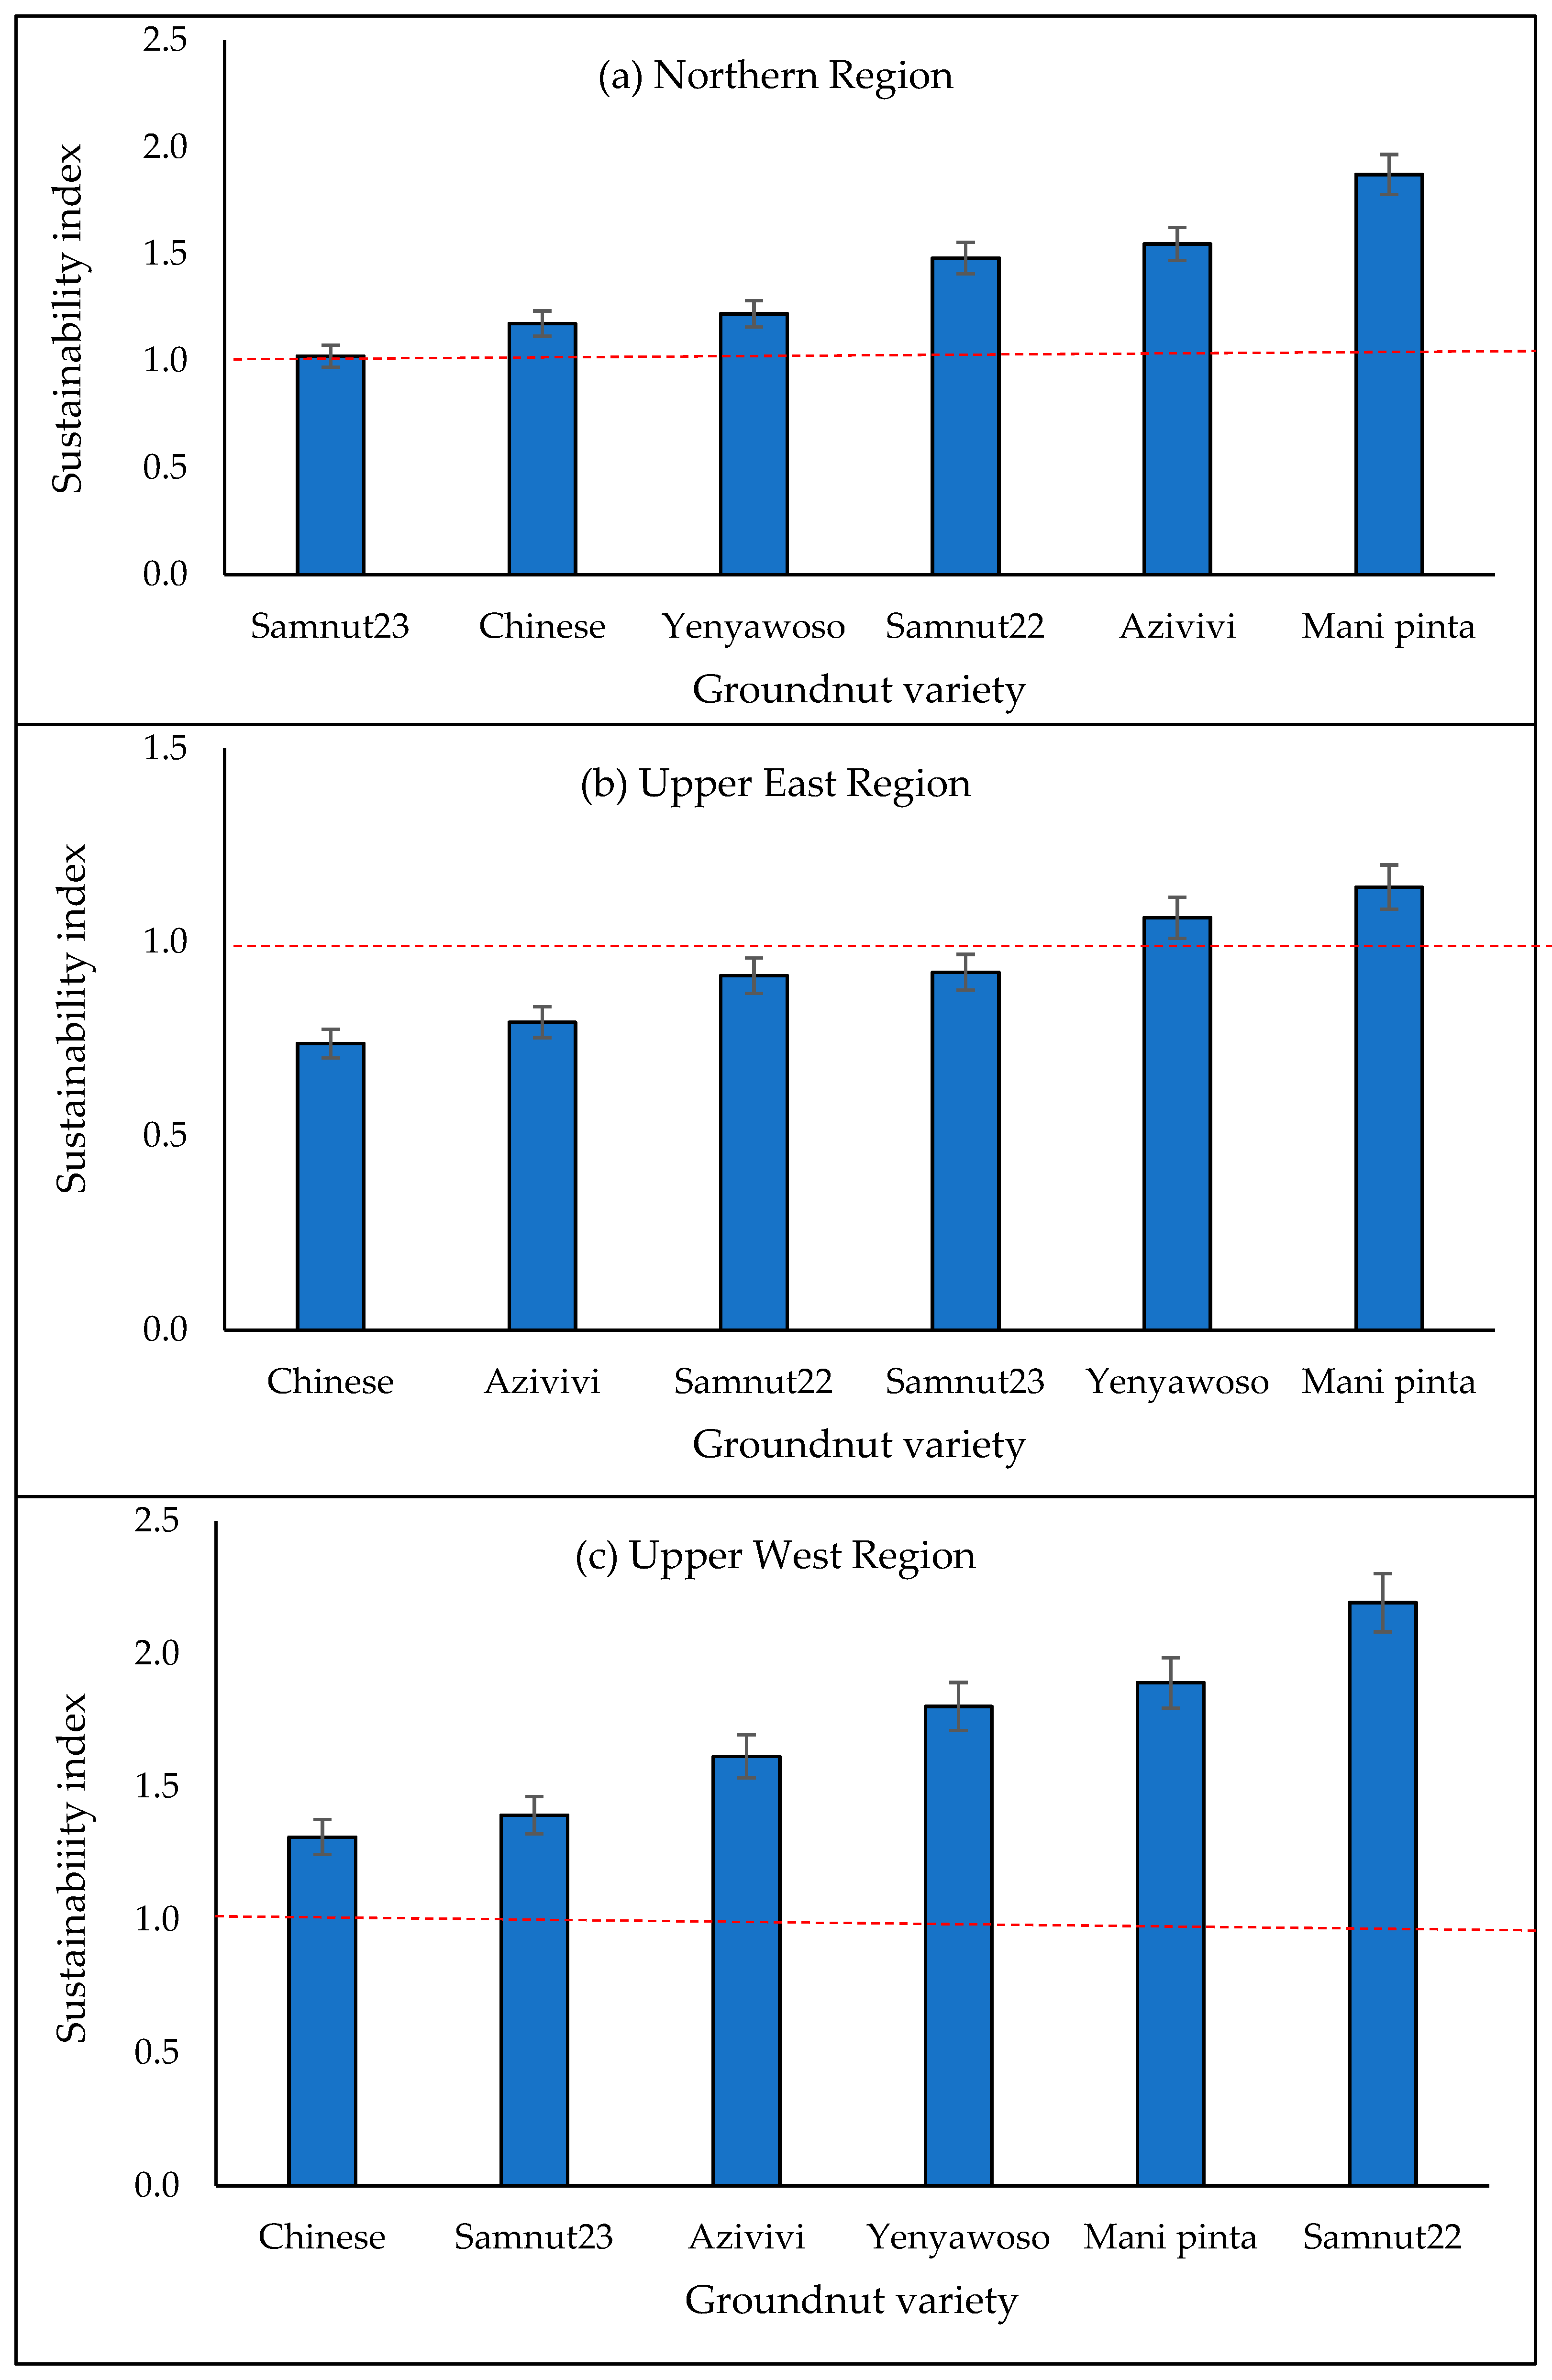
3.6. Sustainability Index

With regards to the improved groundnut varieties, the late maturing varieties showed consistent higher scores for the productivity, economic, environment, and human domains compared with the early maturing varieties across the three regions (Figure 3). In contrast to the above domains, the early maturing groundnut varieties had higher scores for the social domain than the late maturing varieties (Figure 3). Generally, across the three regions, the late maturing varieties had higher sustainability indices than the early maturing varieties (Figure 4). The sustainability indices for Yenyewoso (early maturing) and Mani pinta (late maturing) groundnut varieties were consistently above 1 in all the regions (Figure 3).
In terms of plant density, planting both early and late maturing groundnut varieties at 22 plant/m2 had higher scores for productivity, economic, environment, human, and social domains than the other plant density across the three regions (Figure 5). Planting groundnut at 22 plant/m2 had a consistent sustainability index of above one across the three regions (Figure 6). Similarly, planting groundnut at 22 plant/m2 recorded a higher sustainability index than the other plant densities with farmer practice (9 plant/m2) recording the lest sustainability index (Figure 6).

4. Discussion

The late maturing groundnut varieties showed very high performance under four out of the five sustainable intensification domains (productivity, economic, environment, and human) compared with early maturing varieties. The increase in grain and fodder yield indicators under productivity could be due to the long period of growth, which allowed enough growth period for the partition of dry matter into grain and fodder yield. This result was in line with earlier reports that late maturing groundnut varieties produce higher grain and fodder yields than the early maturing ones [14]. The higher economic domain indicators recorded by the late maturing varieties more than the early maturing varieties could possibly be attributed to the increase in the grain yield of the late maturing varieties, which was able to offset the additional cost of production. Meena and Yadave [16] reported a similar increase in grain yield, net return and BCR, between two groundnut varieties in an experiment conducted at Bekana-Rajasthan, India. The lower social domain score recorded by the late maturing variety compared to the early maturing varieties was due to farmers becoming more conscious about the erratic pattern and uncertain about the start of the rainfall in these areas. The farmers also indicated their preference for the early maturing varieties relative to the late maturing ones as a mitigation mechanism against erratic rainfall patterns; therefore, plant breeders should find ways of improving the yield of these early maturing varieties. Fosu-Meansah et al. [29] reported the planting of short season varieties as one of the major adaptation strategies for climate change by smallholder farmers in Sekyedumase District of Ghana.
The plant density showed different scores under the five sustainable intensification domains. Planting groundnut, irrespective of the maturity type, at a density of 22 plant/m2 recorded higher productivity, economic, environment, human, and social domain scores compared to the other plant densities. On average across the three regions, planting groundnut at 22 plant/m2 increased the productivity domain score by 63% compared with the 9 plant/m2 (farmer practice). This increase could be due to the increase in plant stands per unit area, which resulted in more pods and fodder per unit area. This result is in line with findings of other studies, where increasing the groundnut plant density has increased pod and fodder yields [14,15,30]. Similarly, planting groundnut at a density of 22 plant/m2 increased the economic domain about threefold relative to the farmer practice and this could be due to the increase in the grain yield, which was able to offset the additional cost of production from this treatment. Dominguez-Hernandez et al. [31] reported that the most influential attribute for measuring the sustainability of agricultural technology is the productivity domain, as the yields determine how efficient the production system is utilized, which, in turn, influences other domains. The 31% increase in the environment domain score for groundnut plant density at 22 plant/m2 compared with the farmer practice across the three regions could be due to the early closure of the canopy, which reduces nutrient loss through soil erosion, smothering and preventing weed growth as a result of more plants per unit area. Giayetto et al. [15] also reported that higher groundnut plant density leads to the production of more tinny canopies that close faster to prevent erosion, weed growth, and the interception of more solar radiation. The higher social domain score obtained by 22 plant/m2 relative to the other plant densities was attributed to good plant stand at harvest, reduced weeding frequency, and good yield by both gender groups of the farmers. Although both farmers reported that the first weeding in 22 plant/m2 required a bit more time compared with farmer practice due to the closeness of the plants, they preferred the later to the farmer practice, since it required only one weeding, which gave them ample time to do other important agricultural related activities that coincide with the second weed of groundnut fields during the cropping season.
The SIAF provided a systematic way of measuring and integrating the measured indicators under the five domains among the treatments in the production system. The higher sustainability indices recorded by the late maturing varieties compared to the early maturing varieties was due to the higher scores recorded by the later for the measured indicators under the productivity, economic, environment, and human domains. On average, across the three regions, the sustainability indices for both groundnut maturity types were above one, which indicates that both groundnut maturity types are sustainable to cultivate across the three regions. Similarly, Yenyewoso (early maturing) and Mani pintar (late maturing) varieties recorded sustainability indices of above 1 across the three Northern regions, which made them more sustainable to cultivate across the Guinea and Sudan savanna agro-ecologies of Northern Ghana. In line with our results, other studies have reported sustainability indices of above 1 to be more sustainable than less than 1 [24,25].
On the average across all the regions, planting early and late maturing groundnut varieties at densities above the farmer practice (9 plant/m2) had sustainability indices of greater than 1 however, planting them at 22 plant/m2 increased the sustainability index by 79% compared to 15 and 11 plant/m2. This means that to sustainably increase groundnut production in Northern Ghana, farmers should plant groundnut at a density of 22 plant/m2 to enhance fast growth and the closure of the plant canopy to reduce soil erosion and improve the utilization of resources (soil moisture and nutrients and solar radiation), which translate into higher productivity and profitability with reduced labor needs for weed control. This result supports the findings that a production system with a sustainability index of above 1 is more sustainable than less than 1 [24,25].

5. Conclusions

Generally, the assessment of the sustainability of the groundnut varieties and plant densities did not vary across the three Northern regions. The sustainability indices for the early (Yenyewoso) and late (Mani pintar) groundnut maturity types were consistently above 1 in all the regions, indicating that both groundnut maturity types are sustainable for cultivation in the Guinea and Sudan savanna agro-ecologies of the Northern regions of Ghana. Planting both groundnut maturity types at a density of 22 plant/m2 resulted in higher productivity, economic, environment, human, and social domain scores and sustainability indices of above 1 across the three regions, indicating better sustainability than the other plant densities. This suggests that planting groundnut at a density of 22 plant/m2 will sustainably intensify groundnut production for smallholder farmers in Northern Ghana and similar agro-ecologies across West Africa. The results of the study also provide useful insights into the scientific community on how to evaluate the sustainable intensification potential of the agricultural production system at plot level. The SIAF was very useful in providing a systematic approach to evaluate the sustainable intensification potential of the plant density on groundnut production. However, assessing most of the indicators under the social and human domains of the SIAF at the plot level were challenging and, therefore, a future review of the framework to add more indicators under the social and human domains that can be assessed at the plot level is recommended.

Author Contributions

Conceptualization, A.L. and N.A.R.; methodology, N.A.R., A.L., and B.K.; formal analysis, N.A.R.; investigation, N.A.R.; resources, I.H.-Z., A.L., and F.K.; data curation, N.A.R.; writing—original draft preparation, N.A.R.; writing—review and editing, A.L. and B.K.; visualization, N.A.R.; supervision, A.L.; project administration, I.H.-Z., A.L., and F.K.; funding acquisition, I.H.-Z. All authors have read and agreed to the published version of the manuscript.

Funding

This research was funded by United State Agency for International Development with grant number ARG#: AID-BFS-G-11-00002.

Acknowledgments

We wish to express our gratitude to Dokurugu Fuseini, Ismail Mahama, and Albert Berdjour of International Institute of Tropical Agriculture and all the farmers from the intervention communities for their assistance during the field establishment and data collection in the three Northern regions of Ghana.

Conflicts of Interest

The authors declare no conflict of interest.

References

  1. United Nations; Department of Economic and Social Affairs; Population Division. World Population Prospects: The 2017 Revision, Key Findings and Advance Tables; Working Paper No. ESA/P/WP/248; United Nations: New York, NY, USA, 2017. [Google Scholar]
  2. Vanlauwe, B.; Barrios, E.; Robinson, T.; Van Asten, P.; Zingore, S.; Gérard, B. System productivity and natural resource integrity in smallholder farming: Friends or foes? In Sustainable Intensification in Smallholder Agriculture; Öborn, I., Vanlauwe, B., Phillips, M., Thomas, R., Brooijmans, W., Atta-Krah, K., Eds.; Routledge: London, UK, 2017; pp. 159–176. [Google Scholar]
  3. World Bank. World Development Report 2008: Agriculture for Development; The International Bank for Reconstruction and Development: Washington, DC, USA, 2007. [Google Scholar]
  4. Gunton, R.M.; Firbank, L.G.; Inman, A.; Winter, D.M. How scalable is sustainable intensification. Nat. Plants. 2016, 2, 10–1038. [Google Scholar] [CrossRef] [PubMed] [Green Version]
  5. Snapp, S.S.; Grabowski, P.; Chikowo, R.; Smith, A.; Anders, E.; Sirrine, D.; Chimonyo, V.; Bekunda, M. Maize yield and profitability tradeoffs with social, human and environmental performance: Is sustainable intensification feasible? Agric. Syst. 2018, 162, 77–88. [Google Scholar] [CrossRef]
  6. Tilman, D.; Cassman, K.G.; Matson, P.A.; Naylor, R.; Polasky, S. Agricultural sustainability and intensive production practices. Nature 2002, 418, 671–677. [Google Scholar] [CrossRef] [PubMed]
  7. Baulcombe, D.; Crute, I.; Davies, B.; Dunwell, J.; Gale, M.; Jones, J.; Pretty, J.; Sutherland, W.; Toulmin, C. Reaping the Benefits: Science and the Sustainable Intensification of Global Agriculture; The Royal Society: London, UK, 2009. [Google Scholar]
  8. Schut, M.; van Asten, P.; Okafor, C.; Hicintuka, C.; Mapatano, S.; Nabahungu, N.L.; Kagabo, D.; Muchunguzi, P.; Njukwe, E.; Dontsop-Nguezet, P.M.; et al. Sustainable intensification of agricultural systems in the Central African Highlands: The need for institutional innovation. Agric. Syst. 2016, 145, 165–176. [Google Scholar] [CrossRef]
  9. Musumba, M.; Grabowski, P.; Palm, C.; Snapp, S. Guide for the Sustainable Intensification Assessment Framework; Kansas State University: Manhattan, NY, USA, 2017. [Google Scholar]
  10. Pasupuleti, J.; Nigam, S.N.; Pandey, M.K.; Nagesh, P.; Varshney, R.K. Groundnut improvement: Use of genetic and genomic tools. Front. Plant Sci. 2013, 4, 23. [Google Scholar] [CrossRef] [Green Version]
  11. Tsigbey, F.K.; Brandenburg, R.L.; Clottey, V.A. Peanut production methods in Northern Ghana and some disease perspectives, 2003. World Geogr. Peanut Knowl. Base Website. 2003, 9, 33–38. [Google Scholar]
  12. Ministry of Food and Agriculture (MoFA). Agriculture in Ghana: Facts and Figures (2016); MoFA-Statistics, Research and Information Directorate: Accra, Ghana, 2017.
  13. Larbi, A.; Dung, D.D.; Olorunju, P.E.; Smith, J.W.; Tanko, R.J.; Muhammad, I.R.; Adekunle, I.O. Groundnut (Arachis hypogaea) for food and fodder in crop-livestock systems: Forage and seed yields, chemical composition and rumen degradation of leaf and stem fractions of 38 cultivars. Anim. Feed Sci. Technol. 1999, 77, 33–47. [Google Scholar] [CrossRef]
  14. Naab, J.B.; Seini, S.S.; Gyasi, K.O.; Mahama, G.Y.; Prasad, P.V.V.; Boote, K.J.; Jones, J.W. Groundnut yield response and economic benefits of fungicide and phosphorus application in farmer-managed trials in Northern Ghana. Exp. Agric. 2009, 45, 385–399. [Google Scholar] [CrossRef] [Green Version]
  15. Giayetto, O.; Cerioni, G.A.; Asnal, W.E. Effect of sowing spacing on vegetative growth, dry matter production, and peanut pod yield. Peanut Sci. 1998, 25, 86–87. [Google Scholar] [CrossRef]
  16. Meena, R.S.; Yadav, R.S. Yield and profitability of groundnut (Arachis hypogaea L) as influenced by sowing dates and nutrient levels with different varieties. Legume Res. 2015, 38, 791–797. [Google Scholar] [CrossRef] [Green Version]
  17. Tetteh, F.M.; Larbi, A.; Nketia, K.A.; Senaya, J.N.; Hoeschle-Zeledon, I.; Abdul Rahman, N. Suitability of Soils for Cereal Cropping in Northern Ghana. Evaluation and Recommendations; International Institute of Tropical Agriculture (IITA): Ibadan, Nigeria, 2016. [Google Scholar]
  18. Kotu, B.H.; Abass, A.B.; Hoeschle-Zeledon, I.; Mbwambo, H.; Bekunda, M. Exploring the profitability of improved storage technologies and their potential impacts on food security and income of smallholder farm households in Tanzania. J. Stored Prod. Res. 2019, 82, 98–109. [Google Scholar] [CrossRef]
  19. Brooks, J.; Croppenstedt, A.; Aggrey-Fynn, E. Distortions to Agricultural Incentives in Ghana; Working Paper 47; World Bank’s Development Research Group: Washington, DC, USA, 2007. [Google Scholar]
  20. Teasdale, J.R.; Brandsaeter, L.O.; Calegari, A.; Neto, F.S.; Upadhyaya, M.K.; Blackshaw, R.E. Cover Crops and Weed Management: Non-Chemical Weed Management: Principles, Concepts and Technology; CABI: Wallingford, UK, 2007; pp. 49–64. [Google Scholar]
  21. Daubenmire, R.F. A canopy-coverage method of vegetational analysis. Northwest Sci. 1959, 33, 43–64. [Google Scholar]
  22. Unkovich, M.; Herridge, D.; Peoples, M.; Cadisch, G.; Boddey, B.; Giller, K.; Alves, B.; Chalk, P. Measuring Plant-Associated Nitrogen Fixation in Agricultural Systems; Monograph No. 136; Australian Centre for International Agricultural Research (ACIAR): Canberra, Australia, 2008.
  23. Pollesch, N.; Dale, V.H. Applications of aggregation theory to sustainability assessment. Ecol. Econ. 2015, 114, 117–127. [Google Scholar] [CrossRef] [Green Version]
  24. Kang, G.S.; Beri, V.; Sidhu, B.S.; Rupela, O.P. A new index to assess soil quality and sustainability of wheat-based cropping systems. Biol. Fertil. Soils. 2005, 41, 389–398. [Google Scholar] [CrossRef] [Green Version]
  25. Abdul Rahman, N.; Larbi, A.; Opoku, A.; Tetteh, F.M.; Hoeschle-Zeledon, I. Crop–livestock interaction effect on soil quality and maize yield in Northern Ghana. Agron. J. 2019, 111, 907–916. [Google Scholar] [CrossRef] [Green Version]
  26. Statistical Analysis System (SAS) Institute. Base SAS 9.4 Procedures Guide; SAS Institute Inc.: Cary, NC, USA, 2013. [Google Scholar]
  27. Gomez, K.A.; Gomez, A.A. Statistical Procedures for Agricultural Research, 2nd ed.; John Wiley & Sons: New York, NY, USA, 1984; pp. 328–331. [Google Scholar]
  28. Bank of Ghana 2020. Available online: http://www.bog.gov.gh/treasury-and-the-markets/daily-interbank-fx-rates/ (accessed on 16 June 2020).
  29. Fosu-Mensah, B.Y.; Vlek, P.L.; MacCarthy, D.S. Farmers’ perception and adaptation to climate change: A case study of Sekyedumase district in Ghana. Environ. Dev. Sustain. 2012, 14, 495–505. [Google Scholar] [CrossRef]
  30. Tubbs, R.S.; Beasley, J.P., Jr.; Culbreath, A.K.; Kemerait, R.C.; Smith, N.B.; Smith, A.R. Row pattern and seeding rate effects on agronomic, disease, and economic factors in large-seeded runner peanut. Peanut Sci. 2011, 38, 93–100. [Google Scholar] [CrossRef]
  31. Dominguez-Hernandez, M.E.; Zepeda-Bautista, R.; Valderrama-Bravo, M.D.C.; Dominguez-Hernandez, E.; Hernandez-Aguilar, C. Sustainability assessment of traditional maize (Zea mays L.) agroecosystem in Sierra Norte of Puebla, Mexico. Agroecol. Sustain. Food Syst. 2018, 42, 383–406. [Google Scholar] [CrossRef]
Figure 1. Map of Ghana showing experimental sites.
Sustainability 12 05970 g001
Figure 2. Diagram of pentagon with triangles.
Sustainability 12 05970 g002
Figure 3. Sustainable intensification domains scores as affected by groundnut variety in Northern Ghana.
Sustainability 12 05970 g003
Figure 4. Sustainability index as affected by groundnut variety in Northern Ghana. Bars represent standard error.
Sustainability 12 05970 g004
Figure 5. Sustainable intensification domain scores as affected by groundnut plant density in Northern Ghana.
Sustainability 12 05970 g005
Figure 6. Sustainability index as affected by groundnut plant density in Northern Ghana. Bars represent standard error.
Sustainability 12 05970 g006
Table 1. Improved groundnut variety and plant density effect on indicators under productivity, economic, environment, human, and social domains, Northern Region of Ghana.
ProductivityEconomic EnvironmentHumanSocial
Yield (kg/ha)Net Income Vegetative Cover (Days After Planting, %)BNFCalorieProteinTechnology Rating (%)
GrainFodder(GHC/ha)BCR030405060Harvest(%/ha)(kcal/ha) × 106(g/ha) × 105Male (n = 182) Female (n = 147)
Variety
Chinese784.2 bc1636.4 b272.7 c1.2 bc 31.8 a45.6 a71.0 a82.7 a88.6 a25.7 c4.4 bc2.0 bc2029
Yenyawoso788.8 bc2029.7 b311.9 bc1.2 bc 27.1 a41.8 a65.0 a81.0 a90.1 a39.7 b4.5 bc2.0 bc2420
Samnut 23758.2 c1868.7 b183.0 c1.1 c 29.1 a43.3 a76.4 a84.2 a90.2 a23.7 c4.3 c2.0 c1012
Azivivi909.2 ab2827.7 a525.6 ab1.3 ab 24.5 a39.2 a69.5 a83.9 a92.7 a63.0 a5.2 ab2.3 ab1216
Mani pinta985.5 a3168.8 a714.6 a1.4 a 28.7 a43.0 a69.8 a81.0 a89.1 a69.3 a5.6 a2.5 a2116
Samnut 22847.7 abc2797.8 a414.7 bc1.3 ab 30.9 a46.4 a75.4 a86.2 a90.8 a69.3 a4.8 abc2.2 abc149
s.e.m46.42134.5283.580.06 1.791.883.052.661.884.500.260.12--
p-value0.0257<0.00010.005200.00870 0.11200.14640.15810.72920.7214<0.00010.02570.0257--
Plant density (plant/ha)(n = 150)(n = 110)
221124.5 a3035.9 a878.2 a1.5 a 39.7 a54.4 a82.1 a93.0 a98.2 a62.3 a6.4 a2.9 a4345
15882.4 b2546.6 b318.1 b1.2 b 28.1 b43.9 b74.3 b84.7 b91.0 b55.3 ab5.0 b2.3 b2427
11769.7 c2000.4 b355.5 b1.2 b 26.2 b39.6 bc67.8 c82.0 b88.6 b36.4 b4.4 c2.0 c1716
9605.9 d1969.8 c63.3 c1.0 c 20.7 c35.0 c60.5 d72.9 c83.2 c39.8 b3.4 d1.6 d1512
s.e.m50.61102.24109.100.07 1.701.712.831.901.685.930.290.13--
p-value0.00030.00010.00340.0044 0.00020.00010.00260.00030.00110.03810.00030.0003--
Values with same letter(s) in columns under a factor are not significantly different from each other according to least significant difference (lsd) test. 1 US$ = 5.65 Ghana cedi [28].
Table 2. Improved groundnut variety and plant density effect on indicators under productivity, economic, environment, human, and social domains, Upper East Region of Ghana.
ProductivityEconomicEnvironment HumanSocial
Yield (kg/ha)Net Income Vegetative Cover (Days After Planting, %)BNFCalorieProteinTechnology Rating (%)
GrainFodder(GHC/ha)BCR30405060Harvest(%/ha)(kcal/ha) × 106(g/ha) × 105Male (n = 182) Female (n = 147)
Variety
Chinese595.0 d1052.9 d−269.8 d0.9 c32.4 a46.0 ab61.0 a71.4 b83.4 c21.9 b3.4 d1.5 cd3131
Yenyawoso695.2 c1521.0 bc26.8 bc1.0 b29.9 ab47.4 a63.6 a75.5 ab90.1 ab35.4 b3.9 c1.8 c3636
Samnut 23816.6 a1430.8 c347.0 a1.1 a24.0 c35.8 c50.6 b64.1 c81.9 c32.3 b4.6 a2.1 a77
Azivivi655.7 cd1740.9 abc−86.4 cd0.9 c25.5 c38.7 c56.2 ab71.9 b90.0 ab56.1 a3.7 cd1.7 cd99
Mani pinta780.8 ab1928.2 a269.8 ab1.1 a26.6 bc40.3 bc58.0 ab72.1 b88.8 b67.0 a4.4 ab2.0 ab1616
Samnut 22730.5 bc1777.5 ab121.4 abc1.0 b30.3 ab44.9 ab63.6 a79.4 a93.1 a55.5 a4.1 bc1.9 bc11
s.e.m28.08110.3482.150.031.251.982.492.261.234.960.160.07--
p-value0.00060.00070.00090.00070.00190.00490.01560.0063<0.00010.00010.00060.0006--
Plant density (plant/ha)(n = 71)(n = 86)
22936.3 a1922.2 a765.5 a1.3 a31.6 a46.6 a66.6 a78.0 a92.3 a52.4 a5.3 a2.4 a3549
15727.3 b1604.1 b−156.7 b0.9 b28.7 ab43.9 a60.3 ab72.3 b88.3 b45.7 ab4.1 b1.9 b1424
11644.8 bc1441.0 bc−42.4 b1.0 b27.6 ab41.8 ab55.6 bc70.1 b87.0 b42.8 b3.7 bc1.7 bc3220
9540.8 c1333.6 c−293.9 b0.8 b24.5 b36.4 b52.8 b69.1 b84.0 c37.8 b3.1 c1.4 c187
s.e.m38.4358.84109.980.041.131.451.171.450.792.490.220.10--
p-value0.00030.00030.00030.00010.01140.0045<0.00010.00780.00030.01550.00030.0003--
Values with same letter(s) in columns under a factor are not significantly different from each other according to least significant difference (LSD) test. 1 US$ = 5.65 Ghana cedi [28].
Table 3. Improved groundnut variety and plant density effect on indicators under productivity, economic, environment, human, and social domains in Upper West Region of Ghana.
ProductivityEconomicEnvironment HumanSocial
Yield (kg/ha)Net Income Vegetative Cover (Days After Planting, %)BNFCalorieProteinTechnology Rating (%)
GrainFodder(GHC/ha)BCR30405060Harvest(%/ha)(kcal/ha) × 106(g/ha) × 105Male (n = 182) Female (n = 147)
Variety (V)
Chinese728.2 b3000.6 d257.1 b1.1 b33.5 b50.2 abc72.5 ab81.4 ab89.4 a25.7 a4.1 b1.9 b839
Yenyawoso786.5 b3859.2 bc415.0 b1.2 b35.9 ab50.7 abc71.4 ab82.8 a90.5 a49.6 b4.5 b2.0 b4925
Samnut 23841.7 ab3443.3 cd534.6 ab1.3 ab33.1 b44.9 c60.4 d73.6 b85.4 ab32.1 c4.8 ab2.2 ab74
Azivivi846.3 ab4213.6 ab520.4 ab1.3 ab39.3 a53.4 ab76.8 a84.5 a87.9 ab51.0 ab4.8 ab2.2 ab00
Mani pinta950.5 a4292.8 ab805.1 a1.4 a32.3 b49.5 bc65.8 cd79.5 ab85.9 ab52.1 ab5.4 a2.5 a161
Samnut 22958.3 a4331.3 a822.0 a1.4 a32.5 b57.3 a70.4 bc83.1 a83.8 b60.0 a5.4 a2.5 a1930
s.e.m52.06153.88116.480.071.602.411.812.711.823.390.300.13--
p-value0.0447<0.00010.02460.02990.05260.04560.00020.12130.1417<0.00010.04470.0447--
Plant density (plant/ha)
221147.6 a4312.6 a1292.7 a1.7 a36.4 a58.3 a75.7 a87.6 a90.9 a54.5 a6.5 a3.0 a4641
15905.1 b3963.3 ab502.1 b1.2 b36.4 a53.1 ab71.4 ab81.3 b91.4 a54.3 a5.1 b2.3 b3943
11767.8 bc3757.9 ab433.3 bc1.2 b35.1 a49.8 b69.0 b81.4 b84.8 b40.7 b4.4 bc2.0 bc1216
9587.1 c3393.5 b8.1 c1.0 c29.8 b42.9 c62.0 c73.0 c81.5 c30.8 c3.3 c1.5 c30
s.e.m39.09133.5779.780.041.481.261.551.191.502.770.220.10--
p-value<.00010.0059<0.0001<0.00010.0356<0.00010.00110.00010.00280.0004<0.0001<0.0001--
Values with same letter(s) in columns under a factor are not significantly different from each other according to least significant difference (LSD) test. 1 US$= 5.65 Ghana cedi [28].

