Article

Social Economy, Environmental Proactivity, Eco-Innovation and Performance in the Spanish Wine Sector

by
Félix Calle
,
Ángela González-Moreno
,
Inmaculada Carrasco
* and
Manuel Vargas-Vargas
Faculty of Economics, University of Castilla-La Mancha, 02080 Albacete, Spain
*
Author to whom correspondence should be addressed.
Sustainability 2020, 12(15), 5908; https://doi.org/10.3390/su12155908
Submission received: 31 May 2020 / Revised: 19 July 2020 / Accepted: 21 July 2020 / Published: 22 July 2020

Abstract

:
Concerned about climate change, cooperatives in the wine sector are beginning to adapt their strategies, guided by cooperative principles that encompass high social responsibility and the pursuit of community values. In this context and focused on the analysis of the decisions that drive firms to be more environmentally sustainable, our goal is twofold. On the one hand, we wish to examine whether there exist differences between cooperative and non-cooperative firms as regards their environmental proactivity. On the other hand, we hope to demonstrate the diversity of behaviors within the category of cooperative firms, identifying the possible patterns of environmental proactivity in Spanish cooperatives in the wine sector. We first conducted a difference of means t-test for independent samples (n = 251; sampled in 2017)—cooperatives (51) vs. non cooperative firms (200)- and then a two-stage cluster analysis and a subsequent variance analysis, using SPSS 24. Our results show no significant differences between cooperative and non-cooperative firms concerning their environmental behavior and underlines the diversity within the cooperatives in the wine sector as regards their environmental proactivity, revealing the existence of proactive, preventive and activist patterns of behavior. These patterns also show differences in the motivations for their environmental behaviors and their assessment of financial performance.

1. Introduction

The scientific community broadly agrees that climate change is being rapidly exacerbated by human action, with the increase in pollutant gas emissions disrupting the world’s weather patterns. Feeding the population is a significant contributor to climate change because all foods, before reaching the end consumer, must be produced, processed, packaged and transported. At all stages of this process, large amounts of greenhouse effect gases are released, and, furthermore, great quantities of water are consumed with an immense impact on the world’s ecosystems. In the agri-food sector, the search for sustainability practices has never been greater [1]. Nevertheless, in recent decades, the agri-food industry is increasingly aware of the close relationship between the sector’s activity and climate change, and high-quality products that are respectful with the environment are thus being developed [1,2,3]. In the case of the wine sector, the above scenario is further framed within a context of great competitiveness due to the globalization of the industry. The literature has identified the importance of research in business models in the field of sustainability [4] and recognizes the lack of empirical studies on this issue, related to innovation [5,6] and agri-food sustainable transitions. This field of research is still young and a research agenda that meets its particularities and special features is needed [7] particularly in the wine sector [8].
The wine production sector is an important part of the economic and social identity of Spain and forms a significant feature of the landscape in many of the country’s regions. As in the rest of the producing countries, the Spanish sector is confronted by pressures to improve environmental performance [6,9,10,11,12,13], and thus the sector is beginning to adapt to the demands of climate change in all stages of production and in all types of enterprises: capitalist companies and cooperatives; and small, medium and large enterprises. Adaptive strategies are emerging that directly affect company performance and open up opportunities in the potential market value of their strategies linked to preservation and respect for the environment and a reduction in their water, carbon and energy footprints [4].
Like other businesses, the cooperatives in the wine sector are also affected by these trends, and they are in a process of adaptation, but with an internal organization based on different principles to capitalist enterprises. Their cooperative values and particularly their “interest in the community” mean they are guided by codes that encompass high social responsibility and the pursuit of community values [14,15,16]. The international cooperative alliance holds that cooperatives lead the fight against climate change in many countries and industries, given that, apart from its undeniable environmental impact, the phenomenon has consequences for the social and economic well-being of the people of the world. In addition, and more broadly speaking, cooperatives are inherently sustainable business models that develop the “triple bottom line” of social, economic and environmental concerns [17,18].
This innate condition appears to mean that cooperatives are socially responsible by nature, but the literature is inconclusive as regards their strengths in terms of improving environmental sustainability. In firms, every change directed at improving the environmental impact of their activity is a consequence of eco-innovation initiatives, and thus eco-innovation presents a strong correlation with non-environmental innovation. Then, if cooperatives present weaknesses in their capacity to innovate, these will also affect environmental proactivity. While some authors have found this not to be a visible strength of such enterprises [15], others [17,18,19,20,21] suggest that cooperative enterprises equal capitalist companies in competitiveness and there is no difference between the two in terms of management and investment capacity.
The literature on eco-innovation has largely ignored the third sector [22,23]; studies are practically non-existent and even more so in the case of such a specific sector as wine production. To the best of our knowledge, this is the first attempt to study environmental proactivity and eco-innovation in wine cooperatives. Thus, the aim of this article is to fill the gaps identified in the literature by making a benchmark contribution on the eco-innovative behavior of cooperative wineries in Spain, examining whether they present a homogenous environmental behavior, or whether, in contrast, they present differences which can be explained by the motivations for their eco-innovative strategies, which in turn may generate differences in performance as regards eco-innovations and in economic and market terms.
To determine the possible patterns of environmental proactivity, we draw on the work by Aragón-Correa [24], using the scale developed and validated in his 1998 work and subsequently used in other studies [25,26].-We surveyed a sample of 251 wineries, 51 of which were cooperatives. We first conducted a difference of means t-test for independent samples–cooperatives (51) vs. non cooperative firms (200), and then a two-stage cluster analysis and a subsequent variance analysis, using SPSS 24, in the cooperative subsample (51). This statistical technique, which allows groups of firms with homogeneous behaviors to be identified, has been widely used in the management literature in order to generate strategic typologies in different sectors of activity [27]. It is still widely used today [28,29,30]. Indeed, a recent work on the environmental behavior of SMEs in the wine sector opted for this statistical technique [1].
The first analysis found no significant differences between cooperative and non-cooperative firms in environmental behavior. The second analysis identified three groups of cooperatives, according to their environmental proactivity. These patterns also show differences in the motivations for their environmental behaviors and their assessment of financial performance.
This work makes the following important contributions to the literature. First, it focuses on analyzing environmental concerns, a field of decision-making on which managers need to pay greater attention, both in firms and public institutions. Our results will help to improve individual and collective environmental performance. Second, the paper is focused on the Spanish wine sector, which accounts for a significant share of the agri-food industry and contributes 1% of Spanish GDP (Spanish federation of wine, online data, 2018). Third, this work provides evidence on the diversity of environmental behaviors in a specific category of firms, cooperatives, questioning the idea that this legal framework alone determines many of such companies’ decisions, affecting the performance of social economy organizations.

2. Literature Review: Wine Sector, Eco-Innovation and Social Economy

2.1. The Spanish Wine Industry: Background

In order to establish the contextual framework of our study, in this section, we will summarize the key data on the Spanish wine sector in the perspective of the worldwide wine market. The global wine market has traditionally been dominated by the three largest Old-World producing countries, which account for most the cultivated area of vineyards: Spain, Italy and France. However, in the 1990s, the surface area of vineyards across the world grew significantly and new producers, such as China, Australia, Argentina, Chile, New Zealand, South Africa and the United States, increased production, gaining a considerable share of international markets, especially in the premium wines segment, with growing product differentiation strategies in the global wine trade [31,32]. These changes were facilitated by technological advances that allowed production to be increased and quality to be improved, leading to the entry of new producers in global wine markets [33]. These so-called New-World suppliers challenged established companies in existing and emerging markets, driving them to penetrate new markets across the world. The result is an expanding and increasingly competitive global market, where, according to their competitive advantage in the wine industry, countries may be classified as follows [31]: the strongest (the US, Australia and Chile), moderate (Italy, Spain, Argentina and South Africa) and the weakest (France and Germany). In this international context, Italy and Spain are regarded as having the capacity to adapt in a worldwide marketplace [31].
The entry of these emerging producers in the market has brought with it a new global concept that includes, apart from just winemaking, the social aspects of personal service and fair trade and especially the continuous development of ecological-friendly and sustainable wine production. The European producing companies have taken good note of this and more than 200,000 hectares are estimated to be devoted to organic wine production.
The transformations undertaken in the vineyards and wines of the Old World have been led by an immensely fragmented business sector, based on relatively small family wineries, with a plethora of marks and wines made with grape varieties recognized under the umbrella of designations of origin and geographic indications. This is in stark contrast to the New World production, characterized by strong brands associated with homogenous ranges of grape varieties, under the control of large multinational wine companies [34] which control production and distribution chains. The success of these new winemakers’ production system was facilitated by poor regulation and aggressive marketing strategies [35].
According to the most recent data published by the International organization of vine and wine (online data, 2016), with 975,000 ha, Spain has the largest area of vineyards in the world (13% of total world vineyards and 26.5% of European ones), followed by China (847,000 ha) which has recently overtaken France and Italy, the traditional world leaders together with Spain. Despite this, the country that produces the highest quantity of wine is Italy (50.9 M HL), followed by France (45.3 M HL) and Spain (39.6 M HL). This divergence is explained by the higher productivity of Italian and French vineyards, the specialization of Chinese production in fresh grapes for human consumption (10 M tons) and the high relative weight of Spanish production in bulk, destined to give support to national and international coupages.
According to the Spanish federation of wine (online data) with more than 21 M HL (2019), Spain is the first exporter in the world and the third in terms of value of exports (2,7 B €). The country boasts a wide range of recognized quality seals (70 denominations of origin, 42 protected geographic indications and 26 single estate—Pago—wines). Spain also leads in the amount of ecological vineyard surface (113 m has), producing more than 400 m tones of ecological grapes for fermentation. In addition, more than 150 varieties of grapes are recognized in the country.
In economic terms, the Spanish wine sector comprises 4093 firms, which produce 1% of national GDP. In line with the general European trait of being a fragmented sector, nearly 30% of the wineries have just one or two employees and in a further 30% of the firms the owner is the only worker: Just 15% have more than 10 employees and only one firm has more than 500 employees (Spanish observatory of wine markets, online data). Consequently, the business structure is highly atomized and characterized by the existence of a wide range of wineries and marks. Small wineries (that usually have management and commercialization problems) devoted to wine production in bulk coexist with large businesses concerned about the diversification of their supply (they produce wines in many categories). The latter manage large quantities of wine in the world market, and some are listed on the stock exchange.
The distribution of wineries in the Spanish regions is presented in Table 1.
The Spanish wine sector boasts 540 cooperative wineries, with 213,427 members overall, employing 8000 individuals and reporting a turnover of more than 1.3 million euros [36]. An outstanding trait is that it is characterized by a high level of vertical integration through productive activity [37]. The cooperative is a business model where the vine growers also produce and market the wine [38]. Nevertheless, in this subsector, two types of cooperatives coexist [39]: a small, strong group of large dynamic businesses that know how to adapt themselves to market tendencies, and a numerous group of little cooperatives, more traditional and less flexible, that entrust marketing issues to third parties. This second group is characterized by its high atomization, reduced number of workers and low size of business, undergoing great difficulties to compete in the marketing phase. Nevertheless, despite these limitations, cooperatives are a significant resource for the numerous and small-sized vine growers, offering them transformation of grapes and wine commercialization. According to Cooperativas Agroalimentarias (online data), the organization that represents the Spanish agrarian cooperative movement, at the beginning of the 21st Century, the cooperative wineries produced more than 60% of the total amount of wine in Spain.
Wine cooperatives account for 21% of total Spanish cooperatives and 7% of total turnover [40]. The case of Castilla–La Mancha is outstanding; the autonomous community is responsible for half the total Spanish wine production (see Table 1). More than 200 cooperative wineries produce 70% of total amount of wine produced in the region. This means that cooperative wineries in Castilla–La Mancha are responsible for more than 35% of national wine production and nearly 5% of world wine production (Cooperativas Agroalimentarias, online data).
In Spain, the economic crisis and the disappearance of European Community aid for wine distillation, under the 2008 new common organization of the market (COM), gave rise to an exceptional opening to international markets, with subsequent consequences for the sector and company financial performance [41]. This broadening of the commercial base towards foreign markets has undoubtedly had a direct impact on the environment, especially in terms of the carbon footprint and energy intensity footprint (essentially due to the increase in kilometers covered per liter of wine exported), as well as the water footprint, as a result of the intensification of production to achieve greater yields and lower unit costs.
Another driver of this increased production and the need to search for new international markets is found in the restructuring and conversion measures provided for in the previously mentioned COM, which has favored the change to espalier, implementation of irrigation and the massive use of plant protection products to increase unit yield. Consequently, the environmental tension in the sector is evident and has triggered a surge in the anthropogenic impact, meaning the industry must take firm action to design an environmental strategy to fight climate change. The European Commission [42] reports that almost half the greenhouse gases emitted in the production and distribution of wine are generated in the bottling and packaging stage, being a little less than 40% greater than those produced during grape-growing.
In the current scenario of the imperative fight against climate change and the promotion of bio-economy and the circular economy, which poses a global challenge, wineries have begun to develop environmental strategies and innovations, given that, as mentioned, more sustainable production systems can also be more profitable.

2.2. Eco-Innovation in the Wine Sector

In this context of an expanding global wine market, wineries are watchful of the need to achieve productivity and efficiency of their businesses [43], while having to tackle environmental issues, such as energy and its rising price, use of chemicals, water scarcity and the adaptation to climate change [44,45]. Despite the wine industry traditionally having been seen as environmentally friendly [46,47], there currently exists a growing feeling of this being an unresolved question [48].
The sector feel increasingly under pressure to enhance their environmental management systems for both individual and institutional reasons [49]. Wine consumers are increasingly aware of the environmental impact of the products they purchase [50,51] and thus companies in the wine sector have begun to seek competitive advantages for their products through the use of environmental certification [49]. Stakeholder pressure drives the implementation of more eco-friendly management systems [44] that can result in environmental innovations [52,53].
One of the most influential types of innovations in recent years is environmental innovation, often called “eco-innovations” or “green innovations”, defined as “the production, assimilation or exploitation of a product, production process, service or management or business method that is novel to the organization (developing or adopting it) and which results, throughout its life cycle, in a reduction of environmental risk, pollution and other negative impacts of resources use (including energy use) compared to relevant alternatives” [54], being this, without any doubt, the strategy best able to make firms more environmentally sustainable businesses.
A large body of literature on the topic focuses on the determinants of eco-innovation, particularly the comparison of these environmental innovations with other types [55,56,57]. The determinants identified in the literature include supply factors (technology-push), demand factors (demand-pull) and regulatory factors (regulatory-push). Internal factors are also considered, such as a company’s resources and capacities or its organizational culture, among others. Most works analyze the adoption of environmental innovations across the entire industrial sector. Very few studies have focused on the development of eco-innovations in traditional sectors like the wine industry.
The endogenization of technological change (such as the case of eco-innovation) is generally thought to lead to possible win–win situations [58]. However, there is an open debate in the literature about the impact on companies of applying environmental innovations. Although they have positive effects in terms of trade and opening new markets, for some firms such benefits may not compensate for the impact of the costs of environmental regulations on profits [59] and the return on productivity of environmental patents may be substantially lower than that of non-environmental ones [60]. However, some authors suggest that environmental innovations play a key role in the overall dynamics of environmental and economic performance [44,61,62,63], while others underline a positive relationship between eco-innovations (in process, product and organization) and business performance [64]. Authors have also reported that eco-innovations are the most important mediator in the association between the strictness of environmental regulations and financial performance [65] and have positive effects on job creation [66,67].
Drivers of proactive environmental behavior vary in importance according to the stage of environmental transformation of the industry or firm, managerial attitudes, prevailing regulations and competitive forces [9]. Regarding their environmental and social responsibility profile, firms are classified as reactive, defensive, accommodative or proactive [6,68,69].
There is no previous study on environmental proactivity and eco-innovation in wine sector cooperatives. Nevertheless, previous studies on cooperatives’ behavior concerning innovation in different regions of Spain conclude that exporting cooperatives are more likely to innovate [70]. In the case of Castilla and León, the majority presence of microenterprises hinders innovation [70]. Several studies have demonstrated the capacity of cooperatives for planning and management of innovation [71] in the case of wine cooperatives in Castilla–La Mancha and Social Economy in Andalusia [72,73].

3. Cooperativism in the Wine Sector

Agricultural cooperatives have substantive socioeconomic importance in the European Union, as they administer 50% of agricultural inputs and their market share of the collection, processing and marketing of agricultural processes is over 60% (COGECA -General Committee for Agricultural Cooperation in the European Union, online data). Similar to other forms of cooperativism in the agri-food sector, cooperative wineries have played a key role in facilitating the access of small and medium sized farming enterprises to higher levels of the value chain and have traditionally contributed to the economic sustainability of rural areas and population settlement in such places [74].
The literature traditionally links the appearance of cooperatives to necessity [75] often describing a counter-cyclical behavior which has been evidenced in both the general cooperative sector [75,76,77] and in the specific case of worker-owned cooperatives [76,78,79,80] with their showing greater resilience and flexibility in periods of crisis [81]. The history of cooperativism features cases, such as that of the Danish dairy sector or the German credit sector, in which these types of entities were characterized by their high efficiency and competitiveness [82,83]. More specifically, authors like Charles Gide [84,85] considered cooperatives as a tool to increase the quality of wine while allowing farmers to gain part of the market, due to the advantages of scale obtained by bringing together the resources of many small producers, which would allow them to access new technologies and hire specialized workers (oenologists) [86]. Cooperatives also provided wine purchasers with economies of scale, thus avoiding negotiations with large numbers of producers and facilitating easier storage [87].
Although until before the Second World War there were very few cooperatives in the wine sector in Europe, by the end of the 20th century they were producing half of the wines in France, Italy and Spain [88]. The case of Spain is even more remarkable in the sense that at the beginning of the 20th century there were practically no cooperatives in the sector, but by the end of the century they were responsible for 70% of production [88]. The second half of the 20th century witnessed a great expansion of the cooperative model in the Spanish wine sector, with the number of such companies increasing from 193 in 1950 to 407 in 1957 [88]. A number of circumstances led to this phenomenon [82]: a sharp fall in wine prices, which pushed grape growers to join forces; a favorable market due to consumer preferences adapting to the production; and actions by the State that promoted the creation and expansion of cooperatives.
This last aspect is worthy of a special consideration. The literature has considered that state action can be essential for development of the cooperative sector [82,87,89,90,91] because it can resolve the sector’s problems of capitalization by means of subsidies and cheap loans [92,93]. In return, cooperatives serve to stabilize markets in periods of overproduction, stocking excess grapes or distilling them [88]. In addition, under certain political conditions, cooperatives have served as a way for the State to exercise social control [94,95] as an extension of its power. In this case, farmers were able to avoid rules by making a selective use of cooperatives. In this sense, the existence of a well-organized and united civil society, independent of the State, is a necessary condition for a viable cooperative movement [95], given that it is highly difficult for cooperative experiences imposed by the State and not reinterpreted by civil society to achieve consolidation [96,97].
State intervention has been decisive in European wine cooperative development since the 1950s. The system of incentives drove the fast growth in cooperatives specializing in the production of sizeable quantities of cheap table wine. These market niches were precisely those most affected by the drop in demand during the 1960s and 1970s, generating huge excesses and structural problems [88]. These structural problems have been navigated by cooperatives, with different levels of success, by means of innovating and incorporating technology that allows them to produce high quality wines, but without losing their character as bulk wines producers.
This is not a trivial matter, as it could have biased the wine cooperative sector towards a model of “false cooperation” limiting the construction of a true cooperative movement in some regions. In the productive aspect, it could favor less innovative behaviors. Historical conditions have shaped the development of the wine cooperative sector, making it heterogeneous and diverse. The presence of wine cooperatives before the Civil War (1936–1939) was notable only in Catalonia, Navarre and Valencia. After this period and more intensely during the 1950s and 1960s, the sector grew widely in Castilla–La Mancha, Aragón, Murcia and Extremadura, where the presence of large non-cooperative wineries was scarce. In contrast, the cooperative model was less widespread in Jerez (Andalusia), el Penedés (Catalonia) or La Rioja, where large capitalist firms were already established [98].
These historical conditions led the sector to evolve towards a less market-oriented model, focused on large-quantity production at attractive prices, led by managing boards with scant professional knowledge, where grape growers established marketing strategies. The result was that companies lacked their own commercial networks and depended on traders and exporters, leading to an oligopsony, where cooperatives had reduced market power. This was especially important for small wine cooperatives, which were forced to work with very narrow margins, making them extremely dependent on external financing. This complicated investment and innovation and adaptation to changes in the market [98].
Currently, cooperative wineries, especially in regions such as Castilla–La Mancha (home to the world’s largest expanse of vineyards), dominate the national and global market for must, marketing more than four million hectoliters per year. They still use a strategy based on high production to dispose of growing amounts of production and to be able to compete with low prices in global markets that have become increasingly competitive due to the progressive presence of competitors from new producing nations, one of the principal threats in the sector. However, in this international scenario, niche markets have opened up as a result of more experienced and informed consumers that demand environmentally friendly products, thus generating new opportunities in the sector.
The literature does not typically focus on the legal form of companies engaged in eco-innovations. Cooperative entrepreneurs, nonetheless, operate under different codes of values based on collective actions which can act as a driver of greater social responsibility resulting from the special relationships between the cooperative and its stakeholders. In theory, the collective action of such companies drives their social responsibility over time and acts in pursuit of community values [2,3] generating social capital through the relationships between cooperative and stakeholders [99,100]. This collective, participatory action nurtures the processes of social interaction, a source of strategic resources even for mature social economy enterprises [101] and leverages individual members of cooperatives as co-innovators to benefit from the multiplier effect [102].
In a scenario where stakeholders demand social responsibility, commitment and innovation, any company will be interested in implementing socially oriented innovative practices while also creating economic value. This is important since, although cooperatives are recognized to be socially responsible by nature, the findings in the literature as regards their strengths in innovation are inconclusive. While some authors suggest this is not a visible trait of such enterprises [16], others [21,22,23] find that cooperative companies and capitalist firms are equally competitive and do not differ in their management and investment capacities.
Nonetheless, other studies argue that the cooperative form of organization, an instrument for local development and a tool to empower small producers, presents weaknesses that stem from their particular decision-making processes, diffused ownership structure, complex access to favorable credit terms and the so-called “horizon problem”, resulting from a tendency to under-invest in long-lived assets [36]. This dual vision and the lack of conclusive findings in one sense or the other lend special significance to the present study in understanding the behavior of cooperatives in the sector under study.
Agricultural cooperativism is a key social and economic reality in wine-producing areas and has undergone substantive business development, showing great resilience in times of crisis. The significance of wine cooperatives supports the focus of our analysis, in which we seek to identify the diversity of environmental behaviors in which cooperatives in the wine sector engage and the variables that may explain such behaviors.

4. Aim and Hypotheses

Given the antecedents in the literature, we consider it necessary to explore the environmental behavior of firms in the wine sector and to investigate whether this behavior is affected by their legal form (cooperatives vs. non cooperatives). Moreover, with the goal of providing specific evidence on social economy firms, we analyze the different patterns of environmental proactivity in such companies, in order to determine whether the motivations for initiating environmental sustainability strategies differ across the groups of cooperatives identified for the study and to see whether results in terms of eco-innovation (products and processes) are generated and whether financial and market performances are different.
Cooperatives are governed by socially responsible codes of values that lead them to take account of stakeholders’ demands [15,16]. In consequence, they present higher environmental proactivity than firms with other legal forms. Based on these arguments, we propose our first hypothesis on the existence of differences in environmental proactivity between cooperative and non-cooperative firms:
Hypothesis 1 (H1).
Cooperative firms present differences in environmental proactivity with respect to non-cooperative firms in the Spanish wine sector.
Despite proposing a hypothesis to compare cooperatives with the rest of firms, the lack of previous conclusive findings prompts us to propose hypotheses to be explored in our sample of cooperatives. These hypotheses are presented as follows:
Hypothesis 2 (H2).
Different environmental behaviors can be identified in cooperatives in the Spanish wine sector.
Based on identifying the patterns of environmental proactivity, the other hypotheses are proposed:
Hypothesis 3 (H3).
The environmental proactivity behaviors of cooperatives in the Spanish wine sector present differences in motivations for implementing eco-innovations.
Hypothesis 4 (H4).
The environmental proactivity behaviors of cooperatives in the Spanish wine sector present differences in eco-innovative results as regards products and processes.
Hypothesis 5 (H5).
The environmental proactivity behaviors of cooperatives in the Spanish wine sector present differences in the assessment of financial and market performance.
This last hypothesis can be divided into two sub-hypotheses, as we have used a subjective measure to assess economic and market performance, aiming to measure desirability and satisfaction. The first of the measures, as will be explained in the corresponding section, assessed the importance attributed to different indicators and the second the level of satisfaction.
Hypothesis 5.1 (H5.1).
The environmental proactivity behaviors of cooperatives in the Spanish wine sector present differences in the importance attributed to indicators of financial performance.
Hypothesis 5.2 (H5.2).
The environmental proactivity behaviors of cooperatives in the Spanish wine sector present differences in satisfaction with the indicators of financial performance.

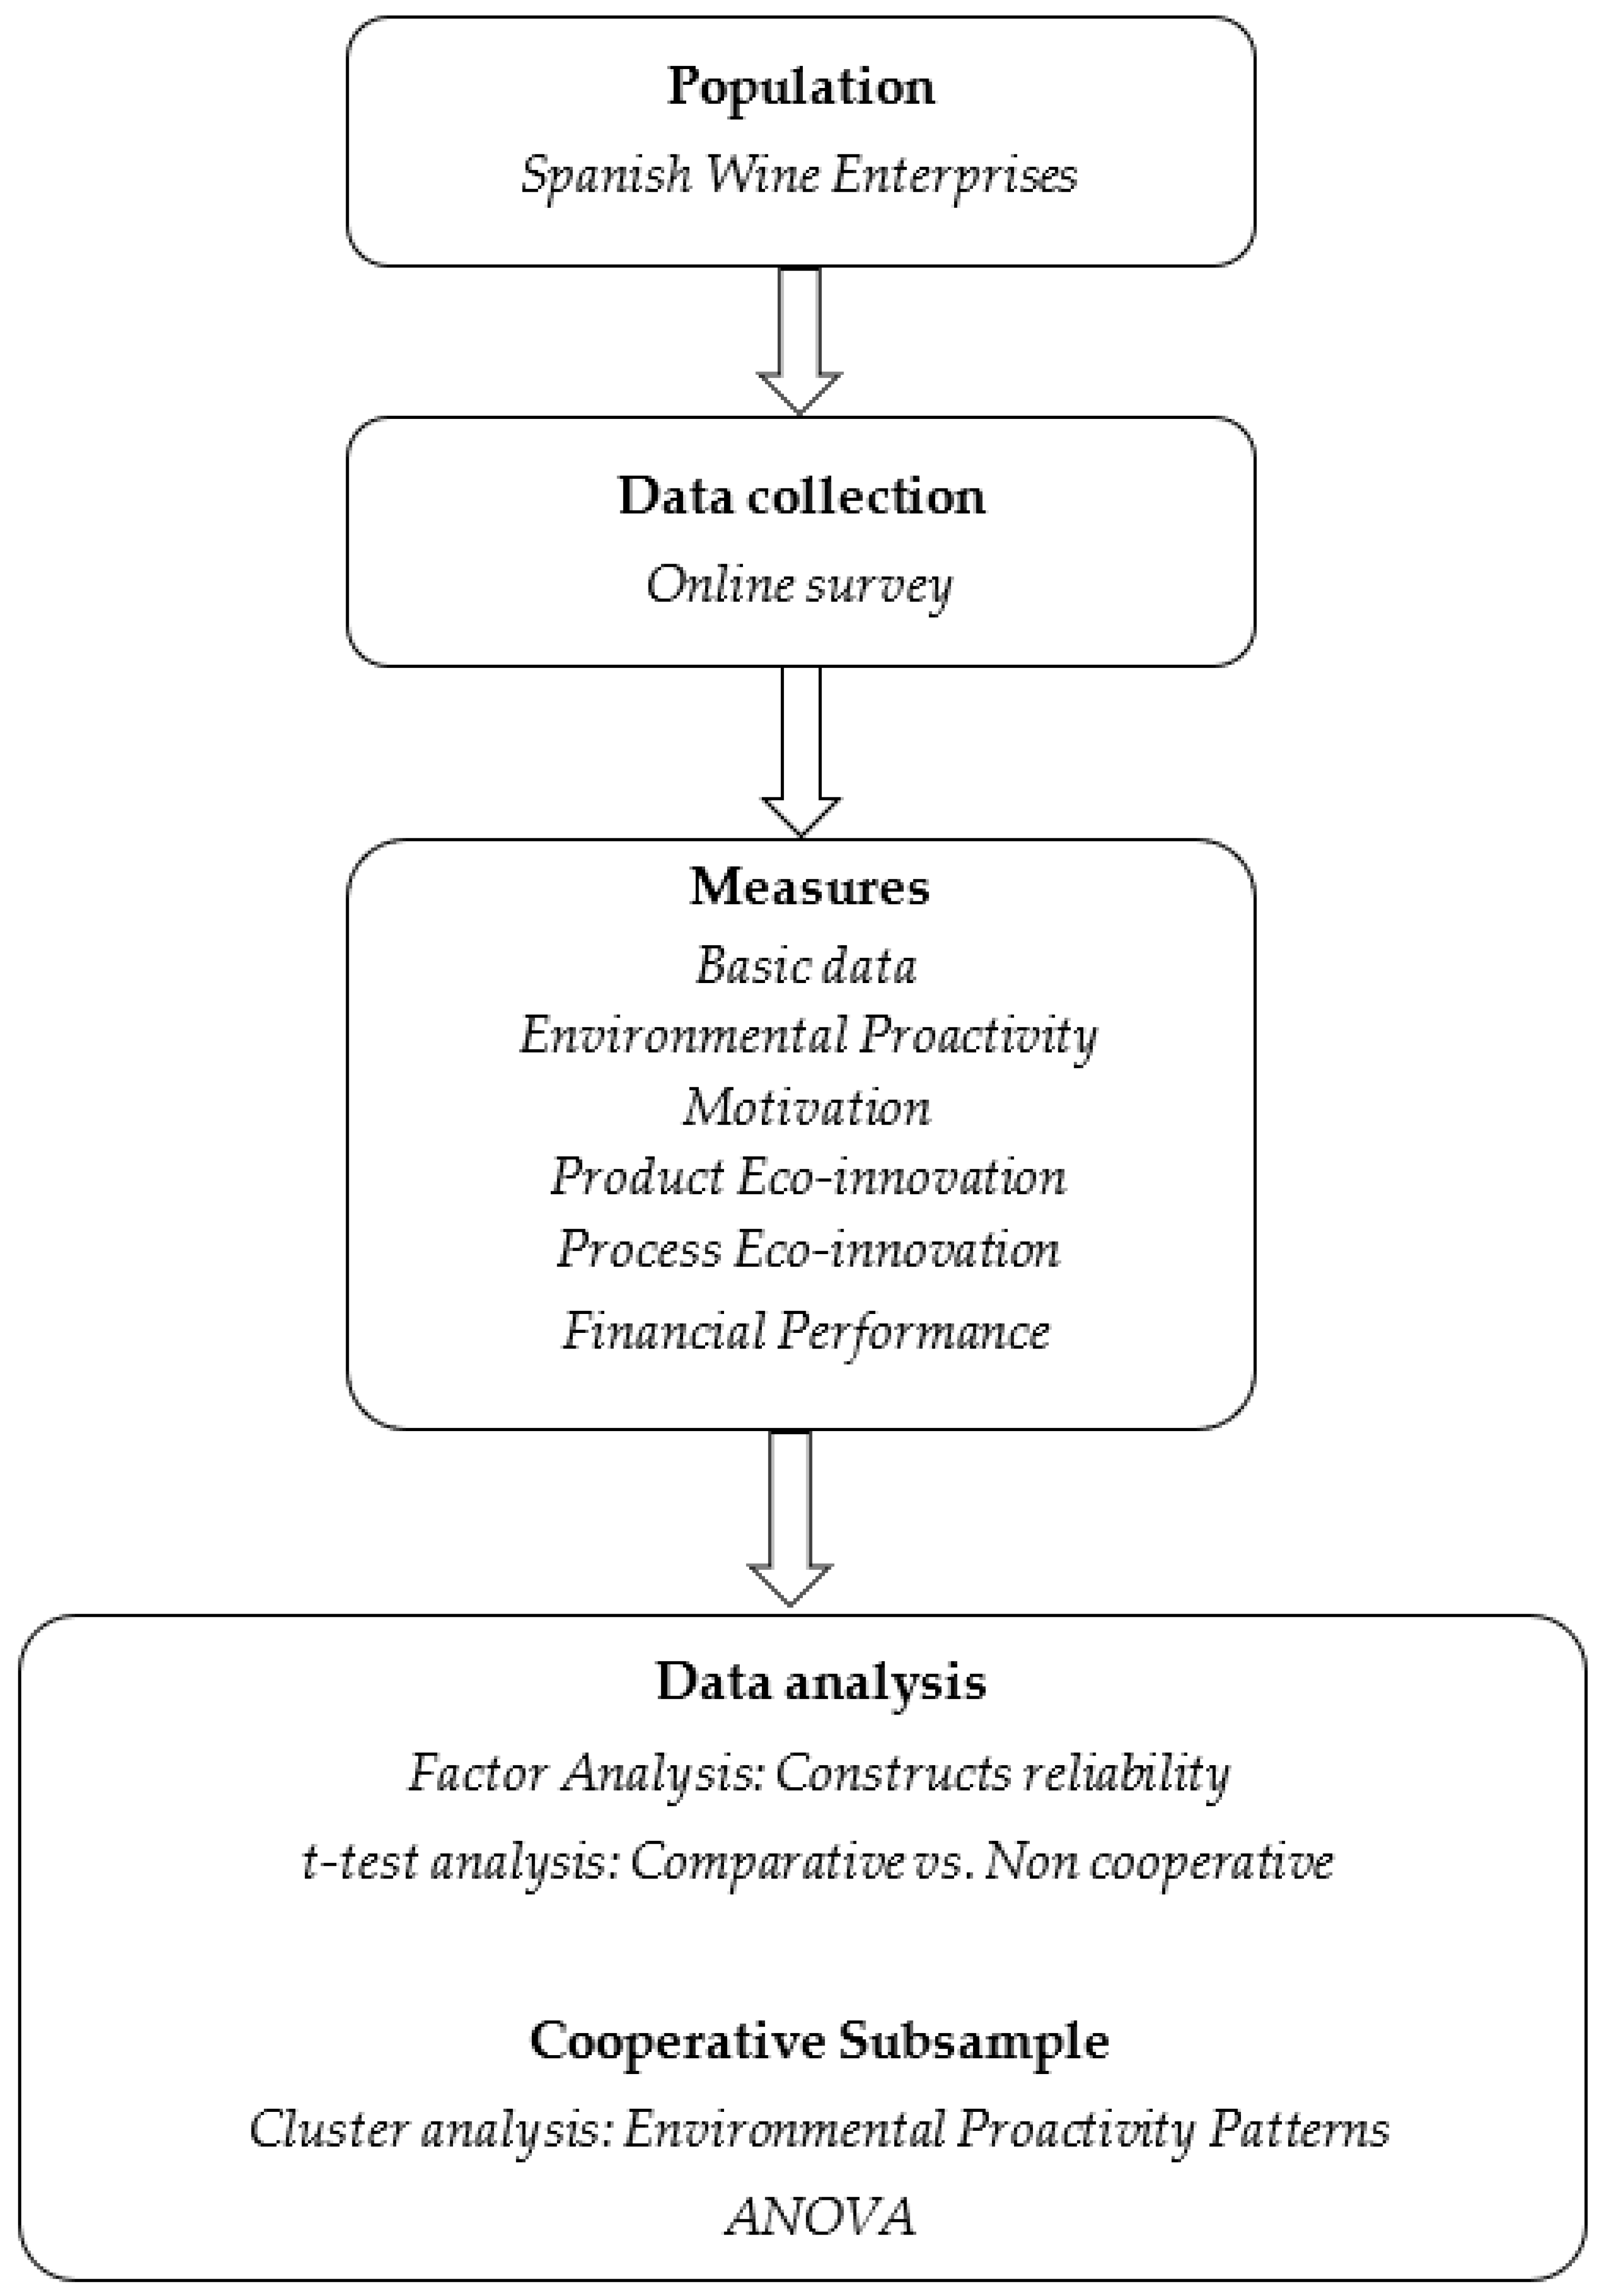
5. Materials and Methods

5.1. Sample Selection and Data Collection

The proposed hypotheses were tested in a sample of companies from the Spanish wine sector, for which we identified the study population and determined the sample size. Sampling of the total wine sector was used, and we made a first approach to Spanish wineries participating at FENAVIN, the Spanish wine fair held in Ciudad Real (Spain) in 2017 (1946 exhibiting wineries at the 2017 edition).
Data were gathered by means of an online questionnaire aimed at the sample selected, with 251 valid responses being received. This represents a 13% response rate and a sampling error of 6% for a confidence interval of 95%. Of the 251 companies that returned the questionnaire, 51 were cooperatives, the data from which were used to conduct the second part of this study.
The unit of analysis was the company, and hence the questionnaire was sent to the company owners and the winery managers, which, in a large proportion of the cases, was the same person. The respondents were advised that only one questionnaire per company would be included and in the cases where ownership and management did not coincide, they would be responsible for selecting who completed the survey. Table 2 shows the technical data sheet for the fieldwork.

5.2. Measures

The questionnaire was designed to account for collecting data on the object of the study, namely, environmental proactivity, motivations for implementing eco-innovation strategies, assessment of results of eco-innovation in products and processes and financial and market performance.
The study variables are shown in Table 3, all of which were rated on a five-point Likert-type scale. For the variables related to environmental behavior, motivations and eco-innovation, the respondents were asked to indicate their level of agreement with the statements from “strongly disagree” to “strongly agree”. In the case of environmental proactivity, we opted for the scale validated by Aragón Correa [24] and used in multiple studies by the author himself [25,26,103,104] and by other researchers [105,106].
To measure the performance variables, we chose another validated instrument, namely, the Subjective Performance Scale [107]. There was initially great debate in the literature about the use of subjective variables to evaluate an objective measure such as that of business performance, but we can consider this debate closed. The authors that championed the capacity of perception variables of performance as proxy variable of performance measurement included Cooper and Kleinschmidt [108], Dess and Robinson [109] and Gupta and Govindarajan [107]. The last of these developed the subjective performance scale that we used as a measurement tool. The scale comprises seven indicators of financial and market performance, which respondents are asked to assess in two senses: the importance of the item as a performance indicator and their level of satisfaction with each one, with responses ranging from “of little importance” to “extremely important” and from “not at all satisfactory” to “outstanding”, respectively.

5.3. Data Treatment

Figure 1 shows the steps of the statistical analysis of the data.
First of all, using the whole sample of wineries, we created and validated the constructs as measuring instruments for our study. We performed a principal component factor analysis with a varimax rotation, by groups of variables (environmental proactivity, motivation, product eco-innovation, process eco-innovation and financial performance). This analysis let us summarize the information contained in the questionnaire and eliminate the redundancy of variables, keeping a high percentage of variance explained. Afterwards, with that information, we created scales for each group of variables and test their validity. We subsequently conducted a reliability analysis, using Cronbach’s Alpha.
Secondly, our sample of 251 wineries was divided into two groups: cooperatives and non-cooperative firms. A t-test analysis was carried out aiming at comparing both type of firms regarding our measures.
Third, we focused our analysis on the subsample of cooperatives that participated in the study (n = 51). Two statistical analysis were carried out with these firms. To generate the patterns of environmental proactivity, we used the two-stage cluster technique (hierarchical analysis followed by k-mean analysis), whereby the former provided us with the information required to determine the optimal number of groups to be identified. The environmental proactivity scales developed in the first step of our empirical analysis were incorporated into the conglomerate analysis to identify the patterns mentioned.
Finally, a variance analysis—ANOVA—was used to see whether each of the detected profiles presented significant differences in the variables related to the motivations for implementing environmental strategies, eco/innovation and performance.

6. Results and Discussion

We present the results of our empirical analysis in three subsections: construct generation and validation, comparing cooperatives and non-cooperative wineries and identification of environmental patterns among cooperative wineries.

6.1. Construct Generation and Validation

Factor analysis by group of variables let us generate the constructs. These elements were used in later analysis. The first factor analysis was used to create the environmental proactivity scales and test their reliability. Four factors that explained 77% of the total variance were obtained:
(1)
The first factor was called “Factor 1.1. Internal operations and selection of agents in the value chain” because the variables with the highest loadings were all those related to decisions and actions undertaken in the scope of operations along the value chain. It contains items referring to the selection of suppliers and distributors and also includes prior assessments of possible environmental impacts across all production stages, product design, processes and selection of technologies;
(2)
The second factor was named “Factor 1.2. Environmental commitment of strategy”, which encompassed variables referring to the consideration of environmental issues across all the firm’s activities, prioritizing environmental questions as a prevailing value. In addition, the factor includes variables indicating that the company designs specific environment-related policies, strategies and aims, which they communicate to the market and measure results and undertake continuous checks;
(3)
The third factor, “Factor 1.3. Structure, participation and environmental training” brings together the organizational design variables, the formalization of management positions in the company structure to take responsibility for environmental questions and the participation of these managers in the company’s overall strategy. It also includes information on encouraging the participation of workers and improving their environmental training;
(4)
The fourth factor, given the name of “Factor 1.4. Collaboration with external interest groups”, includes two variables: sponsorship of environmental events and collaboration with environmental associations.
Table 4 shows the results of the factor analysis on the environmental proactivity variables.
We opted to carry out the same procedure to condense the information on the remaining items of the questionnaire, in order to have information on the scales of motivation, product eco-innovation, process eco-innovation and performance. Table 4, Table 5, Table 6 and Table 7 present the results of the factor analysis and Table 8 presents information on the scales, Cronbach’s Alpha and the statistics of elements and scales.
Table 5 shows the factor analyses on the firms’ motivations to develop sustainable behavior. “Strategic motivation” gathers the items related to expand the market and product range, as well as to improve profitability and competitiveness adapting to demand conditions. This factor explains 85% of variance. The second motivational element refers to “compliance with norms and incentives” and it is measured through the firms’ intention to adapt their activities to legal framework and to take advantage of public incentives developed to promote an environmentally friendly behavior of firms. This factor explains 92% of the variance of its components. The third factor “response to social pressure” explains 88% of the firms’ motivations to develop a sustainable behavior due to pressures from industry associations and other stakeholders.
A similar analysis was carried out for each type of eco-innovations. A single factor emerged for product eco-innovation as well as for process eco-innovation, explaining more than 96% of variance—see Table 6.
Additionally, the same procedure was used with the variables related to financial performance. Firms were asked to evaluate the importance of sales, growth and market share, as well as their degree of satisfaction with those results. Performance variables were grouped in two factors reflecting the “importance” the wineries give to their performance and their “satisfaction” with their performance. These two factors explain 81% of variance (Table 7).
Using the information generated in the factor analysis of environmental proactivity, motivations, product eco-innovation, process eco-innovation and performance we created the scales, incorporating the variables that loaded on each of the factors and tested their reliability. The Cronbach’s alpha obtained for all the scales was above 0.8. Table 8 shows the information on the scales created, Cronbach’s alpha and the statistics and constituent elements of the scales.

6.2. Comparison of Environmental Proactivity on Cooperative Firms versus Non Cooperative Firms

Once we had created the scales to measure the variables to be used in the analysis, following the methodology proposed to test Hypothesis 1 on the existence of differences in environmental proactivity between cooperatives and non-cooperative firms, we compared the mean scores on the environmental proactivity scales. To this end, we performed a difference of means t-test for independent samples, comparing the sample of cooperatives (n = 51) with the sample of non-cooperative firms (n = 200).
Although the hypothesis was designed exclusively to test the differences in environmental proactivity, we decided to also include the analysis of environmental behavior motivations, the variables of eco-innovation strategy—product and process—and the two performance scales, all in order to explore other differences that could help us explain the results.
The difference of means t-test for independent samples allows us to analyze whether there exist differences in the means and whether these are significant. Table 9 presents the statistics on the two groups and Table 10, the t-test results.
Table 9 presents the means on the scales for each of the groups and identifies the values that are different. More specifically, concerning environmental proactivity, cooperative firms have higher means on the level of environmental commitment and on the scales of “structure, participation and education”. Nevertheless, they present lower means in internal operations and external collaboration. Despite these differences, only two are significant (Table 10).
The factor “structure, participation and education” presents positive mean differences in favor of cooperatives and these are significant. This result leads us to affirm that in cooperative firms in the Spanish wine sector, management is more engaged with environmental matters, as they formalize positions dedicated to these issues. They also present greater cohesion in the behaviors of workers participating in the decisions that make these firms more environmentally sustainable, which is consistent with the literature on Third Sector firms [17,18], and also with the Cooperative Principle of concern for community, according to which cooperatives are community-minded and contribute to the sustainable development of their communities by sourcing and investing locally. In addition, cooperatives are more given to educating their workers in order to improve their environmental performance. This characterization leads us to describe them as having greater environmental proactivity than non-cooperative firms. This result is coherent with the character of Third Sector firms and with cooperative principles [14,15,16,17], specifically with the principle of education, training and information, according to which cooperatives provide education, training and information for their members, elected representatives, managers and employees so that they can contribute effectively to the development of their firms.
The other significant difference detected is that cooperatives have a lower mean score in the internal process factor compared to other firms. This could hinder environmental proactivity, as the introduction of environmental improvements needs process design, allowing the designed strategies and interventions to be started. It would were desirable to find a good fit between the intention, the formulation and the design of environmental strategies with the organizational demands for their implantation. These identified organizational weaknesses are coherent with the trait evidenced in the literature [98] concerning the low professionalization of management boards, which could be more intense in smaller size cooperatives.
The previous results and the fact that there are no significant differences in the factors of environmental commitment and collaboration with external groups in environmental matters, we cannot corroborate our hypothesis. We proposed that cooperative firms would present higher environmental proactivity compared to other non-cooperative firms in the Spanish wine sector. Therefore, we reject our first hypothesis.
Given that we have included other scales in our study with an exploratory purpose, additional evidence can be provided. In Table 9, it can be seen that cooperatives present lower means in three scales of motivation, but none of these differences is significant (Table 10). The same occurs with product and process eco-innovations.
Concerning the assessment of economic performance, an interesting result is the significant means identified in one of the scales used. The evaluation of results assessed, on one hand, the importance of the indicator for management, and, on the other hand, the degree of satisfaction with the level achieved. These two assessments were grouped into the factors of importance and satisfaction. The first of the factors—importance—can be seen as a proxy of the values that thrive when decisions must be taken and, therefore, could guide the strategies introduced in the organization. The fact that cooperatives present significant lower values than non-cooperative firms in the importance of economic performance indicators brings to light the orientation of their activities towards other types of goals, mainly social, as reported in the literature, being once again the cooperative principle of concern for community. Nevertheless, this difference in the perspective of what is important for the organization is not reflected in the level of satisfaction with each indicator. There are no significant differences in the factor “satisfaction” between the two groups.

6.3. Environmental Proactivity Patterns on Cooperative Firms

After the comparative analysis conducted on the entire sample of firms and due to our not having identified differences in all the factors, we proceeded to work with the subsample of cooperative firms (51), in order to study their diversity in environmental behaviors. Thus, we conducted a cluster analysis in this subsample.

6.3.1. Patterns Environmental Proactivity

The cluster analysis identified three groups of cooperatives, according to their environmental proactivity. Of these three groups, one includes the cooperatives with strong environmental proactivity and the other those with weak environmental proactivity. The third consists of just two cooperatives whose main characteristic is that they collaborate with strongly environmentally focused external groups. This identification of groups is coherent then with the literature indicating that two types of cooperatives coexist [39]: large, dynamic and adaptive businesses and small cooperatives, which are more traditional, less flexible and highly atomized, with many of them having great difficulties in investment, innovation and adaptation to market changes [70,98]. Table 11 shows the results of the cluster analysis.
The first cluster of cooperatives comprises the companies with the highest environmental proactivity. Their strong commitment to environmental issues guided the design of their strategies. In addition, this conviction is reflected in how they adapt the organizational structure to help correctly implement and control the company strategy, which is, in turn, clearly led by respect for environmentally friendly values. The organizational structure formalizes management positions for specialists in the environment, managers that do not work in self-contained departments, but participate in the company’s overall strategy decisions. They feel this way of doing things provides the company with a character that differentiates them in the market and is used in their marketing campaigns. They are, in short, cooperatives with proactive behavior in questions of the environment.
The second cluster is formed by just two cooperatives whose most significant characteristic is their high score on collaboration with interest groups focused on environmental causes, who pursue responsible behaviors from companies. These two companies express their environmental proactivity through their response to the calls for collaboration from ecologist or environmentalist associations; they could be described as activist behaviors.
The environmental behavior of the cooperatives in the third cluster resembles a functional strategy. Environmental values do not permeate their business policy or determine the formulation of their business strategy, but they do take the possible impacts on the environment of their actions into account within their organization and act to avoid them. In addition, they require the external agents that effect transactions in their production process to be environmentally responsible. Such demands are directed towards both their suppliers and distributors. This group of cooperatives could be said to present a preventive environmental behavior.

6.3.2. Comparison of Motivation, Eco-Innovation and Performance in Different Environmental Proactivity Patterns

To determine whether there are significant differences in motivations, eco-innovations and performance between cooperatives with different patterns of environmental proactivity, we carried out an ANOVA, in which we took each of the identified behaviors as the dependent variable.
The scales to be compared across the patterns of environmental proactivity were operationalized by means of the factor scores obtained from the corresponding analyses (principal component factor analysis and varimax rotation) by groups of variables: motivation, eco-innovation and performance (Table 6).
Table 12 shows the results of the variance analysis taking the scales validated in the previous stage as variables.
The results of the ANOVA reveal significant differences in the motivation scale between the environmental behaviors identified in the sample of cooperatives. Cluster 1 shows higher values than Cluster 3 on strategic motivation, higher values than both Clusters 2 and 3 on motivation to comply with regulations, and lower values than Cluster 2 on the last of the motivation factors, that is, the response to pressure from external interest groups.
The values on the product eco-innovation and process eco-innovation scales show no significant differences between the three groups of cooperatives. As regards performance, it is worth noting the cooperatives in Cluster 2 attribute greater importance to the performance indicators compared to Cluster 3, while there are no significant differences with Cluster 1 on this indicator. No significant differences were found on satisfaction with financial and market performance. The findings allow us to partially accept the hypotheses proposed.
The identification of the environmental proactivity behaviors leads us to confirm Hypothesis H2 on the existence of different behaviors between cooperatives in the wine sector according to their environmental proactivity. This result is coherent with the literature suggesting that drivers of proactive environmental behavior vary in importance with the stage of environmental transformation of the industry or firm, managerial attitudes, prevailing regulations and competitive forces [9].
The results of the variance analysis allows us to accept Hypothesis H3 on the existence of differences in the motivations that determine environmental proactivity behaviors. However, they also lead us to reject Hypothesis H4 on the differences on eco-innovative performance across the cooperatives in the wine sector and Hypothesis H5.2 regarding differences in satisfaction with financial performance between the different environmental proactivity behaviors in wine sector cooperatives. The comparison resulting from the variance analysis of the importance attributed to performance allows us to accept Hypothesis H5.1 on the differences in assessment of performance across the different environmental proactivity behaviors.
Two of the behaviors identified in our analysis of wine cooperatives, which are the most commonly exhibited, coincide with previous studies: proactive before preventive. Companies who exhibit the former behavior are pioneering in the introduction of changes to reduce the negative impact of firms in the environment, beyond the demands of regulations, using environmental proactivity with strategic goals. Firms showing the latter behavior attempt to comply with the sector’s requirements in order to prevent negative consequences [44,52,53]. The behavior we have named activist pursues satisfying the requirements of associations and social groups whose main interest is the environmental protection. Hence, this group of cooperatives looks to legitimize the design of their strategies, satisfying the demands of these institutional actors [1]. In addition, they attach less importance to economic and market indicators, which suggest they have a strong social orientation, which goes beyond their economic orientation, as reported in the literature [14,15,16,17,18].

7. Conclusions

Cooperatives are generally considered to be entities that differ from other legal forms of companies but are assumed to function in a largely homogenous manner. Previous studies focused on the characterization of cooperatives tend to compare cooperatives with other legal forms of firms, in order to determine the traits that differentiate them. Our analysis of environmental proactivity suggests that, in the Spanish wine sector, there are no significant differences in traits between cooperatives and non-cooperative firms.
Considering cooperatives as a homogeneous group with similar values, goals, level of resources and capabilities ignores their diversity. Their cooperative character is assumed to imply they are socially responsible by nature; our analysis, however, underlines the diversity within cooperatives in the wine sector as regards their environmental proactivity, revealing the existence of proactive, preventive and activist patterns of behavior. Nearly half the cooperatives presented a strong commitment to environmental issues that guided the design of their strategies and the adaptation of their organizational structure, while another similar group of companies showed that environmental values do not permeate their business policy or determine the formulation of their business strategy, but they adopt a preventive environmental behavior, taking into account the possible impacts of their actions on the environment.
These patterns also show differences in the motivations for their environmental behaviors and their assessment of financial performance. The previous group also showed higher values on strategic motivation and motivation to comply with regulations and only a minority of the survey respondents were motivated by the response to pressure from external interest groups.
The primary contribution of this study, albeit in an exploratory manner, is to empirically evidence the principal characteristics of environmental behavior in cooperative enterprises in the Spanish wine sector. It thus serves as a starting point for future confirmatory studies on this specific topic and on the broader field of eco-innovation in agri-food cooperatives, companies with a more than substantial presence in the European agri-food industry.
The limitations of this study are related to its exploratory nature. In addition, as it is not a longitudinal study, it does not capture the evolution of the factors analyzed over time. In spite of these limitations, some recommendations can be made. The first is directed to researchers, alerting them to the loss of information when research in Social Economy is constructed under the deterministic assumption of cooperatives being homogeneous firms. The other recommendation is for policy makers in the sense of the importance of considering the different traits of firms (especially when they design specific programs for cooperatives) in order to program more efficient measures.

Author Contributions

Conceptualization, F.C. and I.C.; methodology: F.C. and Á.G.-M.; M.V.-V. also contributed with some technical advice; writing and original draft preparation, I.C.; writing—review and editing: all authors. All authors have read and agreed to the published version of the manuscript.

Funding

Authors would like to acknowledge support from the Spanish Ministry of Science, Innovation and Universities, Research Grant RTI2018-101867-B-I00.

Conflicts of Interest

The authors declare no conflict of interest.

References

  1. De Steur, H.; Temmerman, H.; Gellynck, X.; Canavari, M. Drivers, adoption and evaluation of sustainability practices in Italian wine SMEs. Bus. Strategy Environ. 2020, 29, 744–762. [Google Scholar] [CrossRef]
  2. Gilinsky, A., Jr.; Newton, S.K.; Vega, R.F. Sustainability in the global wine industry: Concepts and cases. Agric. Agric. Sci. Procedia 2016, 8, 37–49. [Google Scholar] [CrossRef] [Green Version]
  3. Santini, C.; Cavicchi, A.; Casini, L. Sustainability in the wine industry: Key questions and research trends. Agric. Food Econ. 2013, 1, 1–9. [Google Scholar] [CrossRef] [Green Version]
  4. Broccardo, L.; Zicari, A. Sustainability as a driver for value creation: A business model analysis of small and medium enterprises in the Italian wine sector. J. Clean. Prod. 2020, 259, 120852. [Google Scholar] [CrossRef]
  5. Geissdoerfer, M.; Vladimirova, D.; Evans, S. Sustainable business model innovation: A review. J. Clean. Prod. 2018, 198, 401–416. [Google Scholar] [CrossRef]
  6. Grimstad, S. Developing a framework for examining business-driven sustainability initiatives with relevance to wine tourism clusters. Int. J. Wine Bus. Res. 2011, 23, 62–82. [Google Scholar] [CrossRef]
  7. El Bilali, H. Research on agro-food sustainability transitions: A systematic review of research themes and an analysis of research gaps. J. Clean. Prod. 2019, 221, 353–364. [Google Scholar] [CrossRef]
  8. Ferrer-Lorenzo, J.R.; Maza-Rubio, M.T.; Abella-Garces, S. Business model and performance in the Spanish wine industry. J. Wine Res. 2019, 30, 31–47. [Google Scholar] [CrossRef]
  9. Marshall, R.S.; Cordano, M.; Silverman, M. Exploring Individual and Institutional Drivers of Proactive Environmentalism in the Wine Industry. Bus. Strategy Environ. 2005, 14, 92–109. [Google Scholar] [CrossRef]
  10. Bisson, L.; Waterhouse, A.L.; Ebeler, S.E.; Walker, A.; Lapsley, J.T. The present and future of the international wine industry. Nature 2002, 418, 696–699. [Google Scholar] [CrossRef]
  11. Fiore, M.; Silvestri, R.; Conto, F.; Pellegrini, G. Understanding the relationship between green approach and marketing innovations tools in the wine sector. J. Clean. Prod. 2017, 142, 4085–4091. [Google Scholar] [CrossRef]
  12. Russell, A.; Battaglene, T. Trends in Environmental Assurance in Key Australian Wine Export Markets; Winemakers’ Federation of Australia, National Wine Centre: Adelaide, Australia, 2007. [Google Scholar]
  13. Flores, S.S. What is sustainability in the wine world? A cross-country analysis of wine sustainability frameworks. J. Clean. Prod. 2018, 172, 2301–2312. [Google Scholar] [CrossRef]
  14. Pel, B.; Bauler, T. A Transition studies perspective on the social economy; Exploring institutionalization and capture in Flemish ‘insertion’ practices. Ann. Public Coop. Econ. 2017, 88, 279–298. [Google Scholar] [CrossRef]
  15. Castilla-Polo, F.; Gallardo-Vázquez, D.; Sánchez-Hernández, M.I.; Ruiz-Rodríguez, M.C. Cooperatives as Responsible and Innovative Entrepreneurial Ecosystems in Smart Territories: The Olive Oil Industry in the South of Spain. In Handbook of Research on Entrepreneurial Development and Innovation within Smart Cities; Carvalho, L., Ed.; IGI Global: Hershey, PA, USA, 2017; pp. 459–491. [Google Scholar]
  16. Gonzales, V.; Phillips, R. (Eds.) Cooperatives and Community Development; Routledge: London, UK; New York, NY, USA, 2013. [Google Scholar]
  17. Wanyama, F.O. Cooperatives and the Sustainable Development Goals A Contribution to the Post-2015 Development Debate; International Labour Organisation Enterprises Department Cooperatives Unit (I.L.O.): Geneva, Switzeland, 2014; ISBN 978-92-2-128731-5. [Google Scholar]
  18. Mozas, A. Contribución de las Cooperativas Agrarias al Cumplimiento de os Objetivos de Desarrollo Sostenible. Especial Referencia al Sector Oleícola; CIRIEC-España: Valencia, Spain, 2019. [Google Scholar]
  19. Giannakas, K.; Fulton, M. Process innovation activity in a mixed oligopoly: The role of cooperatives. Am. J. Agric. Econ. 2005, 87, 406–422. [Google Scholar] [CrossRef]
  20. García-Álvarez Coque, J.M.; Pérez Ledo, P.; Santarremigia Casañ, E. Perfiles innovadores en la agricultura valenciana. Cuadernos de Estudios Agroalimentarios (CEA) 2014, 6, 153–169. [Google Scholar]
  21. Fearne, A.; García Álvarez-Coque, J.M.; Usach, M.; López-García, T. Innovative firms and the urban/rural divide: The case of agro-food system. Manag. Decis. 2013, 51, 1293–1310. [Google Scholar] [CrossRef]
  22. Basterretxea, I.; Martinez, R. Impact of management and innovation capabilities on performance: Are cooperatives different? Ann. Public Coop. Econ. 2012, 83, 357–381. [Google Scholar] [CrossRef]
  23. Colombo, L.A.; Pansera, M.; Owen, R. The discourse of eco-innovation in the European Union: An analysis of the Eco-Innovation Action Plan and Horizon 2020. J. Clean. Prod. 2019, 214, 653–665. [Google Scholar] [CrossRef] [Green Version]
  24. Aragón-Correa, J.A. Strategic proactivity and firm approach to the natural environmental. Acad. Manag. J. 1998, 41, 556–567. [Google Scholar] [CrossRef]
  25. Aragón-Correa, J.A.; Sharma, S. A contingent resource-based view of proactive corporate environmental strategy. Acad. Manag. Rev. 2003, 28, 71–88. [Google Scholar] [CrossRef] [Green Version]
  26. Aragón-Correa, J.A.; Hurtado-Torres, N.; Sharma, S.; García-Morales, V.J. Environmental strategy and performance in small firms: A resource-based perspective. J. Environ. Manag. 2008, 86, 88–103. [Google Scholar] [CrossRef] [PubMed]
  27. Ketchen, D.J.; Shook, C.L. The application of cluster analysis in strategic management research: An analysis and critique. Strateg. Manag. J. 1996, 17, 441–458. [Google Scholar] [CrossRef]
  28. Somogyi, S. Grape grower and winery relationships: A segmentation approach. Int. J. Wine Bus. Res. 2013, 25, 252–266. [Google Scholar] [CrossRef]
  29. Hamann, R.; Smith, J.; Tashman, P.; Marshall, R.S. Why Do SMEs Go Green? An Analysis of Wine Firms in South Africa. Bus. Soc. 2017, 56, 23–56. [Google Scholar] [CrossRef]
  30. Nesselhauf, L.; Fleuchaus, R. What about the environment? A choice-based conjoint study about wine from fungus-resistant grape varieties. Int. J. Wine Bus. Res. 2020, 32, 96–121. [Google Scholar] [CrossRef]
  31. Cashaldi, R.; Cholette, S.; Husain, M. A Country Level Analysis of Competitive Advantage in the Wine Industry, DEIAgra Working Paper. 2006. Available online: http://ideas.repec.org/p/bag/deiawp/6002.html (accessed on 26 May 2020).
  32. Harrington, R.J.; Ottenbacher, M.C. Contradictions of traditions and change in German winemaking: An exploratory study. Int. J. Wine Bus. Res. 2008, 20, 276–293. [Google Scholar] [CrossRef]
  33. Barbara, I. The evolving global wine market. Bus. Econ. 2014, 49, 46–58. [Google Scholar] [CrossRef]
  34. Viviani, J.L. Capital structure determinants: An empirical study of French companies in the wine industry. Int. J. Wine Bus. Res. 2008, 20, 171–194. [Google Scholar] [CrossRef] [Green Version]
  35. Medina Albadalejo, F.J.; Martínez-Carrión, J.M.; Ramón Muñoz, J.M. The world wine market and the competitiveness of the Southern Hemisphere countries. Am. Lat. Hist. Econ. 2014, 21, 1961–2010. [Google Scholar]
  36. COGECA. The European Agri-Food Cooperatives Monitor, 2019. CCC (19) 9923: 2. Available online: https://www.copa-cogeca.eu/Menu.aspx?lang=en (accessed on 10 January 2020).
  37. Briz, J. Competitividad y estrategias comerciales en el sector vínico español. Cuad. Agric. Pesca Aliment. 1999, 19, 23–32. [Google Scholar]
  38. Melián, A.; Millán, G. El cooperativismo vitivinícola en España. Un estudio exploratorio de la Denominación de Origen Alicante. REVESCO 2007, 93, 39–67. [Google Scholar]
  39. Juliá, J.F. La concentración en el cooperativismo agroalimentario. Cuad. Agric. Pesca Aliment. 1999, 6, 27–33. [Google Scholar]
  40. Rojas, J.L.; del Real, J.M. (Director) El cooperativismo agroalimentario de Castilla-La Mancha en cifras. El modelo de negocio que vertebra el medio rural; Fundación CooperActiva: Ciudad Real, Spain, 2017.
  41. Simón, K.; Castillo, J.S.; García, M.C. Economic performance and the crisis: Strategies adopted by the wineries of Castilla-La Mancha. Agribusiness 2014, 31, 107–131. [Google Scholar] [CrossRef]
  42. European Commission. EU Agricultural Outlook for Markets and Income 2019—2030; DG Agriculture and Rural Development, Analysis and Outlook Uni: Madrid, Spain, 2019. [Google Scholar] [CrossRef]
  43. Sellers-Rubio, R. Evaluating the economic performance of Spanish wineries. Int. J. Wine Bus. Res. 2010, 22, 73–84. [Google Scholar] [CrossRef]
  44. Atkin, T.; Gilinsky, A.; Newton, S.K. Environmental strategy: Does it lead to competitive advantage in the US wine industry? Int. J. Wine Bus. Res. 2012, 24, 115–133. [Google Scholar] [CrossRef]
  45. Guthey, G.T.; Whiteman, G. Social and ecological transitions: Winemaking in California. Emerg. Complex. Organ. 2009, 11, 37–48. [Google Scholar]
  46. Barber, N.; Taylor, C.; Strick, S. Wine consumers’ environmental knowledge and attitudes: Influence on willingness to purchase. Int. J. Wine Res. 2009, 1, 59–72. [Google Scholar] [CrossRef] [Green Version]
  47. Merli, R.; Preziosi, M.; Acampora, A. Sustainability experiences in the wine sector: Toward the development of an international indicators system. J. Clean. Prod. 2018, 172, 3791–3805. [Google Scholar] [CrossRef]
  48. Gabzdylova, B.; Raffensperger, J.F.; Castka, P. Sustainability in the New Zealand wine industry: Drivers, stakeholders and practices. J. Clean. Prod. 2009, 17, 992–998. [Google Scholar] [CrossRef]
  49. Dodds, R.; Graci, S.; Walker, L. What drives environmental sustainability in the New Zealand wine industry? An examination of driving factors and practices. Int. J. Wine Bus. Res. 2013, 25, 164–184. [Google Scholar] [CrossRef]
  50. Duarte Alonso, A. How “green” are small wineries? Western Australia’s case. Br. Food J. 2010, 112, 155–170. [Google Scholar] [CrossRef]
  51. Sinha, P.; Akoorie, M.E.M. Sustainable environmental practices in the New Zealand wine industry: Analysis of perceived institutional pressures and the role of export. J. Asia-Pac. Bus. 2010, 11, 50–74. [Google Scholar] [CrossRef]
  52. Berns, M.; Townend, A.; Khayat, Z.; Balagopal, B.; Reeves, M.; Hopkins, M.S.; Krushwitz, N. The Business of Sustainability: What It Means to Managers Now. MIT Sloan Manag. Rev. 2009, 51, 19–26. [Google Scholar]
  53. Carrillo-Hemosilla, J.; del Rio, P.; Könnöla, T. Diversity of eco-innovations: Reflections from selected case studies. J. Clean. Prod. 2010, 18, 1073–1083. [Google Scholar] [CrossRef]
  54. Kemp, R.; Pearson, P. Final Report MEI Project about Measuring Eco-Innovation; UM Merit: Maastricht, The Netherlands, 2007; Available online: https://www.oecd.org/env/consumption-innovation/43960830.pdf (accessed on 15 July 2019).
  55. Frondel, M.; Horbach, J.; Renning, K. End-of-pipe or cleaner production? An empirical comparison on environmental innovation decisions across OECD countries. Bus. Strategy Environ. 2007, 16, 571–584. [Google Scholar] [CrossRef] [Green Version]
  56. Cai, W.; Zhou, X. On the drivers of eco-innovation: Empirical evidence from China. J. Clean. Prod. 2014, 79, 239–248. [Google Scholar] [CrossRef]
  57. Horbach, J. Determinant of environmental innovation-new evidences from German panel data sources. Res. Policy 2008, 37, 163–173. [Google Scholar] [CrossRef] [Green Version]
  58. Facheux, S.; Nicolai, I. Environmental technological change and governance in sustainable development policy. Ecol. Econ. 1998, 27, 243–256. [Google Scholar] [CrossRef] [Green Version]
  59. Duchin, F.; Lange, G.M.; Kell, G. Technological change, trade and the environmental. Ecol. Econ. 1995, 14, 185–193. [Google Scholar] [CrossRef]
  60. Marín, G. Do eco-innovations harm productivity growth through crowding out? Results of an extended CDM model for Italy. Res. Policy 2014, 43, 301–317. [Google Scholar] [CrossRef] [Green Version]
  61. Mazzanti, M.; Zoboli, R. Environmental efficiency and labour productivity: Trade-off or joint dynamics? A theoretical investigation and empirical evidence from Italy using NAME. Ecol. Econ. 2009, 68, 1182–1194. [Google Scholar] [CrossRef]
  62. Ghisetti, C.; Renning, K. Environmental innovations and profitability: How does it pay to be green? An empirical analysis on the German innovation survey. J. Clean. Prod. 2014, 75, 106–117. [Google Scholar] [CrossRef] [Green Version]
  63. Annunziata, E.; Pucci, T.; Frey, M.; Zanni, L. The role of organizational capabilities in attaining corporate sustainability practices and economic performance: Evidence from Italian wine industry. J. Clean. Prod. 2018, 171, 1300–1311. [Google Scholar] [CrossRef]
  64. Cheng, C.C.; Yang, C.L.; Sheu, C. The link between eco-innovation and business performance: A Taiwanese industry context. J. Clean. Prod. 2014, 64, 81–90. [Google Scholar] [CrossRef] [Green Version]
  65. Lanoie, P.; Laurent-Luchetti, J.; Johnstone, N.; Ambec, S. Environmental policy, innovation and performance: New insights on the porter hypothesis. J. Econ. Manag. Strategy 2011, 20, 803–842. [Google Scholar] [CrossRef] [Green Version]
  66. Horbach, J. The impacts of innovations activities on employment in the environmental sector-empirical results for Germany at the firm level. J. Econ. Stat. 2010, 230, 403–419. [Google Scholar] [CrossRef] [Green Version]
  67. Horbach, J.; Renning, K. Environmental innovation and employment dynamics in different technology fields-an analysis based on the German Community Innovation Survey 2009. J. Clean. Prod. 2013, 57, 158–165. [Google Scholar] [CrossRef] [Green Version]
  68. Hunt, C.B.; Auster, E.R. Proactive environmental management: Avoiding the toxic trap. MIT Sloan Manag. Rev. 1990, 31, 7–18. [Google Scholar]
  69. Wartick, S.L.; Cochran, P.L. The evolution of the corporate social performance model. Acad. Manag. Rev. 1986, 10, 758–769. [Google Scholar] [CrossRef]
  70. Peraza, E.; Aleixandre Mendizábal, G.; Gómez García, J.M. Los factores determinantes del comportamiento innovador de las cooperativas: Un análisis para el caso de Castilla y León. REVESCO Rev. Estud. Coop. 2016, 122, 252–284. [Google Scholar] [CrossRef] [Green Version]
  71. Fernández Moreno, M.V.; Peña García-Pardo, I.; Hernández Perlines, F. Factores Determinantes del éxito Exportador. El papel de la Estrategia Exportadora en las Cooperativas Agrarias. CIRIEC Esp. Rev. Econ. Pública Soc. Coop. 2008, 63, 39–64. [Google Scholar]
  72. Águila Obra, A.R.; Padilla Meléndez, A. Factores Determinantes de la Innovación en Empresas de la Economía Social. La Importancia de la Formación y la Actitud Estratégica. CIRIEC Esp. Rev. Econ. Pública Soc. Coop. 2010, 67, 129–155. Available online: http://www.ciriec-revistaeconomia.es/banco/6706_Aguila_y_Padilla.pdf (accessed on 21 June 2020).
  73. Morales Gutiérrez, A.C. La economía social y las políticas de innovación: Especial referencia al caso andaluz. In La Economía Social en las Políticas Públicas en España; Chaves, R., Ed.; CIRIEC-España: Valencia, Spain, 2007; pp. 202–222. [Google Scholar]
  74. Carchano, M.; Carrasco, I. La Economía Social y la industria agroalimentaria como factores de resiliencia de la población en Castilla-La Mancha. In Despoblamiento y Desarrollo Rural. Propuestas desde la Economía Social; Fajardo, G., Escribano, J., Eds.; IUDESCOOP and CIRIEC-España: Valencia, Spain, 2020; in press. [Google Scholar]
  75. Ward, B. The Firm in Illyria: Market Syndicalism. Am. Econ. Rev. 1958, 48, 566–589. [Google Scholar]
  76. Pérotin, V. Entry, exit, and the business cycle: Are cooperatives different? J. Comp. Econ. 2006, 34, 295–316. [Google Scholar] [CrossRef]
  77. Buendía-Martínez, I.; Carrasco, I. El Impacto de los Factores Institucionales en la Actividad Emprendedora: Un Análisis del Cooperativismo Europeo. Rev. Econ. Mund 2014, 38, 175–200. [Google Scholar]
  78. Carrasco, I.; Buendía-Martínez, I. Political Activism as Driver of Cooperative Sector. Voluntas 2020, 31, 601–613. [Google Scholar] [CrossRef]
  79. Arando, S.; Peña, I.; Verheul, I. Market entry of firms with different legal forms: An empirical test of the influence of institutional factors. Int. Entrep. Manag. J. 2009, 5, 77–95. [Google Scholar] [CrossRef]
  80. Coque Martínez, J.; López Mielgo, N.; Loredo Fernández, E. Recuperación de Empresas por sus Trabajadores en Contextos de Crisis: ¿qué Podemos Aprender de Experiencias Pasadas? CIRIEC Esp. Rev. Econ. Pública Soc. Coop. 2012, 76, 97–126. Available online: https://www.redalyc.org/pdf/174/17425849005.pdf (accessed on 1 May 2020).
  81. Birchall, J. Resilience in a Downturn the Power of Financial Cooperatives; International Labour Office: Geneva, Switzeland, 2013. [Google Scholar]
  82. Medina-Albaladejo, F.J. Co-operative wineries: Temporal solution or efficient firms? The Spanish case during late Francoism, 1970–1981. Bus. Hist. 2015, 57, 589–613. [Google Scholar] [CrossRef]
  83. Guinnane, T.W. Cooperatives as Information Machines: German Rural Credit Cooperatives, 1883–1914. J. Econ. Hist. 2001, 61, 366–389. [Google Scholar] [CrossRef]
  84. Gide, C. The wine crisis in South France. Econ. J. 1907, 17, 370–375. Available online: https://www.jstor.org/stable/2220475?seq=1#metadata_info_tab_contents (accessed on 26 March 2020). [CrossRef]
  85. Gide, C. Les Associations Cooperatives Agricoles; Cours: Collège de France, décembre 1924-mars 1925; Hachette Livre BNF: Paris, France, 1926. [Google Scholar]
  86. Mandeville, L. Étude sur les Sociétés Coopératives de Vinification du midi de la France. Ph.D. Thesis, Faculté de Droit, Université de Toulouse, Toulouse, France, 1914. [Google Scholar]
  87. Simpson, J. Cooperation and Cooperatives in Southern European Wine Production. The nature of successful institutional innovation, 1880–1950. Adv. Agric. Econ. Hist. 2000, 1, 5–126. [Google Scholar]
  88. Fernández, E.; Simpson, J. Product quality or market regulation? Explaining the slow growth of Europe’s wine cooperatives, 1880–190. Econ. Hist. Rev. 2017, 70, 122–142. [Google Scholar] [CrossRef]
  89. Chevet, J.M. Cooperative cellars and the regrouping of the supply in France in the Twentieth Century. In Exploring the Food Chain. Food Production and Food Processing in Western Europe, 1850–1990; Segers, Y., Bieleman, J., Buyst, E., Eds.; Brepols: Turnhou, Belgium, 2009; pp. 253–281. [Google Scholar] [CrossRef]
  90. Chiffoleau, Y.; Dreyfus, F.; Ewert, J.; Touzard, J.M. The wine cooperatives face the demand for quality: Call for a renewed solidarity in Languedoc (France) and in the Western Cape (South Africa). In Local Society & Global Economy: The Role of Cooperatives; Karafolas, S., Spear, R., Stryjan, Y., Eds.; Editions Hellin: Naoussa, Greece, 2002; pp. 381–394. [Google Scholar]
  91. Loubère, L.A. The Wine Revolution in France. The Twentieth Century; Princenton University Press: Princeton, NJ, USA, 1990. [Google Scholar]
  92. Vanek, J. The Economics of Worker Management: A Yugoslav Case Study; George Allen and Unwin: London, UK, 1972. [Google Scholar]
  93. Ben-Ner, A. The Life Cycle of workers-owned Firms in Market economics. J. Econ. Behav. Organ. 1988, 10, 287–313. [Google Scholar] [CrossRef]
  94. Gentil, D. Organisations coopératives et l’Etat. Afrique francophone (1960–1985). Mondes Dev. 1988, 61, 113–126. [Google Scholar]
  95. Carrasco, I. Razones históricas y sociológicas de la evolución de las cooperativas: La dinámica de los movimientos sociales y la herencia del pasado. In Sociedades Cooperativas: Régimen Jurídico y Gestión Económica; Prieto, J.A., Ed.; Ibídem ediciones: Madrid, Spain, 1999; pp. 211–227. [Google Scholar]
  96. Vienney, C. Les rapports entre les coopératives et l’État. Coop. Dév. 1988, 20, 13–38. [Google Scholar]
  97. Gaye, M. Les cooperatives agricoles au Sénégal et l’expérience de la responsabilistaion. Coop. Dév. 1988, 20, 121–141. [Google Scholar]
  98. Medina-Albaladejo, F.J.; Planas, J. Las bodegas cooperativas y la comercialización del vino en España durante el siglo XX. Investig. Hist. Econ. 2020, 16, 23–34. [Google Scholar] [CrossRef]
  99. Marcuello Servós, C.; Saz Gil, M.I. Los principios cooperativos facilitadores de la innovación: Un modelo teórico. REVESCO Rev. Estud. Coop. 2008, 94, 59–79. [Google Scholar]
  100. Vézina, M.; Malo, M.C.; Ben Selma, M. Mature social economy enterprise and social innovation: The case of Desjardins Environmental Fund. Ann. Public Coop. Econ. 2017, 88, 257–278. [Google Scholar] [CrossRef] [Green Version]
  101. Ole-Borgen, S.; BerntAarset, B. Participatory Innovation: Lessons from breeding cooperatives. Agric. Syst. 2016, 145, 99–105. [Google Scholar] [CrossRef]
  102. Sexton, R.J.; Iskow, J. What do we know about the economic efficiency of cooperatives: An evaluative survey. J. Agric. Coop. 1993, 8, 1–13. [Google Scholar]
  103. Aragón-Correa, J.A.; Morales, V.G.; Torres, N.H. Un modelo explicativo de las estrategias medioambientales avanzadas para pequeñas y medianas empresas y su influencia en los resultados. Cuad. Econ. Dir. Empresa 2005, 25, 29–51. Available online: https://www.redalyc.org/articulo.oa?id=807/80717237002 (accessed on 23 June 2020).
  104. Rueda-Manzanares, A.R.; Aragón-Correa, J.A.; Martín-Tapia, I. La medición de las capacidades organizacionales de la empresa: Validación de un instrumento de medida de la gestión medioambiental proactiva. Span. J. Financ. Account. 2006, 35, 563–582. [Google Scholar] [CrossRef]
  105. Sharma, S.; Vredenburg, H. Proactive corporate environmental strategy and the development of competitively valuable organizational capabilities. Strateg. Manag. J. 1998, 19, 729–753. [Google Scholar] [CrossRef]
  106. González-Benito, J.; González-Benito, O. Environmental proactivity and business performance: An empirical analysis. Omega 2005, 33, 1–15. [Google Scholar] [CrossRef]
  107. Gupta, A.K.; Govindarajan, V. Business unit strategy, managerial characteristics, and business unit effectiveness at strategy implementation. Acad. Manag. J. 1984, 27, 25–41. [Google Scholar] [CrossRef]
  108. Cooper, R.G.; Kleinschmidt, E.J. Performance typologies of New Product Projects. Ind. Mark. Manag. 1995, 24, 439–456. [Google Scholar] [CrossRef]
  109. Dess, G.; Robinson, R.B., Jr. Measuring organizational performance in the absence of objective measures: The case of the privately-held firm and conglomerate business unit. Strateg. Manag. J. 1984, 5, 265–273. [Google Scholar] [CrossRef]
Figure 1. Data analysis and methods.
Sustainability 12 05908 g001
Table 1. Wineries (number) and production (M HL) by Spanish region.
Wineries%Production%
Castilla and León57414.0219605.97
Catalonia57514.0529228.9
Galicia41510.144601.4
Basque Country43610.655991.83
Castilla–La Mancha42010.2617,04951.95
La Rioja3899.516274.96
Andalusia2907.0910133.09
Valencian Community1974.8219675.99
Madrid1734.23770.23
Extremadura1283.1327508.38
Aragón1222.989732.97
Rest3749.1414194.35
4093100%32,816100%
Source: Spanish wine market organization (OeMV), 2017.
Table 2. Technical data sheet for the empirical study.
Population Size4093 Wineries Located in Spain (540 Cooperatives)
Sampling methodQuestionnaire for the complete population (first contact in FENAVIN: Spanish Wine Fair)
Final sample size251 companies (51 cooperatives)
Subsample analyzed51 cooperatives
Response rate13% (9.4%)
Sampling error6% (13.06%)
Data collectionElectronic questionnaire
Collection period2017–2018
Table 3. Variables included.
Environmental Proactivity
Prioritizes environmental questions
Explicit definition of company environmental policy
Existence of environmental aims and plans
Measurement of environmental performance
Internal environmental reviews
Existence of management positions for environmental issues
Participation of director of environmental issues in definition of company strategy
Employee participation in environmental training programs
Assessment of environmental impact of products in the different stages of the value chain
Environmental criteria considered in product design
Use of clean technology
Environmental criteria considered in process design
Environmental criteria considered in selection of suppliers
Suppliers are required to comply with environmental standards
Environmental criteria considered in distribution
Emphasis on commitment to the environment in marketing campaigns
Collaboration with environmental organizations
Sponsorship of environmental events
Motivations
Expand product range
Expand markets
Improve profitability
Improve competitiveness
Adapt to legal framework
Adapt to demand conditions
Leverage public incentives
Respond to pressure groups and associations
Follow industry associations’ guidelines
Technological eco-innovation
Leadership in product eco-innovations
Number of product eco-innovations
Intensity of change in product eco-innovations
Leadership in process eco-innovations
Number of process eco-innovations
Intensity of change in process eco-innovations
Financial and market performance
Importance of sales level
Importance of sales growth
Importance of market share
Importance of profitability
Importance of gross profit margin
Importance of operating profit
Importance of achieving objectives
Satisfaction with sales level
Satisfaction with sales growth
Satisfaction with market share
Satisfaction with profitability
Satisfaction with gross profit margin
Satisfaction with operating profit
Satisfaction with achieving objectives
Table 4. Factor analysis 1. Environmental proactivity.
Environmental ProactivityFactors
Factor 1.1Factor 1.2Factor 1.3Factor 1.4
Prioritizes environmental questions0.1580.8190.2150.227
Explicit definition of company environmental policy0.3120.7890.360.152
Existence of environmental aims and plans0.3010.8070.3430.134
Measurement of environmental performance0.3650.6450.3160.231
Internal environmental reviews0.430.6450.3350.13
Existence of management positions for environmental issues0.0670.2540.8530.045
Participation of director of environmental issues in definition of company strategy0.3680.3120.695−0.065
Employee participation in environmental training programs0.310.3240.6990.147
Assessment of environmental impact of products in the different stages of the value chain0.6670.4490.1970.104
Environmental criteria considered in product design0.7310.4010.1270.285
Use of clean technology0.5940.4770.038−0.019
Environmental criteria considered in process design0.7530.3970.0990.209
Environmental criteria considered in selection of suppliers0.7380.180.3730.359
Environmental standards required from suppliers0.7330.1820.4780.151
Environmental criteria considered in distribution0.7810.1750.3110.319
Emphasis on commitment to the environment in marketing campaigns0.5120.60.141−0.027
Collaboration with environmental organizations0.2220.131−0.0850.906
Sponsorship of environmental events0.20.1820.1870.864
% variance explained26.1623.8615.5311.94
Total variance explained77.54
KMO0.916
Bartlett sphericity:
X23648.85
Gl153
Sig.0.000
Table 5. Factor analysis 2. Motivation of environmental proactivity.
Strategic MotivationFactor 2.1
Expand product range0.898
Expand market0.954
Improve profitability0.91
Improve competitiveness0.949
Adapt to demand conditions0.906
% Explained variance85.3
KMO0.91
Bartlett’s sphericity:1.239.67
X210
Gl0
Sig.
Compliance with Norms and IncentivesFactor 2.2
Adapt to legal framework0.96
Public incentives0.96
% Explained variance92.248
KMO0.5
Bartlett’s sphericity:292.257
X21
Gl0.000
Sig.
Response to Social PressureFactor 2.3
Action of organizations and pressure groups0.942
Local industry associations0.942
% Explained variance88.729
KMO0.5
Bartlett’s sphericity:213.939
X21
Gl0
Sig.
Table 6. Factor analysis 3 and 4. Eco-innovation results.
Product Eco-InnovationFactor 3.1
Leadership in product eco-innovations0.98
Quantity of product eco-innovations0.993
Intensity of product eco-innovation0.993
% Explained variance97.75
KMO0.757
Bartlett’s sphericity: X21495.64
Gl15
Sig.0
Process Eco-InnovationFactor 4.1
Leadership in process eco-innovations0.979
Quantity of process eco-innovations0.994
Intensity of process eco-innovation0.98
% Explained variance96.85
KMO0.706
Bartlett’s sphericity: X21266.284
Gl3
Sig0
Table 7. Factor analysis 5. Financial performance.
Assessment of Financial PerformanceFactor 5.1Factor 5.2
Importance of sales level0.8330.221
Importance of sales growth0.9530.076
Importance of market share0.8570.051
Importance of profitability0.940.087
Importance of gross margin of profit0.9680.048
Importance of operating profit0.9710.051
Importance of goal achievement0.9150.077
Satisfaction with sales level0.0620.779
Satisfaction with sales growth0.1210.796
Satisfaction with market share0.1160.784
Satisfaction with profitability0.0670.928
Satisfaction with gross margin of profit0.070.935
Satisfaction with operating profit0.070.938
Satisfaction with goal achievement0.050.922
% Explained variance42.7538.54
% Total de explained variance81.29
KMO0.841
Bartlett’s Sphericity:4637.76
X291
Gl0
Sig.
Table 8. Scales and elements.
Environmental ProactivityCronbach’s Alpha *MeanStandard Deviation
Environmental commitment93.4%19.393.62
Prioritizes environmental questions92.6%3.490.72
Explicit definition of company environmental policy91.0%3.320.72
Existence of environmental aims and plans91.0%3.320.68
Measurement of environmental performance92.2%3.030.68
Internal environmental reviews92.0%3.000.69
Marketing based on environmental commitment93.8%3.240.67
Structure, participation and training81.6%7.381.77
Existence of management positions for environmental issues75.0%2.200.65
Participation of director of environmental issues in definition of company strategy72.8%2.790.73
Employee participation in environmental training programs76.2%2.390.67
Internal operations93.0%21.603.56
Assessment of environmental impact of products in the different stages of the value chain92.3%2.990.60
Use of environmental criteria in product design91.5%3.040.56
Use of clean technology93.7%3.700.65
Use of environmental criteria in process design91.6%3.120.58
Use of environmental criteria in selection of suppliers91.4%2.950.57
Suppliers comply with environmental criteria91.8%2.850.64
Use of environmental criteria in distribution91.4%2.940.60
External collaboration86%2.631.32
Collaboration with environmental associations1.180.67
Sponsorship of environmental events1.450.73
MotivationsCronbach’s Alpha *MeanStandard Deviation
Strategic motivation95.6%12.003.24
Expand product range95.2%2.540.70
Expand market93.8%2.390.69
Improve profitability95.0%2.280.66
Improve competitiveness94.0%2.400.71
Adapt to demand conditions95.1%2.380.73
Compliance with regulations and subsidies91.4%6.721.63
Adapt to legal framework3.450.81
Leverage public incentives3.260.89
Response to social pressure87.0%2.751.32
Respond to pressure groups and associations1.330.70
Follow industry associations’ guidelines1.420.70
Technological Eco-InnovationCronbach’s Alpha *MeanStandard Deviation
Product eco-innovation98.8%3.822.01
Leadership in product eco-innovations98.5%1.260.66
Numbers of product eco-innovations97.6%1.280.68
Intensity of change in product eco-innovations97.6%1.280.69
Process eco-innovation98.3%3.932.24
Leadership in process eco-innovations98.0%1.280.72
Numbers of process eco-innovations96.0%1.280.77
Intensity of change in process eco-innovations98.0%1.330.78
Financial PerformanceCronbach’s Alpha *MeanStandard Deviation
Importance of financial performance indicators97.0%30.14.25
Sales level97.0%4.420.64
Sales growth96.3%4.310.61
Market share97.0%4.210.71
Profitability96.3%4.290.67
Gross profit margin96.1%4.260.65
Operating profit96.1%4.260.66
Achieving objectives96.6%4.360.65
Satisfaction with financial performance94.3%20.593.76
Sales level94.0%3.310.64
Sales growth94.0%2.810.73
Market share94.0%2.540.71
Profitability92.9%2.970.57
Gross profit margin92.9%2.970.53
Operating profit92.8%2.980.55
Achieving objectives92.9%3.020.58
* For each element, this is the Cronbach’s alpha if it is omitted from the scale.
Table 9. Comparison of the two group mean scores.
Groups
(1 = Cooperative; 0 = Non-Cooperative)
MeanStandard DeviationStandard Error Mean
Environmental commitment10.01710.8460.120
0−0.0051.0440.081
Structure, participation and training10.4370.8180.116
0−0.1311.0140.079
Internal operations1−0.3090.8180.116
00.0921.0320.080
External collaborations1−0.1090.4480.064
00.0321.1100.086
Strategic motivation1−0.1480.8270.118
00.0411.0410.078
Compliance with regulations and subsidies1−0.0370.9460.133
00.0091.0160.074
Response to social pressure1−0.1100.6930.097
00.0301.0680.078
Product eco-innovation1−0.1130.8930.125
00.0311.0270.075
Process eco-innovation1−0.1500.7910.110
00.0421.0480.077
Performance: Importance indicators1−0.5710.9900.142
00.1610.9410.071
Performance: Importance indicators1−0.1341.0250.146
00.0380.9920.075
Table 10. t-Test for equality of means of independent samples.
tSig. (Bilateral)Difference in MeansDifference in Standard Error95% of Mean Difference Confidence Interval
InferiorSuperior
Environmental commitment0.5560.5790.0910.164−0.2320.415
Structure, participation and training3.8550.0000.544 **0.1410.2640.825
Internal operations−2.4370.016−0.395 *0.162−0.715−0.075
External collaborations−1.3050.194−0.1410.108−0.3550.072
Strategic motivation−1.1780.240−0.1900.161−0.5080.127
Compliance with regulations and subsidies−0.2950.769−0.0470.159−0.3610.267
Respond to social pressure−0.8910.374−0.1400.158−0.4520.170
Product eco-innovation−0.9120.363−0.1440.158−0.4560.167
Process eco-innovation−1.4250.157−0.1920.135−0.4610.075
Performance: Importance indicators−4.7480.000−0.733 **0.154−1.037−0.428
Performance: Satisfaction indicators−1.0710.286−0.1730.161−0.4920.145
** significant at 99%; * significant at 95%.
Table 11. Cluster analysis. Centers of the final clusters.
Environmental ProactivityCluster
123
Environmental commitment **0.870450.02963–0.65916
Structure, participation and training *0.771410.613030.08357
Internal operations and relationships with agents in the value chain **–0.45874–3.792010.12527
Collaboration with external interest groups–0.104330.52487–0.16662
Number of cases22224
** significant at 99%; * significant at 95%.
Table 12. ANOVA. Comparison between groups.
Sum of SquaresRoot Mean SquareF
Strategic motivation (1 > 3) *Between groups4.8842.4423.816 *
Within groups27.5140.640
Total32.398
Compliance with regulations and subsidies (1 > 2,3) **Between groups11.5905.7957.998 **
Within groups31.8810.725
Total43.471
Respond to social pressure (1 < 2) *Between groups3.2871.6443.651 *
Within groups20.2620.450
Total23.549
Product eco-innovationBetween groups3.5411.7702.204
Within groups36.1450.803
Total39.686
Process eco-innovationBetween groups2.8481.4242.265
Within groups28.2960.629
Total31.144
Importance of performance (2 > 3) *Between groups5.5332.7663.490 *
Within groups34.0870.793
Total39.619
Satisfaction with performanceBetween groups2.0421.0210.957
Within groups45.8721.067
Total47.914
** significant at 99%; * significant at 95%.

