Article

Evaluating the Effect of Prosopis juliflora, an Alien Invasive Species, on Land Cover Change Using Remote Sensing Approach

1
Department of Natural Resources and Environment, Faculty of Agriculture, Jordan University of Science and Technology, Irbid 22110, Jordan
2
Department of Agricultural Economics and Agribusiness, The University of Jordan, Amman 11942, Jordan
3
Department of Horticulture and Crop Science, The University of Jordan, Amman 11942, Jordan
4
Department of Geography, The University of Jordan, Amman 11942, Jordan
5
School of GeoSciences, University of Edinburgh, Edinburgh EH8 9YL, UK
6
Royal Botanic Garden, Amman 11910, Jordan
*
Author to whom correspondence should be addressed.
Sustainability 2020, 12(15), 5887; https://doi.org/10.3390/su12155887
Submission received: 28 May 2020 / Revised: 1 July 2020 / Accepted: 10 July 2020 / Published: 22 July 2020

Abstract

:
Invasive plant species (IPS) affect people’s livelihoods and well-being by providing both benefits and costs in different contexts. The objective of this study was to investigate the impact of Prosopis juliflora invasion on land cover change using ground survey and satellite sensor data derived from Landsat ETM+. The study was conducted at Sweimeh, Jordan Valley, between 1999 and 2017. The overall classification accuracy of remotely sensed data was 86% for 1999 and 80% for 2017. Accordingly, a remote sensing approach has the potential to assess land change/cover and aid in monitoring the IPS, specifically Prosopis invasion. Change detection analysis of Landsat classes (i.e., 1999 and 2017) showed that bare soil, urban, and water surface areas decreased by 6%, 11%, and 3%, respectively. Conversely, the vegetation class (i.e., IPS and native plants) increased by 20%. Ground surveys in 1999 and 2017 showed that the average vegetation area in Sweimeh invaded by Prosopis was approximately 60% in 1999 and 70% in 2017. Accordingly, the total estimated area invaded by P. juliflora at Sweimeh (2106 ha) in 1999 was approximately 92 ha, while Prosopis coverage in the same region was approximately 413 ha in 2017. The high emergence rate, the adaptation to high temperatures and low precipitation as well as governmental regulations which restrict the removal of trees, including IPS, were the main factors that prompted the extreme P. juliflora invasion in the Jordan Valley. The high invasion rate has led to a reduction in native species, including Tamarix spp., and dried up five natural water springs in the area. Overall, a monitoring plan should be applied to control the invasion problem by Prosopis in the valley. In addition, the conservation regulations that deal with IPS should be revised to mitigate the IPS risk.

1. Introduction

Biological invasions are a major promoter of ecological and societal changes globally [1]. Invasion of non-native, invasive plant species (IPS) has been considered the main threat to plant diversity, because it continues to cause significant negative impacts on native biota through competition and habitat alteration (e.g., hybridization) [2]. Although, some IPS (Fabaceae family) are nitrogen-fixing trees, such as Prosopis and Robinia, those leguminous trees can lead to extinction of native species and have a drastic negative impact on ecosystems [3,4]. A global assessment of 167 IPS and their impacts on native species, communities, and ecosystems revealed that plant species and community tended to decline following invasions, but the abundance of the soil biota, nutrients, and water often increased following invasion [5]. In addition, the data mining analyses (87 publications, 1551 individual cases, 167 IPS) showed that IPS cause significant impacts on resident plant and animal richness, especially in islands regions [5]. Lazzaro et al. [4] studied how ecosystems changed following invasion by Robinia pseudoacacia. They found that the abundance and richness of microarthropods, richness of nematodes, and richness and diversity of plant communities decreased significantly in invaded stands. In fact, they confirmed that the IPS can transform several ecosystem components, modifying the plant–soil community, and affecting biodiversity at different levels.
The Invasive Species Specialist Group, a specialist group of the Species Survival Commission of the World Conservation Union, published a list of 100 of the world’s worst invasive alien species (IAS) to enhance awareness of the terrible consequences of IAS and their serious negative impact on biodiversity. The list included 66 animals, eight microorganisms, and 36 plants. Of the 36 plant species, Mesquite (Prosopis spp.) was one of the worst IPS [6]. In Jordan, Prosopis juliflora is one of the most unwanted IAS threatening natural ecosystems [7].
Prosopis is an evergreen shrub or tree, 15 m tall and with a 10 m spread [8]. Prosopis is a multipurpose tree, used as wood, feed for livestock, shade, fencing, and erosion control [9]. However, Prosopis is a major invader of the arid and semi-arid regions [9]. Prosopis invasion significantly reduced native woody species density, basal area, richness and diversity, water resources, and their strong and poisonous thorns cause wounds to livestock and human beings [9,10]. A meta-analysis study of 3624 observations of IPS effects on animals showed that IPS significantly reduced animal abundance, diversity, fitness, and ecosystem function across different ecosystems, while they could not find any positive effect across studies [11]. In Jordan, Prosopis juliflora, one of the highly invasive IPS, is dominantly present in the Dead Sea region and continues to spread into the surrounding region across the Jordan Valley [7]. Prosopis juliflora was introduced to the Jordan Valley by the Ministry of Agriculture between 1950 and 1970 for afforestation programs. The introduction of Prosopis was justified due to the fact of their ability to tolerate drought and high temperatures. Later, Prosopis started spreading and became invasive to the region. As a result, Prosopis limited human and animal mobility and caused human and animal injury.
Assessing the distribution of a species is pivotal for its conservation and management [12,13]. Identifying which areas capture how many species is the first question in conservation planning. In fact, the capacity of conservation programs depends on the nature and location of threats. Accordingly, effective monitoring and conservation planning of IPS depends on precise and up-to-date information relating to species distribution patterns and invaded area size [14]. Traditional monitoring of IPS, especially on a large scale, is labor intensive, slow, and expensive [15]. Remotely sensed data from satellite imagery overcomes the limitations of the conventional approach by its large-scale, reliable accuracy, and rapid mapping and its potential to provide quantitative information about the distribution and physiology of vegetation [14,16,17]. Using Landsat time series data, Graf et al. [18] related the canopy layer of forest plots derived from Landsat images (1985–2015) to herb layer plant species diversity observed in 2015. They concluded that multispectral data from Landsat has the potential to aid in biodiversity research. A remote sensing study conducted In Ethiopia using Landsat satellite sensors data of 1986, 2000, and 2017 showed a positive net change for Prosopis invaded areas between 1986 and 2017 [19]. The Prosopis invasion rate was approximately 31,127 ha per year. Conversely, the negative net changes were found for grassland, bare-land, and forests. Consequently, the ecosystem service values loss caused by Prosopis invasion was approximately US$ 602 million in the study area over the last 31 years [19]. Although Landsat images are recommended for monitoring land use/land cover studies [20], the spatial resolution (30 m) and the saturation of the optical signal at high biomass density and cloud cover can significantly affect their use including the phenological information useful for discriminating some vegetation types [21]. Therefore, fusion of satellite and ancillary data may improve the accuracy of remotely sensed data from Landsat [16,21].
The absence of up-to-date information about the Prosopis invasion has made the current management and monitoring unsuccessful. Identifying Prosopis species, their location, and spread rate are critical to provide reliable and precise information about the spatial and temporal spreading and the level of invasion into the native eco-community [22]. Remotely sensed data from Landsat ETM+ hold promise for detecting vegetation cover density and physiology and to upscale the response to large scale one [16,20]. Time series multispectral images from Landsat sensors allow for evaluating canopy dynamics over a long-term period (decades) at a spatial resolution of 30 m with no charges [18]. Providing reliable and up-to-date information about IPS (specifically, Prosopis) distribution is critical to for monitoring and conservation plans in Jordan Valley. We believe that multi-temporal data from Landsat ETM+ images can provide a precise estimate of Prosopis invasion. The objective of this study was to evaluate the spread of invasive Prosopis juliflora trees on land use/land cover using ground survey and satellite sensor data derived from Landsat ETM+ data in the Sweimeh area, Jordan Valley, between 1999 and 2017.

2. Materials and Methods

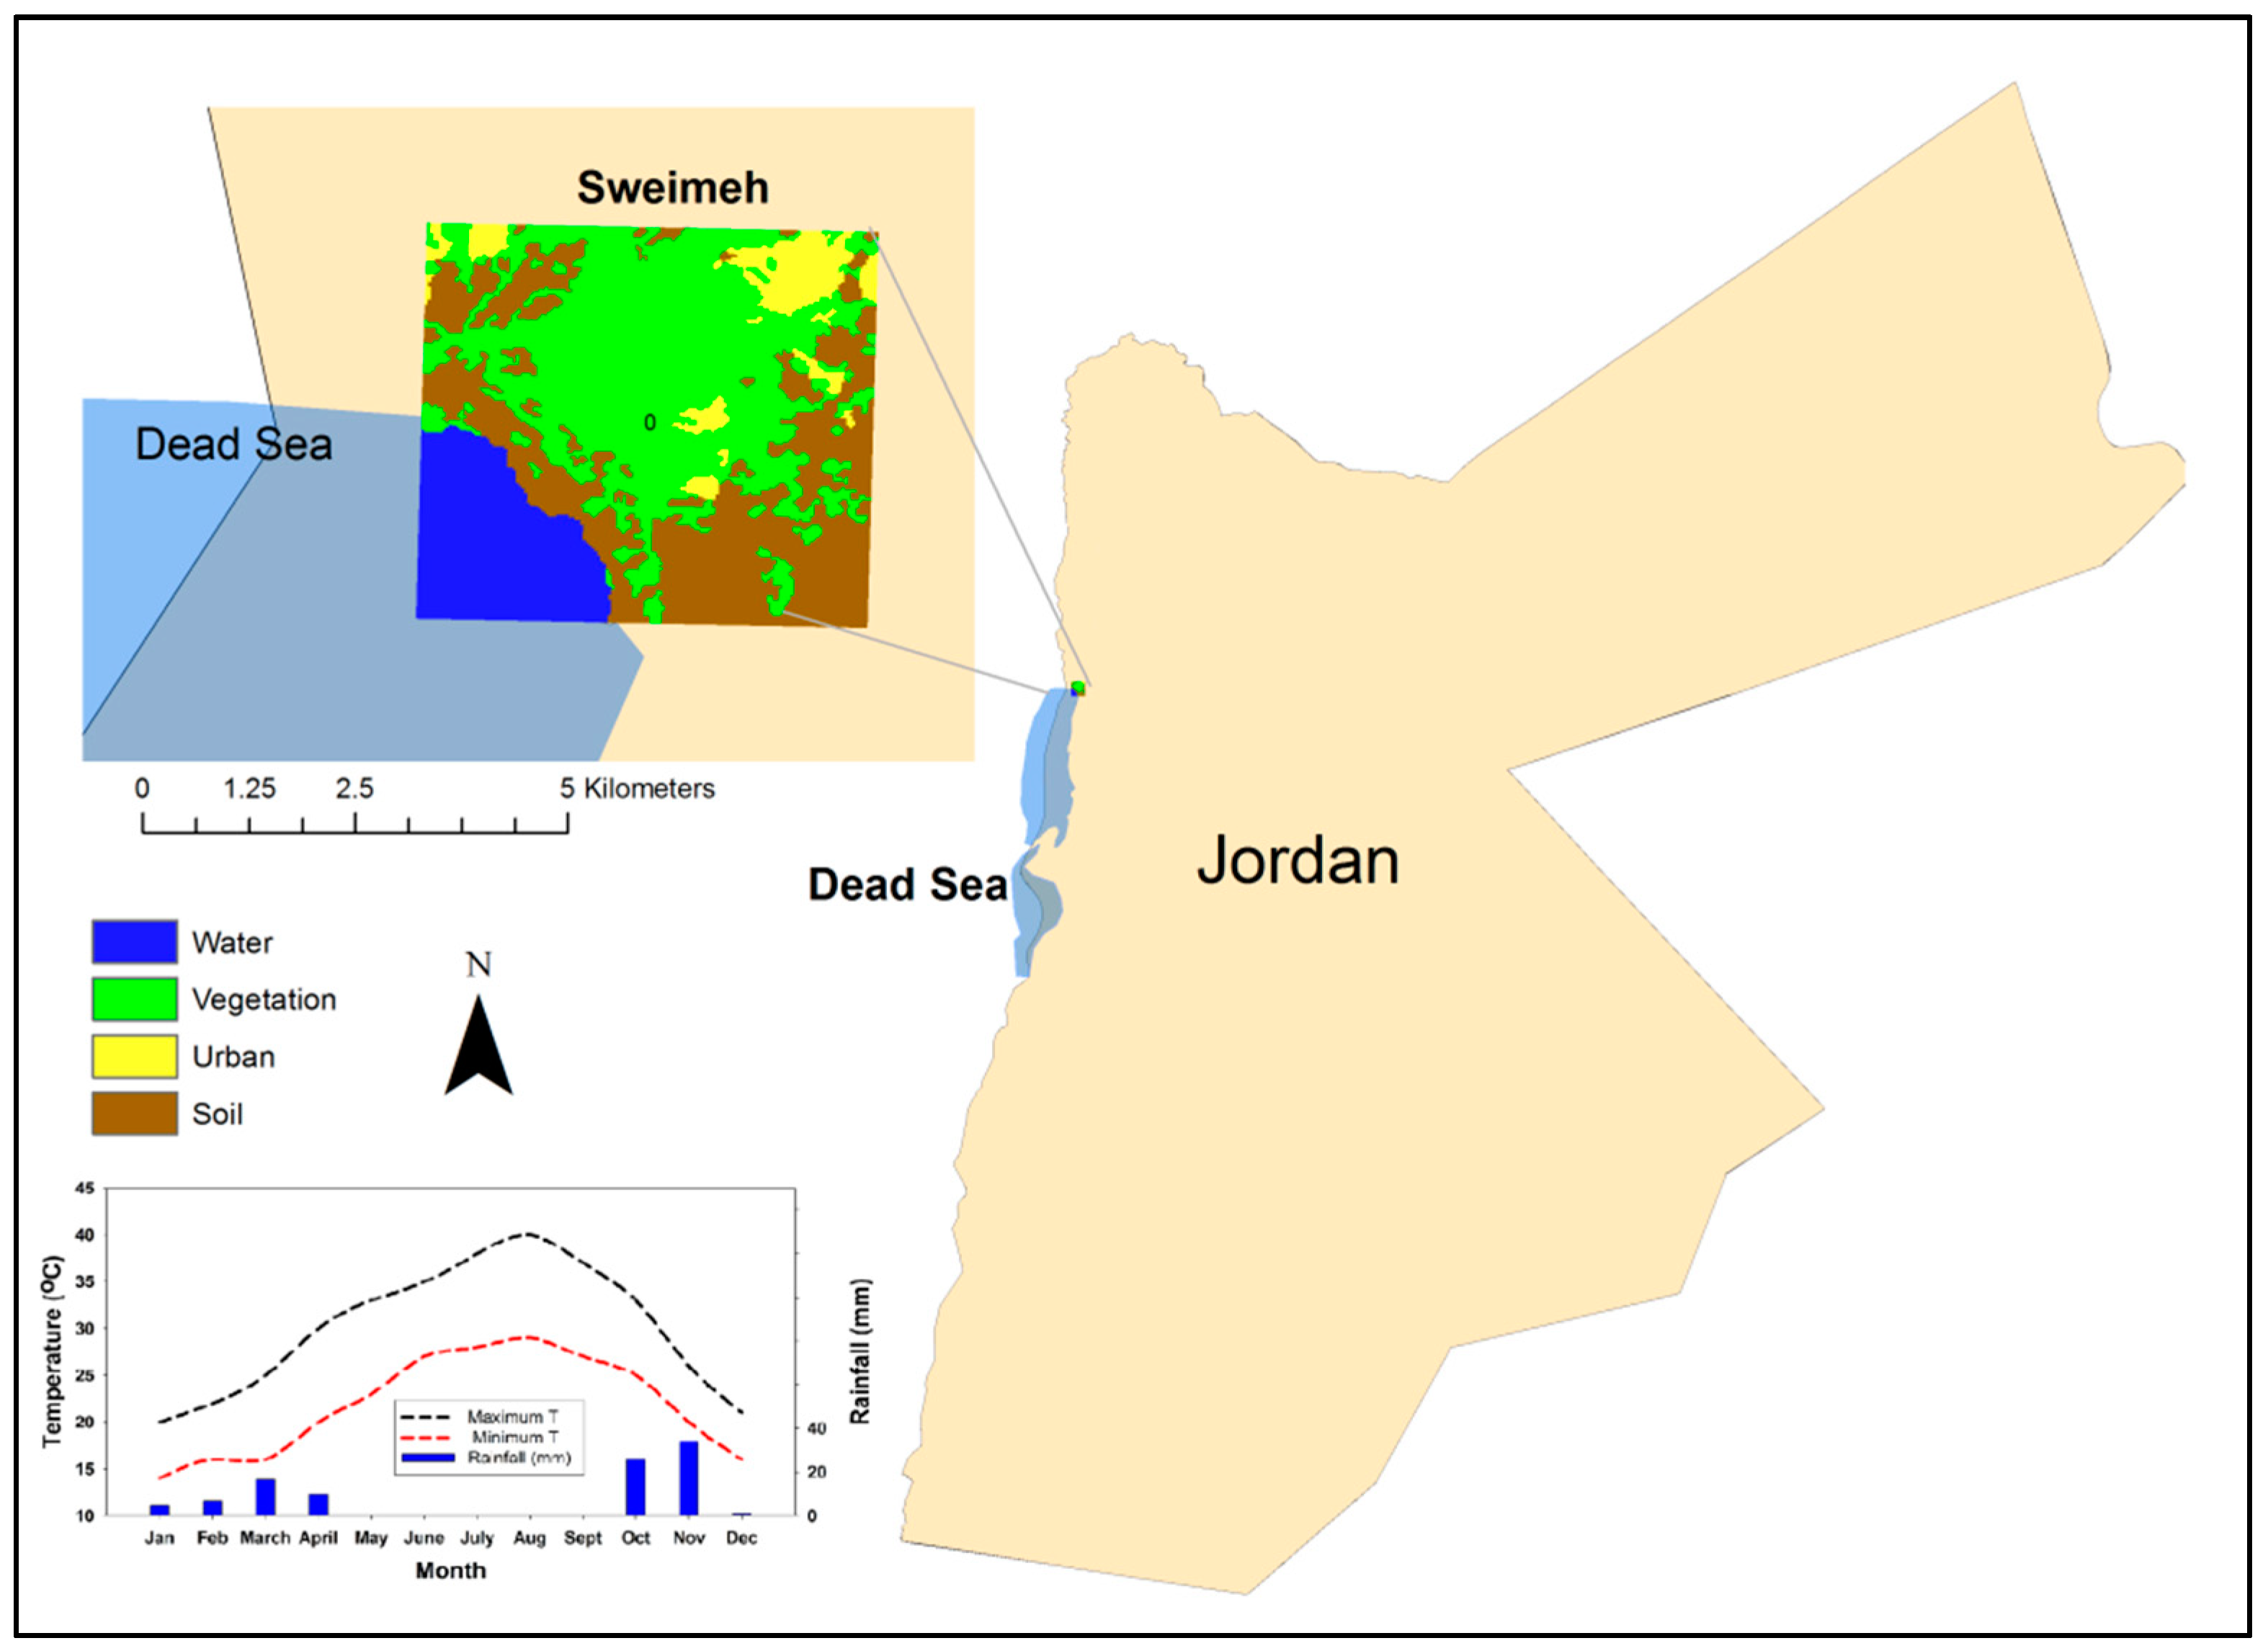
2.1. Site Description

The study was conducted at Sweimeh, northeastern side of the Dead Sea, Jordan Valley, Jordan (31°45′27.64″ N, 35°35′38.61″ E, and at an elevation 375 m below sea level). Annual mean maximum and minimum temperatures ranged from 28–30 °C and 20–22 °C, respectively (Figure 1). Annual precipitation ranged from 50–80 mm. The total area of the study area was approximately 2106 ha (Figure 1).

2.2. Image Acquisition, Pre-Processing, and Classification

Remotely sensed data from Landsat ETM+ is a cost- and time-efficient approach for monitoring plant growth, physiology and biodiversity [16,17,23,24]. Satellite sensor data from Landsat ETM+ was used as an input source for change detection to study the effect of Prosopis invasion compared to natural native vegetation. Cloud-free Landsat ETM+ images were identified and downloaded from EarthExplorer portal [25]. Images (surface reflectance climate data records (CDRs)) are atmospherically corrected and available free of charge from the EarthExplorer NASA portal. Those datasets are a reliable Landsat source for land cover studies [17]. Geo- referencing and image classification were then conducted using Environment for Visualizing Images (ENVI) 5.0 (Research Systems, Boulder, Colorado, USA). The Fast Line-of-sight Atmospheric Analysis of Spectral Hypercubes (FLAASH) logarithm in ENVI was used for radiometric normalization of the different Landsat images. The classification scheme of the remotely sensed data for the study area is found in Table 1. Maximum-likelihood supervised-classification (MLSC) was used for image classification. The classification model (MLSC) used the six original spectral bands of the Landsat ETM+ images to derive the output imagery. Change detection was computed as the difference between the proportions of each class among the classified images (1999 and 2017).

2.3. Ground Measurements and Accuracy Assessment

Ground reference data for the study area were collected between 15 July and 20 August 2017 for accuracy assessment of Landsat ETM+ images. A total of 100 plots (100 × 100 m) were randomly selected to evaluate the Prosopis distribution across classes. The vegetation distribution was studied and defined spatially using GPS at different parts within the Sweimeh village area. In addition, tree morphology and canopy cover were determined. Vegetation cover (in 2017) for each plot were then digitized using ArcGIS Software to determine the total cover percentage for each class and the invasion percentage of Prosopis within each studied class. In addition, historical data for the study area in 1999 were obtained from the Royal Society for the Conservation of Nature (RSCN), Ministry of agriculture in Jordan as well as personal interviews with Sweimeh residents to determine the location of Prosopis and Tamrix in the village. Accuracy assessment of Landsat ETM+ classification was determined by assessing the disparity between our classification results and both ground reference data (2017) and Google Earth images (1999). The total number of training points for classification accuracy (ground reference data and Google Earth images) was 97 points in 1999 and 136 in 2017. A confusion (error) matrix was developed for each classified map in order to assess the users, producers, and overall accuracy. The percentages of invasion for the 1999 and 2017 surveys were used to estimate the total areas invaded by Prosopis in 1999–2013. We collected the data in July to reduce the amount of error. No agricultural activities occurred at that time of the year; thus, only trees were available.

3. Results

3.1. Image Classification and Accuracy Assessment

Landsat ETM+ images were classified into four land cover classes: water, soil, vegetation, and urban areas (Figure 2). In our study, the overall classification accuracy was 86% for 1999 and 80% for 2017 (Table 2). The highest accuracy values were for water, while the urban class had the lowest user accuracy across the study period. Interestingly, the user and producer accuracy for all classes were above 74% across the study period (Table 2). The integration of ground reference location points and Landsat images in 1999 and 2017 showed that the proportion of IPS was approximately 60% in 1999 and increased by 10% in 2017 (Figure 2). The increase in the vegetation area in 2017 led to a reduction in native plants (specifically Tamarix) and increased IPS coverage (Figure 2). Vegetation (IPS and native species, especially Tamarix) class distribution was mainly near the coastal area in 1999 and away from the coast in 2006. In addition, a significant reduction in the urban class area was found in 2017 compared to 1999.

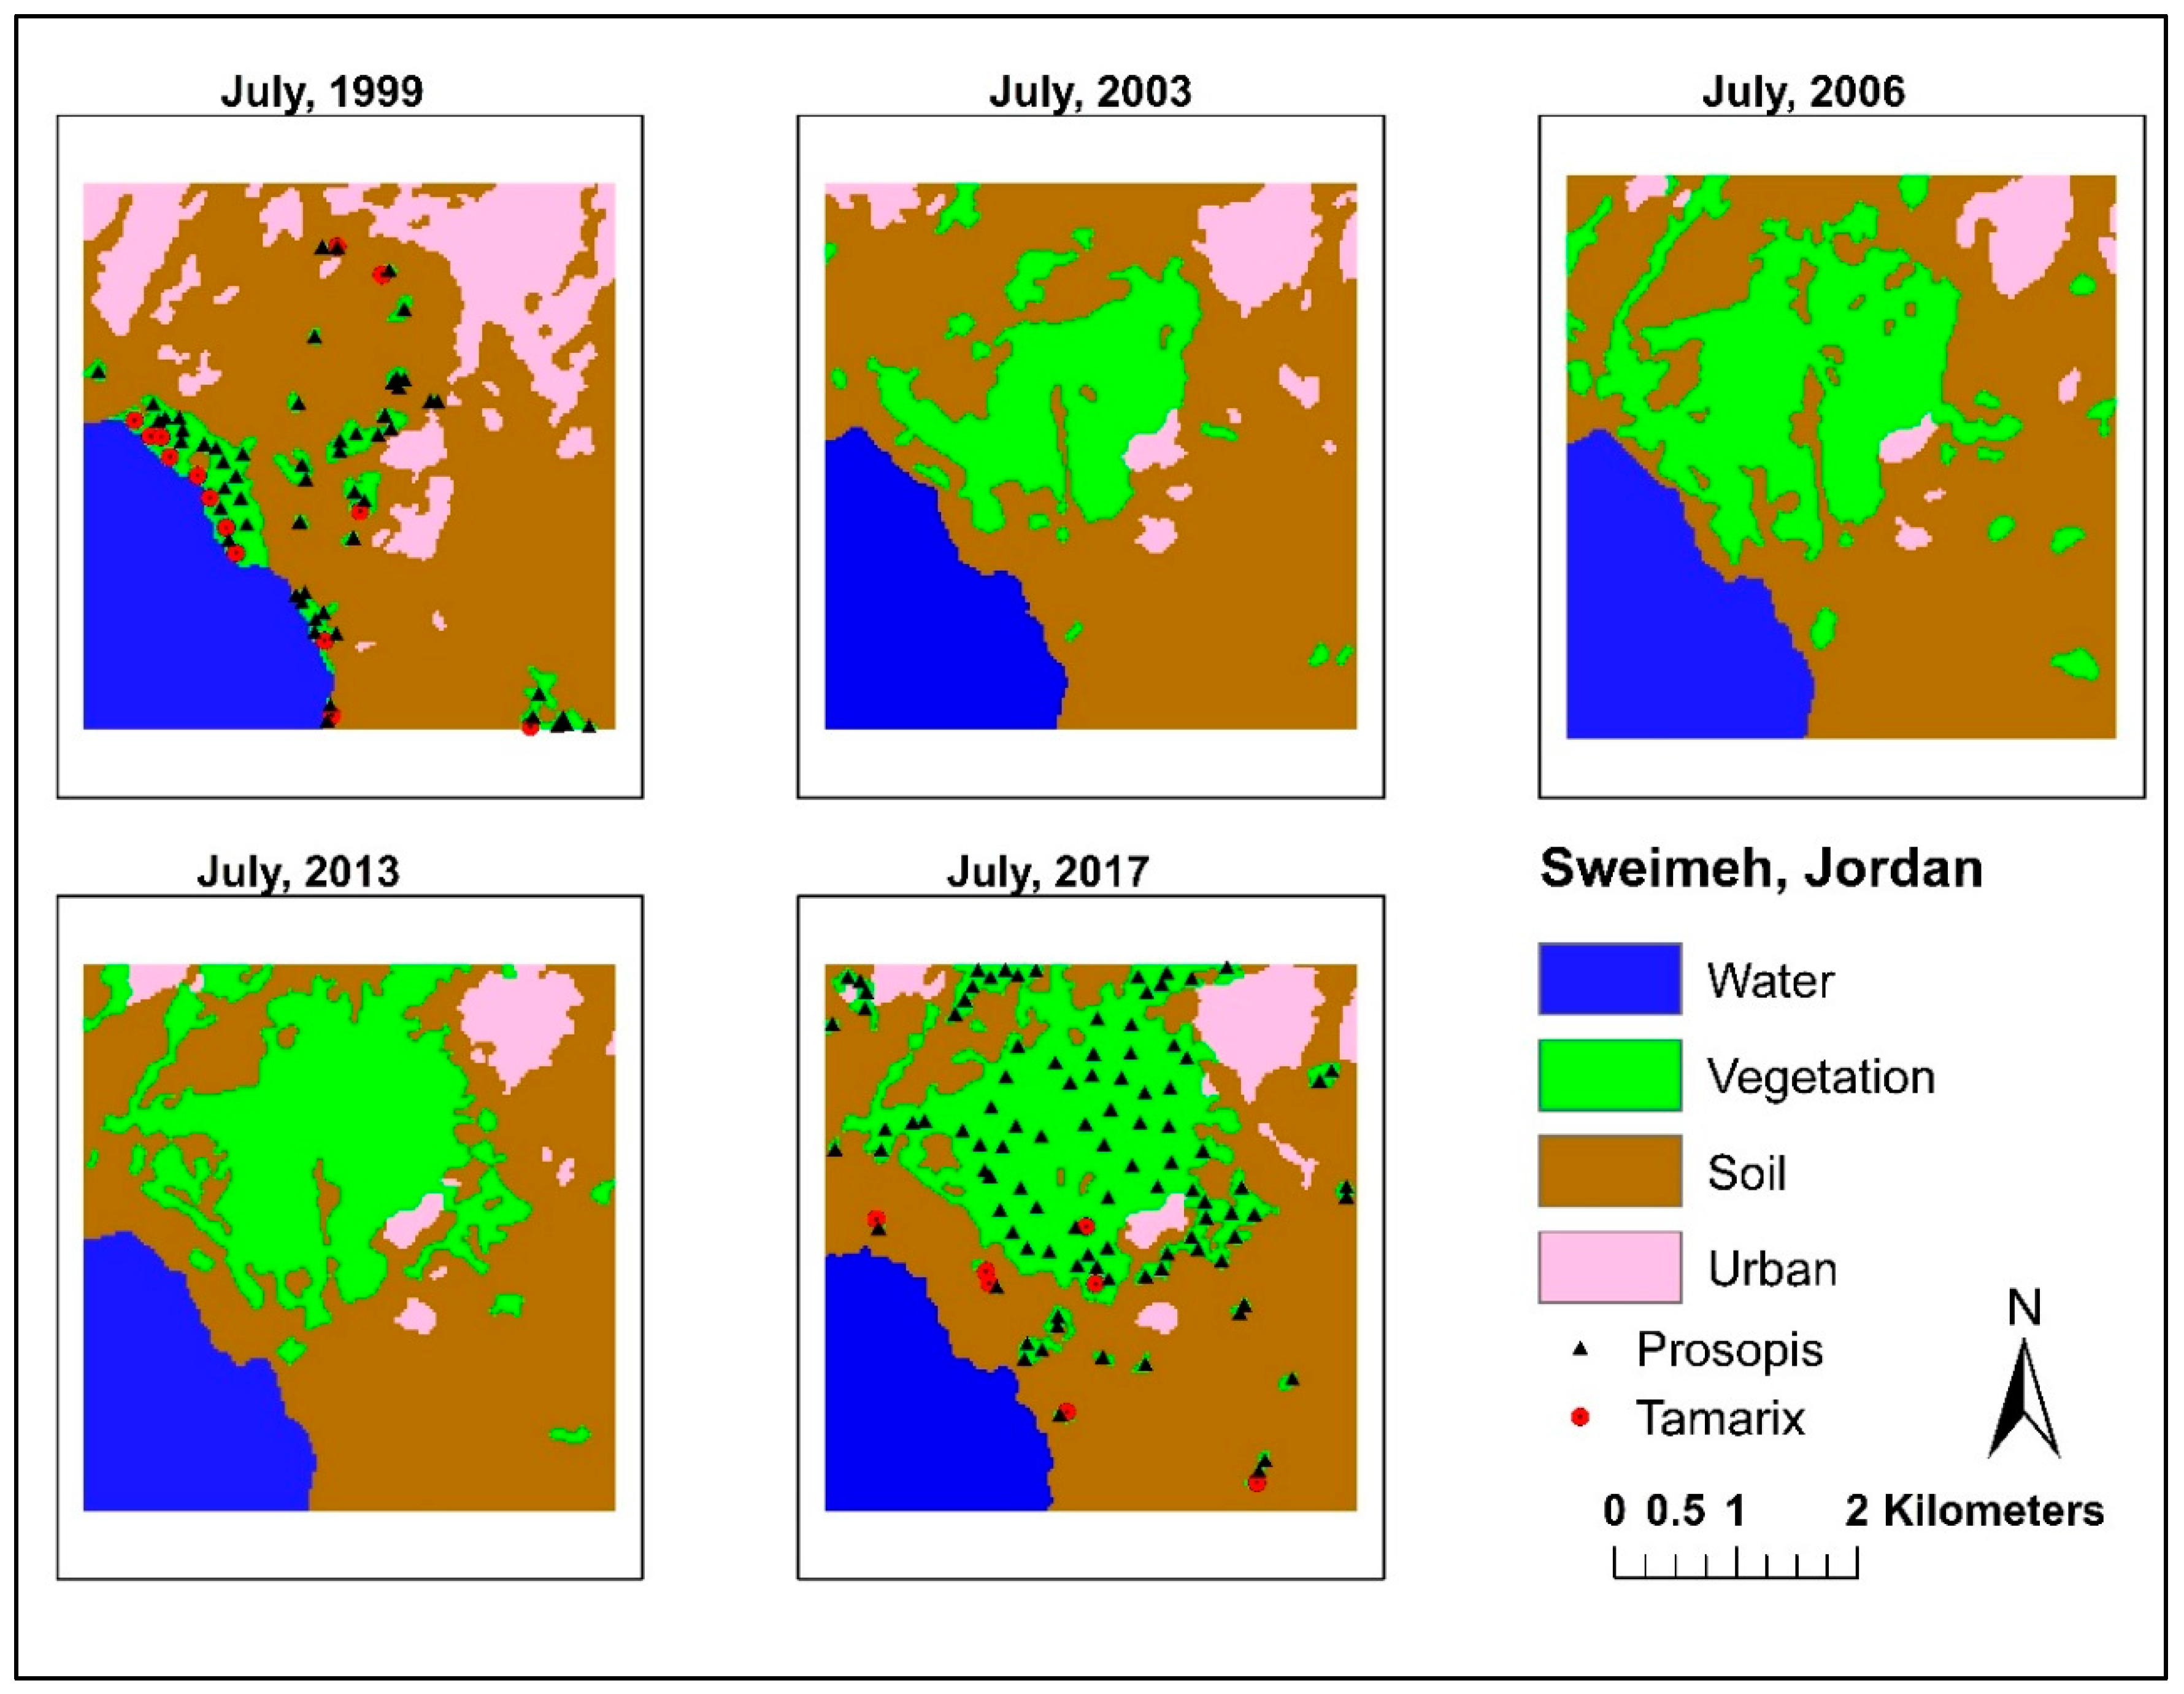
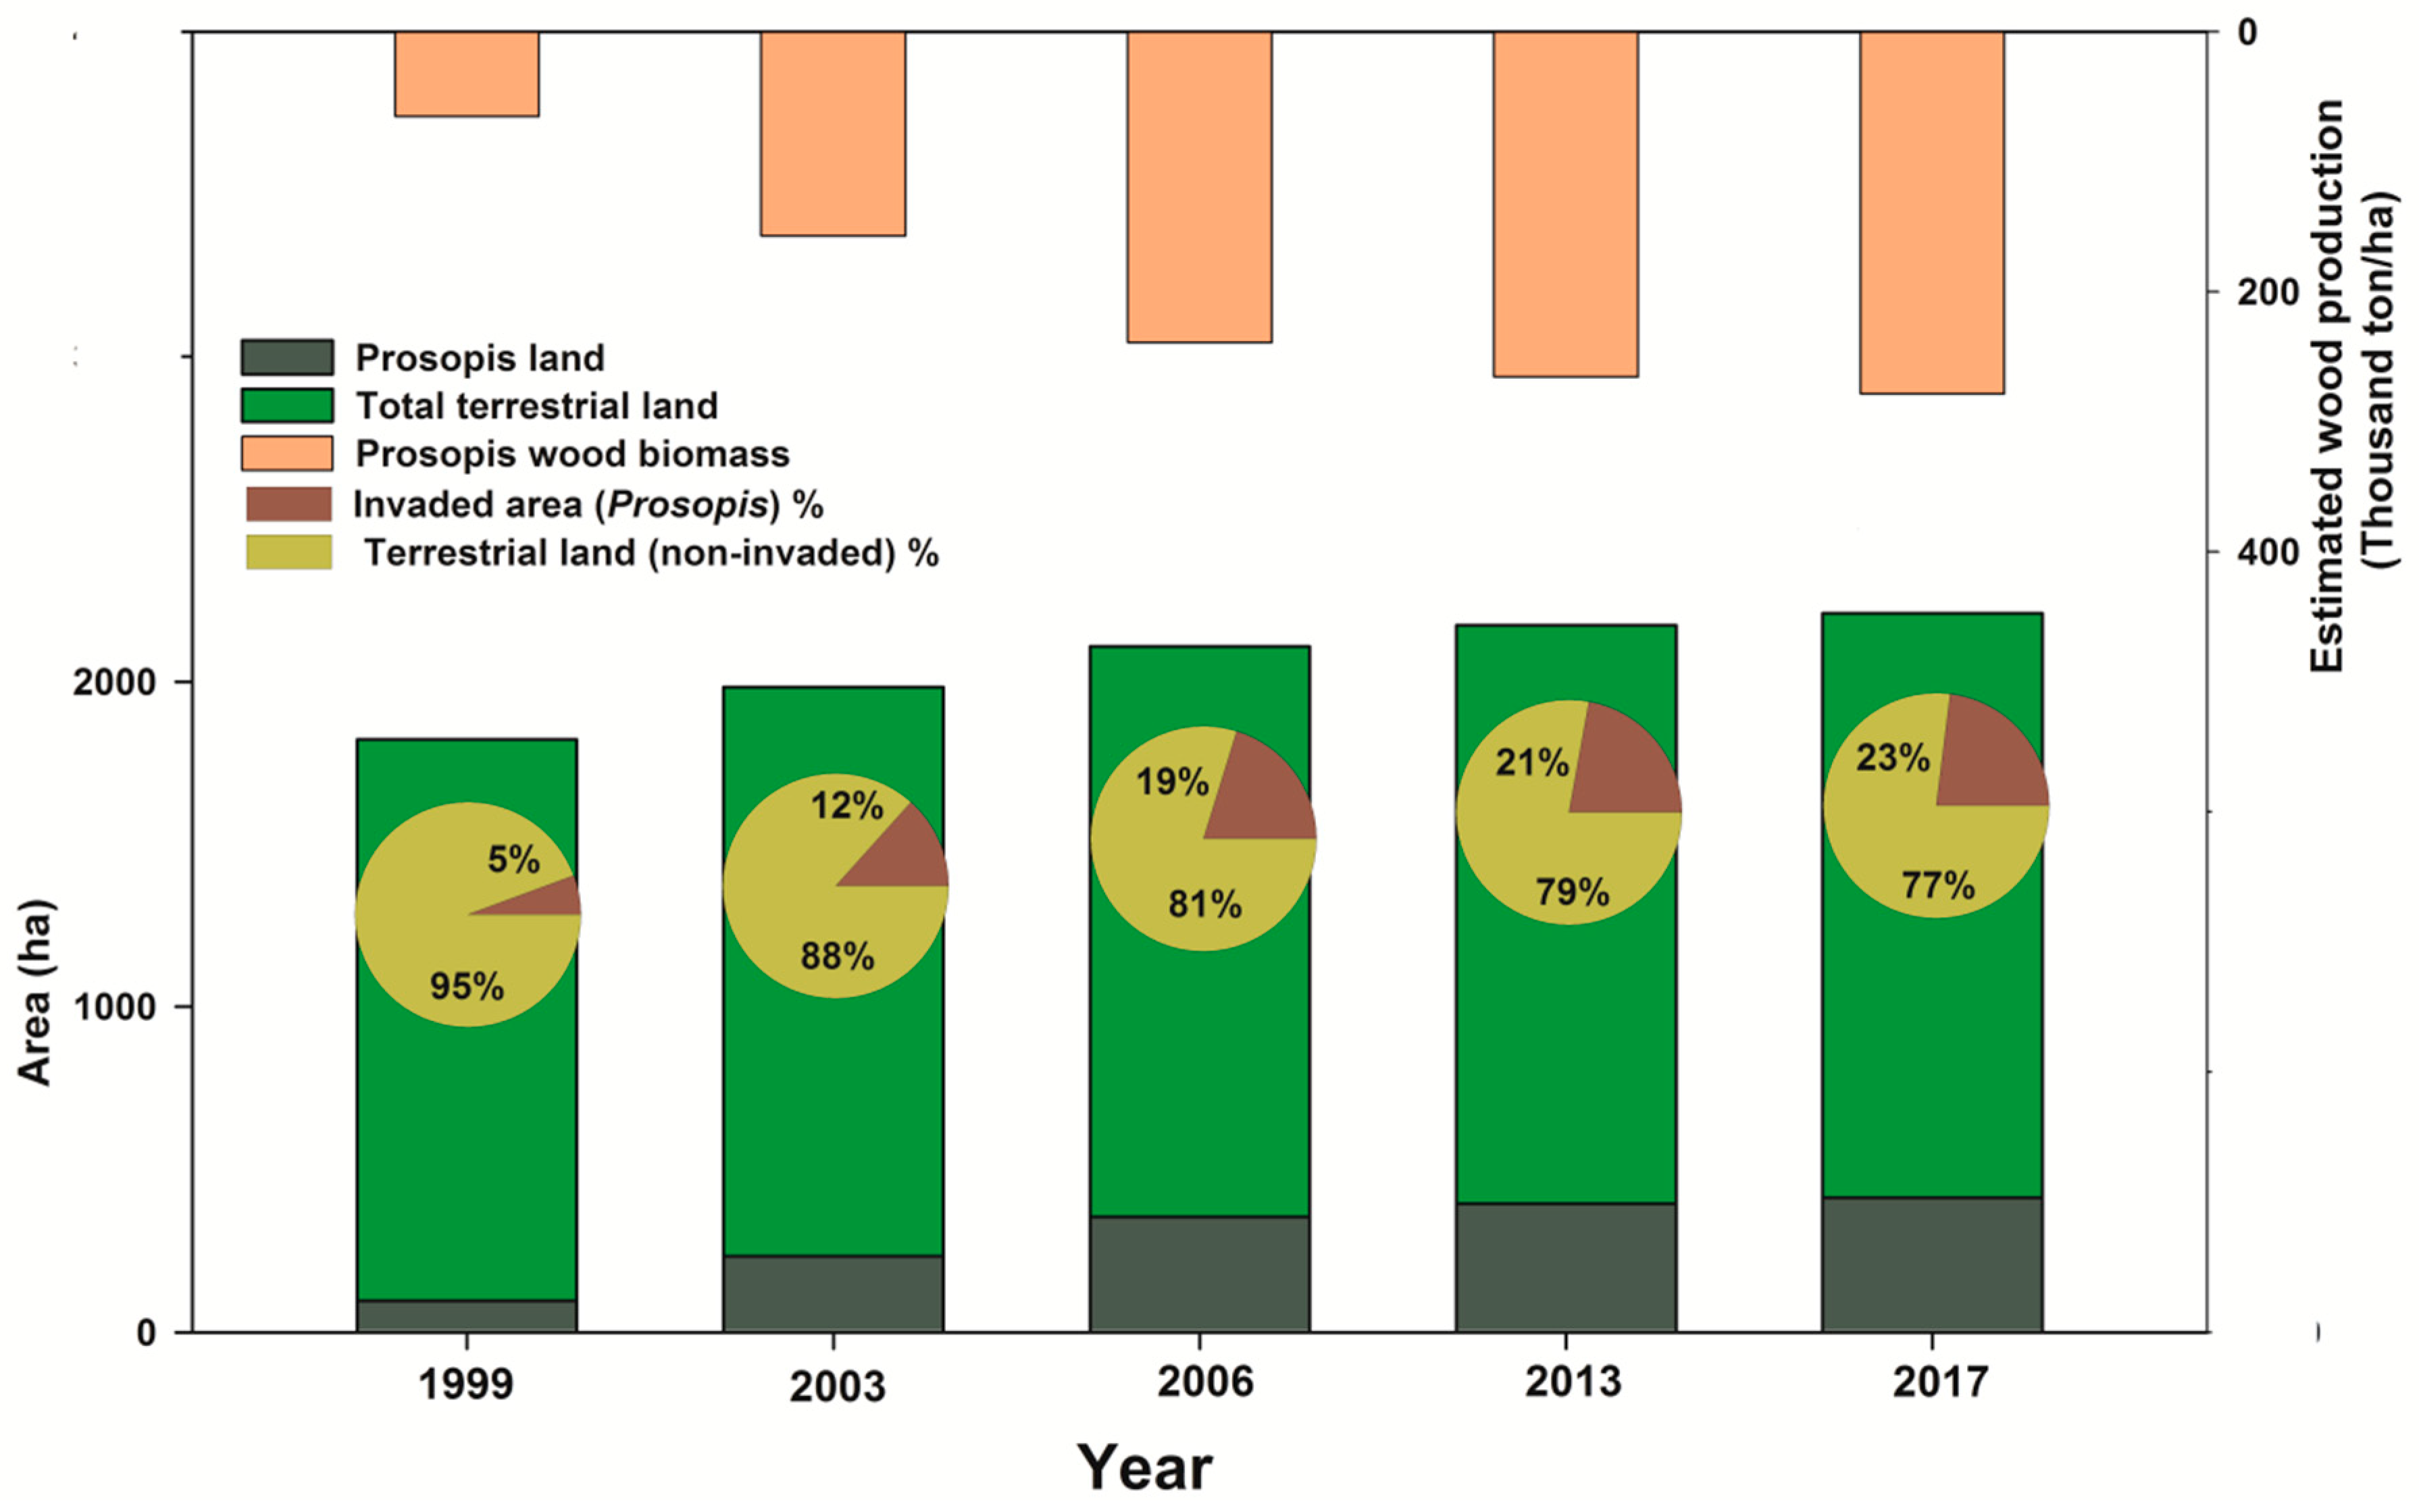
3.2. Impact of Invasive Prosopis Trees on Land Covers

Change detection assessment of Landsat ETM+ data (1999–2017) revealed significant changes in land cover class, especially conversion of soil and urban area to vegetation (Figure 3 and Figure 4). Image classification showed that the total area of soil, urban, and water areas reduced gradually over the last two decades (i.e., 1999 to 2017). Conversely, the total area of vegetation potentially increased (Figure 3). The total area of Sweimeh in 1999 was approximately 2106 ha, the bare soil area was 1219 ha, the urban area was 142 ha, vegetation covered an estimated area of 138 ha, and the water body area was approximately 382 ha (Figure 3). In 2017, the bare soil area was 1074 ha, the urban area was 132 ha, the vegetation area was 590 ha, and the water surface area was 310 ha (Figure 3). In fact, change detection analysis (2017 versus 1999) showed that bare land, urban, and water areas decreased by 6%, 11%, and 3%, respectively (Figure 4). Conversely, the vegetation area increased by 20% (out of the total studied area).
In our study, a ground plots were collected in 2017 to determine the Prosopis distribution within the vegetation class and for the accuracy assessment of remotely sensed data (Table 2). The main agricultural activities in the studied area (Sweimeh, Jordan Valley) are vegetable and forage crops production. Due to the extremely high temperatures during the summer, the production growing season is normally between February and May. No agricultural production is found in the summertime. To determine the Prosopis invasion percentage within the total vegetation class, all ground measurements and satellite images dates were in the summer (July)—the time when there was no agricultural crop interference. Therefore, the vegetation cover in the images represented mostly the non-agricultural crops, IPS (Prosopis), and sparse native plants such as Juncus, Phoenix, and Tamarix. In this study, a ground survey of vegetative blocks in 1999 and 2017 showed that the total area invaded by Prosopis was approximately 60% in 1999 and ranged from 65–75% (averaged 70%) of each block in 2017. Native species (grasses, shrubs) represented less than 40% of the total vegetation across the study period (1999–2017).
Figure 5 shows the terrestrial non-invaded area (soil, urban, and native vegetation) and invasion percentage by Prosopis between 1999 and 2017 as well as the estimated wood biomass production from Prosopis. Because the total area of Prosopis in 1999 was approximately 60% and was 70% for 2017 (about 10% change), we assumed that the percentage of IPS for the 2003, 2006, and 2013 was 65%. The total invasion percentage of Prosopis compared to non-invaded land (terrestrial) was 5% in 1999, 12% in 2003, 19% in 2006, 21% in 2013, and 23% in 2017.
In this study, a ground survey of 100 plots at Sweimeh, Jordan Valley, showed that the total number of trees ranged from 45 tree/ha (spares vegetation plots) up to 1350 tree/ha (dense vegetation), plant height 1.3–4 m, and stem diameter 12–40 cm. The estimated wood production per tree was approximately 450–550 kg, and the estimated wood weight of Sweimeh area was 675 ton/ha in the extremely invaded regions. In addition, the total area covered with Prosopis in 1999 was 92 ha, 222 ha in 2003, 337 ha in 2006, 374 ha in 2013, and 413 ha in 2017. Accordingly, the estimated wood production from Prosopis in Sweimeh area (million ton) was 0.62 in 1999, 1.50 in 2003, 2.27 in 2006, 2.53 in 2013, and 2.79 in 2017.

4. Discussion

4.1. Image Classification and Accuracy Assessment

An integrated sustainable management program is required to control IPS. These programs can be further reinforced through their linkage with advanced sensing technologies, such as satellite sensors data and GIS, by mapping and monitoring the IPS invasion [26]. Remotely sensed data can effectively contribute to invasion suitability mapping and sustainability of management practices [26]. High spatial resolution sensors may introduce potential intra-species spectral variability and decrease mapping accuracy, while higher spectral resolution data are restricted to smaller areas and expensive [14]. Alternatively, medium spatial resolution data, such as Landsat, are available at no cost [14,17]. The Landsat series of satellites stands out because they offer the richest and longest running historical archive (about 50 years), available free of charge and of reasonable multispectral, spatial and temporal resolution (16 days) [16,27,28]. Landsat-8 (OLI) was suitable for mapping large scale patches of IPS (Parthenium hysterophorus) while SPOT-6 was recommended for mapping small patches [14]. The overall accuracy for SPOT-6 was 86%, while the OLI accuracy was 83% [14].
Remotely sensed data have widely been used for the analysis of vegetation cover. However, the correlation of the results received from the multispectral sensors (e.g., Landsat) may not necessarily precisely correlate with ground truth data on vegetation status [29]. This is because these images might contain mixed pixels of different classes such as crop vegetation and urban areas [24]. In this study, the overall classification accuracy was 86% in 1999 and 80% in 2017. The slight decrease in accuracy percentage in 2017 (compared to 1999) can be attributed to the intensive assessment procedure in 2017. In 1999, we used historical data, interviews, and Google images, while the full ground reference survey assessment (100 plots) was carried out in 2017. In fact, the ground reference survey in 2017 enabled us to assess several points more precisely compared to Google and historical maps.
The accuracy percentage for studied classes was not similar (Table 2). For example, the producer and user accuracy for the water class in 2017 was between 87–100% and ranged from 75–78% for urban. Low accuracy for some classes could be attributed to Landsat ETM+ spatial resolution (30 m). Interestingly, the user and producer accuracy for all classes were above 74% across the study period. The classification method can be practically applicable if the accuracy of the remotely sensed model is higher than 70% [30]. Given that the accuracy assessment results were higher than the recommended thresholds, we believe that remotely sensed data from the Landsat ETM+ is a reliable source for assessing the land cover studies.

4.2. Impact of Invasive Prosopis Trees on Land Covers

The assessment of Landsat ETM+ data across the study period (1999–2017) revealed significant changes in land cover/land use (Figure 3 and Figure 4). During the study period, the vegetation (Prosopis and sparse native plants) area increased (20%) significantly, while the other classes decreased, especially the urban area. The primary source of income for Sweimeh village is the agricultural sector. This sector consumes approximately 60% of water resources in Jordan. The significant increase in the Jordanian population (4.4 to 9.8 million) between 2000 and 2019 increased the percentage of people living in water-scarce areas by 64% [31]. High demand for water coupled with a reduction in governmental subsidies for agriculture over the last two decades forced farmers to abandon their lands. In Sweimeh, the total population decreased by 40% between 2009 and 2015 (6500 versus 5000) [32]. That populations decreased in 2015 (compared to 2009) is consistent with our results which showed that the urban area decreased by 11% from 1999 to 2017 (Figure 3 and Figure 4).
The global review of Prosopis distribution and its effects showed that Prosopis was found in 129 countries [33]. In addition, several Asian and Mediterranean countries with no records of Prosopis are climatically suitable [33]. In this study, the integration of remotely sensed data and ground survey showed that the IPS (i.e., Prosopis) significantly increased in 2017 compared to 1999 (Figure 3 and Figure 4). Conversely, the urban area decreased by 11%. According to RSCN reports, the Sweimeh area had five natural water springs until 1995 [34]. Farmers were using those springs for agricultural activities [34]. Unfortunately, those springs dried up in the last 10 years. The RSCN attributed this issue to Prosopis invasion, which has an aggressive root system. Prosopis negatively affected the native species and livestock resources [9]. In South Africa, Prosopis species (Mesquite) was introduced to local communities to provide fodder and shade for livestock. However, the lack of management strategies increased the density of Mesquite trees and become IPS, adding more pressure on water and grazing resources [34]. The estimated control costs of Mesquite in Northern Cape Province, South Africa, (1.47 million ha) was approximately $9.5 million/year which exceeded the financial capabilities of public works programs [35]. Considering the results of ground survey and remotely sensed data (Figure 3 and Figure 4), we believe that Prosopis invasion is a critical socio-economic issue in the Jordan Valley.
Wang et al. [36] evaluated the relationship between IPS expansion and ecoregions at the global scale under climate change. They found that temperature changes were associated with IPS expansion in global ecoregions. In addition, coastal regions were severely affected by those species under climate change. Therefore, we believe that temperature plays a key role in Prosopis invasion in the Jordan Valley. Prosopis prefer warm and humid conditions and are characterized by rapid seedling emergence and high seed yield. When Prosopis grows in disturbed spots it can rapidly grow into dense and impenetrable density [3]. Prosopis juliflora introduced by Ministry of Agriculture for afforestation programs and as a shade tree along the streets in Jordan Valley region. Since then, it spread to large, dense patches in several parts of the Valley (including Sweimeh), competes with natural vegetation, and interfere with pedestrians and animals. Such infestations were also reported from several parts of world [3,37]. Aung and Koike [38] identified three stages during the invasion process, (1) the pre-establishment stage, (2) the invading stage, in which the percentage of attacked plots is increasing; and (3) the steady or saturated stage, in which all appropriate spots in the region have been occupied by the IPS [39]. Given that the total terrestrial land invaded by Prosopis in our study area (Sweimeh, Jordan Valley) increased from 6% in 1999 to 23% in 2017, we believe that the Prosopis status has exceeded the primary pre-establishment stage.
Prosopis trees produce a very high fruit yield and can form green cover even at regions where the annual precipitation is low (100 mm and 250 mm). In addition, a warm climate is the ideal condition for the IPS including Prosopis. The adaptation of Prosopis to dry conditions lead to higher and faster seedling growth compared to native ones [3,39]. Tamarix spp. are halophyte plants rich in polyphenolic compounds and used for medicinal purposes such as infections, wounds, and liver and spleen disorders [40]. Tamarix spp. improves soil physical and chemical properties especially in coastal saline–alkali soils [41]. In addition, Tamarix may substitute native flora in term of providing nesting habitat for riparian birds [42]. In fact, Tamarix removal reduces overall diversity and abundance of those riparian birds [42]. The Birds of North America Atlas [43] revealed that 49 species use Tamarix as a breeding habitat. However, the relative use of Tamarix and its quality as habitat differ significantly by geographic location and bird species [43]. In the Jordan Valley, Tamarix species have decreased extremely over the last few decades. This could be partially attributed to invasion by IPS specifically Prosopis. However, an obvious shift in the vegetation class from a distribution mainly near the coast in 1999 and away from the coast after 2006 is associated with the tourism projects in the coastal area of the Dead Sea which required cutting trees (especially, native Tamarix species) in that area (Figure 2).
The key barriers for effective management practices of widespread Prosopis species are related to a lack of adequate knowledge, prioritization, planning and funds, conflicts of interest, the properties of invaded soil, and genus ecology [1]. Therefore, monitoring of IPS including Prosopis requires an intensive, long-term management plan. A management plan should start with low affected spots and then move to the intensive invaded spots. Transplants should be pulled from the soil to ensure that they do not re-grow. Mechanical removal of Prosopis prior to the flowering coupled with chemical application is considered the most practical decision for the eradication of Prosopis species. However, this approach should be conducted for several consecutive growing seasons to reduce the seed bank resource. Therefore, prevention of significant invasion by those IPS to reach new habitat is the best approach to control their impacts. In addition, the development of new regulations or update the existing ones is critical to support the management programs [3,39].

4.3. Prosopis Benefits and Costs

Biological invasions are a major promoter of ecological and social change worldwide. These adverse invasions have introduced management programs to reduce impacts and, in some cases, enhance the benefits that some IPS can provide [1]. The net returns from clearing the IPS generated by value-added products (e.g., wood), the value of water not consumed by the IPS as well as the net income from grazing [44]. Ndhlovu et al. [45] assessed the effect of Prosopis invasion (>13% mean canopy cover) and clearing on the grazing capacity of heavily grazed Nama Karoo rangeland, South Africa. They found that Prosopis reduced grazing capacity by 34%. Interestingly, the removal process of Prosopis improved grazing capacity by 110% within 4–6 years, even under heavy grazing.
Invasion by IPS affects people’s livelihoods and well-being by providing both benefits and costs in different contexts [1]. The use of IPS by local people to generate extra income has posed conflicts of interests for their eradication due to the conservation and biodiversity concerns. However, if local communities can mitigate the negative effect of invasion by alien species, those conflicts can be avoided [46]. In fact, supporting local use of IPS (e.g., firewood, fodder) species may be a practical approach in controlling those species and, consequently, limiting their negative impacts [36].
Promoting the use of IPS by locals is a useful strategy towards the control of these species. The involvement of the local in the monitoring process is a remarkable approach because it is inexpensive and sustainable over years [46]. It involves local communities and, thus, authorities can leverage a huge human resource and enhances the livelihoods of local communities [46]. In this study, the total wood biomass of Prosopis in the Sweimeh area is estimated to be approximately 2.79 million tons. However, Prosopis trees are protected by Jordanian laws. Regulations penalize those who cut wild trees (including Prosopis) with six months of imprisonment. This explains the extreme invasion by Prosopis in the Jordan Valley over the last two decades.
Overall, the combined use of ground reference survey and remotely sensed data revealed that introducing IPS (Prosopis) resulted in critical problems in Sweimeh village and, consequently, forced residential farmers to abandon their farms and settle in cities. Therefore, the conservation regulations that deal with IPS should be revised to mitigate the IPS risk. Monitoring of Prosopis by involving the local people can reduce the negative effect of invasion and provide an extra income for the Sweimeh community.

Author Contributions

Conceptualization, M.J.T. and A.A.-A.; methodology, Z.M. and H.T.; software, validation and formal analysis, Y.A.O.; writing—original draft preparation, M.J.T. and A.A.A.; writing—review and editing, Y.A.O. All authors have read and agreed to the published version of the manuscript.

Funding

This research received no external funding.

Conflicts of Interest

The authors declare no conflict of interest.

References

  1. Shackleton, R.T.; Le Maitre, D.C.; van Wilgen, B.W.; Richardson, D.M. Identifying barriers to effective management of widespread invasive alien trees: Prosopis species (mesquite) in South Africa as a case study. Glob. Environ. Chang. 2016, 38, 183–194. [Google Scholar] [CrossRef]
  2. Manchester, S.J.; Bullock, J.M. The impacts of non-native species on UK biodiversity and the effectiveness of control. J. Appl. Ecol. 2000, 37, 845–864. [Google Scholar] [CrossRef]
  3. Thomas, J.; El-Sheikh, M.; Alfarhan, A.; Alatar, A.; Sivadasan, M.; Basahi, M.; Al-Obaid, S.; Rajakrishnan, R. Impact of alien invasive species on habitats and species richness in Saudi Arabia. J. Arid Environ. 2016, 127, 53–65. [Google Scholar] [CrossRef]
  4. Lazzaro, L.; Mazza, G.; d’Errico, G.; Fabiani, A.; Giuliani, C.; Inghilesi, A.F.; Lagomarsino, A.; Lastrucci, L.; Pastorelli, R.; Roversi, P.F.; et al. How ecosystems change following invasion by Robinia pseudoacacia: Insights from soil chemical properties and soil microbial, nematode, microarthropod and plant communities. Sci. Total Environ. 2018, 622, 1509–1518. [Google Scholar] [CrossRef] [PubMed]
  5. Pyŝek, P.; Jaroŝík, V.; Hulme, E.; Pergl, J.; Hejda, M.; Schaffner, U.; Vilà, M. A global assessment of invasive plant impacts on resident species, communities and ecosystems: The interaction of impact measures, invading species’ traits and environment. Glob. Chang. Biol. 2012, 18, 1725–1737. [Google Scholar] [CrossRef]
  6. Lowe, S.; Browne, M.; Boudjelas, S.; De Poorter, M. 100 of the World’s Worst Invasive Alien Species: A Selection from the Global Invasive Species Database; Invasive Species Specialist Group: Auckland, New Zealand, 2000. [Google Scholar]
  7. Abulaila, K. The Black Book of Invasive Alien Plant Species of Jordan, 1st ed.; Deutsche Gesellschaft für Internationale Zusammenarbeit (GIZ): Bonn, Germany, 2019; pp. 4–6. [Google Scholar]
  8. Meyer, R.E.; Bovey, R.W. Establishment of honey mesquite and huisache on a native pasture. J. Range Manag. 1982, 35, 548–550. [Google Scholar] [CrossRef] [Green Version]
  9. Wakie, T.T.; Laituri, M.; Evangelista, P.H. Assessing the distribution and impacts of Prosopis juliflora through participatory approaches. Appl. Geogr. 2016, 66, 132–143. [Google Scholar] [CrossRef]
  10. Shackleton, R.T.; Le Maitre, D.C.; van Wilgen, B.W.; Richardson, D.M. The impact of invasive alien Prosopis species (mesquite) on native plants in different environments in South Africa. S. Afr. J. Bot. 2015, 97, 25–31. [Google Scholar] [CrossRef]
  11. Schirmel, J.; Bundschuh, M.; Entling, M.; Kowarik, I.; Buchholz, S. Impacts of invasive plants on resident animals across ecosystems, taxa, and feeding types: A global assessment. Glob. Chang. Biol. 2016, 22, 594–603. [Google Scholar] [CrossRef]
  12. Joppa, L.N.; Visconti, P.; Jenkins, C.N.; Pimm, S.L. Achieving the convention on biological diversity’s goals for plant conservation. Proc. Natl. Acad. Sci. USA 2013, 6150, 1100–1103. [Google Scholar] [CrossRef] [PubMed]
  13. Andam, K.S.; Ferraro, P.J.; Pfaff, A.; Sanchez-Azofeifa, G.A.; Robalino, J.A. Measuring the effectiveness of protected area networks in reducing deforestation. Proc. Natl. Acad. Sci. USA 2008, 105, 16089–16094. [Google Scholar] [CrossRef] [PubMed] [Green Version]
  14. Kganyago, M.; Odindi, J.; Adjorlolo, C.; Mhangara, P. Evaluating the capability of Landsat 8 OLI and SPOT 6 for discriminating invasive alien species in the African Savanna landscape. Int. J. Appl. Earth Obs. Geoinf. 2018, 67, 10–19. [Google Scholar] [CrossRef]
  15. Kamenova, S.; Bartley, T.; Bohan, D.; Boutain, J.; Colautti, R.; Domaizon, I.; Fontaine, C.; Lemainque, A.; Viol, I.L.; Mollot, G.; et al. Chapter Three—Invasions Toolkit: Current Methods for Tracking the Spread and Impact of Invasive Species. In Networks of Invasion: A Synthesis of Concepts; Bohan, D.A., Dumbrell, A.J., Massol, F., Eds.; Academic Press: Cambridge, MA, USA, 2017; Volume 56, pp. 85–182. [Google Scholar] [CrossRef]
  16. Othman, Y.A.; Steele, C.; Van Leeuwen, D.; Heerema, R.; Bawazir, S.; St. Hilaire, R. Remote sensing used to detect moisture status of pecan orchards grown in a desert environment. Int. J. Remote Sens. 2014, 35, 949–966. [Google Scholar] [CrossRef]
  17. Othman, Y.A.; Steele, C.; St. Hilaire, R. Surface Reflectance Climate Data Records (CDRs) is a reliable Landsat ETM+ source to study chlorophyll content in pecan orchards. J. Indian Soc. Remote Sens. 2018, 46, 211–218. [Google Scholar] [CrossRef]
  18. Graf, W.; Kleinn, C.; Schall, P.; Nauss, T.; Detsch, F.; Magdon, P. Analyzing the relationship between historic canopy dynamics and current plant species diversity in the herb layer of temperate forests using long-term Landsat time series. Remote Sens. Environ. 2019, 232, 111305. [Google Scholar] [CrossRef]
  19. Shiferaw, H.; Bewket, W.; Alamirew, T.; Zeleke, G.; Teketay, D.; Bekele, K.; Schaffner, U.; Eckert, S. Implications of land use/land cover dynamics and Prosopis invasion on ecosystem service values in Afar Region, Ethiopia. Sci. Total Environ. 2019, 675, 354–366. [Google Scholar] [CrossRef]
  20. Willis, K. Remote sensing change detection for ecological monitoring in United States protected areas. Biol. Conserv. 2015, 182, 233–242. [Google Scholar] [CrossRef]
  21. Avitabile, V.; Baccini, A.; Friedl, M.A.; Schmullius, C. Capabilities and limitations of landsat and land cover data for aboveground woody biomass estimation of Uganda. Remote Sens. Environ. 2012, 117, 366–380. [Google Scholar] [CrossRef]
  22. Adam, E.; Mureriwa, N.; Newete, S. Mapping Prosopis glandulosa (Mesquite) in the semi-arid environment of South Africa using High-Resolution Worldview-2 imagery and machine learning classifiers. J. Arid Environ. 2019, 145, 43–51. [Google Scholar] [CrossRef]
  23. Othman, Y.A.; Steele, C.; Van Leeuwen, D.; St. Hilaire, R. Hyperspectral surface reflectance data used to detect moisture status of pecan orchards during flood irrigation. J. Am. Soc. Hortic. Sci. 2015, 140, 449–458. [Google Scholar] [CrossRef] [Green Version]
  24. Sawalhah, M.; Al-Kofahi, S.; Othman, Y.A.; Cibils, A. Assessing rangeland cover conversion in Jordan after the Arab spring using a remote sensing approach. J. Arid Environ. 2018, 157, 97–102. [Google Scholar] [CrossRef]
  25. USGS. Earth Explorer, United States Geological Survey. Available online: http://earthexplorer.usgs.gov/ (accessed on 1 July 2020).
  26. Rai, P.; Singh, J. Invasive alien plant species: Their impact on environment, ecosystem services and human health. Ecol. Indic. 2020, 111, 106020. [Google Scholar] [CrossRef]
  27. Goward, S.; Arvidson, T.; Williams, D.; Faundeen, J.; Irons, J.; Franks, S. Historical record of Landsat global coverage: Mission operations, nslrsda, and international cooperator stations. Photogramm. Eng. Remote Sens. 2006, 72, 1155–1169. [Google Scholar] [CrossRef]
  28. Banskota, A.; Kayastha, N.; Falkowski, M.J.; Wulder, M.A.; Froese, R.E.; White, J.C. Forest monitoring using landsat time series data: A review. Can. J. Remote Sens. 2014, 40, 362–384. [Google Scholar] [CrossRef]
  29. Lemenkova, P. Analysis of Landsat NDVI Time Series for Detecting Degradation of Vegetation; Geoecology and Sustainable Use of Mineral Resources. From Science to Practice; Belgorod State University: Belgorod, Russia, 2015; pp. 11–13. [Google Scholar]
  30. Smith, A.; Wooster, M.; Powell, A.; Usher, D. Texture based feature extraction: Application to burn scar detection in Earth observation satellite sensor imagery. Int. J. Remote Sens. 2002, 23, 1733–1739. [Google Scholar] [CrossRef]
  31. WDL. Water Scarcity Clock. 2020. Available online: https://worldwater.io/?utm_source=google&utm_medium=search&utm_campaign=Waterscarcityclock&campaignid=6444167483&adgroupid=75248439485&adid=376898575385&gclid=Cj0KCQjw3Nv3BRC8ARIsAPh8hgJFNr6OYjMwc92r0X73Xdv5TPVKllApKJ09uYADObhDZEakTQxtai4aAhtYEALw_wcB (accessed on 1 July 2020).
  32. Department of Statistics (DoS). Jordan. 2015. Available online: http://dosweb.dos.gov.jo/ar (accessed on 1 July 2020).
  33. Shackleton, R.T.; Le Maitre, D.C.; Pasiecznik, N.; Richardson, D. Prosopis: A global assessment of the biogeography, benefits, impacts and management of one of the world’s worst woody invasive plant taxa. AoB Plants 2014, 6, plu027. [Google Scholar] [CrossRef]
  34. Abu Yahya, A.; Ananbeh, Y. Rapid Assessment of Vegetation Cover in Swaimeh Eco-Park. The Royal Society for the Conservation of Nature (RSCN). Amman, Jordan, in Cooperation with the Integrated Ecosystem Management for the Jordan Rift Valley Project (IEM-JO). 2013. Available online: https://www.rscn.org.jo/annual-reports (accessed on 1 July 2020).
  35. Wise, R.M.; van Wilgen, B.W.; Le Maitre, D.C. Costs, benefits and management options for an invasive alien tree species: The case of mesquite in the Northern Cape, South Africa. J. Arid Environ. 2012, 84, 80–90. [Google Scholar] [CrossRef]
  36. Wang, C.-J.; Li, Q.-F.; Wan, J.-Z. Potential invasive plant expansion in global ecoregions under climate change. Peer J. 2019, 7, e6479. [Google Scholar] [CrossRef] [Green Version]
  37. Berhanu, A.; Tesfaye, G. The Prosopis dilemma, impacts on dryland biodiversity and some controlling methods. J. Dry Land 2006, 2, 158–164. [Google Scholar]
  38. Aung, T.; Koike, F. Identification of invasion status using a habitat invasibility assessment model: The case of Prosopis species in the dry zone of Myanmar. J. Arid Environ. 2015, 120, 87–94. [Google Scholar] [CrossRef]
  39. Griffith, A.B.; Andonian, K.; Weiss, C.P.; Loik, M.E. Variation in phenotypic plasticity for native and invasive populations of Bromum tectorum. Biol. Invasions 2014, 16, 2627–2638. [Google Scholar] [CrossRef] [Green Version]
  40. Bahramsoltani, R.; Kalkhorani, M.; Zaidi, S.; Farzaei, M.; Roja, R. The genus Tamarix: Traditional uses, phytochemistry, and pharmacology. J. Ethnopharmacol. 2020, 246, 112245. [Google Scholar] [CrossRef]
  41. Li, X.Q.; Xia, J.B.; Zhao, X.M.; Chen, Y.P. Effects of planting Tamarix chinensis on shallow soil water and salt content under different groundwater depths in the Yellow River Delta. Geoderma 2019, 335, 104–111. [Google Scholar] [CrossRef]
  42. Raynor, E.J.; Cable, T.; Sandercock, B. Effects of Tamarix removal on the community dynamics of riparian birds in a semiarid grassland. Restor. Ecol. 2017, 28, 778–787. [Google Scholar] [CrossRef]
  43. Sogge, M.K.; Sferra, S.J.; Paxton, E.H. Tamarix as habitat for birds: Implications for riparian restoration in the southwestern United States. Restor. Ecol. 2008, 16, 146–154. [Google Scholar] [CrossRef] [Green Version]
  44. Nkambule, N.P.; Blignaut, J.N.; Vundla, T.; Morokong, T.; Mudavanhu, S. The benefits and costs of clearing invasive alien plants in northern Zululand, South Africa. Ecosyst. Serv. 2017, 27, 203–223. [Google Scholar] [CrossRef]
  45. Ndhlovu, T.; Milton-Dean, S.J.; Esler, K.J. Impact of Prosopis (mesquite) invasion and clearing on the grazing capacity of semiarid Nama Karoo rangeland, South Africa. Afr. J. Range For. Sci. 2011, 28, 129–137. [Google Scholar] [CrossRef]
  46. Kannan, R.; Shackleton, C.M.; Krishnan, S.; Shaanker, R.U. Can local use assist in controlling invasive alien species in tropical forests? The case of Lantana camara in southern India. For. Ecol. Manag. 2016, 376, 166–173. [Google Scholar] [CrossRef]
Figure 1. The study area, annual precipitation, and temperature of Sweimeh, Jordan Valley, Jordan, in 2017.
Sustainability 12 05887 g001
Figure 2. Land cover distribution for the study area (Sweimeh Village, Jordan) during the study period, 1999–2017. Images were from Landsat (ETM+) sensor.
Sustainability 12 05887 g002
Figure 3. Land covers classes in the study area (Sweimeh, Jordan Valley) between 1999 and 2017. Data were from Landsat (ETM+) images, July 1999–2017.
Sustainability 12 05887 g003
Figure 4. Change detection percentage for bare soil, urban, vegetation, and water surface areas during the study period 1999–2017. Change detection analysis was derived using Landsat ETM+ sensor data.
Sustainability 12 05887 g004
Figure 5. Terrestrial non-invaded area (soil, urban, and native vegetation) and invasion percentage by Prosopis between 1999 and 2017. Prosopis invasion percentage in 2017 and 1999 were calculated from the ground surveys and upscaled to the entire region. Data for 2003, 2006, and 2013 were derived using Landsat ETM+ data.
Sustainability 12 05887 g005
Table 1. Classification scheme of vegetation density classes derived from Landsat ETM+ data.
Class TypeDescription
WaterAreas covered with either flowing or non-flowing bodies of water.
Soil (bare land)Bare rock and bare soils that are free of vegetation, or spares weeds (less than 5% per block) distributed randomly.
VegetationShrubs and trees. Areas used for production of food and fiber as well as natural vegetation, especially Prosopis.
Urban Residential areas. Areas where most of the land is covered by concrete and a city’s structures such as buildings and streets.
Table 2. Confusion matrix and accuracy assessment for land cover classes in 1999 and 2017.
Year WaterSoilUrbanVegetationTotalUser Accuracy
1999Classified data Water101001191%
Soil033133789%
Urban031511979%
Vegetation041253083%
Total1041172997
Producer accuracy100%80%88%86%
Overall Accuracy: 86%
2017Classified dataWater203002387%
Soil043375381%
Urban051812475%
Vegetation062283678%
Total20572336136
Producer Accuracy100%75%78%78%
Overall Accuracy: 80%

