Article

Does the Admixture of Forage Herbs Affect the Yield Performance, Yield Stability and Forage Quality of a Grass Clover Ley?

Institute of Crop Science and Plant Breeding, Department of Grass and Forage Science/Organic Agriculture, Kiel University, 24118 Kiel, Germany
*
Author to whom correspondence should be addressed.
Sustainability 2020, 12(14), 5842; https://doi.org/10.3390/su12145842
Submission received: 16 June 2020 / Revised: 7 July 2020 / Accepted: 16 July 2020 / Published: 20 July 2020
(This article belongs to the Section Sustainable Agriculture)

Abstract

:
It is unclear whether the use of multi-species swards is a suitable measure for climate change adaptation by achieving high and stable dry matter (DM) production and good forage quality in grazing systems. The objective of the study is to evaluate whether a complex rather than a simple grass clover mixture enhances performance under nitrogen (N)-deficient conditions due to greater diversity in plant functional traits. During a four-year field experiment, a three-species and a seven-species grass clover mixture were compared under one cutting-for-conservation and two simulated grazing (defoliation every three or four weeks) treatments. The results revealed a similarity in the DM yields of both seed mixtures, indicating that in the given conditions the species in the simple mixture already offered crucial yield-determining functional traits. Different growth patterns, however, led to higher intra-annual yield stability in the complex mixture. In the cutting-for-conservation system, DM yields were higher, but this came at the expense of reduced metabolisable energy and crude protein contents and lower inter-annual yield stability. We conclude that higher seeding costs for multi-species mixtures are compensated by greater yield stability while offering the potential for additional eco-system services like enhanced carbon sequestration and diverse food for pollinators.

1. Introduction

Legume-based forage production has the potential to facilitate profitable milk production systems both economically and environmentally [1]. However, despite a maritime climate offering favourable conditions for rain-fed grassland farming, the confinement system remains the predominant milk production system in most countries in north-west Europe. In grazing systems, pastures are commonly pure perennial ryegrass (PR, Lolium perenne L.) swards or, particularly in organic farming systems, PR-white clover (WC, Trifolium repens L.) and/or red clover (RC, Trifolium pratense L.) swards, which often provide excessive nitrogen (N) to the grazing animal. The results of several publications indicate that the environmental impact of milk production can be decreased by the inclusion of forage herbs in grass clover swards. By using diverse pastures, the N surplus in the forage and consequently excretion of surplus N in urine can be reduced [2]; for example, the inclusion of plantain (Plantago lanceolata L.) in a PR-WC sward can reduce both the extent of nitrate leaching [3] and the extent of nitrous oxide emissions after urinary N deposition [4]. In addition to the effect of lower urinary N excretion by animals [4], there is an indication of a plant effect by the exudation of biological nitrification inhibitors [3,4]. In a grazing system, both effects could be beneficial. Contents of condensed tannins in bird’s-foot trefoil (BT, Lotus Corniculatus L.) were found to further improve N efficiency in grazing animals [5], and moderate levels of condensed tannins in the diet reduce ruminal methane production [6] in many plant species without negative impacts on palatability or energy uptake [7]. Among other herbal species, sheep’s burnet (Sanguisorba minor Scop.) contains medium levels of condensed tannins and high levels of total phenolic compounds [8], for which in vitro experiments indicated a methane mitigating effect at limited reduction of nutrient utilisation, when combined with high quality forages [9].
Greater belowground productivity of grass clover swards containing plantain or caraway (Carum carvi L.) also increases the sward’s C sequestration potential [10,11], and in cutting for conservation treatments, enhanced plant species richness is linked with higher numbers of flowering plant species and thus with benefits for pollinators and higher pollinator species richness response [12].
Alongside environmental aspects, yield performance and agronomic traits can be positively affected by the admixture of forage herbs or legumes. A greater robustness to extreme weather events indicates the suitability of mixtures to prevent yield losses during drought events. Woodward et al. [13] observed that complex mixtures perform better during a warm and dry summer, while Hoekstra et al. [14] showed that deep-rooting species such as chicory (Cichorium intybus L.) and RC increase the sward’s tolerance to low soil moisture conditions in the upper soil layers. Furthermore, mixtures are more effective at suppressing weeds under different climatic conditions and soil N levels [15] and lower weed invasion occurs in multi-species swards of six or nine species compared with those of two or three species [16]. Higher milk yields have been observed in cows grazing grass clover swards containing plantain [17] or chicory [18]. The mixed swards provide a higher nutritive value and lead to higher dry matter (DM) intakes compared with pure PR-WC or PR-WC-RC swards. Furthermore, the admixture of forage herbs, such as chicory or caraway, into grass clover swards can increase the mineral content of herbage [19], whereas the admixture of bird’s-foot trefoil increases absorption of essential amino acids from the small intestine [5] and reduces the risk of bloat [20].
The aim of the present study was to simulate a grazing system and test whether the admixture of alternative forage species, for which positive agronomic or nutritional effects were reported, is an appropriate strategy for further increasing the value of a grass clover ley as a pasture and crop rotation element. The yield, stability, and quality potential of a complex seed mixture containing a variety of alternative forage legumes and forage herbs were therefore compared with those of a simple grass clover mixture commonly used in organic ley farming systems in north Germany. It was hypothesised that: (1) a multi-species sward, consisting of PR, three legume species and four forage herb species representing a wider range of plant functional traits achieves higher DM yields and (2) higher levels of inter-annual and intra-annual yield stability compared with a simple grass clover mixture consisting of PR and two legumes under simulated grazing conditions.

2. Materials and Methods

2.1. Experimental Design

A field experiment was conducted in four consecutive years (2014–2017) at Kiel University’s Lindhof research farm on the Baltic Sea shoreline at Eckernförde Bay in north Germany (54°27′ N, 9°57′ E), which has a temperate maritime climate. The relief of the area was formed by the Weichselian glaciation approximately 12,000 years ago. The bedrock is loamy and sandy marl, and the soil type varies between Cambisols, Luvisols, Stagnosols, and Coluvic Regosols [21]. The soil texture at the experimental site is sandy loam and loamy sand. The annual mean temperature is 8.7 °C and the annual mean precipitation is 785 mm (1981–2010). Due to the organic management, no mineral N fertilization occurs, but limestone, rockphosphate, and potassium sulphate are applied regularly. The average soil nutrient contents of the homogenous trial sites at 0–30 cm depth were 18.5 g P2O5, 16.5 g K2O, and 11.8 g Mg per 100 g dry soil at pH 6.2 and an average C/N ratio of 11. The experiment was integrated into the organic crop rotation (grass clover, oats, winter triticale, faba beans, winter spelt).
The experimental layout contained the factors seed mixture, defoliation frequency, and year, with year regarded as a random factor. Swards had been established the previous year as understoreys in spelt and were stubble-topped in August and grazed by sheep in October. Each year, the swards were sampled in their first full harvest year. The experiment was set up in a randomised split plot design with four replicates of all factor combinations of seed mixture and defoliation frequency. The whole plot factor was the seed mixture (Table 1), with the factor levels simple mixture (M1) and complex mixture (M2).
To achieve appropriate sowing rates for all species while maintaining a similar ratio of leguminous to non-leguminous species in both mixtures, the proportions of PR, RC, and WC were halved in M2 compared with M1. The aim of the seed mixture compilation was to have similar ratios of leguminous and non-leguminous species in both mixtures. The subplot factor was defoliation frequency with factor levels of three-weekly simulated grazing (3W), four-weekly simulated grazing (4W), and cutting for conservation (6W). The simulated grazing treatments were designed to represent the high defoliation frequencies of a rotational grazing system. Plots were sampled from April to November each year (Table 2), and in the simulated grazing treatments, a system of plot series, adapted from [22], was applied. This means that the subplots were divided further into three (3W) and four (4W) units, which were defoliated sequentially. This system enabled each factor combination to be sampled each week while each individual subplot unit was defoliated in line with its treatment (three-weekly or four-weekly). In total, each subplot unit was harvested 11 (3W) and eight (4W) times a year.
The calculation of the daily herbage increment, referred to below as the growth rate, was calculated slightly differently from the methodology described by [22]. Daily growth rates at any point in time were estimated on a weekly basis as the moving average of three consecutive subplot unit harvests in the 3W system and four consecutive subplot unit harvests in the 4W system. In the cutting-for-conservation system, four cuts were carried out each year and the cutting dates matched the regional harvesting dates for grass silage with regrowth intervals of six to seven weeks (Table 2).
The coefficient of variation (CV) was used as a parameter for yield stability [23] and was defined as the standard deviation divided by the mean and expressed as a percentage. The CV of annual DM yields was used to estimate yield stability between years (inter-annual) and the CV of weekly growth rates was used to estimate yield stability within years (intra-annual CV). For a further investigation of the inter-annual yield stability, the growing season was divided into four seasons (S1 to S4) separated by the harvest days of the 6W system. Accordingly, the start date of the sampling period, which is given in Table 2, was simultaneously the first day of season S1, which ended on the day of the first harvest in the 6W system. The last season S4 comprised the time span following the third harvest in the 6W system until the last sampling day of the simulated grazing systems (Figure 1). This means that one harvest occurred in the 6W system in each of the seasons.

2.2. Sampling

Weekly sampling of the plots was performed by hand by clipping a square of 0.25 m2 to 5 cm residual height. The respective plots were then mown to 5 cm stubble height with a plot-harvester (Haldrup, Løgstør, Denmark). The hand-cut samples were weighed and 100 g subsamples were taken for hand separation of species. DM content of the fractions, which was used to estimate the DM yields, was determined after oven-drying for 48 h at 58 °C. Since the initially low weed invasion due to the establishment of the swards as understoreys in a cereal stand was further reduced by sheep grazing in the year of establishment (removal of annual weeds such as Stellaria media and Capsella bursa-pastoris) and hand-weeding of perennial weeds (Cirsium arvense, Rumex obtusilolius) before the start of the experiment, the occurrence of unsown species was negligible and is not further documented here.

2.3. Sample Analysis

The samples were milled through a 1 mm sieve and subsequently scanned twice using a NIRS-System 5000 monochromator (Foss NIRSystems, Silver Springs, MD, USA) and WinISI II software (Infrasoft Internationals, South Atherton St., PA, USA) to estimate forage quality parameters. Calibration and validation were based on sample subsets of PR, legumes, and forage herb species, which represented the whole spectral and chemical variability.
The following analyses of the subset samples were performed according to [24]; method numbers are indicated. The N concentration was directly determined with an elemental analyser (Vario Max CN, Elementar Analysensysteme, Hanau, Germany) applying the DUMAS combustion method (4.1.2; the crude protein content (CP) was calculated from the N content (CP = N × 6.25). The concentrations of NDF (6.5.1; assayed with heat-stable amylase (aNDF)) and ADF (6.5.2) were analysed using the Fiber Analyzer Ankom A2000 (Ankom Technology, Macedon, NY, USA). The ADF values are expressed exclusive of residual ash (ADFom). Ash and crude lipids (CL) were analysed using methods 8.1 and 5.1; the in-vitro cellulase technique developed by [25] was used to determine the content of enzyme soluble organic matter (ESOM); and finally, the metabolisable energy (ME) content was estimated according to [26] as follows (Equation (1)):
ME (MJ/kg DM) = 5.51 + 0.00828 × ESOM (g/kg DM) − 0.00511 × Ash (g/kg DM) +
0.02507 × CL (g/kg DM) − 0.00392 × ADFom (g/kg DM),
The statistical key figures of the relevant NIRS calibration and validation are given in Table 3. All parameters were validated using randomly selected independent samples, which were not included in the calibration subsets.

2.4. Statistical Analysis

Statistical analysis was performed using the software R [27] with the packages “nlme,” “lsmeans,” and “raster.” After graphical analysis of residuals, the data were considered as normally distributed and heterogenic in variance. Mixed models were formed according to [28,29]. The experimental year was regarded as a random variable in all models except for the intra-annual CV, and all models contained all interaction terms between the main factors. The statistical model used to compare annual DM, ME, and CP yields and the average ME and CP contents, and the inter-annual and intra-annual CV contained the fixed variables “seed mixture” and “defoliation frequency.” The model used for the comparison of weekly growth rates also contained the variable “week” with 34 levels (calendar weeks 14–47) and the model used for the comparison of the intra-seasonal CV also contained the variable “season” (see Section 2.1). Quality parameters were evaluated up to calendar week 45 only to avoid inaccuracy due to the very small sample sizes at the end of the growing season not allowing an adequate NIRS analysis. To indicate differences, the following significance levels were used: p < 0.05 = *, p < 0.01 = **, p < 0.001 = ***.

3. Results

3.1. Climate and Weather

Average monthly temperature and precipitation data from the experimental years and the long-term are presented in Table 4. The data for the experimental years was collected on site and the long-term data came from the German Weather Service [30,31] for a location 15 km away from the trial site (Kiel-Holtenau). Averaged across the experimental years, the temperatures were above the long-term average, with the greatest deviations in the autumn and winter months. Monthly rainfall varied greatly between the years, being higher per month on average than the long-term average except in March and October. No extreme events of drought or rainfall occurred during the experimental periods.

3.2. DM Yields

Defoliation frequency had a significant effect on the total annual DM yield (Table 5). An increase in defoliation frequency (from 6W to 4W and from 4W to 3W) led to a significant yield reduction irrespective of the seed mixture. The DM yields of RC and the group of forage herbs (including all non-leguminous species in M2 except PR) were similarly affected by defoliation frequency. DM yields were highest in the 6W system. The DM yields of PR, WC, and bird’s-foot trefoil (BT) did not differ significantly between defoliation frequencies. The factor seed mixture had significant effects on the DM yields of PR and RC. The higher yields occurred in M1 irrespective of the defoliation frequency.

3.3. Quality Parameters

The ME content of the total herbage was significantly affected by seed mixture and defoliation frequency, while the ME content of individual species was only significantly affected by defoliation frequency. In M2, the ME content of the total herbage was lower than in M1, irrespective of the defoliation frequency, and an increase in the defoliation frequency increased the ME content irrespective of the seed mixture (Table 6). The latter also applied to the ME contents of all individual species except BT. The effect of enhanced defoliation frequency was greatest for the group of forage herbs, followed by WC, RC, and PR. The results of the analysis of variance (ANOVA) of the CP content and the respective mean values are presented in Table 7. As with the ME content, the CP content of the total herbage was significantly influenced by both defoliation frequency and seed mixture, with no significant interaction. The CP content was positively affected by an increase in the defoliation frequency and was higher in M1 than in M2. The CP content of PR was affected in a similar way by both factors, while the CP contents of RC and WC increased with greater defoliation frequency, but did not differ between seed mixtures. BT and the group of forage herbs showed differences between defoliation frequencies. The highest CP contents were found in the three leguminous species, followed by the group of forage herbs and PR. The greatest difference between the 3W and the 6W systems occurred in RC.
Despite differences in ME and CP contents, the annual yields of ME and CP did not vary between seed mixtures (Table 8). Defoliation frequency affected ME and CP yields in contrasting ways. While the average annual ME yield was higher in the 6W system than in the other two systems, the CP yield was higher in the 3W and 4W systems than in the 6W system.

3.4. Growth Rates

The daily growth rate of the total herbage differed significantly between weeks, irrespective of seed mixture and defoliation frequency. The variations in the daily growth rate are illustrated in Figure 2. The growth curve of BT has been omitted due to very low growth. The total herbage growth rates did not differ between seed mixtures and neither did the growth rates of PR or WC. The growth rate of RC in calendar week 36 was higher in M1 than in M2. Since the effect of defoliation frequency on the daily growth rates was not significant, the graph shows the average of both simulated grazing treatments.
The ME content of the total herbage regrowth differed between seed mixtures and defoliation frequencies, and both were in relation to calendar week (Table 9). In twelve out of 34 calendar weeks, mostly at the start and end of the growing season, the ME content of the regrowth was significantly higher in M1 than in M2. The difference between defoliation frequencies was most apparent during the summer months (Figure 3). The CP content of the total herbage regrowth did not differ between seed mixtures but did differ between defoliation frequencies. In ten weeks, the CP content was higher in the 3W system than in the 4W system.

3.5. Inter-Annual CV of Annual and Seasonal DM Yields

The inter-annual CV describes the stability of annual yields between the experimental years. A high CV means a wide variability in relation to the mean, and thus low yield stability. The results of the ANOVA of the inter-annual CV of annual DM yields (Table 10) showed an effect of defoliation frequency irrespective of the seed mixture. The inter-annual CV was higher in the 6W system (CV = 20.36) than in the 3W (CV = 15.36) or 4W systems (CV = 12.84). The difference between seed mixtures was not significant.
The inter-annual CV of seasonal DM yields was affected by defoliation frequency, interacting with season (Table 10). In seasons S2, S3, and S4 and similarly to the inter-annual CV of annual DM yields, the CV was significantly smaller in the 3W and 4W systems than in the 6W system (Figure 4). Differences between seasons occurred in the 3W and 4W systems, with the inter-annual CV being higher in S1 than in the other seasons.

3.6. Intra-Annual CV

The intra-annual CV describes the stability of growth rates between weeks in the simulated grazing treatments. The results of the ANOVA are presented in Table 11. The analysis of the intra-annual CV of DM regrowth and its ME content revealed a significant difference between seed mixtures. The lower CV and higher stability occurred in M2 (Table 11). Defoliation frequency affected the intra-annual CVs of the ME and CP contents, with both being lower at 3W than 4W defoliation.

4. Discussion

4.1. DM Yields

Broad experimental research has been conducted in the past to analyse growth dynamics of grassland species [22,32,33,34], and a wide variety of studies have examined the effect of specific defoliation frequencies or varying regrowth intervals [35,36,37,38]. Focusing on simple grass clover mixtures or different grass species, the studies have consistently found that a shortening of regrowth intervals leads to lower herbage yields, especially at the start of the vegetation period, whereas extended regrowth intervals of up to eight weeks increase total annual DM yields.
The results of the present study confirm these observations for a multi-species sward as well. Irrespective of the seed mixture, the total herbage yield decreased significantly with an increase in defoliation frequency. The yields of RC and the group of forage herbs were affected most. A comparison of the proportions that the different species contributed to the total DM yield showed that the highest proportion from RC occurred in the 6W system, whereas the highest proportions from all the other species occurred with more frequent defoliation. Nevertheless, in the 3W and 4W treatments too, RC was the highest-yielding species despite its low tolerance of frequent defoliation. According to [39], a decrease in yield from RC should be expected after the first year of cultivation, making RC more suitable as a mixture component in short-term leys rather than in permanent pastures. Belesky et al. [40] found a 26% higher herbage yield at longer regrowth intervals when comparing three-weekly and six-weekly defoliation of pure chicory stands, which is consistent with the effect of defoliation frequency on the group of forage herbs in the present experiment, with chicory as the dominating species. The DM yields of PR did not differ significantly between defoliation frequencies, in contrast to the results of [41] who found an increase in DM yields with a decrease in defoliation frequency when analysing pure PR stands. In the current experiment it was assumed that the strong growth of RC reduced the production potential of PR under infrequent defoliation. The DM yield of white clover was not affected by defoliation frequency, thus confirming its high suitability for pasturing.
The compilation of the seed mixtures aimed to achieve appropriate sowing rates for all species in both mixtures while maintaining a similar ratio of leguminous to non-leguminous species. Hence the sowing rates of PR, RC, and WC were 50% lower in the complex mixture than in the simple mixture. The comparison of DM yields between the mixtures showed that the difference in sowing rate affected the three species to different extents. In the complex mixture, the yields of RC and PR were significantly lower, but represented more than 50% of their yields in the simple mixture. This indicates that in the simple mixture the growth of these species was restricted by inter-species or intra-species competition, which appeared to be lower in the complex mixture. The DM yields of the forage herbs and BT totalled just 18 to 21% of the total DM yield of the complex mixture. The DM production of WC did not differ between seed mixtures; the stoloniferous growth pattern allowed high dispersion even at the lower sowing rate. The growth curves of WC show that in the complex mixture a slower DM increment at the start of the season was compensated by maintaining high growth rates later in the season, when maximum growth of RC was limited by too few plants due to the lower sowing rate.
Very low DM production was observed for BT despite the beneficial conditions for legumes in the experimental design. The experiment was included in the five-year crop rotation on the experimental farm and each experimental year represented the first year of a two-year ley, which was established by undersowing a winter cereal in the May of the previous year. Due to the farm being managed in line with organic farming principles, no mineral N fertiliser was applied, and the N supply of the leys relied mainly on the symbiotic nitrogen fixation (SNF) of the legumes. This means that in each of the experimental years, the soils were N depleted and the legumes had a competitive advantage over the non-leguminous species. Plantain and chicory were the key species for determining the DM yield of the group of forage herbs, whereas caraway and burnet persisted only at a low occurrence in the swards of the complex mixture. Like RC, chicory had a competitive advantage through its deep taproot, which allows it to reach and utilise nutrients in soil layers below the rooting zone of the shallow-rooting species PR and WC [42].
Sanderson et al. [43] found that overyielding of low-diversity treatments is reasonable when they contain few species, but ones that are well adapted to the given environment. This applies to the current experiment, except that both seed mixtures were composed to ensure high herbage production by including highly productive species and provided similar DM yields. In particular, RC has been shown to increase the DM yields of grass clover swards [39]. Despite the inclusion of less productive species in M2, DM yields were similar for both mixtures. Due to the specific seed mixture composition and the fact that none of the species were cultivated in pure stands, the experiment was not designed to allow quantification of a diversity effect. Thus, it is unclear whether the average monoculture yield would have been higher or lower than the observed DM yields. Considering the growth limitations for the non-leguminous species (low soil N contents and the absence of fertilisation during the experimental periods), it can be assumed that the average monoculture yield would have been lower due to anticipated lower yields of the non-leguminous species when grown in pure stands. SNF and adjacent transfer of fixed N2 from the legumes to the non-leguminous species, as described by [44], was enabled in both mixtures. Conversely, some species with a low occurrence in the mixed sward might have developed better in pure stands due to less shading from other plant species. Further complementarity between species, irrespective of their ability to fix atmospheric N, as found by [45,46] in grass clover mixtures and by [47,48] in mixtures without legumes, might have occurred. Since the increase in species diversity did not increase DM yields, in contrast to the findings of previous studies [49,50], it is likely that the species that were abundant in M1 offered functional traits being crucial for herbage production at the experimental site and that the species added in M2 did not enhance positive complementary effects and are thus characterized by trait redundancy.
An explanation for the lack of overyielding from the simple mixture might be that with the admixture of species, the replacement of species with similar functional traits outweighed a potential complementation of functional traits. The group of forage herbs partially replaced PR as a non-leguminous species. In terms of growth morphology, chicory with its deep taproot and erect growth habit offered similar traits to RC. Simultaneously, BT offered the ability of SNF but was only able to replace RC in this trait to a negligible extent due to its low competitiveness for light.
The similar DM yields of both mixtures indicated that the number of species within a mixture was of minor importance and supports the findings of [51] that functional group composition is more important in productive grasslands than species diversity. Similarly, [23], who retrospectively analysed multiple biodiversity experiments, and [52], who compared a wide variety of simple and complex mixtures, conclude that the composition of the mixture might be more important than its complexity.

4.2. Herbage Quality

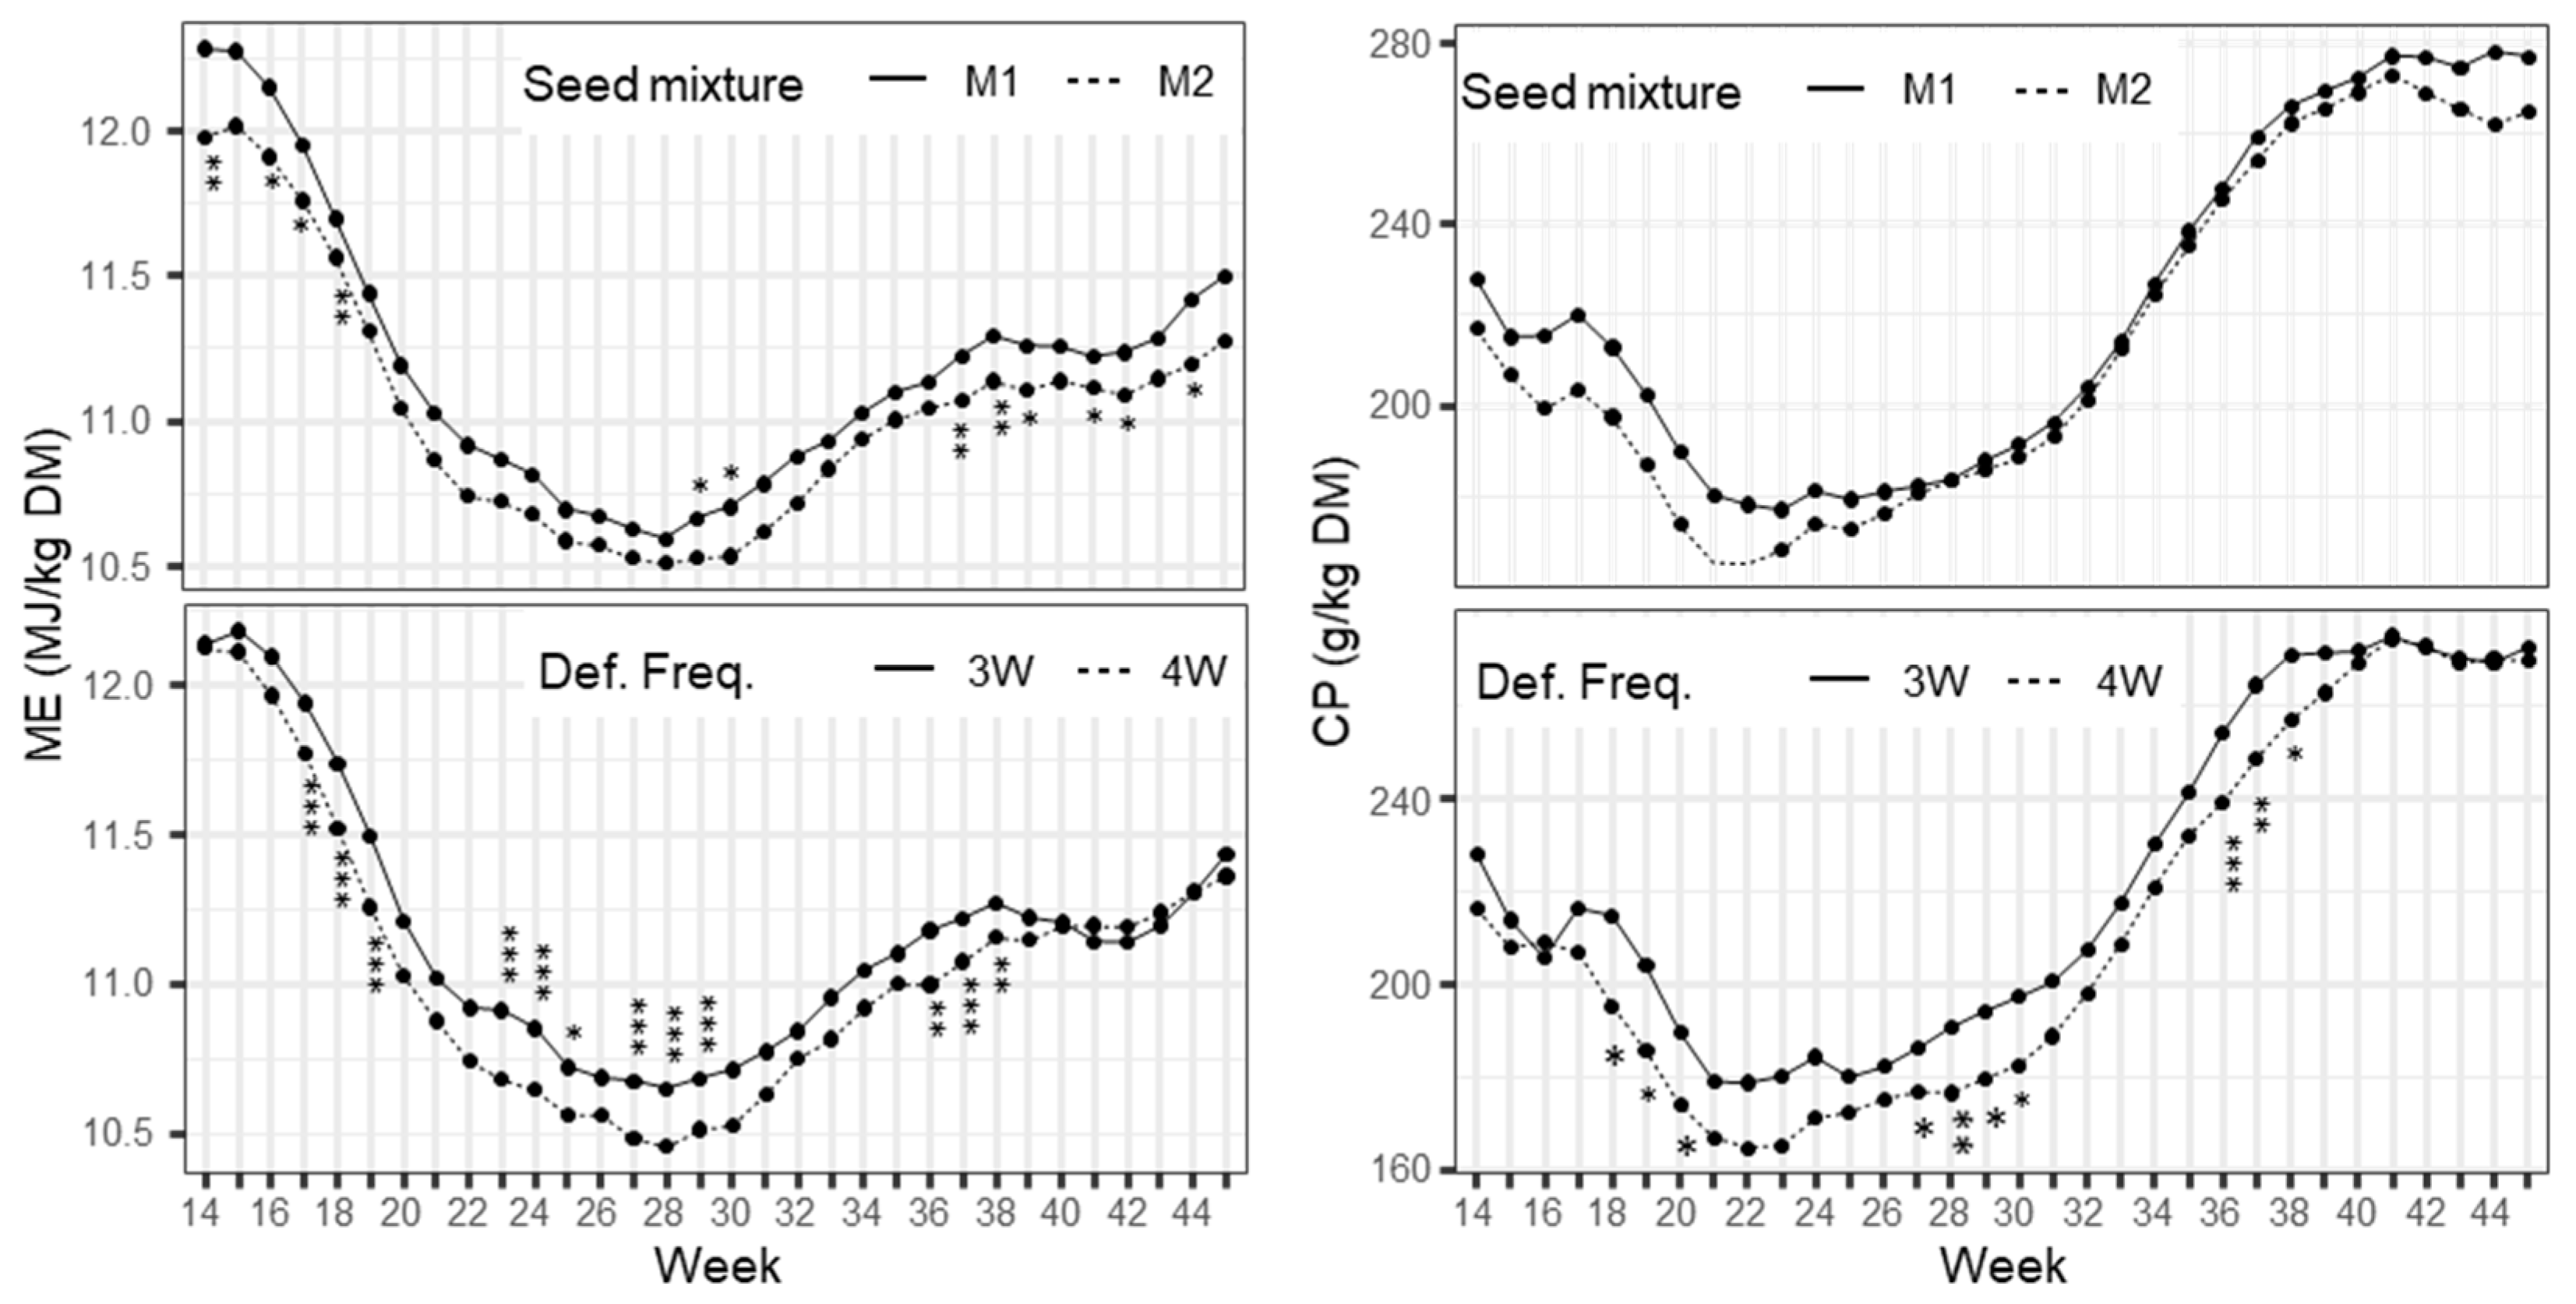
The results showed that the seed mixture had a significant effect on the ME content of the total herbage, but not on the ME content of individual species. This indicates similar sward densities in both mixtures, not affecting growth morphology of individual species. The low ME content of the group of herbs, in particular narrow-leafed plantain and chicory, caused the difference in the ME content of the total herbage. The CP content of PR was significantly lower in the complex mixture, which indicates a lower N supply to PR. Reasons for this could have been a smaller transfer of N from legumes due to their lower occurrence or higher competition for the available soil N due to the concomitance of other non-leguminous species.
According to the model developed by [53], SNF averaged 40.51 g/m2 in the simple mixture and 29.32 g/m2 in the complex mixture. The respective N yields of the total herbage were 31.83 and 31.29 g/m2. This might be an indication that higher competition for symbiotically fixed N in M2 due to the lower legume proportion associated with lower SNF contributed to the lower CP content of PR in M2. Additionally, in M2 non-leguminous species other than PR competed for the plant-available N.
However, it should be noted that the model was not explicitly designed for mixed pasture swards containing non-leguminous plants other than PR. The highest yielding species in the group of forage herbs was chicory, which potentially reaches N deposited in deeper soil layers than PR [54], but due to differences in the root morphology receives less N from legumes [44], which makes a higher transfer of fixed N2 to PR than to chicory likely. Høgh-Jensen et al. [54] found a higher exploitation of soil N by chicory, which leads to higher accumulation of herbage N compared to PR. Their results from experiments using the 15N plant-labelling technique indicated that chicory is not a good competitor for N in upper soil layers, but can access N sources in deeper soil layers that are less accessible for other species. This suggests that chicory did not solely rely on the same N sources as PR, and contributed to the total N yield by a higher accumulation of N from deeper soil layers.
As grazing dairy cows are often exposed to excess N [2] and as milk production might be limited not by a lack of CP but rather by a surplus of CP in relation to the ME supply of a pasture [55], a lower CP content, as found in the complex mixture in the present experiment, might be more of an advantage than a drawback. For example, Totty et al. [2] showed that grazing a diverse pasture, including chicory, plantain, and big trefoil besides high-sugar PR and WC, is beneficial for animal metabolism and the environment as it avoids the large urinary N losses that can occur when simple grass clover swards are grazed. However, in this regard it should be noted that since the present experiment resembled a rotational grazing system only in terms of high defoliation frequencies, no account was taken of pasture-specific effects such as nutrient return or trampling and, in terms of nutritional aspects, to the selective foraging behaviour of animals that influences the botanical and chemical composition of the actual intake.
Consideration of the total CP yields, which were similar for both mixtures, showed that the differences observed in the concentrations did not have an impact on yields due to a slightly higher DM production (n.s.) of M2. This means that despite the lower yield of legumes, a similar amount of N was accumulated in the herbage overall. As described above, the deep-rooting trait of chicory might have contributed to the N supply of the mixed sward. Furthermore, Nyfeler et al. [56] found that grasses stimulated the amount of symbiotically fixed N, with the effect being greatest at legume proportions of 40–60%. Although in the present experiment the yield of PR was not higher in M2 than in M1, the yield of all non-leguminous species together was higher, which might have induced a similar effect.
Unlike morphological traits such as deep rooting, the ability to increase the N content of the soils via SNF is offered by leguminous species only. Irrespective of defoliation frequency, the proportion of legumes at 75.5% of DM was significantly higher in M1 than in M2 at 61.9% of DM. Thus, the admixture of BT (as the only additional leguminous species) did not fully compensate for the lower SNF by RC in M2, which resulted in a lower CP content of the total herbage. These results coincide with the findings of [52] that the proportion of legumes, rather than species diversity, determines the CP content of the herbage.
The feeding quality of the herbage in terms of ME content and CP content was negatively affected by extending the regrowth interval. As expected, this effect was consistent across all species since the ongoing maturation at long regrowth intervals leads to an increase in the proportion of stem and a decreasing digestibility in all plant parts [57]. The effect of defoliation frequency on the average annual ME yield was masked by the difference in DM yields. Despite the decrease in ME content at the extension of the regrowth interval, the yield of ME was significantly higher in the 6W system than in the simulated grazing treatments. The average annual CP yields, however, were significantly higher in the simulated grazing treatments than in the 6W system. This indicates that the effect of defoliation frequency on the CP content was, in contrast to the effect on the ME content, too great to be masked by the DM yield differences. These results show that despite differences in the ME content and CP content, both mixtures achieved similar annual DM, ME, and CP yields. The effect of defoliation frequency on annual ME and CP yields, however, was adverse. Whereas higher CP yields occurred at high defoliation frequencies, the highest ME yields occurred at 6W defoliation.

4.3. Yield Stability

The coefficient of variation is a well-established metric to describe the temporal stability of yields [23,51]. Nevertheless, various authors point out that, depending on the research question being addressed, CV is not necessarily the best parameter for describing yield stability [42,58]. Carnus et al. [58] showed that CV can be misleading under certain circumstances, e.g., when low levels of the functional response are desired, or the level of the functional response is not relevant at all. In the present study, the functional responses were the yields of DM, ME, and CP for inter-annual CV and weekly growth rates for intra-annual CV. Thus, the desired state of the functional response is a high mean at a low standard deviation. Therefore, CV was considered to be a meaningful parameter when evaluated in combination with the respective mean and SD.
The seasonal distribution of the variability of forage growth is relevant for both grazing and zero-grazing systems. Late summer months are particularly prone to forage shortages. The widest variation in growth rate occurs during the generative phase in spring, which is favourable because it means a rapid increase in growth rate which can be managed by conservation for winter-feed production. The opposite situation, however, occurs in summer where there is a greater risk of shortages due to lower vegetative growth and higher risks of irregular precipitation. If there are no trade-offs in terms of lower average growth rates, an even yield distribution is desired in grazing systems. A high yield stability between years is important for planning the annual feed budget and is achieved when the mixture shows a low yield response to variations in the weather conditions. This is reflected in a low inter-annual CV. In the present experiment, the inter-annual CV was not affected by the seed mixture, which is in agreement with the results of [23] who analysed herbage yield variability of mixtures of grasses and legumes from three experiments and found no consistent relationship between the number of species and the inter-annual CV.
The results from [42] showed that a higher species richness can potentially increase yield stability during drought events, and several studies have found a higher yield potential during warm and dry periods for mixtures containing chicory or plantain [13,59]. During drought conditions, species increase the nutrient utilisation from deeper soil layers, which suits deep-rooting species that can access these layers more easily [14]. However, due to the reduced yields of RC in M2, the difference between the seed mixtures’ proportion of deep-rooting species was small in the present study and the absence of major weather events, such as drought, within the experimental years did not allow conclusions to be drawn on the different drought tolerance of the seed mixtures.
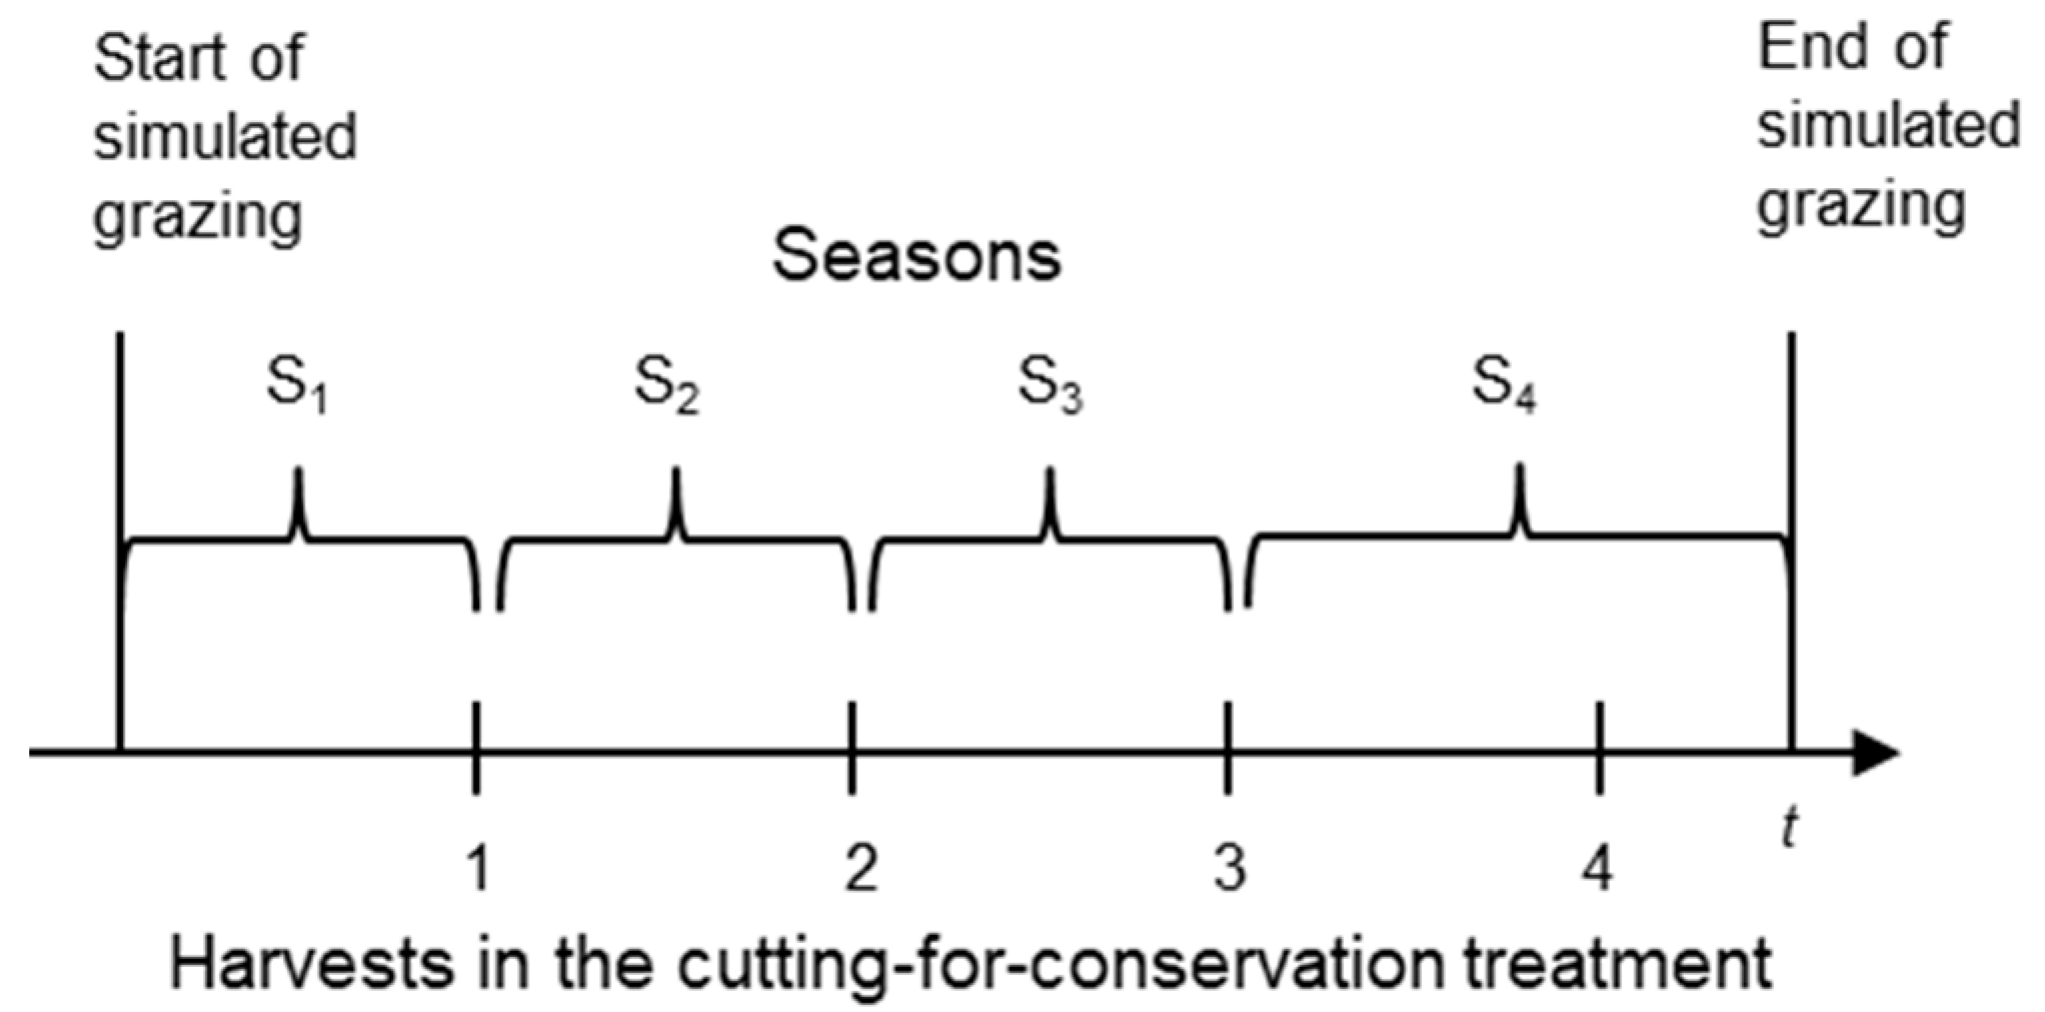
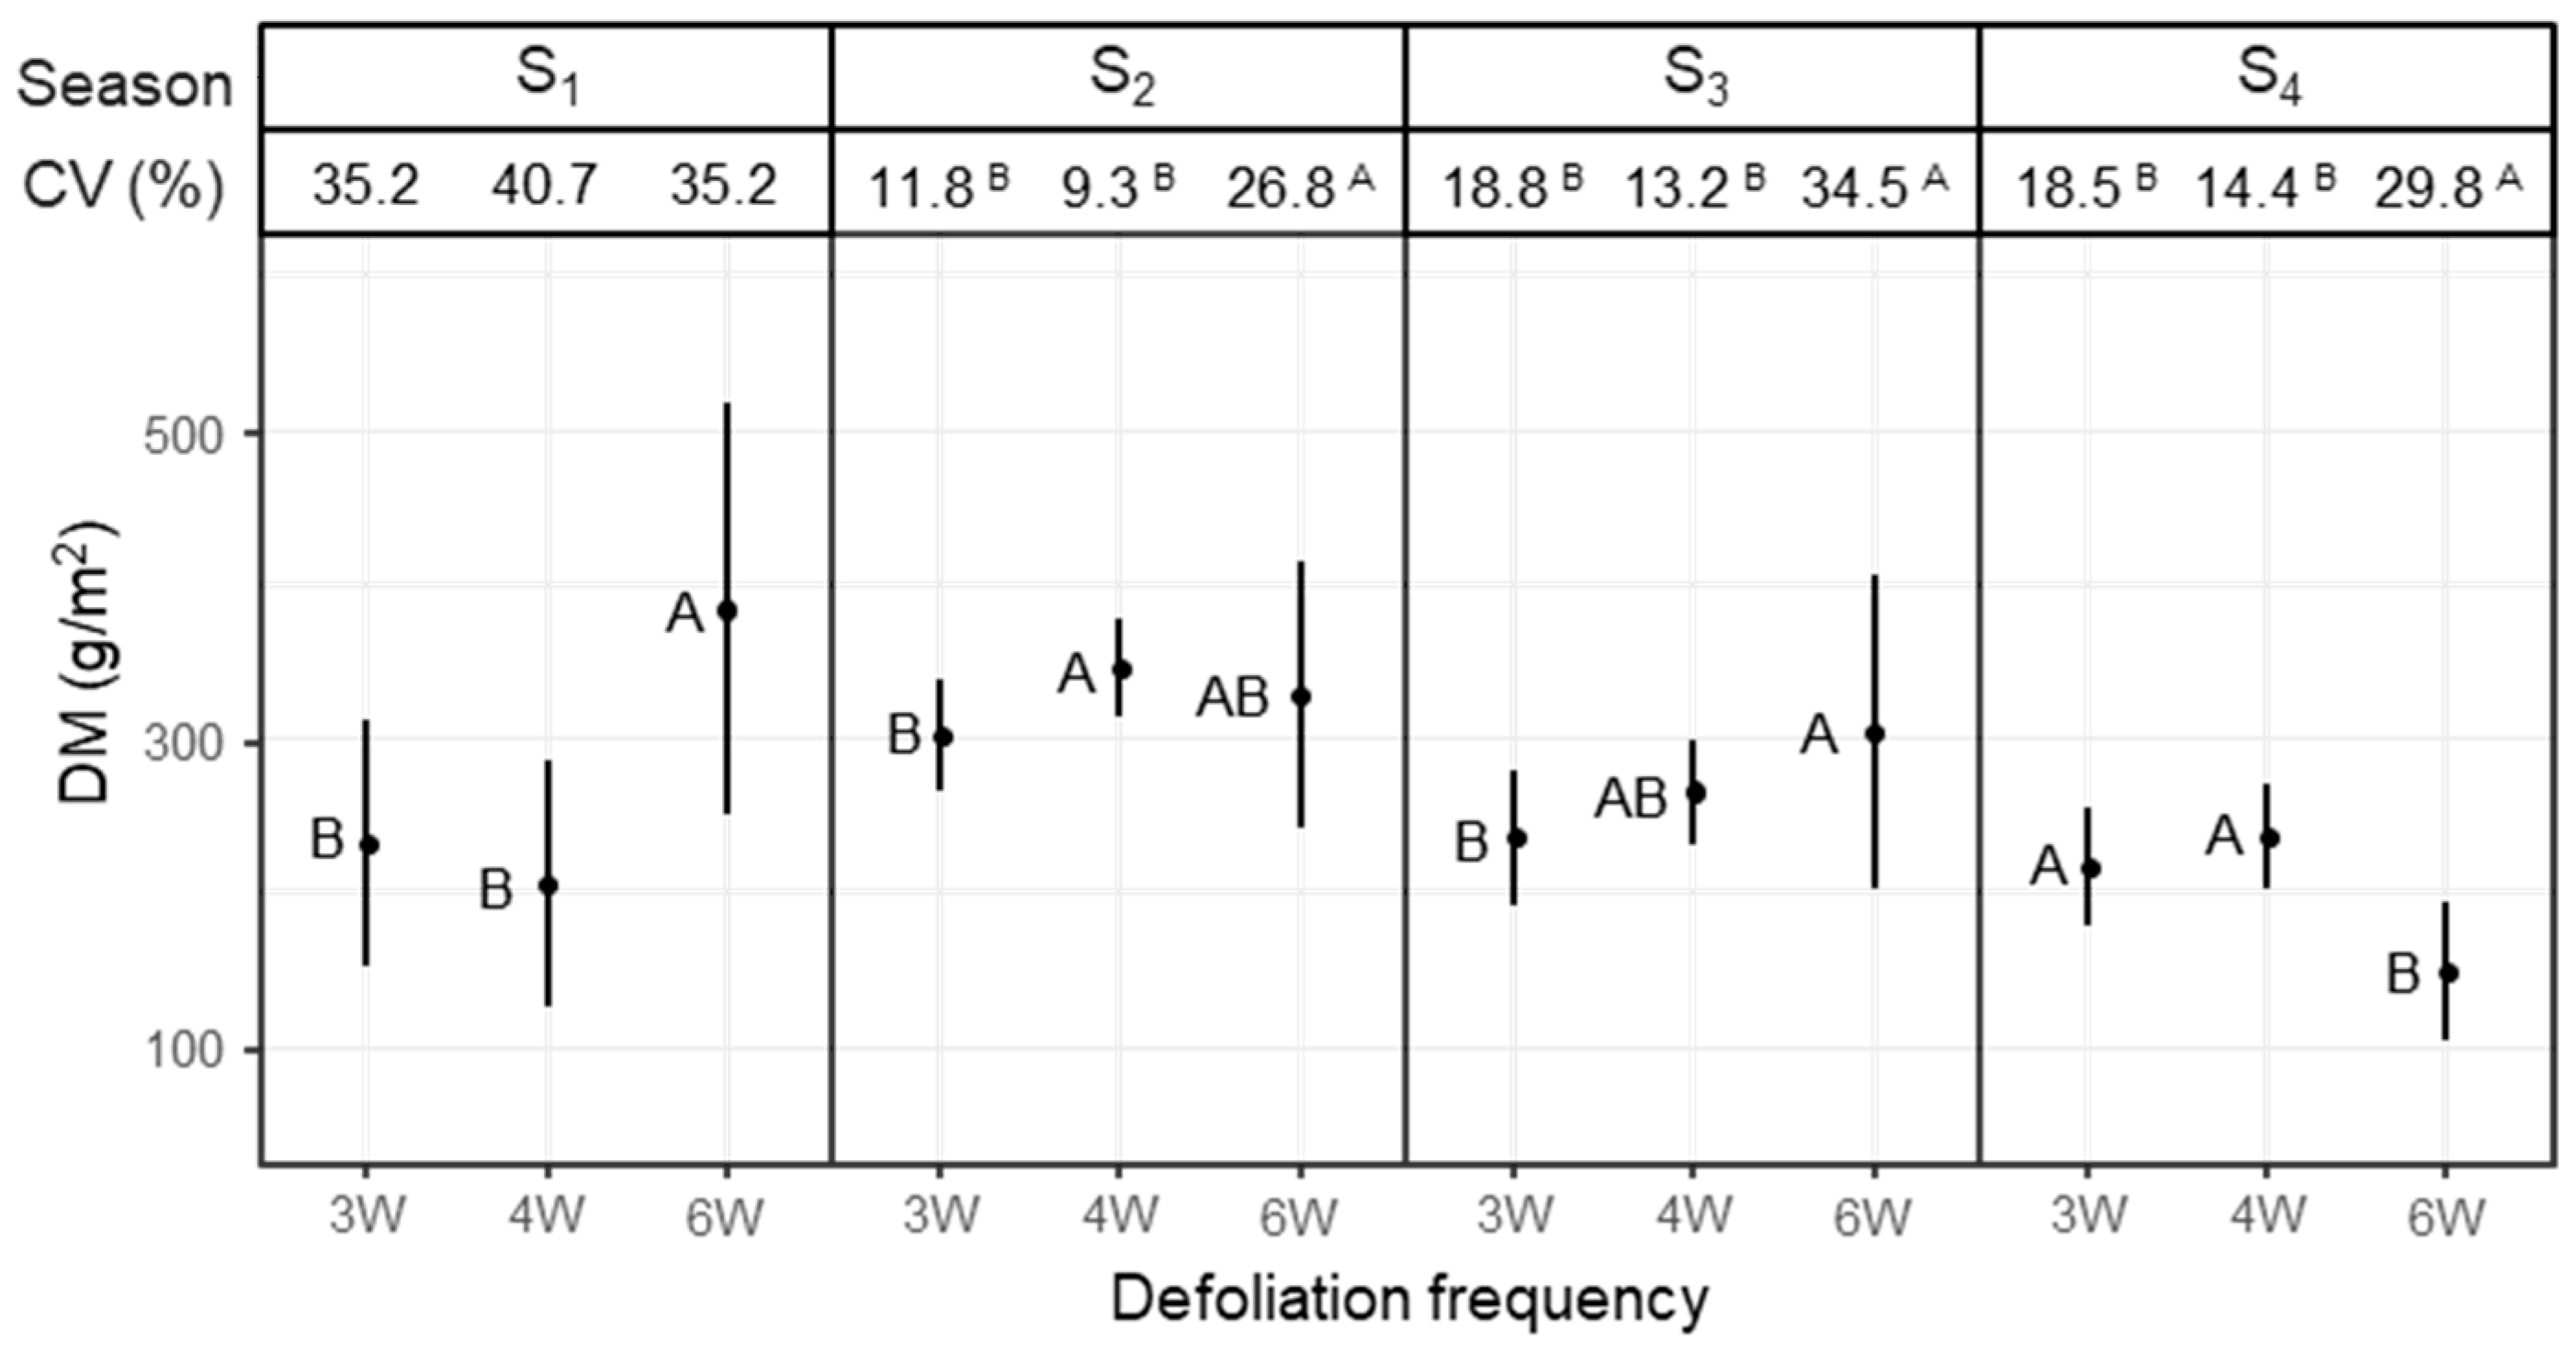
The seasonal fragmentation of the growing period was firstly based on the distribution of the harvests in the cutting-for-conservation system, but secondly was separated between different growth stages of PR. Whereas the reproductive growth phase was covered by season S1, the transition to vegetative growth occurred in S2, and the vegetative growth phase was split into summer and autumn growth in S3 and S4. The inter-annual CV of seasonal DM yields was higher in the 6W system than in the 3W and 4W systems in seasons S2 to S4, thus between the end of May and mid-November. In these seasons the average DM yields in the 3W and 4W systems were high and the SDs were small, which led to particularly low CVs. In the 6W system, the highest DM yield in season S1 co-occurred with a large SD, which eventually led to a large CV.
These results indicate that in all seasons except S1, a higher inter-annual yield stability was achieved by using high defoliation frequencies that were not tied to any trade-offs regarding DM production. In season S1, the SDs were also clearly lower in the simulated grazing systems, but so were the DM yields. Since in seasons S2 and S3 the inter-annual CVs of the 3W and 4W systems were a combination of high means and low SDs, which was considered favourable against the backdrop of this study, CV has a high informative value in these cases.
The inter-annual CV of the annual DM yields was higher with the frequent defoliation of the simulated grazing treatments despite the smaller DM yields. In the 6W system, the DM yields were high but so were the SDs, which means that variations between years and also the effects of weather events were greater under less frequent defoliation, which led to comparatively large CVs.
The analysis of the stability between weekly growth rates in the simulated grazing systems, described by the intra-annual CV, showed a significant effect of seed mixture, with CV being significantly higher in the simple mixture M1. Due to similar annual DM yields, this indicates a more even distribution of growth rates in the complex mixture M2. Since the greatest variation between growth rates occurred during the generative phase, when growth rates rapidly increase from very low to high, a separate analysis (not presented) was carried out for calendar weeks 25 to 47 only. The significant difference between the seed mixtures remained following the exclusion of the generative phase, which showed that the effect on intra-annual stability did not come from a lower peak in spring, but from a more even distribution of growth rates throughout the growing season, primarily driven by good performance of WC in seasons S2 and S3 (end of May to middle of August, see Figure 2). The reduction of RC seed density in M2 in combination with stoloniferous growth of WC supported strong competitiveness of WC during summer months. Additionally, in comparison with PR, the observed growth rates of the group of forage herbs showed a less distinct peak production in spring and a second peak during the growth depression in PR after the conversion to vegetative growth. This indicates that in terms of seasonal growth distribution, the forage herbs did not replace PR, but with their divergent growth pattern contributed to a more even distribution of herbage growth.

5. Conclusions

Under a maritime climate, which with its sufficient rainfall offers a prime location for legume-based production systems, enhanced species diversity did not lead to overyielding in a grass clover ley. It is concluded that the simple three-species mixture was equipped with plant species that covered the plant functional traits required to achieve high DM production and high contents of ME under N-deficient conditions on sandy loam. Consideration of the seasonal yield distribution, however, revealed the additional agronomic value of higher species richness. Besides the effect of diverging growth patterns of herbal species, a smaller proportion of RC, which allowed higher WC growth during summer months, supported higher intra-annual yield stability. This effect can be expected to persist during dry periods, as literature reported high drought tolerance of forage herbs. The results showed that differing species competitiveness and growth habits need to be considered for composition of diverse seed mixtures as they affect yield performance and temporal yield distribution.
Future research is required to verify the performance of the diverse mixture under grazing conditions and to capture its full potential, including nutritional and environmental aspects related to higher species diversity.

Author Contributions

Conceptualization, F.T. and R.L.; data curation, C.K.; formal analysis, H.L. and C.K.; funding acquisition, F.T.; investigation, H.L.; methodology, R.L.; project administration, R.L.; supervision, F.T.; visualization, H.L. and T.R.; writing—original draft, H.L.; writing—review & editing, T.R. All authors have read and agreed to the published version of the manuscript.

Funding

We acknowledge financial support by DFG within the funding programme Open Access Publizieren. A doctoral scholarship was granted to Heike Lorenz by the Villigst Foundation.

Acknowledgments

Heike Lorenz is very grateful for the doctoral scholarship awarded by the Villigst Foundation. Special gratitude is expressed to Petra Voß, Lena Holzenkamp, and Lena Dangers for their help during field work and to Mario Hasler for statistical advice. The feedback from reviewers was highly appreciated and helped to improve the manuscript.

Conflicts of Interest

The authors declare no conflicts of interest. The funders had no role in the design of the study; in the collection, analyses, or interpretation of data; in the writing of the manuscript, or in the decision to publish the results.

References

  1. Schmeer, M.; Loges, R.; Dittert, K.; Senbayram, M.; Horn, R.; Taube, F. Legume-based forage production systems reduce nitrous oxide emissions. Soil Tillage Res. 2014, 143, 17–25. [Google Scholar] [CrossRef]
  2. Totty, V.K.; Greenwood, S.L.; Bryant, R.H.; Edwards, G.R. Nitrogen partitioning and milk production of dairy cows grazing simple and diverse pastures. J. Dairy Sci. 2013, 96, 141–149. [Google Scholar] [CrossRef] [PubMed] [Green Version]
  3. Carlton, A.J.; Cameron, K.C.; Di, H.J.; Edwards, G.R.; Clough, T.J. Nitrate leaching losses are lower from ryegrass/white clover forages containing plantain than from ryegrass/white clover forages under different irrigation. N. Z. J. Agric. Res. 2018, 62, 150–172. [Google Scholar] [CrossRef]
  4. Simon, P.L.; de Klein, C.A.M.; Worth, W.; Rutherford, A.J.; Dieckow, J. The efficacy of Plantago lanceolata for mitigating nitrous oxide emissions from cattle urine patches. Sci. Total Environ. 2019, 691, 430–441. [Google Scholar] [CrossRef] [PubMed]
  5. Min, B.R.; Barry, T.N.; Attwood, G.T.; McNabb, W.C. The effect of condensed tannins on the nutrition and health of ruminants fed fresh temperate forages: A review. Anim. Feed Sci. Technol. 2003, 106, 3–19. [Google Scholar] [CrossRef]
  6. Jayanegara, A.; Leiber, F.; Kreuzer, M. Meta-analysis of the relationship between dietary tannin level and methane formation in ruminants from in vivo and in vitro experiments. J. Anim. Physiol. Anim. Nutr. 2012, 96, 365–375. [Google Scholar] [CrossRef]
  7. Scharenberg, A.; Arrigo, Y.; Gutzwiller, A.; Soliva, C.R.; Wyss, U.; Kreuzer, M.; Dohme, F. Palatability in sheep and in vitro nutritional value of dried and ensiled sainfoin (Onobrychis viciifolia) birdsfoot trefoil (Lotus corniculatus), and chicory (Cichorium intybus). Arch. Anim. Nutr. 2007, 61, 481–496. [Google Scholar] [CrossRef]
  8. Hamacher, M. Potentiale Sekundärer Pflanzeninhaltsstoffe in Futterleguminosen und Wiesenkräutern für Eine Verbesserte N-Verwertung Beim Wiederkäuer. Ph.D. Dissertation, Christian-Albrechts-Universität zu Kiel, Kiel, Germany, 2016. [Google Scholar]
  9. Jayanegara, A.; Marquardt, S.; Wina, E.; Kreuzer, M.; Leiber, F. In vitro indications for favourable non-additive effects on ruminal methane mitigation between high-phenolic and high-quality forages. Br. J. Nutr. 2013, 109, 615–622. [Google Scholar] [CrossRef] [Green Version]
  10. Cong, W.-F.; Jing, J.; Rasmussen, J.; Søegaard, K.; Eriksen, J. Forbs enhance productivity of unfertilised grass-clover leys and support low-carbon bioenergy. Sci. Rep. 2017, 7, 671. [Google Scholar] [CrossRef]
  11. Kagiya, N.; Reinsch, T.; Taube, F.; Salminen, J.-P.; Kluß, C.; Hasler, M.; Malisch, C.S. Turnover rates of roots vary considerably across temperate forage species. Soil Biol. Biochem. 2019, 139, 107614. [Google Scholar] [CrossRef]
  12. Hudewenz, A.; Klein, A.-M.; Scherber, C.; Stanke, L.; Tscharntke, T.; Vogel, A.; Weigelt, A.; Weisser, W.W.; Ebeling, A. Herbivore and pollinator responses to grassland management intensity along experimental changes in plant species richness. Biol. Conserv. 2012, 150, 42–52. [Google Scholar] [CrossRef]
  13. Woodward, S.L.; Waugh, C.D.; Roach, C.G.; Fynn, D.; Phillips, J. Are diverse species mixtures better pastures for dairy farming? Proc. N. Z. Grassl. Assoc. 2013, 75, 79–84. [Google Scholar] [CrossRef]
  14. Hoekstra, N.J.; Suter, M.; Finn, J.A.; Husse, S.; Lüscher, A. Do belowground vertical niche differences between deep- and shallow-rooted species enhance resource uptake and drought resistance in grassland mixtures? Plant Soil 2015, 394, 21–34. [Google Scholar] [CrossRef]
  15. Connolly, J.; Sebastià, M.-T.; Kirwan, L.; Finn, J.A.; Llurba, R.; Suter, M.; Collins, R.P.; Porqueddu, C.; Helgadóttir, Á.; Baadshaug, O.H.; et al. Weed suppression greatly increased by plant diversity in intensively managed grasslands: A continental-scale experiment. J. Appl. Ecol. 2018, 55, 852–862. [Google Scholar] [CrossRef]
  16. Sanderson, M.A.; Soder, K.J.; Muller, L.D.; Klement, K.D.; Skinner, R.H.; Goslee, S.C. Forage Mixture Productivity and Botanical Composition in Pastures Grazed by Dairy Cattle. Agron. J. 2005, 97, 1465–1471. [Google Scholar] [CrossRef] [Green Version]
  17. Pembleton, K.G.; Hills, J.L.; Freeman, M.J.; McLaren, D.K.; French, M.; Rawnsley, R.P. More milk from forage: Milk production, blood metabolites, and forage intake of dairy cows grazing pasture mixtures and spatially adjacent monocultures. J. Dairy Sci. 2016, 99, 3512–3528. [Google Scholar] [CrossRef]
  18. Roca-Fernández, A.I.; Peyraud, J.L.; Delaby, L.; Delagarde, R. Pasture intake and milk production of dairy cows rotationally grazing on multi-species swards. Animal 2016, 10, 1448–1456. [Google Scholar] [CrossRef] [Green Version]
  19. Pirhofer-Walzl, K.; Søegaard, K.; Høgh-Jensen, H.; Eriksen, J.; Sanderson, M.A.; Rasmussen, J. Forage herbs improve mineral composition of grassland herbage. Grass Forage Sci. 2011, 66, 415–423. [Google Scholar] [CrossRef] [Green Version]
  20. Ramírez-Restrepo, C.A.; Barry, T.N. Alternative temperate forages containing secondary compounds for improving sustainable productivity in grazing ruminants. Anim. Feed Sci. Technol. 2005, 120, 415–423. [Google Scholar] [CrossRef]
  21. Ziogas, G. Geologie und Böden der Versuchsbetriebe Lindhof und Hohenschulen der Christian-Albrechts-Universität zu Kiel. Quartärgeologische und Bodenkundliche Kartierung, Genese, Vergesellschaftung, Ökologie, Funktionen. Ph.D. Dissertation, Christian-Albrechts-Universität zu Kiel, Kiel, Germany, 1995. [Google Scholar]
  22. Corrall, A.J.; Fenlon, J.S. A comparative method for describing the seasonal distribution of production from grasses. J. Agric. Sci. 1978, 91, 61–67. [Google Scholar] [CrossRef]
  23. Sanderson, M.A. Stability of production and plant species diversity in managed grasslands: A retrospective study. Basic Appl. Ecol. 2010, 11, 216–224. [Google Scholar] [CrossRef]
  24. VDLUFA. VDLUFA-Methodenbuch, Bd. III, Die Chemische Untersuchung von Futtermitteln; VDLUFA: Darmstadt, Germany, 2012. [Google Scholar]
  25. De Boever, J.L.; Cottyn, B.G.; Andries, J.I.; Buysse, F.X.; Vanacker, J.M. The use of a cellulase technique to predict digestibility, metabolizable and net energy of forages. Anim. Feed Sci. Technol. 1988, 19, 247–260. [Google Scholar] [CrossRef]
  26. GfE. Communications of the Committee for Requirement Standards of the Society of Nutrition Physiology: New equations for predicting metabolisable energy of grass and maize products for ruminants. Proc. Soc. Nutr. Physiol. 2008, 17, 191–198. [Google Scholar]
  27. R Core Team. R Development Core Team. R A Lang. Environ. Stat. Comput. 2017, 55, 275–286. [Google Scholar]
  28. Laird, N.M.; Ware, J.H. Random-Effects Models for Longitudinal Data. Biometrics 1982, 38, 963–974. [Google Scholar] [CrossRef] [PubMed]
  29. Verbeke, G.; Molenberghs, G. Linear Mixed Models for Longitudinal Data. In Linear Mixed Models in Practice 1997; Springer: New York, NY, USA, 2000. [Google Scholar] [CrossRef]
  30. DWD. Niederschlag: Langjährige Mittelwerte 1981–2010. 2015. Available online: http://www.dwd.de/bvbw/generator/DWDWWW/Content/Oeffentlichkeit/KU/KU2/KU21/klimadaten/german/nieder__8110__akt__html,templateId=raw,property=publicationFile.html/nieder_8110_akt_html.Dtsch.Wetterd (accessed on 20 November 2015).
  31. DWD. Temperatur: Langjährige Mittelwerte 1981–2010. 2015. Available online: https://www.dwd.de/DE/leistungen/klimadatendeutschland/mittelwerte/temp_8110_akt_html.html?view=nasPublication&nn=16102Dtsch.Wetterd (accessed on 20 November 2015).
  32. Brougham, R.W. A study in rate of pasture growth. Aust. J. Agric. Res. 1955, 6, 804–812. [Google Scholar] [CrossRef]
  33. Hilbert, M. Untersuchungen über den Wachstumsrhythmus von Grünlandarten und über Möglichkeiten seiner Beeinflussung. Z Acker Pflanz 1970, 131, 137–158. [Google Scholar]
  34. Robson, M.J. The growth and development of simulated swards of perennial ryegrass: I. Leaf growth and dry weight change as related to the ceiling yield of a seedling sward. Ann. Bot. 1973, 37, 487–500. [Google Scholar] [CrossRef]
  35. Frame, J.; Hunt, I.V. The effects of cutting and grazing systems on herbage production from grass swards. Grass Forage Sci. 1971, 26, 163–172. [Google Scholar] [CrossRef]
  36. Jones, M.G.; Jones, L.I. The effect of varying the periods of rest in rotational grazing. Bull. Welsh Plant Breed. Stn. 1930, 11, 38–59. [Google Scholar]
  37. Taube, F. Growth Characteristics of Contrasting Varieties of Perennial Ryegrass (Lolium perenne L.). J. Agron. Crop Sci. 1990, 165, 159–170. [Google Scholar] [CrossRef]
  38. Wilman, D.; Droushiotis, D.; Koocheki, A.; Lwoga, A.B.; Shim, J.S. The effect of interval between harvests and nitrogen application on the digestibility and digestible yield and nitrogen content and yield of four ryegrass varieties in the first harvest year. J. Agric. Sci. 1976, 86, 393–399. [Google Scholar] [CrossRef]
  39. Eriksen, J.; Askegaard, M.; Søegaard, K. Complementary effects of red clover inclusion in ryegrass–white clover swards for grazing and cutting. Grass Forage Sci. 2014, 69, 241–250. [Google Scholar] [CrossRef]
  40. Belesky, D.P.; Fedders, J.M.; Turner, K.E.; Ruckle, J.M. Productivity, Botanical Composition, and Nutritive Value of Swards Including Forage Chicory. Agron. J. 1999, 91, 450. [Google Scholar] [CrossRef]
  41. Chestnutt, D.M.B.; Murdoch, J.C.; Harrington, F.J.; Binnie, R.C. The effect of cutting frequency and applied nitrogen on production and digestibility of perennial ryegrass. Grass Forage Sci. 1977, 32, 177–183. [Google Scholar] [CrossRef]
  42. Haughey, E.; Suter, M.; Hofer, D.; Hoekstra, N.J.; McElwain, J.C.; Lüscher, A.; Finn, J.A. Higher species richness enhances yield stability in intensively managed grasslands with experimental disturbance. Sci. Rep. 2018, 8, 15047. [Google Scholar] [CrossRef]
  43. Sanderson, M.A.; Skinner, R.H.; Barker, D.J.; Edwards, G.R.; Tracy, B.F.; Wedin, D.A. Plant Species Diversity and Management of Temperate Forage and Grazing Land Ecosystems. Crop Sci. 2004, 44, 1132–1144. [Google Scholar] [CrossRef]
  44. Pirhofer-Walzl, K.; Rasmussen, J.; Høgh-Jensen, H.; Eriksen, J.; Søegaard, K.; Rasmussen, J. Nitrogen transfer from forage legumes to nine neighbouring plants in a multi-species grassland. Plant Soil 2012, 350, 71–84. [Google Scholar] [CrossRef] [Green Version]
  45. Nyfeler, D.; Huguenin-Elie, O.; Suter, M.; Frossard, E.; Connolly, J.; Lüscher, A. Strong mixture effects among four species in fertilized agricultural grassland led to persistent and consistent transgressive overyielding. J. Appl. Ecol. 2009, 46, 683–691. [Google Scholar] [CrossRef]
  46. Finn, J.A.; Kirwan, L.; Connolly, J.; Sebastià, M.T.; Helgadottir, A.; Baadshaug, O.H.; Bélanger, G.; Black, A.; Brophy, C.; Collins, R.P.; et al. Ecosystem function enhanced by combining four functional types of plant species in intensively managed grassland mixtures: A 3-year continental-scale field experiment. J. Appl. Ecol. 2013, 50, 365–375. [Google Scholar] [CrossRef] [Green Version]
  47. Isbell, F.I.; Polley, H.W.; Wilsey, B.J. Biodiversity, productivity and the temporal stability of productivity: Patterns and processes. Ecol. Lett. 2009, 12, 443–451. [Google Scholar] [CrossRef] [PubMed] [Green Version]
  48. Van Ruijven, J.; Berendse, F. Positive effects of plant species diversity on productivity in the absence of legumes. Ecol. Lett. 2003, 6, 170–175. [Google Scholar] [CrossRef]
  49. Cong, W.-F.; Suter, M.; Lüscher, A.; Eriksen, J. Species interactions between forbs and grass-clover contribute to yield gains and weed suppression in forage grassland mixtures. Agric. Ecosyst. Environ. 2018, 268, 154–161. [Google Scholar] [CrossRef]
  50. Connolly, J.; Finn, J.A.; Black, A.D.; Kirwan, L.; Brophy, C.; Lüscher, A. Effects of multi-species swards on dry matter production and the incidence of unsown species at three Irish sites. Ir. J. Agric. Food Res. 2009, 48, 243–260. [Google Scholar] [CrossRef]
  51. Küchenmeister, F.; Küchenmeister, K.; Wrage, N.; Kayser, M.; Isselstein, J. Yield and yield stability in mixtures of productive grassland species: Does species number or functional group composition matter? Grassl. Sci. 2012, 58, 94–100. [Google Scholar] [CrossRef]
  52. Deak, A.; Hall, M.H.; Sanderson, M.A.; Archibald, D.D. Production and Nutritive Value of Grazed Simple and Complex Forage Mixtures. Agron. J. 2007, 99, 814. [Google Scholar] [CrossRef] [Green Version]
  53. Høgh-Jensen, H.; Loges, R.; Jørgensen, F.V.; Vinther, F.P.; Jensen, E.S. An empirical model for quantification of symbiotic nitrogen fixation in grass-clover mixtures. Agric. Syst. 2004, 82, 181–194. [Google Scholar] [CrossRef]
  54. Høgh-Jensen, H.; Nielsen, B.; Thamsborg, S.M. Productivity and quality, competition and facilitation of chicory in ryegrass/legume-based pastures under various nitrogen supply levels. Eur. J. Agron. 2006, 24, 247–256. [Google Scholar] [CrossRef] [Green Version]
  55. Kolver, E.S. Nutritional limitations to increased production on pasture-based systems. Proc. Nutr. Soc. 2003, 62, 291–300. [Google Scholar] [CrossRef] [Green Version]
  56. Nyfeler, D.; Huguenin-Elie, O.; Suter, M.; Frossard, E.; Lüscher, A. Grass–legume mixtures can yield more nitrogen than legume pure stands due to mutual stimulation of nitrogen uptake from symbiotic and non-symbiotic sources. Agric. Ecosyst. Environ. 2011, 140, 155–163. [Google Scholar] [CrossRef]
  57. Terry, R.A.; Tilley, J.M.A. The digestibility of the leaves and stems of perennial ryegrass, cocksfoot, timothy, tall fescue, lucerne and sainfoin, as measured by an in vitro procedure. Grass Forage Sci. 1964, 19, 363–372. [Google Scholar] [CrossRef]
  58. Carnus, T.; Finn, J.; Kirwan, L.; Connolly, J. Assessing the relationship between biodiversity and stability of ecosystem function--is the coefficient of variation always the best metric? Ideas Ecol. Evol. 2014, 7, 20. [Google Scholar] [CrossRef]
  59. Daly, M.J.; Hunter, R.M.; Green, G.N.; Hunt, L. A comparison of multi-species pasture with ryegrass–white clover pasture under dryland conditions. Proc. N. Z. Grassl. Assoc. 1996, 58, 53–58. [Google Scholar] [CrossRef]
Figure 1. Annual fragmentation of the growing period into seasons (S1–S4) in accordance to the cutting dates in the cutting-for-conservation system.
Sustainability 12 05842 g001
Figure 2. Daily growth rates of both seed mixtures averaged across defoliation frequencies (3W and 4W). The upper curves represent the total herbage growth, the lower curves the growth of PR, RC, WC, and the group of forage herbs.
Sustainability 12 05842 g002
Figure 3. Average ME and CP contents during the growing season. Asterisks indicate the level of significance of differences between seed mixtures (upper graphs) and defoliation frequencies (lower graphs).
Sustainability 12 05842 g003
Figure 4. Effect of defoliation frequency on seasonal DM yields (mean ± SD) and their inter-annual coefficient of variation (CV). Capitals indicate significant differences of DM yields or CVs between defoliation frequencies (3W, three-weekly simulated grazing; 4W, four-weekly simulated grazing; 6W, cutting for conservation) within seasons.
Sustainability 12 05842 g004
Table 1. Composition and sowing rate (kg/ha) of seed mixtures M1 and M2.
SpeciesVarietySeed Mixture
M1M2
Perennial ryegrass (Lolium perenne)Delphin2010
Red clover (Trifolium pratense)Atlantis63
White clover (Trifolium repens)Vysocan31.5
Bird’s-foot trefoil (Lotus corniculatus)Lotanova 2.5
Chicory (Cichorium intybus)Spadona 2
Salad burnet (Sanguisorba minor)Burnet 2
Narrow leafed plantain (Plantago lanceolata)‘native’ 1.5
Caraway (Carum carvi)Volhouden 2
M1—simple mixture; M2—complex mixture.
Table 2. First and last harvest dates in the simulated grazing treatments and all harvest dates in the cutting-for-conservation treatment.
YearSimulated Grazing (3W and 4W)Cutting for Conservation (6W)
First HarvestLast Harvest1st Harvest2nd Harvest3rd Harvest4th Harvest
20142 Apr12 Nov21 May2 Jul13 Aug8 Oct
20158 Apr11 Nov27 May8 Jul19 Aug14 Oct
20166 Apr9 Nov20 May30 Jun17 Aug5 Oct
20175 Apr8 Nov23 May27 Jun8 Aug19 Sep
Table 3. Statistical data of the NIRS calibration and validation (SEC, standard error of calibration; SEP, standard error of prediction) for the relevant quality parameters by plant group.
ParameterPlant GroupNMeanRangeSECR2SEP
ME (MJ/kg DM)Grasses24810.8068.38–12.620.1730.9560.194
Legumes16810.7378.55–12.410.150.9610.196
Herbs11710.6918.38–12.540.1540.9630.211
N (g/kg DM)Grasses277225.959–54.90.8020.9919.14
Legumes178350.7414.7–57.11.1160.98111.31
Herbs86263.9810.3–39.90.7490.99513.17
Table 4. Monthly precipitation sum and average air temperature during the experimental years (own data) and over the long term (1981–2010, [30] (precipitation), [31] (temperature)).
Precipitation (mm)Temperature (°C)
2014201520162017Long Term2014201520162017Long Term
Jan5314466477022.91.11.51.5
Feb42278867475.22.43.42.91.5
Mar21814061576.75.44.46.44
Apr78236466409.27.877.17.6
May748841435412.410.713.212.811.9
Jun63411431307115.513.916.715.914.8
Jul60200981058419.716.517.516.317.3
Aug14842661167416.318.11716.717
Sep11390106936715.913.917.313.913.6
Oct5844761237712.9101012.19.7
Nov262044698707.78.44.86.45.2
Dec1941005084673.67.74.84.22.2
Total9291085884103077810.69.89.89.78.9
Table 5. Effect of defoliation frequency and seed mixture on annual dry matter (DM) yields (g/m2). Capitals indicate significant differences between defoliation frequencies, small letters between seed mixtures. The standard error of the mean is given in parentheses.
Seed Mixturep-ValueDefoliation Frequencyp-Value
M1M23W4W6W
Total1054 (28)1082 (26)0.22986 (26) C1053 (24) B1164 (40) A<0.0001 ***
PR243 (12) a218 (11) b0.02 *228 (13)224 (13)240 (16)0.4
RC494 (31) a341 (21) b<0.001 ***356 (28) B401 (33) B496 (38) A<0.0001 ***
WC306 (17)308 (15)0.91306 (17)320 (18)294 (23)0.21
Herbs-185 (16)-154 (13) B186 (10) AB216 (24) A0.01 *
BT-22 (5)-20 (4)20 (4)25 (6)0.51
3W, three-weekly simulated grazing; 4W, four-weekly simulated grazing; 6W, cutting for conservation; M1, simple mixture; M2, complex mixture; PR, perennial ryegrass; RC, red clover; WC, white clover; BT, bird’s-foot trefoil; p < 0.05 = *, p < 0.001 = ***.
Table 6. Effect of defoliation frequency and seed mixture on average ME contents (MJ ME/kg DM). Capitals indicate significant differences between defoliation frequencies, small letters between seed mixtures. The standard error of the mean is given in parentheses.
Seed Mixturep-ValueDefoliation Frequencyp-Value
M1M23W4W6W
Total10.9 (0.04) a10.76 (0.04) b<0.0001 ***11.06 (0.02) A10.9 (0.02) B10.53 (0.04) C<0.0001 ***
PR10.93 (0.04)10.86 (0.04)0.1711.04 (0.04) A10.93 (0.05) A10.73 (0.05) B<0.0001 ***
RC10.99 (0.05)11.02 (0.04)0.2711.25 (0.03) A11.07 (0.03) B10.7 (0.04) C<0.0001 ***
WC10.76 (0.04)10.72 (0.04)0.1510.99 (0.03) A10.85 (0.02) B10.38 (0.03) C<0.0001 ***
Herbs-10.25 (0.06)-10.59 (0.02) A10.39 (0.04) B9.77 (0.11) C<0.0001 ***
BT-10.84 (0.1)-10.91 (0.08) AB11.12 (0.27) A10.5 (0.08) B0.03 *
ME, metabolisable energy; 3W, three-weekly simulated grazing; 4W, four-weekly simulated grazing; 6W, cutting for conservation; M1, simple mixture; M2, complex mixture; PR, perennial ryegrass; RC, red clover; WC, white clover; BT, bird’s-foot trefoil; p < 0.05 = *, p < 0.001 = ***.
Table 7. Average CP contents (g/kg DM). Capital letters indicate significant differences between defoliation frequencies, small letters between seed mixtures. The standard error of the mean is given in parentheses.
Seed Mixturep-ValueDefoliation Frequencyp-Value
M1M23W4W6W
Total190.63 (3.12) a181.88 (3.12) b<0.001 ***205.63 (2.5) A192.5 (1.88) B161.25 (2.5) C<0.0001 ***
PR145.63 (3.13) a138.75 (3.12) b0.008 **155.63 (3.13) A145 (3.13) B125 (3.75) C<0.0001 ***
RC198.13 (3.75)198.13 (4.37)0.88220 (2.5) A205 (2.5) B168.75 (3.13) C<0.0001 ***
WC221.89 (3.12)220.63 (3.12)0.33240 (1.88) A226.88 (1.25) B196.25 (1.88) C<0.0001 ***
Herbs-143.28 (3.84)-165.48 (3.13) A148.64 (2.5) B115.72 (6.25) C<0.0001 ***
BT-241.69 (4.46)-262.63 (5) A244.11 (6.88) B218.34 (6.88) B<0.0001 ***
CP, crude protein; 3W, three-weekly simulated grazing; 4W, four-weekly simulated grazing; 6W, cutting for conservation; M1, simple mixture; M2, complex mixture; PR, perennial ryegrass; RC, red clover; WC, white clover; BT, bird’s-foot trefoil; p < 0.01 = **, p < 0.001 = ***.
Table 8. Effect of seed mixture and defoliation frequency on annual yields of ME (MJ/m2) and CP (g/m2).
Seed Mixturep-ValueDefoliation Frequencyp-Value
M1M23W4W6W
ME11.46 (0.29)11.62 (0.26)0.5310.91 (0.29) B11.48 (0.26) B12.23 (0.40) A<0.001 ***
CP200 (6)196 (5)0.41203 (7) A203 (6) A187 (7) B<0.001 ***
ME, metabolisable energy; CP, crude protein; 3W, three-weekly simulated grazing; 4W, four-weekly simulated grazing; 6W, cutting for conservation; M1, simple mixture; M2, complex mixture; PR, perennial ryegrass; RC, red clover; WC, white clover; BT, bird’s-foot trefoil; p < 0.001 = ***.
Table 9. Results of the ANOVA of weekly growth rates and weekly ME and CP contents of the total herbage (p-values).
Effect TermWeekly Growth RatesMECP
TotalPRRCWCHerbsTotalTotal
M0.970.910.780.37-<0.001 ***0.54
F0.910.510.270.370.32<0.001 ***<0.001 ***
W<0.001 ***<0.001 ***<0.001 ***<0.001 ***<0.001 ***<0.001 ***<0.001 ***
M × F0.820.850.220.47-0.780.12
M × W0.840.91<0.0001 ***0.64-<0.01 **0.05
F × W0.080.001 ***0.250.09<0.001 ***<0.001 ***<0.001 ***
M × F × W0.990.7710.96-0.971
ANOVA, analysis of variance; ME, metabolisable energy; CP, crude protein; PR, perennial ryegrass; RC, red clover; WC, white clover; M, seed mixture; F, defoliation frequency; W, week; p < 0.01 = **, p < 0.001 = ***.
Table 10. Results of the ANOVA of the inter-annual CV of annual and seasonal DM yields of the total herbage.
Annual DM YieldsSeasonal DM Yields
Effect Termp-ValueEffect Termp-Value
M0.22S<0.001 ***
F<0.01 **M0.52
M × F0.47F<0.001 ***
S × M0.17
S × F<0.001 ***
M × F0.24
S × M × F0.56
ANOVA, analysis of variance; CV, coefficient of variation; M, seed mixture; F, defoliation frequency; S, Season; p < 0.01 = **, p < 0.001 = ***.
Table 11. Effect of seed mixture and defoliation frequency on the intra-annual CV (%) of the weekly growth rates and weekly ME and CP contents.
Seed Mixturep-ValueDefoliation Frequencyp-Value
M1M23W4W
Growth rate72.62 (1.48) b69.17 (1.21) a0.006 **71.65 (1.59)70.14 (1.14)0.13
ME content4.55 (0.11) b4.22 (0.08) a0.003 **4.23 (0.1) A4.54 (0.09) B<0.001 ***
CP content18.28 (0.6)18.68 (0.63)0.4817.3 (0.58) A19.66 (0.57) B<0.001 ***
CV, coefficient of variation; ME, metabolisable energy; CP, crude protein 3W, three-weekly simulated grazing; 4W, four-weekly simulated grazing; M1, simple mixture; M2, complex mixture; p < 0.01 = **, p < 0.001 = ***.

