Article

Analysis of Safety Management Characteristics Using Network Analysis of CEO Messages in the Construction Industry

1
Graduate School of Management of Technology, Sungkyunkwan University, Chunchundong 300, Suwon 440-746, Korea
2
System Management Engineering & Graduate School of Management of Technology, Sungkyunkwan University, Chunchundong 300, Suwon 440-746, Korea
*
Author to whom correspondence should be addressed.
Sustainability 2020, 12(14), 5771; https://doi.org/10.3390/su12145771
Submission received: 19 June 2020 / Revised: 14 July 2020 / Accepted: 16 July 2020 / Published: 17 July 2020
(This article belongs to the Section Economic and Business Aspects of Sustainability)

Abstract

:
Chief executive officer (CEO) messages are important in communicating with employees. In terms of sustainability management, it is important to study these messages for their finance and safety content; however, previous studies have focused mostly on the financial aspects. Therefore, our approach is to: (1) focus on safety management, (2) use text mining and network analysis to extract the keywords emphasized by the CEOs, (3) analyze safety management characteristics through factor mapping and network analysis, (4) make recommendations. When the results from the CEO communications of 100 global construction companies were reviewed, keywords including “management”, “value”, “employee”, “system”, “project”, “culture”, “new”, “occupational”, “practice”, and “basis” were deduced. The words “management”, “employee”, and “culture” were the common keywords considered important by CEOs and were highlighted in literature reviews as significant words. Both the deduced keywords and the words deemed important by the CEOs have similar connotations. Motivation, Rules and Regulations, and Resources and Equipment were the factors that exhibited the highest centrality, while Culture and Climate had a structurally high connection. Based on our results, we suggest selecting appropriate words to form consensus with the workers, supplementing the factors related to safety investment with low centrality, and using direct “safety” words, and other relevant words.

1. Introduction

A chief executive officer (CEO) is the leader of a company. The decisions and messages delivered by the CEO to an organization should represent the values and philosophy pursued by the company and the direction of management, and provide guidelines for employees to follow [1]. As the CEO is responsible for the management performance and sustainable growth of a company [2], the CEO must be sufficiently competent to set a vision, establish strategies, and effectively lead the organization in order to achieve high performance [3].
The importance of safety management is increasingly being highlighted alongside financial management from the perspective of managing sustainable growth, where the ultimate goal of management is to reduce the number of incidents and accidents involving human injury or property damage [4]. Failed safety management not only has a negative impact on management performance by causing delays in projects, damaging brand equity, and incurring direct or indirect costs from lawsuits and compensation [5] but it also determines whether the company itself survives. In particular, accidents negatively affect productivity and competitiveness. The most important aspect of safety performance is accident rates, which affect competitive and financial performance [6].
The construction industry involves a dangerous work environment with distinctive construction characteristics, frequent changes in the workforce, and low barriers to entry. The above characteristics can be explained in connection with the characteristics of agriculture, which are similar. The agriculture working environment involves many different languages and cultures, many workers with no experience and training, and hard working conditions [7]. Bad communication can lead to fatal injuries. Workers speaking different languages from one another have a 40% to 80% higher death rate than workers using the same language [8], and the injury rate is also 30% higher [9]. According to the UK Health & Safety Executive’s Summary Statistics, 2019, the number of accidents in the construction industry is more than three times higher than that of all other industries put together, and the US Bureau of Laboratory Statistics classifies the risk of fatal injuries in the construction industry, based on statistics, to be more than twice as high as that of manufacturing and six times higher than that of the oil and gas extraction industries [10]. Because the industry is considered to be a high-risk environment [11], a safety-related vision and attitude must be incorporated into the basic strategy of the company to achieve high performance [10,12,13].
Even if good vision and strategy are established by the CEO’s devotion to safety management, high performance can only be achieved with the awareness and motivation, internalization, and voluntary participation of the interested parties [4]. Therefore, the CEO’s message should be seen as a way of conveying the company’s image to stakeholders and customers so that it prioritizes safety and communicates with employees regarding a code of conduct and work methods [14]. The type of CEO message we focus on is different from the messages that use social network service (SNS), which reflect personal content [15]. It is a specific type of CEO message written in a formal report that conveys a public message in accordance with the company’s management environment and is used to regularly deliver information to employees [16]. A CEO message is a document with legal weight, publicly representing the stance of a company rather than just the personal opinions of the CEO, and thus is written very carefully, with detailed consideration of every word and the overall message being conveyed [16]. It is also a good reflection of the CEO’s leadership, values, and attitude. For these reasons, CEO messages have a significant effect on organizational culture and are becoming an important research topic in social science fields such as business administration and economics [17,18]. Other professional fields and academic circles are also treating CEO messages as a systematic research subject as part of efforts to raise awareness [19]. A company that effectively conveys the CEO’s vision typically exhibits better performance [2]. This highlights the importance of communicating with the people concerned and establishes the CEO’s vision, emphasizing the need for this research.
Previous studies on CEO messages have established associations between CEO communications and the company’s financial performance [20]. These studies also focused on interpreting the meaning of paragraphs or words themselves [16]. However, as the volume of information has increased and software technology has advanced, in combination with the development of diverse algorithms, integrated analyses using networks have been attempted based on word associations [21,22,23,24]. Network analysis provides high visibility through visualization and is a useful tool for delivering information and analyzing associations [25].
Therefore, the goals of this study are to: (1) analyze CEO’s messages to understand their thoughts and willingness about advanced construction companies; (2) identify the 10 most emphasized words in the messages and define them as keywords; (3) check, through a review of the existing literature, whether the derived keywords are different from keywords related to safety, because safety keywords are important in the business environment; (4) perform keyword and factor mapping and network analysis to derive the final purpose of the safety management characteristics; and (5) make safety-related recommendations for more effective communications between the CEO and employees.
Safety-related words with a high frequency usage were identified from CEO communications from 100 global construction companies with high revenues, based on the research results of their positive influence on safety and management performance [26]. Then, the intention and nature of the CEO messages were analyzed through mapping and classification using safety performance factors based on the results [27,28,29]. These factors provided a comprehensive safety management framework through which the current safety management status could be identified. These factors were categorized into 13 main factors by analyzing existing literatures affecting 90 safety factors [29].
Section 2 contains an analysis of the field and characteristics of the existing research, and it highlights the novelty of our research. Section 3 describes the process of the text mining, network analysis, and factor mapping introduced in this study, from data collection to processing and analysis. Section 4 presents a list of words based on the centrality analysis results, classification of weighted words, mapping results, and visualization based on data analysis. Section 5 describes the characteristics of the keywords, the differences from the existing literature, and the structure of the network, along with specific examples. Section 6 describes the current limitations and future directions of the research.
It is difficult for a company CEO to conduct a survey or interview. This study is meaningful in understanding the intent and propensity of safety-related messages in CEO communications; this will help understand the CEO’s thoughts. Because these results were analyzed based on the most recent data, it presents the latest trends in the frequently changing construction industry. Additionally, by examining the safety-related strategies and visions of the more advanced construction companies, less advanced companies can use them as benchmarks in establishing their own safety-related visions. Finally, we assume it will be helpful for CEOs to use these supplementary points as suggestions for better communication between them and the employees in order to achieve sustainable management.

2. Literature Review

2.1. CEO Message

Studies on CEO messages are aimed at understanding the relationship between a message and the company’s management performance. Na et al. [30] predicted corporate financial ratios by analyzing CEO messages from sustainability reports using sentiment mining and sustainability balanced scorecard methods. The sustainability report draws the conclusion that lack of financial information is necessary and needs to be supplemented. Kohut et al. [20] studied CEO message characteristics for the top 25 and bottom 25 Fortune 500 companies. The syntactic characteristics, such as the total number of words and the number of words per sentence, were investigated, and the findings were that the higher a company’s Return on Equity was, the more words were used in the CEO messages, meaning that these companies’ CEO messages were more verbose. Clatworthy et al. [31] analyzed CEO messages for 100 highly- and poorly-profitable companies to find the relationship between the company’s financial statements and the CEO messages’ text characteristics. The findings were that CEOs of low-profit companies were more focused on promoting the company’s image and future rather than the present story. Clatworthy et al. [32] analyzed CEO messages from the annual reports of 60 companies and conducted research on the readability of these messages from high- and poor-profit companies. Firms with very high profitability tended to discuss acquisitions, divestments, and management results. On the contrary, companies with very low profitability included a lot of discussions on Board replacement.
Most CEO message studies were conducted to understand the messages from a financial perspective, based on aspects such as length, word characteristics, and patterns. Additionally, the results of these studies were obtained using the text mining method. Studies conducted using network analysis are few.

2.2. Message Study and Network Analysis

Typically, an audience may find it difficult to grasp the key points of a speaker if a message is long and wordy. Multiple studies have been conducted in the field of politics to analyze the speeches given to voters [33]. Hong et al. [33] conducted a network analysis to identify the pledges made by three candidates who contested the South Korean presidential elections in 2012, using various speeches. The words’ visibility and connectivity were analyzed to express them visually and interpret their structural relationships. Nam et al. [34] conducted a network analysis on the promotional messages, printed in newspapers, of two Korean presidential candidates and identified the most predominant words and their frequencies. The differences between the words used by the two candidates were compared. Jung et al. [35] extracted directives of the past three South Korean presidents from the National Archives of Korea data and used network analysis to identify their leadership style.
The studies used network analysis to capture the core meaning of the speaker’s message and its expressed visibility. The same can be applied to the research on corporate CEO messages to analyze the management’s will and characteristics, similar to the attempts made to analyze the messages of political leaders in order to identify their intent, inclination, and leadership.

2.3. Safety Characteristics

As safety concerns and the importance of safety has emerged, a number of studies have been conducted on safety characteristics. Herrero et al. [36] analyzed the characteristics of traditional management methods in terms of quality and safety. Guidance to management was suggested from these two aspects of control. Rechenthin [37] stressed that ongoing profitability means safety in terms of schedule, budget, and priorities. It was also concluded that a company with a successful safety program is a sustainable competitor. Yates et al. [38] identified that, among many factors, safety should be a top priority in identifying factors that can hurt employees. They declared that safety should be the core value in every decision within an organization. Reyes et al. [39] used the Health and Safety (H&S) index to evaluate the safety and health levels of a working environment. Looking at two different projects and their H&S indices, it was concluded that the safety and health levels would be satisfactory in the short term but would cause project difficulties in the long term. Using the data of 149 companies, Abad et al. [40] conducted a verification study on the effects of Occupational Safety and Health Administration (OSHAS) 18001. Based on the study, it has been confirmed that the adoption of safety systems in large and complex projects is effective in ensuring safety performance. Choudhry [41] surveyed 25 projects to measure the combination of productivity and safety. The management system that ensures both safety and productivity simultaneously can be more effective than a management system that manages each one separately. Flin et al. [42] studied leadership for effective safety management. Their results indicate that active participation in safety activities and open communication are important. Using system dynamics, Choi et al. [10] analyzed the interrelationship of 41 variables from the perspective of safety culture. Existing campaigns and regulations have been found to have a bad effect if they do not change anew by forming a reinforced loop. Their study also indicated the importance of safety education through the analysis and tracking of accident causes from the perspective of failure to lead and essential leading. Ghodrati et al. [43] analyzed data from 111 projects to determine the factors that affect labor productivity and safety, and established that workers’ management, supervision, leadership, and planning affect safety performance. Hamid [44] collected data from journals, books, and web pages to analyze the root causes of accidents at construction sites and conducted an analysis of accident data provided by the Department of Occupational Safety and Health (DOSH) of Malaysia. In addition to accidents caused by human error, contracts and working conditions were found to be the fundamental causes. Clarke [45] studied the differences in the leadership’s participation in safety. It was concluded that a transactional leadership that complies with rules and regulations is more important than a transformational leadership that encourages employee participation. Laufer [46] concluded that the size of the site and the type of construction did not significantly affect the interests of the construction company, but the number of days of injury and consequent loss had a significant impact on profits. Hedlund et al. [47] made it known that motivation for safety affects safety behavior. The factors that increase safety motivation are participation and opportunities, but the common opinion is that motivating people is difficult.
Safety is the most important research subject because it is directly linked to human life. Methodological features include new methodologies such as text mining and system dynamics over time, and safety factors are found using traditional surveys, interviews, or statistics. The characteristics of the research field are analyzed based on information from directly participating subjects, such as a change in the perception of safety, motivation, leadership, and research linking them to projects such as productivity.

2.4. Safety Related Messages or Keywords Research

Studies that investigate CEO messages in terms of safety in the construction field are few. Amernic et al. [48] determined that the belief of BP’s CEO in safety management was actually reflected in his speech related to the 2010 BP Deepwater Horizon oil spill incident. This study analyzed the meaning of the content in each paragraph of the original text of the CEO message, and the characteristics of safety culture were derived by studying whether or not the word “safety”, which was insisted on, is expressed in the message. Tao et al. [11] collected data related to safety leadership from the Web of Science Core Collection and conducted science mapping to analyze the characteristics that safety leadership contributes to the organization. Based on the mapped results, 40 top and hot keywords were derived in order of frequency. Bamel et al. [49] extracted 494 research documents from the Scopus databases and conducted network analysis to study safety climate trends. Through the derived safety climate research network, keywords were derived, and these keywords were presented as a co-occurrence map of safety climate literature within a time frame. Jin et al. [50] conducted science mapping on 513 research safety-related documents to analyze the characteristics of construction safety. Scholars in the construction safety research community have suggested visualizations and research frameworks linking existing study areas in construction safety to future directions based on the mapping results. Colley et al. [51] interviewed senior managers, supervisors, and workers to investigate safety awareness in organizations and derived important keywords for safety. A network was created with a focus on safety, and important keywords were derived from senior managers, supervisors, and workers.
The CEO message related to safety was insufficient beyond the study to interpret the meaning of specific words. Additionally, keyword research was conducted through network analysis in terms of safety, but it was mostly concentrated on research using data from existing literature.
Previous studies have been based on tables and networks to easily understand the keywords and their relationship to other words using the centrality theory of network analysis [33], or on the simple analysis of trends such as tense, format, frequency of specific words, and the number of words, by focusing specifically on the words themselves. After most network analyses, relationships are interpreted with words at the center location [33,52,53,54]. This approach had limitations, and the associated relationship between deduced words needs to be analyzed further to establish the original meaning, inclination, intent, and direction of the message. It is difficult to find the main node in a complex network, and based on the connection with the core node, consequently, extended research is needed that can be more easily understood by the reader without further interpretation based on association.
Compared to previous studies, our research makes the following contributions: (1) It approaches the construction industry from a safety perspective, which has not been done previously; (2) Safety-related keywords were not found in the existing literature but were derived from CEO messages reflecting the field environment; (3) A network analysis was performed to examine the relationship between words by extending from text mining-based keyword derivation; (4) To simplify the analysis of the network, the network was regenerated through mapping between keywords and factors to derive a structural analysis and safety management characteristics.

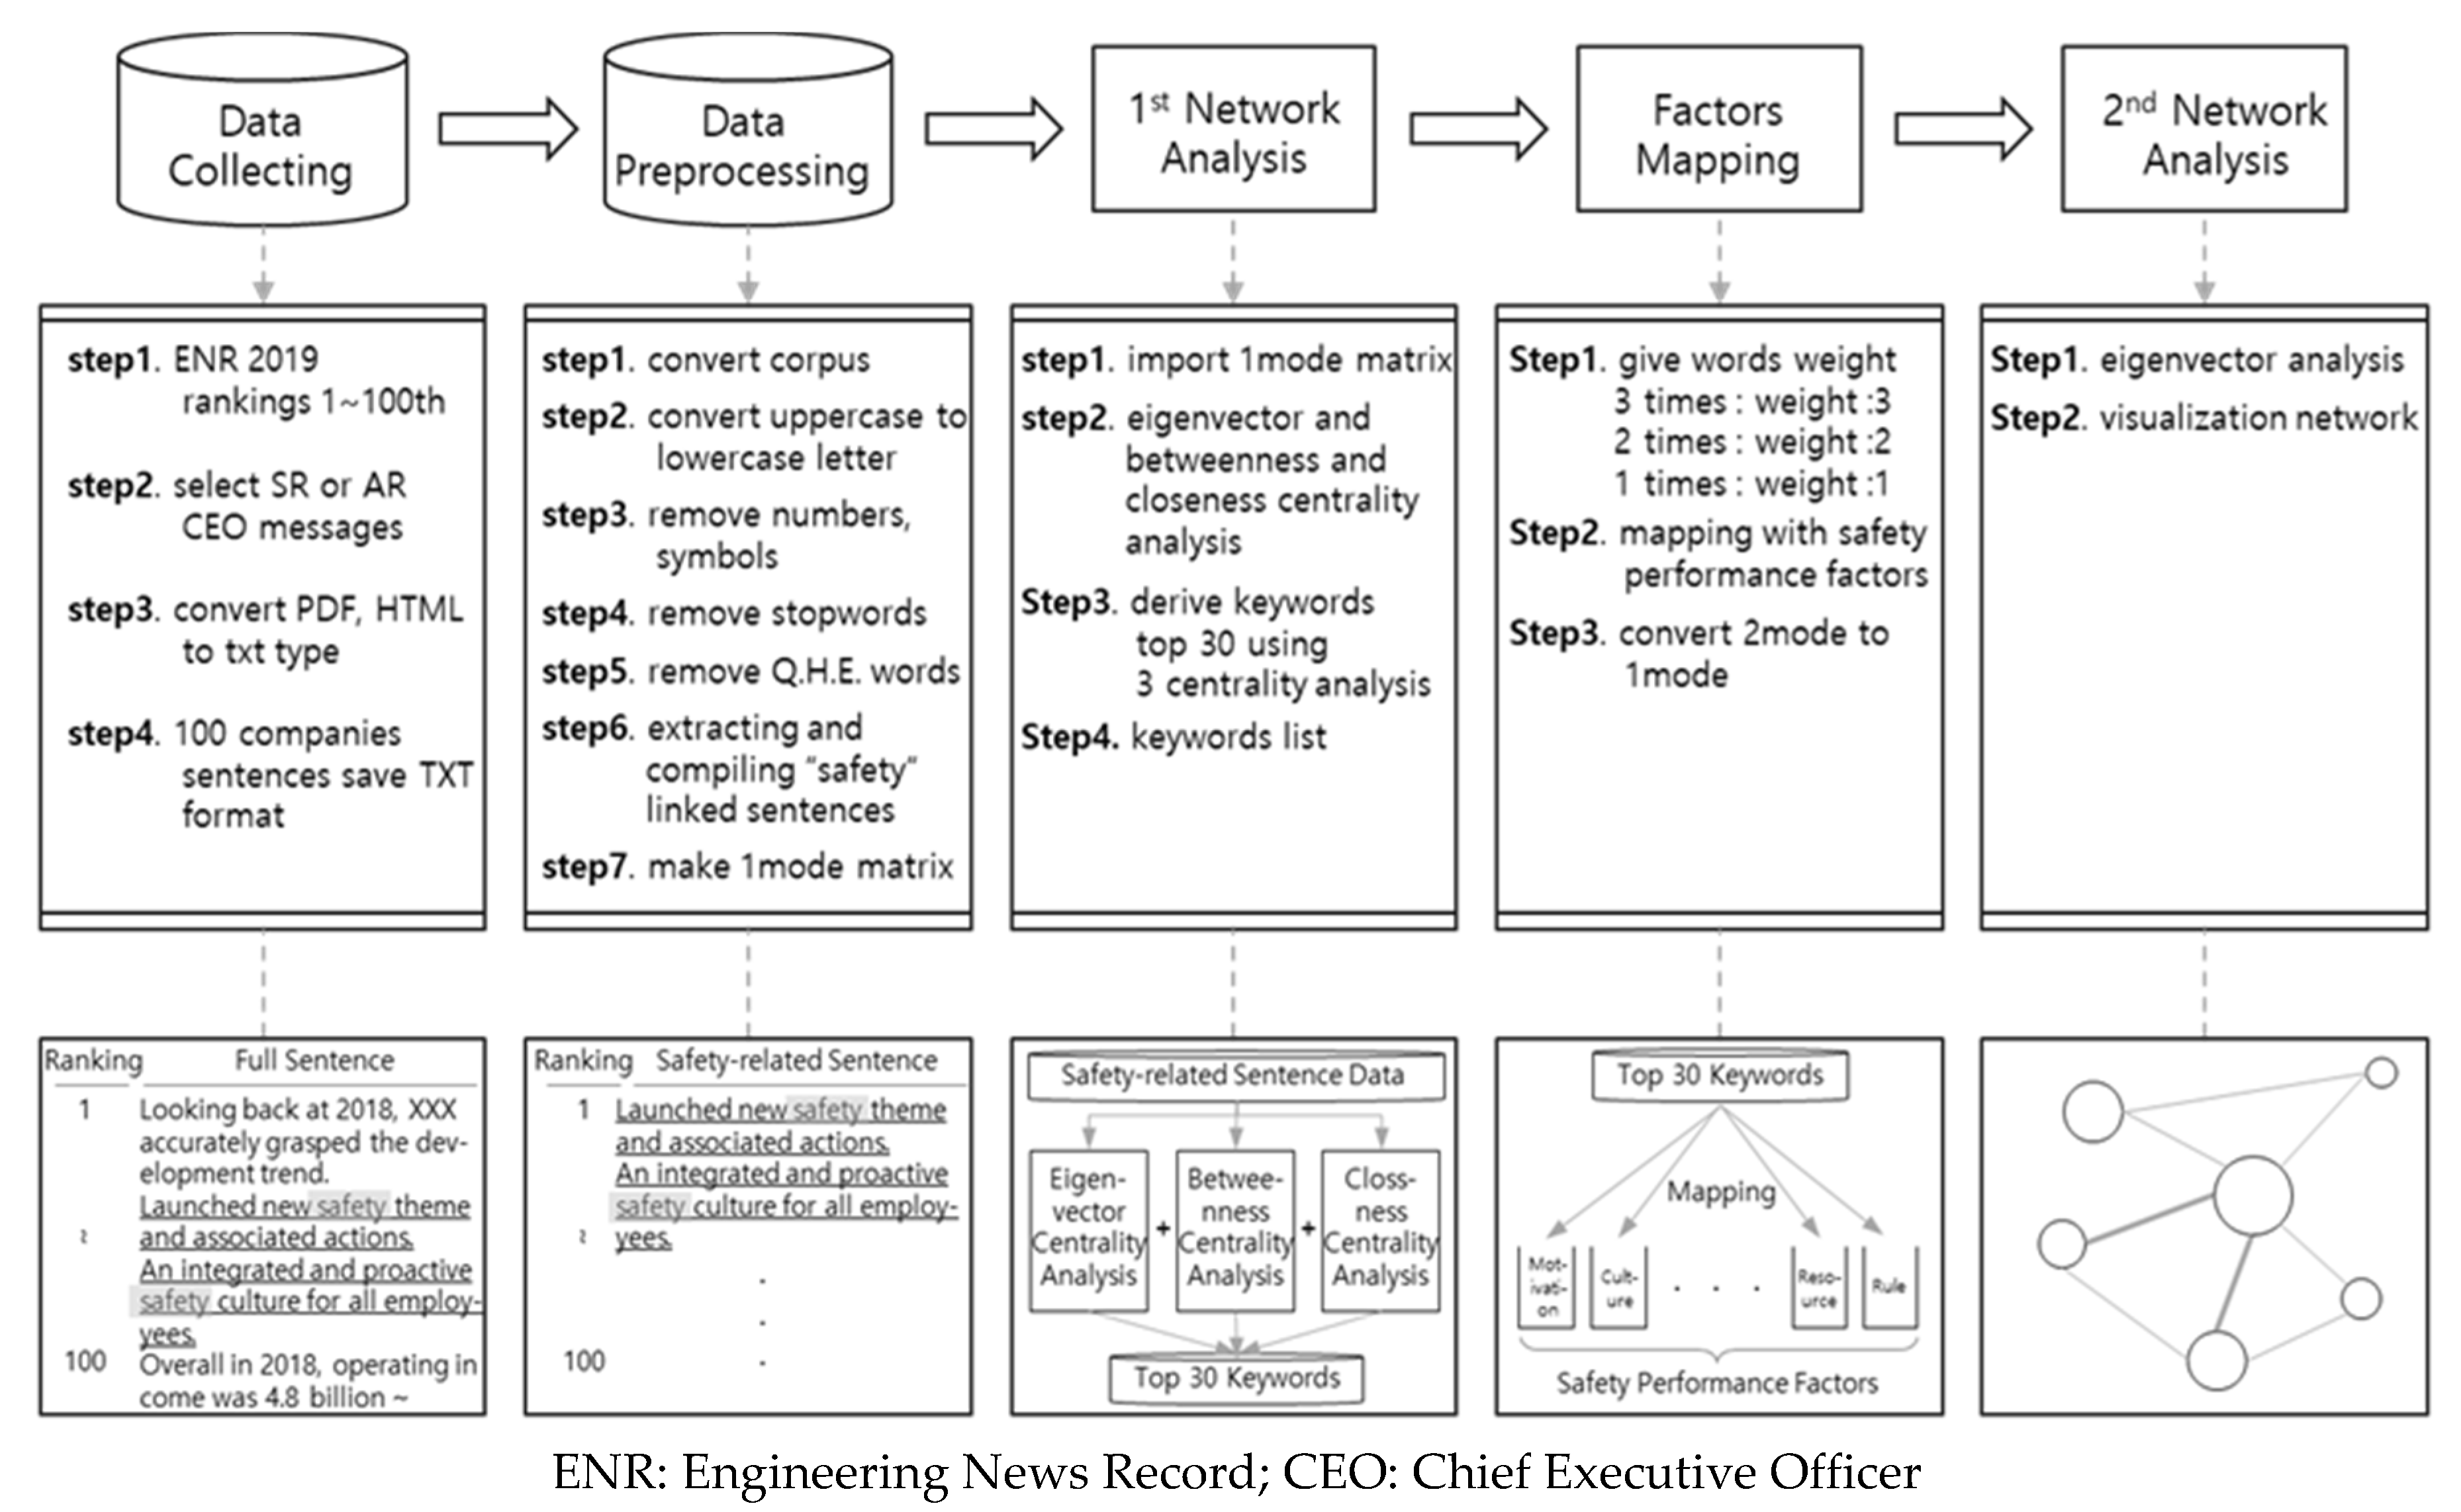
3. Materials and Methods

The procedure and method of this research consisted of five phases, as shown in Figure 1. Each phase was further divided into steps that have been defined, and images are included below to aid the understanding of the research procedure.

3.1. Data Collecting

The construction companies for the analysis were selected based on the Engineering News Record (ENR) rankings [28]. The ENR has been annually announcing the rankings of companies in the construction industry from around the world, based on revenues, since the 1970s. The ENR data have been used in a variety of research in the construction industry because of its reliability [55]. Consequently, the construction companies in this study were selected based on the ENR 2019 rankings.
The data of the top 250 organizations, computed in the year 2019, were used to analyze the characteristics of the most recent CEO messages. The ENR 2019 ranking was determined based on the companies’ 2018 revenue. The range of leading companies was limited to those ranked between 1 and 100. The reason for this limitation is that the total revenue of the top 250 companies in 2018 was USD 487,293 million, whereas that of the top 100 companies was USD 440,683 million, or 90.43% of the total revenue. Thus, we have defined the 100 largest companies as the leading companies based on the overall revenue results and the revenue calculation of the selected companies [28].
The CEO messages were collected based on two features. First, the CEO message had to include the company’s comprehensive details in neutral opinion; second, the message needed to reflect the latest concerns of the company. Typically, the CEO message satisfying these two conditions was the message introduced in annual and sustainability reports. The CEO message provides the overall performance of the respective year, the relevant stance of the company, and the leadership scale that emphasizes the company’s policy [56,57]. The biggest difference between the two types of reports was the inclusion of financial performance; the remaining content being fairly similar. The reports are written in plain language without technical terms, to easily communicate the financial and non-financial performances of the previous year, company image, and company identity [14]. Sustainability reports in particular are written based on Global Reporting Initiative (GRI) standards [58], and therefore the reports are written objectively to contain the overall status of the company rather than only disclosing favorable details [56].
This study is based on the 2018 performance of companies ranked on the ENR. As such, the sustainability reports or annual reports disclosing their 2018 performance were selected. The reports were collected according to publication type per company, because the type of report varies by company as their publication is not a legal requirement. The CEO messaging in 44 sustainability reports, 54 annual reports, and two reports issued in 2018 by companies that do not publish annual reports form the basis of our analysis. The entire CEO message was extracted from the annual reports, sustainability reports, or other types of reports published on the websites of the top 100 companies. To collect the reports, we visited the homepage of all the companies and downloaded each report. Most companies shared the reports in English as well as in their own language, but the reports from seven Chinese companies were available only in Chinese; therefore, we used Google translator to translate those reports. The extracted reports, in PDF or HTML formats, were then converted to a TXT format to create a TXT file containing the 100 CEO messages.

3.2. Data Preprocessing

The information collected in this TXT format was atypical data, comprising characters. The data was preprocessed using text mining to analyze the character data [59]. R version 3.6.3 was used to preprocess the data, and a natural language processing (NLP)-based “tm” package was employed in this study.
First, a corpus was created for each word using the entire sentences. The uppercase letters were changed to lowercase letters, so that “Safety” and “safety” were considered to be the same word. Insignificant numbers, symbols, and articles or prepositions such as “a”, “an”, “the”, “also”, and “for” were removed. Finally, the sentences in which other words were listed next to “safety”, such as Health, Environment, Safety (HES) [60] and Quality, HSE (QHSE) [61], were removed to convert them to meaningful sentences. Subsequently, one TXT file was created by extracting only the sentences containing the word “safety”. For network analysis, the file was converted to a 1-mode matrix where all rows and columns were expressed in words using TermDocumentMatrix and as.matrix, and a CSV file was created in a data-frame format.

3.3. 1st Network Analysis

Unlike traditional text analysis, which only analyzes the frequency of a word’s appearance or the sentence content, language network analysis is an extended text analysis method where the frequency of a word’s appearance, as well as the underlying relationship between words and the structural relationship, can be identified [62]. Using the same format as social network analysis, which is used in network analyses, the node that corresponds to an actor represents words, whereas the link that corresponds to the relationship represents the relationship between words [63]. The directionality when connecting nodes is neglected [64].
Centrality analysis, which is a quantitative analysis method, is most frequently used for finding keywords in network analyses [65]. Centrality can be numerically interpreted such that higher centrality means a keyword is in the center of the network, mentioned often, and the relationship is close. Software that can be used for centrality analysis, such as Gephi version 0.9.2, is favored because of its excellent visualization performance and open-source nature [66].
For centrality analysis, terms include degree centrality, betweenness centrality, closeness centrality, suggested by Friedkin [67], and eigenvector centrality, suggested by Bonacich [68]. Degree centrality is simply the case where a node is connected to another node. Degree centrality is greater when a node is connected to as many nodes as possible regardless of the nature of the other nodes. Betweenness centrality refers to when the connection between one group and another group is high through the connection between one node and another node. The connection between groups is broken when the node with high betweenness centrality disappears. Closeness centrality is based on the closeness of nodes and measured based on all the connections, including direct and indirect connections. Considering the shortest distance from a specific node to another node, closeness centrality has the fastest influence. It can be compared to the fastest spreader when a virus breaks out. Eigenvector centrality is used for measuring the influence of a node in which the centrality of the node is measured considering the weight and centrality of neighboring nodes, rather than simply linked nodes. If node A is connected to another node with a higher weight and node B is connected to three other nodes with lower weights, the eigenvector centrality of node A is higher. In this phase of the process, the relationship and importance of the words within sentences are measured. The words are extracted by analyzing betweenness centrality, closeness centrality, and eigenvector centrality, without analyzing degree centrality, which only considers simple linked nodes [33].

3.4. Factors Mapping

The 30 highest centrality values of each betweenness centrality, closeness centrality, and eigenvector centrality were listed to extract the words, including repetitions. Based on the results of the three centrality analyses, weights were given to the words to measure the node importance as follows (B: Betweenness centrality, C: Closeness centrality, E: Eigenvector centrality).
  • B ∩ C ∩ E = Weight 3
  • B ∩ C or B ∩ E or C ∩ E = Weight 2
  • only B or C or E = Weight 1
After creating a list of words including weights, the mapping and classification of specific indices were performed to analyze the characteristics of the extracted words. The safety performance factors announced in 2018 by Mohammadi et al. [29] were used among various safety performance indices to select specific indices to reflect the latest research and trends.
The factors mentioned above consisted of 13 main factors, which were: (1) Motivation, (2) Rules and Regulation, (3) Competency, (4) Safety Investment and Costs, (5) Financial Aspects and Productivity, (6) Resource and Equipment, (7) Work Pressure, (8) Work Condition, (9) Culture and Climate, (10) Attitude and Behavior, (11) Lessons Learned from Accidents, (12) Organization, and (13) Safety Programs and Management Systems, as well as 95 sub-factors.
By searching for sentences containing words, and by considering the dictionary definition of these words, and the context of the sentences, the meaning of the words was mapped with safety performance factors. Each word was mapped with up to three factors by default. If a word was mapped with more than four factors, the factors with multiple mappings were prioritized for three centrality criteria. If the priority could not be deduced based on multiple mappings, the words were required to satisfy the three centrality criteria by referring to the opinion of experts. The mapping of words and factors was finalized after interviewing these experts. The expert group consisted of six individuals who currently work at large construction companies in Korea, each having more than 10 years of experience and being licensed safety professionals. The interviews were conducted from May 12 to May 19, 2020 to improve the objectivity of the mapping results.
The mapping data above were in a 2-mode matrix where the relationship between the words in rows and safety performance factors in columns could be identified. The ultimate goal of this study is to analyze the characteristics of safety management by examining the relationship of safety performance factors. Therefore, a 2-mode matrix, having two objects in different rows and columns, was transformed into a 1-mode matrix, where the associated relationship could be identified by classifying it into one object in the same row and column [69], using the MMULT and TRANSPOSE functions in Microsoft Excel.

3.5. 2nd Network Analysis

In the first network analysis (Section 3.3), the three centrality analysis methods were used to deduce all of the possible words based on the central location, associated relationship, and proximity distance on the network. In the second network analysis, eigenvector centrality analysis was performed to identify the key nodes of the safety performance factors. Higher eigenvector centrality implied that the node was connected to a major node nearby [70].
In our studies analyzing major nodes on a network, eigenvector centrality analysis was conducted to analyze influential individuals on Twitter [71], and eigenvector centrality was applied to a study on the leadership in online collaborative learning in order to detect key individuals who could provide intervention [22]. Eigenvector centrality was also used in a study to find the major nodes on key power grids in an electrical system analysis [72].
Visualization using Gephi version 0.9.2 software was performed based on the results of the eigenvector centrality analysis, and the relationship and major factors of safety management characteristics were visually represented, which was the ultimate goal of this study.

4. Results

4.1. Deducing the List of Words

The top rank 30 words with the highest centrality values were extracted for eigenvector centrality, betweenness centrality, and closeness centrality, as shown in Table 1. A total of 40 words were deduced, including repetitions. The words ranked 1st to 17th, which made up more than half of the rank 30 words, all had high centrality values for the three types of centrality. In particular, the words “management”, “value”, “employee”, “system”, “project”, “culture”, “new”, and “practice” were all ranked in the top 10 for all of the centrality analyses, and thus were the most important words.
On the other hand, the word “profit” had high betweenness centrality but low eigenvector centrality and closeness centrality, while the word “incident” had high closeness centrality but low betweenness centrality and eigenvector centrality. The word “core” was relevant for only eigenvector centrality and betweenness centrality, while the words “standard”, “recognition”, and “efficiency” were relevant for only eigenvector centrality and closeness centrality. The words “commitment” and “responsibility” were relevant for only betweenness centrality and closeness centrality, while the words “care”, “accident”, “creation”, and “law” all had only one high centrality index among the three centrality indices.

4.2. Selecting Weighted Words

The classification of words to which weight was given based on the results of the centrality analysis are shown in Table 2. A total of 22 words (including “basis” and “culture”) belonged to the Weight 3 cluster, six words (including “commitment” and “core”) belonged to the Weight 2 cluster, and 12 words (including “accident” and “campaign”) belonged to the Weight 1 cluster.

4.3. Mapping with Safety Performance Factors

The mapping results of the weighted words and safety performance factors are shown in Table 3, Table 4 and Table 5 according to their weight cluster. Table 3 shows their relationship with words in the Weight 3 cluster.
The mapping frequency of Culture and Climate was ten, that of Safety Programs and Management Systems was nine, that of Competency was seven, that of Resource and Equipment was six, and that of Motivation and Work Pressure was five each. The rest of the words were mapped between one to four times. All of the factors were mapped.
The words in the Weight 2 cluster are shown in Table 4. The factors Motivation, Rules and Regulation, Resource and Equipment, Culture and Climate, Attitude and Behavior, Lesson Learned from Accidents, and Safety Programs and Management Systems were each mapped twice. Safety Investment and Costs and Work Condition were not mapped with the factors.
The words in the Weight 1 cluster are shown in Table 5. Resource and Equipment were mapped five times, Rules and Regulation, Work Pressure, and Safety Programs and Management Systems were mapped four times, and the rest of the words were mapped between one to three times. All of the factors were mapped.

4.4. Network Visualization

After mapping the words with the safety performance factors, eigenvector centrality analysis was performed to identify the relationships among the safety performance factors, after which the network was visualized [73].
The network formed based on eigenvector centrality analysis is shown in Figure 2. The three pink nodes in the center of the network, which are Resource and Equipment, Motivation, and Rules and Regulation, are the key nodes. The node that is located the farthest is Safety Investment and Costs. When the structural relationship of the three key nodes is examined, Resource and Equipment forms a strong connection with Work Pressure and Competency, Motivation forms a strong connection with Culture and Climate and Safety Programs and Management Systems, and Rules and Regulation forms a strong connection with Culture and Climate and Organization. Culture and Climate has the strongest connection with Safety Programs and Management Systems and Competency based on the large number of connected nodes, although the eigenvector centrality value was not high. Safety Investment and Costs, which had the lowest eigenvector centrality, is connected to Organization and Financial Aspects and Productivity.

5. Discussion

5.1. Meaning of the Keywords

A total of 40 words were deduced from the results of this study, as shown in Table 1. The keywords were arranged from the highest to the lowest quantitative value of betweenness, closeness, and eigenvector centrality. The top 10 keywords were “management”, “value”, “employee”, “system”, “project”, “culture”, “new”, “occupational”, “practice”, and “basis” in order from 1st to 10th. The examples of CEO messages in which the keywords were used are shown below.
  • As CEO, I understand that safety management is my greatest management concern …
  • We continue to prioritize our safety core value …
  • Provide our employees, our greatest assets, with safe working conditions …
  • Continuing to improve and enhance our safety systems …
  • To develop and drive stronger safety productivity for construction engineering projects …
  • Maintain an integrated proactive safety culture for all employees, subcontractors, and stakeholders …
  • Launched new safety theme with associated actions …
  • Enhanced awareness of occupational safety issues has led to a sharp …
  • Improved safety practices build execution capability …
  • Our strategic goal is to improve operational efficiency and safety on an ongoing basis …
In summary, the concept of safety was perceived to be at the level of management rather than control [36], and the CEOs exhibit an active attitude toward safety, which can be deemed to be one of their core values. These values, which have traditionally focused on productivity in the past, have now been expanded to encompass the concept of safety, which has become a so-called “core value” [37,38]. The CEOs prioritize the safety of employees and emphasize a safe working space, environment, and conditions [39]. An integrated system has been deemed to be important, in particular because the construction industry typically involves an array of complex processes and work types using various systems [40,41]. The management of safety performance in projects is especially important, because the industry operates on the basis of winning project contracts. Furthermore, it is noticeable how the CEOs stress a safety culture with which all members of the organization can empathize and comply [42]. In particular, the word “new” was used for newly developed and communicated safety-related campaigns or regulations suitable for specific circumstances [10,74]. Considering the nature of roles in the construction industry, the CEOs treat safety issues as important, highlighting the significance of mature and safe behavior through training and preparation, and express that safety is a most basic and core component of their “core values”.

5.2. Comparing the Trends of the Keywords

The keywords deduced in this study were compared with those in previous studies conducted on safety. Keywords related to construction safety were selected and then compared with six words from each study. Colley et al. [51] deduced the keywords on safety that were considered to be important by senior supervisors and workers through a questionnaire and interviews in a study conducted in 2012. The keywords considered important by senior supervisors were “hazards”, “culture”, “inspection”, “responsibility”, “environment”, and “people”, in that order. Jin et al. [50] derived “human”, “management”, “accident”, “risk”, “behavior”, and “climate” in that order from a literature review on construction safety in 2019, while Tao et al. [11] deduced “performance”, “climate”, “leadership”, “behavior”, “culture”, and “management” from a literature review on safety leadership in 2020. People (= human), culture (= climate), and management were the commonly classified keywords. Commonality with the keywords derived from this study were “management”, “culture (= climate)”, and “employee (= people, human)”, which were similar to the keywords deemed to be of high importance. The words “accident”, “responsibility”, and “performance” were also deduced as keywords, but they have less significance. Accordingly, the importance of the keywords deduced in research studies and the frequency of the keywords considered to be important in actual CEO messages have similar trends. It can be construed that safety-related keywords from a research perspective and those considered important by CEOs, which were “management”, “employee”, and “culture”, are the most important keywords.

5.3. Characteristics of Safety Management

This study aims to deduce keywords through centrality analysis and further examine the characteristics of safety management through mapping with safety performance factors. Based on the deduced words with high centrality and the frequency of mapping with these factors, it can be predicted that Culture and Climate [11,51] and Safety Programs and Management Systems [50], factors with the highest frequency, would also be featured highly in the characteristics of safety management.
However, different results were obtained. To explain the characteristics of safety management, the meanings of the words mapped with the three safety performance factors in the center of the network were defined and interpreted through structural analysis.
First, Resource and Equipment was emphasized. Here, Resource refers to personnel, while Equipment refers to the safety facility and safety gear. As understood from the words “employee”, “people”, “incident”, and “care”, any accidents involving human injuries would cause a tremendous amount of damage, compensation, and responsibility [4]; thus, the safety of all stakeholders, employees, partnered companies, and workers can be considered to be important. Moreover, the words “basis”, “vision”, and “management” show that the protection of human resources is fundamental to a company, while the words “commitment” and “responsibility” underscore the importance of such accountability. Finally, the words “project”, “engineering”, “creation”, and “productivity” highlight that using appropriate methods and the competence of the workforce can improve productivity [39,43].
Work Pressure and Competency factors are structurally closely connected. CEOs ensure in advance that their employees are aware that accidents may be caused by the pressure to meet a construction deadline, the accumulation of fatigue, and prolonged hours of work [44], thereby leading the organization in a way that reduces the potential for human harm. The need for safety education is also related to awareness and knowledge of risks. Therefore, it can be inferred that CEOs stress the importance of human resources, proper planning to avoid the pressure of work, and the prevention of accidents involving injuries by accumulating relevant knowledge through education [10].
Second, Rules and Regulation was emphasized. Here, Rules encompass safety aspects as well as regulations and legislation related to work. The words “essential”, “basis”, and “vision” imply that safety is a basic responsibility that needs to be fulfilled, thus indicating a company’s strategic direction. Laws refer to internal regulations as well as public legislation that all companies must abide by, in which the words “standard” and “creation” imply that new standards need to be developed and revised continuously to fit circumstances, and the word “international” stresses the significance of abiding by both domestic and international laws.
Culture and Climate, and Organization factors are structurally closely connected. All organization members must be aware of and comply with regulations, which is fairly difficult [45], which is why a leadership is required to create a climate and culture that can be embraced by all employees. Large-scale accidents can lead to a reduction in business profits and company image, thus impacting on the company’s survival [46]. Consequently, it is considered to be an important factor influencing the current and future status of a company.
Third, Motivation was emphasized. Here, Motivation refers to blueprints for the future and programs that underpin motivation. The words “goal”, “growth”, and “future” suggest that the aims and objectives related to the safety management of a company should be clearly stated. As words such as “new”, “campaign”, and “execution” signify, incentive programs should be developed to encourage the participation of employees. Moreover, the words “recognition” and “commitment” imply that all of the employees should be aware of and engage in relevant safety activities, while the word “satisfaction” highlights the idea that such behavior leads to improved employee satisfaction and a more cautious attitude at work.
Culture and Climate and Safety Programs and Management Systems factors are structurally closely connected. Motivation cannot be forced upon employees [47]; therefore, positive results are typically promoted by forming a climate or culture in which all of the employees are willing to participate. Moreover, a close relationship between workers and supervisors should be formed [10]. Hence, a system should be created where the workers can trust and be trusted, and therefore be motivated based on trustworthiness.
As shown by the keywords, the frequency of Culture and Climate is high, but its centrality is lower than that of the other factors. Safety culture and safety climate have often been defined and mentioned as research topics. The CEOs of the leading companies need to align the Culture and Climate with targeted areas and the strategic direction of the company, rather than merely stressing their culture or climate, in order to deliver a messages designed to induce employees to perceive and behave in a desirable way.

6. Conclusions

6.1. Proposals for CEO Messages

The following proposals can be made based on the characteristics of safety management identified by analyzing CEO messages.
First, the words considered important by actual workers need to be included and emphasized in CEO messages, beside conventional managerial aspects. In a study by Colley et al. [51], the keywords considered important by workers were “rules”, “co-worker”, “training”, and “reporting”. Strategies should be established to use words that can be understood by workers who are most highly exposed to the risks of accidents as they perform tasks at work sites.
Second, as shown in the network visualization results in Section 4.4, the Safety Investment and Costs factor that had a low centrality should to be mentioned in the CEO’s messaging. Because the impact is greater when the CEO is directly involved with safety issues [75], the message should highlight the company’s intention to make financial investments in matters of safety when establishing the corporate vision and strategies related to safety performance.
Third, along with the words directly related to “safety”, the use of various words that emphasize and alert employees to safety issues are required. In the list of deduced words in Section 4.1, the words related to safety among the top 30 words are “accident” and “incident”. However, words such as “injury”, “fatality”, “near-miss”, and “human rights” that have low centrality are also inferred. Hence, using words directly related to safety that have a significant impact on the organization’s members can express the CEO’s keen interest and will in securing their safety.

6.2. Limitations and Future Plans

The latest data of the ENR 2019 rankings were used when selecting the companies for data collection. The ENR 2019 was produced based on the records of the year 2018, and thus annual reports and sustainability reports that covered the year 2018 were selected for the research data. The reports published by companies cover the respective year, the past three years, or the past five years; hence, the scope of our study was limited to data covering only 2018, for reasons of data consistency. Due to this limitation (that only the data from 2018 were used), it is clear that more diverse results may be produced if ample data on different years were available.
An array of research on safety-related CEO messages should be conducted in the future. As Kohut et al. [20] attempted in their study, a CEO’s devotion to safety can be compared by dividing organizations into upper and lower groups. The frequency of using the word “safety” and the characteristics of safety management could be compared between the upper and lower groups. Should such research be carried out, it could be significant for second-mover companies that aspire to become market leaders.
Furthermore, CEO messages of the companies that remain highly ranked on the ENR for long periods of time could be analyzed. This research would be possible because the ENR ranking is produced every year and displays changes in the rankings based on the previous year. The companies that remain highly ranked can be assumed to practice sustainable management, and analyzing the CEO messages of such companies could be meaningful.

Author Contributions

Conceptualization, Y.G.C.; methodology, Y.G.C.; software, Y.G.C.; validation, K.T.C.; formal analysis, Y.G.C.; writing—original draft preparation, Y.G.C.; writing—review and editing, Y.G.C. and K.T.C.; supervision, Y.G.C. All authors have read and agreed to the published version of the manuscript.

Funding

This research received no external funding.

Conflicts of Interest

The authors declare no conflict of interest.

References

  1. Lijuan, B.; Xiangbin, Y.; Guang, Y. Impact of CEO media appearance on corporate performance in social media. N. Am. J. Econ. Financ. 2019, 50, 100996. [Google Scholar]
  2. Cha, D.W. A study of recent research on CEO leadership. Korea Acad. Manag. 2005, 29, 205–258. [Google Scholar]
  3. Donald, C.H.; Gregory, D.S.F. The Seasons of a Ceo’s Tenure. Acad. Manag. Rev. 1991, 16, 719–742. [Google Scholar]
  4. Seo, N.K.; Lee, Y.G.; Kim, W.B.; Lee, K.Y. Effects of Occupational Safety Communication in Workplace on Safety Consciousness and Action of Employees. J. Korea Saf. Manag. 2010, 12, 9–16. [Google Scholar]
  5. Cheng, E.W.L.; Ryan, N.; Kelly, S. Exploring the perceived influence of safety management practices on project performance in the construction industry. Saf. Sci. 2012, 50, 363–369. [Google Scholar] [CrossRef]
  6. Muñiz, B.F.; Peón, J.M.M.; Ordás, C.J.V. Relation between occupational safety management and firm performance. Saf. Sci. 2009, 47, 980–991. [Google Scholar] [CrossRef]
  7. Caffaro, F.; Bagagiolo, G.; Micheletti, C.M.; Cavallo, E. Participatory Ergonomic Design of a Safety Training Tool for Migrant Workers in Agriculture. Chem. Eng. Trans. 2017, 58, 25–30. [Google Scholar]
  8. Dong, X.S.; Entzel, P.; Schneider, S. Effects of safety and health training on work-related injury among construction laborers. J. Occup. Environ. Med. 2004, 46, 1222–1228. [Google Scholar]
  9. Dong, X.S.; Fujimoto, A.; Ringen, K.; Men, Y. Fatal falls among Hispanic construction workers. Accid. Anal. Prev. 2009, 41, 1047–1052. [Google Scholar] [CrossRef]
  10. Choi, Y.G.; Cho, K.T. A Cause Analysis of the Construction Incident Using Causal Loop Diagram: Safety Culture Perspective. J. Korea Saf. Manag. 2020, 35, 34–46. [Google Scholar]
  11. Tao, J.; Yang, F.; Qiu, D.; Reniers, G. Analysis of safety leadership using a science mapping approach. Process Saf. Environ. Prot. 2020, 140, 244–257. [Google Scholar] [CrossRef]
  12. Mahmoudi, S.; Ghasemi, F.; Mohammadfam, I.; Soleimani, E. Framework for Continuous Assessment and Improvement of Occupational Health and Safety Issues in Construction Companies. Saf. Health Work 2014, 5, 125–130. [Google Scholar] [CrossRef] [Green Version]
  13. Molnar, M.M.; Schwarz, U.V.T.; Hellgren, J.; Hasson, H.; Tafvelin, S. Leading for Safety: A Question of Leadership Focus. Saf. Health Work 2019, 10, 180–187. [Google Scholar] [CrossRef] [PubMed]
  14. Oliver, S. Message from the CEO: A three-minute rule? Corp. Commun. 2000, 5, 158–167. [Google Scholar] [CrossRef]
  15. Men, L.R.; Tsai, W.H.S. Public engagement with CEOs on social media: Motivations and relational outcomes. Public Relat. Rev. 2016, 42, 932–942. [Google Scholar] [CrossRef]
  16. Yook, K.H. CEOs Talk about Social Responsibilities and Sustainable Performance: Applications of Text Mining Approach. Korea Account. 2018, 27, 253–279. [Google Scholar] [CrossRef]
  17. Amernic, J.; Craig, R. Improving CEO-speak. J. Account. 2007, 203, 65–66. [Google Scholar]
  18. Amernic, J.H.; Craig, R.J. Guidelines for CEO-speak: Editing the language of corporate leadership. Strategy Leadersh. 2007, 35, 25–31. [Google Scholar] [CrossRef]
  19. Bournois, F.; Point, S. A letter from the president: Seduction, charm and obfuscation in French CEO letters. J. Bus. Strategy 2006, 27, 46–55. [Google Scholar] [CrossRef]
  20. Kohut, G.F.; Kohut, A.H. The President’s Letter to Stockholders: An Examination of Corporate Communication Strategy. J. Bus. Commun. 1992, 29, 7–21. [Google Scholar] [CrossRef]
  21. Kim, S.H.; Lee, W.S. Network text analysis of medical tourism in newspapers using text mining: The South Korea case. Tour. Manag. Perspect. 2019, 31, 332–339. [Google Scholar] [CrossRef]
  22. Xie, K.; Tosto, G.D.; Lu, L.; Cho, Y.S. Detecting leadership in peer-moderated online collaborative learning through text mining and social network analysis. Internet High Educ. 2018, 38, 9–17. [Google Scholar] [CrossRef]
  23. Ehrlich, K.; Lin, C.Y.; Fisher, V.G. Searching for experts in the enterprise: Combining text and social network analysis. In Proceedings of the ACM 2007 International Conference on Supporting Group Work, Fort Myers, FL, USA, 4–7 November 2007; pp. 117–126. [Google Scholar]
  24. Butts, C. Social network analysis: A methodological introduction. Asian J. Soc. Psychol. 2008, 11, 13–41. [Google Scholar] [CrossRef] [Green Version]
  25. Drieger, P. Semantic Network Analysis as a Method for Visual Text Analytics. Procedia—Soc. Behav. Sci. 2013, 79, 4–17. [Google Scholar] [CrossRef] [Green Version]
  26. Gwon, H.B.; Lee, C.H. A Study on Relationship Analysis Between Safety Performance and Business Performance. In Proceedings of the Korea Saf. Manag. Sci. Conf., Application of Information service in safety management science, Seoul, Korea, 17 November 2001; pp. 187–191. [Google Scholar]
  27. Patankar, M.S.; Brown, J.P.; Sabin, E.J.; Bigda-Peyton, T.G. Safety Culture: Building and Sustaining a Cultural Change in Aviation and Healthcare, 1st ed.; Ashgate Publishing Company: Farnham, UK, 2011; pp. 113–146. [Google Scholar]
  28. ENR (Engineering News Record). ENR’s 2019 Top 250 International Contractors 1–100. Available online: https://www.enr.com/toplists/2019-Top-250-International-Contractors-1 (accessed on 20 April 2020).
  29. Mohammadi, A.; Tavakolan, M.; Khosravi, Y. Factors influencing safety performance on construction projects: A review. Saf. Sci. 2018, 109, 382–397. [Google Scholar] [CrossRef]
  30. Na, H.J.; Lee, K.C.; Choi, S.U.; Kim, S.T. Exploring CEO Messages in Sustainability Management Reports: Applying Sentiment Mining and Sustainability Balanced Scorecard Methods. Sustainability 2020, 12, 590. [Google Scholar] [CrossRef] [Green Version]
  31. Clatworthy, M.A.; Jones, M.J. Differential patterns of textual characteristics and company performance in the chairman’s statement. Account. Audit. Account. J. 2006, 19, 493–511. [Google Scholar] [CrossRef]
  32. Clatworthy, M.A.; Jones, M.J. The Effect of Thematic Structure on the Variability of Annual Report Readability. Account. Audit. Account. J. 2001, 14, 311–326. [Google Scholar] [CrossRef]
  33. Hong, J.H.; Yun, H.J. Presidential Candidate’s Speech based on Network Analysis: Mainly on the Visibility of the Words and the Connectivity between the Words. J. Korea Contents 2014, 14, 24–44. [Google Scholar] [CrossRef] [Green Version]
  34. Nam, I.Y.; Park, H.W. Network analysis of headlines in the newspaper articles on the prospective presidential candidates and their PR strategy in Korea. Korea Party Stud. 2007, 6, 79–107. [Google Scholar]
  35. Jung, Y.Y. Semantic Network Analysis for the President Directions Item: Focusing on Patterns (2001~2009). J. Conver. Cult. Tech. 2018, 4, 129–137. [Google Scholar]
  36. Herrero, S.G.; Saldaña, M.A.M.; Campo, M.A.M.; Ritzel, D.O. From the traditional concept of safety management to safety integrated with quality. J. Saf. Res. 2002, 33, 1–20. [Google Scholar] [CrossRef]
  37. Rechenthin, D. Project safety as a sustainable competitive advantage. J. Saf. Res. 2004, 35, 297–308. [Google Scholar] [CrossRef] [PubMed]
  38. Yates, G.R.; Bernd, D.L.; Sayles, S.M.; Stockmeier, C.A.; Burke, G.; Merti, G.E. Building and Sustaining a Systemwide Culture of Safety. J. Qual. Patient Saf. 2005, 31, 684–689. [Google Scholar] [CrossRef]
  39. Reyes, J.P.; San-José, J.T.; Cuadrado, J.; Sancibrian, R. Health & Safety criteria for determining the sustainable value of construction projects. Saf. Sci. 2014, 62, 221–232. [Google Scholar]
  40. Abad, J.; Lafuente, E.; Vilajosana, J. An assessment of the OHSAS 18001 certification process: Objective drivers and consequences on safety performance and labour productivity. Saf. Sci. 2013, 60, 47–56. [Google Scholar] [CrossRef]
  41. Choudhry, R.M. Achieving safety and productivity in construction projects. J. Civil Eng. Mang. 2017, 23, 311–318. [Google Scholar] [CrossRef]
  42. Flin, R.; Yule, S. Leadership for safety: Industrial experience. BMJ Qual. Saf. 2004, 13, 45–51. [Google Scholar] [CrossRef] [Green Version]
  43. Ghodrati, N.; Yiu, T.W.; Wilkinson, S. Unintended consequences of management strategies for improving labor productivity in construction industry. J. Saf. Res. 2018, 67, 107–116. [Google Scholar] [CrossRef]
  44. Hamid, A.R.A.; Majid, M.Z.A.; Singh, B. Causes of accidents at construction site. Mal. J. Civ. Eng. 2008, 20, 242–259. [Google Scholar]
  45. Clarke, S. Safety leadership: A meta-analytic review of transformational and transactional leadership styles as antecedents of safety behaviours. J. Occup. Organ. Psychol. 2013, 86, 22–49. [Google Scholar] [CrossRef]
  46. Laufer, A. Construction accident cost and management safety motivation. J. Occup. Accid. 1987, 8, 295–315. [Google Scholar] [CrossRef]
  47. Hedlund, A.; Gummesson, K.; Rydell, A.; Andersson, I. Safety motivation at work: Evaluation of changes from six interventions. Saf. Sci. 2016, 82, 155–163. [Google Scholar] [CrossRef]
  48. Amernic, J.; Craig, R. CEO speeches and safety culture: British Petroleum before the Deepwater Horizon disaster. Crit. Perspect. Account. 2017, 47, 61–80. [Google Scholar] [CrossRef] [Green Version]
  49. Bamel, U.K.; Pandey, R.; Gupta, A. Safety climate: Systematic literature network analysis of 38 years (1980–2018) of research. Accid. Anal. Prev. 2020, 135, 105387. [Google Scholar] [CrossRef]
  50. Jin, R.; Zou, P.X.W.; Piroozfar, P.; Wood, H.; Yang, Y.; Yan, L.; Han, Y. A science mapping approach based review of construction safety research. Saf. Sci. 2019, 113, 285–297. [Google Scholar] [CrossRef]
  51. Colley, S.K.; Neal, A. Automated text analysis to examine qualitative differences in safety schema among upper managers, supervisors and workers. Saf. Sci. 2012, 50, 1775–1785. [Google Scholar] [CrossRef]
  52. Joo, C.; Woo, H. Textual analysis of a political message: The inaugural addresses of two Korean presidents. Soc. Sci. Inf. 2010, 49, 215–239. [Google Scholar]
  53. Tremayne, M. Anatomy of Protest in the Digital Era: A Network Analysis of Twitter and Occupy Wall Street. Soc. Mov. Stud. 2014, 13, 110–126. [Google Scholar] [CrossRef]
  54. Getchell, M.C.; Sellnow, T.L. A network analysis of official Twitter accounts during the West Virginia water crisis. Comput. Hum. Behav. 2016, 54, 597–606. [Google Scholar] [CrossRef]
  55. Weisheng, L. Reliability of Engineering News-Record international construction data. Constr. Manag. Econ. 2014, 32, 968–982. [Google Scholar]
  56. Cong, Y.; Freedman, M.; Park, J.D. Tone at the top: CEO environmental rhetoric and environmental performance. Adv. Account. 2014, 30, 322–327. [Google Scholar] [CrossRef]
  57. Amernic, J.; Craig, R.; Tourish, D. Measuring and Assessing Tone at the Top Using Annual Report CEO Letters, 1st ed.; The Institute of Chartered Accountants of Scotland: Edinburgh, UK, 2010; pp. 25–34. [Google Scholar]
  58. GRI (Global Reporting Initiative). GRI Standard. Available online: https://www.globalreporting.org/standards/gri-standards-download-center/ (accessed on 24 April 2020).
  59. Jung, K.H. A Study of Foresight Method Based on Textmining and Complexity Network Analysis; Final Report; KISTEP(Korea Institute of S&T Evaluation and Planning): Seoul, Korea, 2010. [Google Scholar]
  60. Danielsen, D.A.; Torp, O.; Lohne, J. HSE in Civil Engineering Programs and Industry Expectations. Procedia Eng. 2017, 196, 327–334. [Google Scholar] [CrossRef]
  61. Wu, Y.; Zhang, B. The Application of Enterprise QHSE Management Performance Evaluation System Based on Maturity Model. In 19th International Conference on Industrial Engineering and Engineering Management; Springer: Berlin, Germany, 2013; pp. 1075–1085. [Google Scholar]
  62. Lee, S.S. A Content Analysis of Journal Articles Using the Language Network Analysis Methods. J. Korea Soc. Inform. Mang. 2014, 31, 49–68. [Google Scholar] [CrossRef] [Green Version]
  63. Lee, I.W.; Lee, Y.M. Semantic Network Analysis on Core Values and Policy Orientation: By Focusing on Moon Administration Policy Road-map. Korea Gov. Stud. 2019, 31, 643–670. [Google Scholar]
  64. Agarwal, A.; Corvalan, A.; Jensen, J.; Rambow, O. Social Network Analysis of Alice in Wonderland. In Proceedings of the NAACL-HLT 2012 Workshop on Computational Linguistics, Montréal, QC, Canada, 8 June 2012; pp. 88–96. [Google Scholar]
  65. Lee, S.S. Network Analysis Methodology, 1st ed.; Nonhyung: Seoul, Korea, 2012; pp. 255–278. [Google Scholar]
  66. Hussain, S.; Jibril, M.L.; Yakubu, A. Mining Social Media and DBpedia Data Using Gephi and R. J. Comput. Sci. Math. 2018, 12, 14–20. [Google Scholar] [CrossRef]
  67. Friedkin, N.E. Theoretical foundations for centrality measures. Am. J. Sociol. 1991, 96, 1478–1504. [Google Scholar] [CrossRef]
  68. Bonacich, P. Technique for Analyzing Overlapping Memberships. Sociol. Methodol. 2019, 4, 176–185. [Google Scholar] [CrossRef]
  69. Lee, K.M.; Hong, J.B. Case Study for Analysis of Technology Convergence Structure with Social Network Analysis. J. Technol. Innov. 2016, 24, 1–20. [Google Scholar] [CrossRef]
  70. Valente, T.W.; Coronges, K.; Lakon, C.; Costenbader, E. How Correlated Are Network Centrality Measures? Connections (Toronto Ont) 2008, 28, 16–26. [Google Scholar]
  71. Howlader, P.; Sudeep, K.S. Degree centrality, eigenvector centrality and the relation between them in Twitter. In Proceedings of the 2016 IEEE International Conference on Recent Trends in Electronics, Information & Communication Technology, Bangalore, India, 20–21 May 2016; pp. 678–682. [Google Scholar]
  72. Liu, B.; Li, Z.; Chen, X.; Huang, Y.; Liu, X. Recognition and Vulnerability Analysis of Key Nodes in Power Grid Based on Complex Network Centrality. IEEE Trans. Circuits Syst. II Express Briefs 2018, 65, 346–350. [Google Scholar] [CrossRef]
  73. Cherven, K. Mastering Gephi Network Visualization, 1st ed.; Packt Publishing: Birmingham, UK, 2015; pp. 181–215. [Google Scholar]
  74. Aksorn, T.; Hadikusumo, B.H.W. Critical success factors influencing safety program performance in Thai construction projects. Saf. Sci. 2008, 46, 709–727. [Google Scholar] [CrossRef]
  75. Hallowell, M.R.; Hinze, J.W.; Baud, K.C.; Wehle, A. Proactive Construction Safety Control: Measuring, Monitoring, and Responding to Safety Leading Indicators. J. Constr. Eng. Manag. 2013, 139, 1–8. [Google Scholar] [CrossRef]
Figure 1. Research procedure and method.
Sustainability 12 05771 g001
Figure 2. Network visualization of safety management characteristics.
Sustainability 12 05771 g002
Table 1. List of centrality analysis results for deducing words.
Ran-kingWordEigenvector CentralityWordBetweenness CentralityWordCloseness Centrality
1management0.362615project13,385.07682management0.570101
2value0.306063management8622.320027value0.555891
3employee0.304231value7676.464278employee0.550486
4system0.232815employee4748.520225project0.548844
5project0.230898new4709.339125system0.537619
6culture0.203352culture2603.204537culture0.529878
7new0.192309practice2487.089352new0.526843
8occupational0.170135system2051.839769practice0.526466
9practice0.168854growth2051.022959basis0.525339
10basis0.165889performance1516.917091growth0.524964
11growth0.160267economic1323.377262program0.523471
12program0.157252basis1302.284439performance0.521246
13people0.155057program1046.05086occupational0.518675
14international0.141662people945.870217people0.516854
15economic0.140372occupational841.987255economic0.513608
16performance0.131787satisfaction808.420662satisfaction0.511822
17satisfaction0.129185profit730.058106incident0.511822
18experience0.118193job713.953791commitment0.511822
19standard0.113477goal663.730692international0.511111
20care0.110137vision621.921518recognition0.508287
21recognition0.108771incident597.073116engineering0.508287
22way0.10723fiscal553.323478way0.507937
23accident0.107082future464.819777execution0.507937
24creation0.105893way419.78993responsibility0.507586
25profit0.10549commitment416.798742productivity0.507586
26execution0.105215essential353.313566campaign0.507586
27efficiency0.104741responsibility334.08192profit0.507236
28core0.104417international317.8757efficiency0.507236
29incident0.102278execution307.6235experience0.506887
30law0.101583experience240.8467standard0.505842
Table 2. Weighted words classified according to the results of centrality analysis.
ClusterWord
Weight 3basis, culture, economic, employee, execution, experience, growth, incident, international, management, new, occupational, people, performance, practice, profit, program, project, satisfaction, system, value, way
Weight 2commitment, core, efficiency, recognition, responsibility, standard
Weight 1accident, campaign, care, creation, engineering, essential, fiscal, future, goal, law, productivity, vision
Table 3. Mapping list of safety performance factors and Weight 3 words.
WordABCDEFGHIJKLM
basis X X X
culture XX X
economic XX X
employee X X X
executionX X X
experience X XX
growthX X X
incident XX X
international X X X
management XX X
newX X X
occupational X X X
people X X X
performance X X X
practice X X X
profit XX X
program XX X
project XXX
satisfactionXX X
system X X X
value XX X
wayX X X
A: Motivation, B: Rules and Regulation, C: Competency, D: Safety Investment and Costs, E: Financial Aspects and Productivity, F: Resource and Equipment, G: Work Pressure, H: Work Condition, I: Culture and Climate, J: Attitude and Behavior, K: Lesson Learned from Accidents, L: Organization, M: Safety Programs and Management Systems.
Table 4. Mapping list of safety performance factors and Weight 2 words.
WordABCDEFGHIJKLM
commitmentX X X
core X X X
efficiency X X X
recognitionX XX
responsibility X X X
standard X X X
A: Motivation, B: Rules and Regulation, C: Competency, D: Safety Investment and Costs, E: Financial Aspects and Productivity, F: Resource and Equipment, G: Work Pressure, H: Work Condition, I: Culture and Climate, J: Attitude and Behavior, K: Lesson Learned from Accidents, L: Organization, M: Safety Programs and Management Systems.
Table 5. Mapping list of safety performance factors and Weight 1 words.
WordABCDEFGHIJKLM
accident XXX
campaignX X X
care X X X
creation X X X
engineering XX X
essential X X X
fiscal X X X
futureX X X
goalX X X
law X X X
productivity XXX
vision X X X
A: Motivation, B: Rules and Regulation, C: Competency, D: Safety Investment and Costs, E: Financial Aspects and Productivity, F: Resource and Equipment, G: Work Pressure, H: Work Condition, I: Culture and Climate, J: Attitude and Behavior, K: Lesson Learned from Accidents, L: Organization, M: Safety Programs and Management Systems.

