To Rank or Not to Rank with Indices? That Is the Question

Abstract
1. Introduction
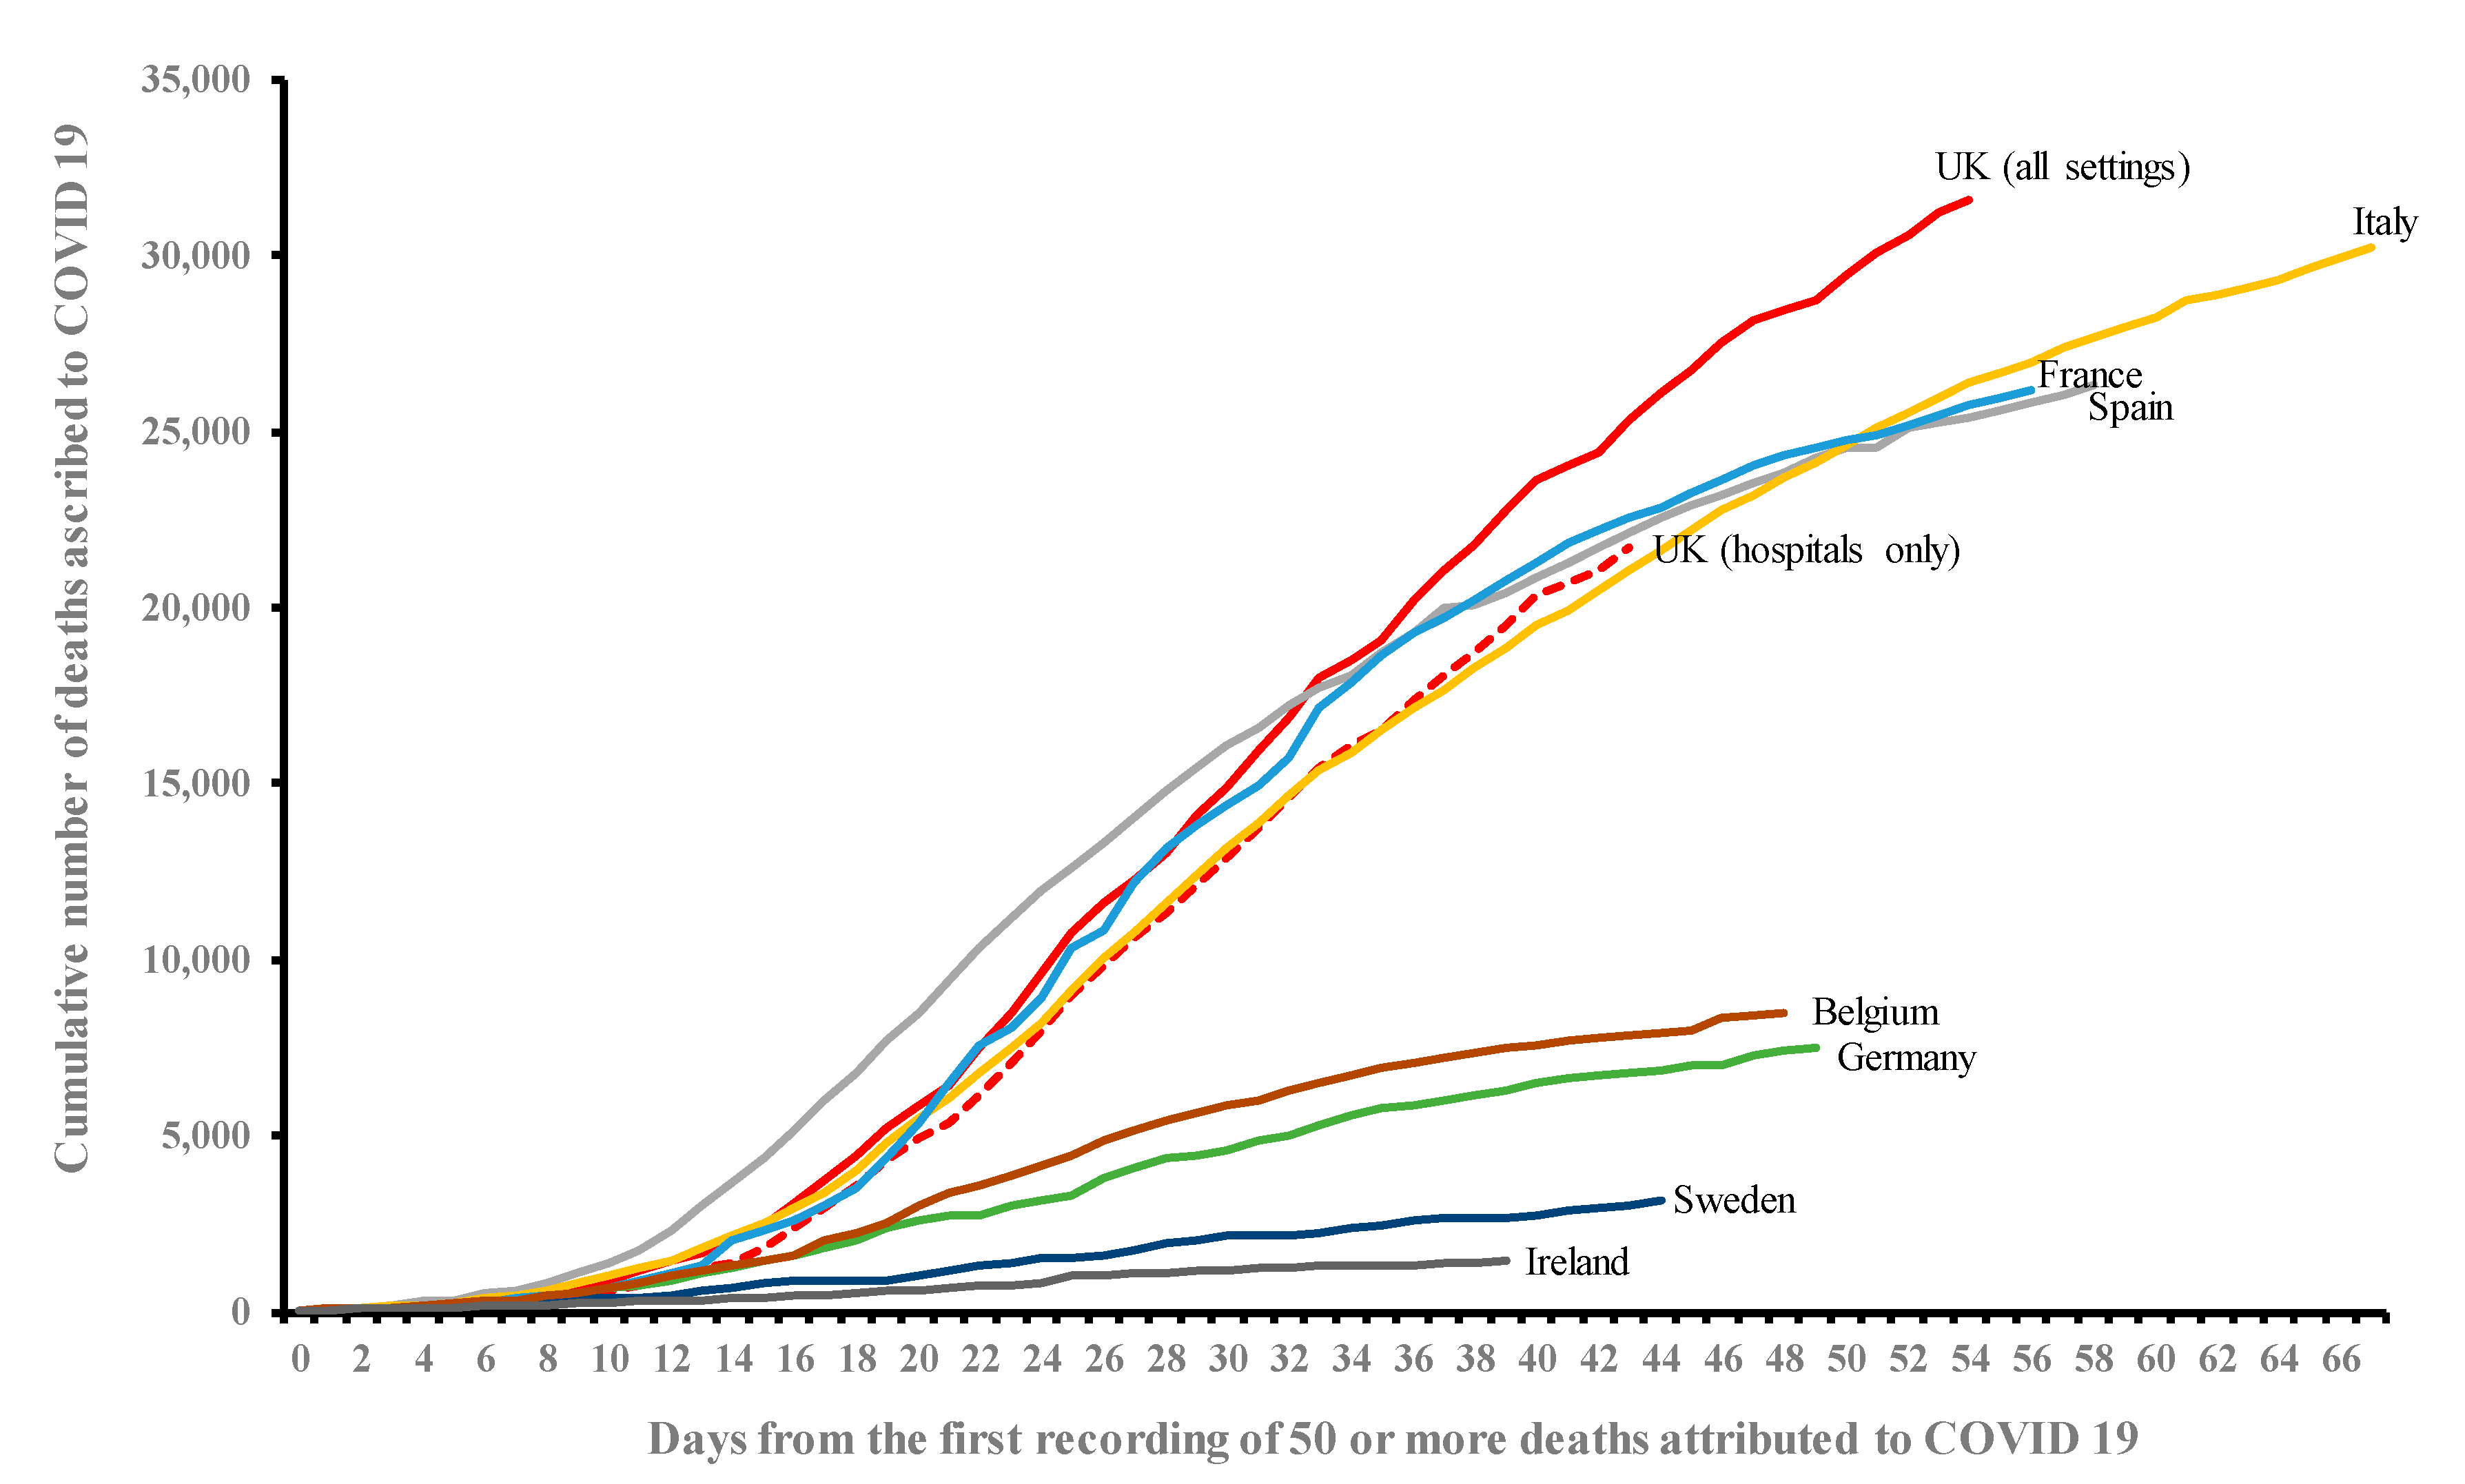
Every country has different ways of recording Covid-19 deaths: the large number of untested deaths in care homes have not featured in Spain’s statistics—which, like the UK’s require a positive test result. The numbers may be useful for looking at trends, but they are not reliable indicators for comparing the absolute levels………But, of course, people are not so interested in the numbers themselves—they want to say why they are so high, and ascribe blame. But if it’s difficult to rank this country, it’s even trickier to give reasons for our position.(emphasis added by author)
A statistician has asked the government to stop using an article he wrote for the Guardian as justification for why Britain’s death toll from coronavirus should not be compared with that of other countries. Prof David Spiegelhalter said in the piece published on 30 April that comparing the number of deaths from Covid-19 between countries was difficult because of the different methodologies used by governments to measure deaths. The day the article was published, England’s chief medical officer, Prof Chris Whitty, praised it during the No 10 daily coronavirus briefing, saying it showed that comparing death rates in different countries was a “fruitless exercise”……… Boris Johnson again referred to Spiegelhalter’s words on Wednesday in a response to the Labour leader, Keir Starmer, during prime minister’s questions, after Britain’s death toll became the highest in Europe and second highest globally………. However, a few hours later Spiegelhalter, tweeted: “Polite request to PM and others: please stop using my Guardian article to claim we cannot make any international comparisons yet. I refer only to detailed league tables—of course we should now use other countries to try and learn why our numbers are high.(Harry Taylor, Guardian, 6 May 2020; emphasis added by author)
2. Literature Review
- Life expectancy as a proxy measure for health. It is assumed here that people cannot improve their livelihood unless they are healthy.
- Education. It is assumed here that higher levels of education provide the capability to develop as it provides, amongst other things, opportunities for employment and career development.
- Income (proxied by GDP/capita). It is assumed here that people need financial capital to help improve their livelihood options through the purchase of goods and services.
- Education component: A number of components have been used during the life of the HDI, including years of schooling, enrolment in full-time education, and adult literacy rate. The latter was used in the education component until the HDR of 2009, after which it was dropped and only years of schooling was employed.
- Income component: There have been a number of changes here, some small and some large. Firstly, the UNDP has alternated between the use of logarithmic (base 10) and Atkinson transformations to transform the data and help avoid a dominance of this component in the index (Morse, 2013). In 1990 and between the HDRs of 1999 and 2018, the UNDP used logarithms while between the HDRs of 1991 and 1998, they used the Atkinson formula. Secondly, while most of the years (HDRs 1990 to 2009) used the real GDP/capita (adjusted for purchasing power parity (PPP) and chained to a particular year), in more recent publications of the HDR (HDRs of 2010 onwards), there was a switch to using gross national income (GNI) per capita (also adjusted for PPP). GDP and GNI are similar metrics but not the same. At the same time as changing to GNI, logarithm base e was used rather than logarithm base 10 for transforming GNI/capita.
- Arithmetic and geometric means. It has always been assumed that the three components of the HDI have the same weight within the index, and until 2009 this was achieved by taking the arithmetic mean of the three HDI components. After that year (HDRs 2010 onwards) the geometric mean was used instead, ostensibly to avoid high values of one component compensating for low values of another [23]. However, this change has been claimed to have a negative impact on the HDI for developing countries [19,24].
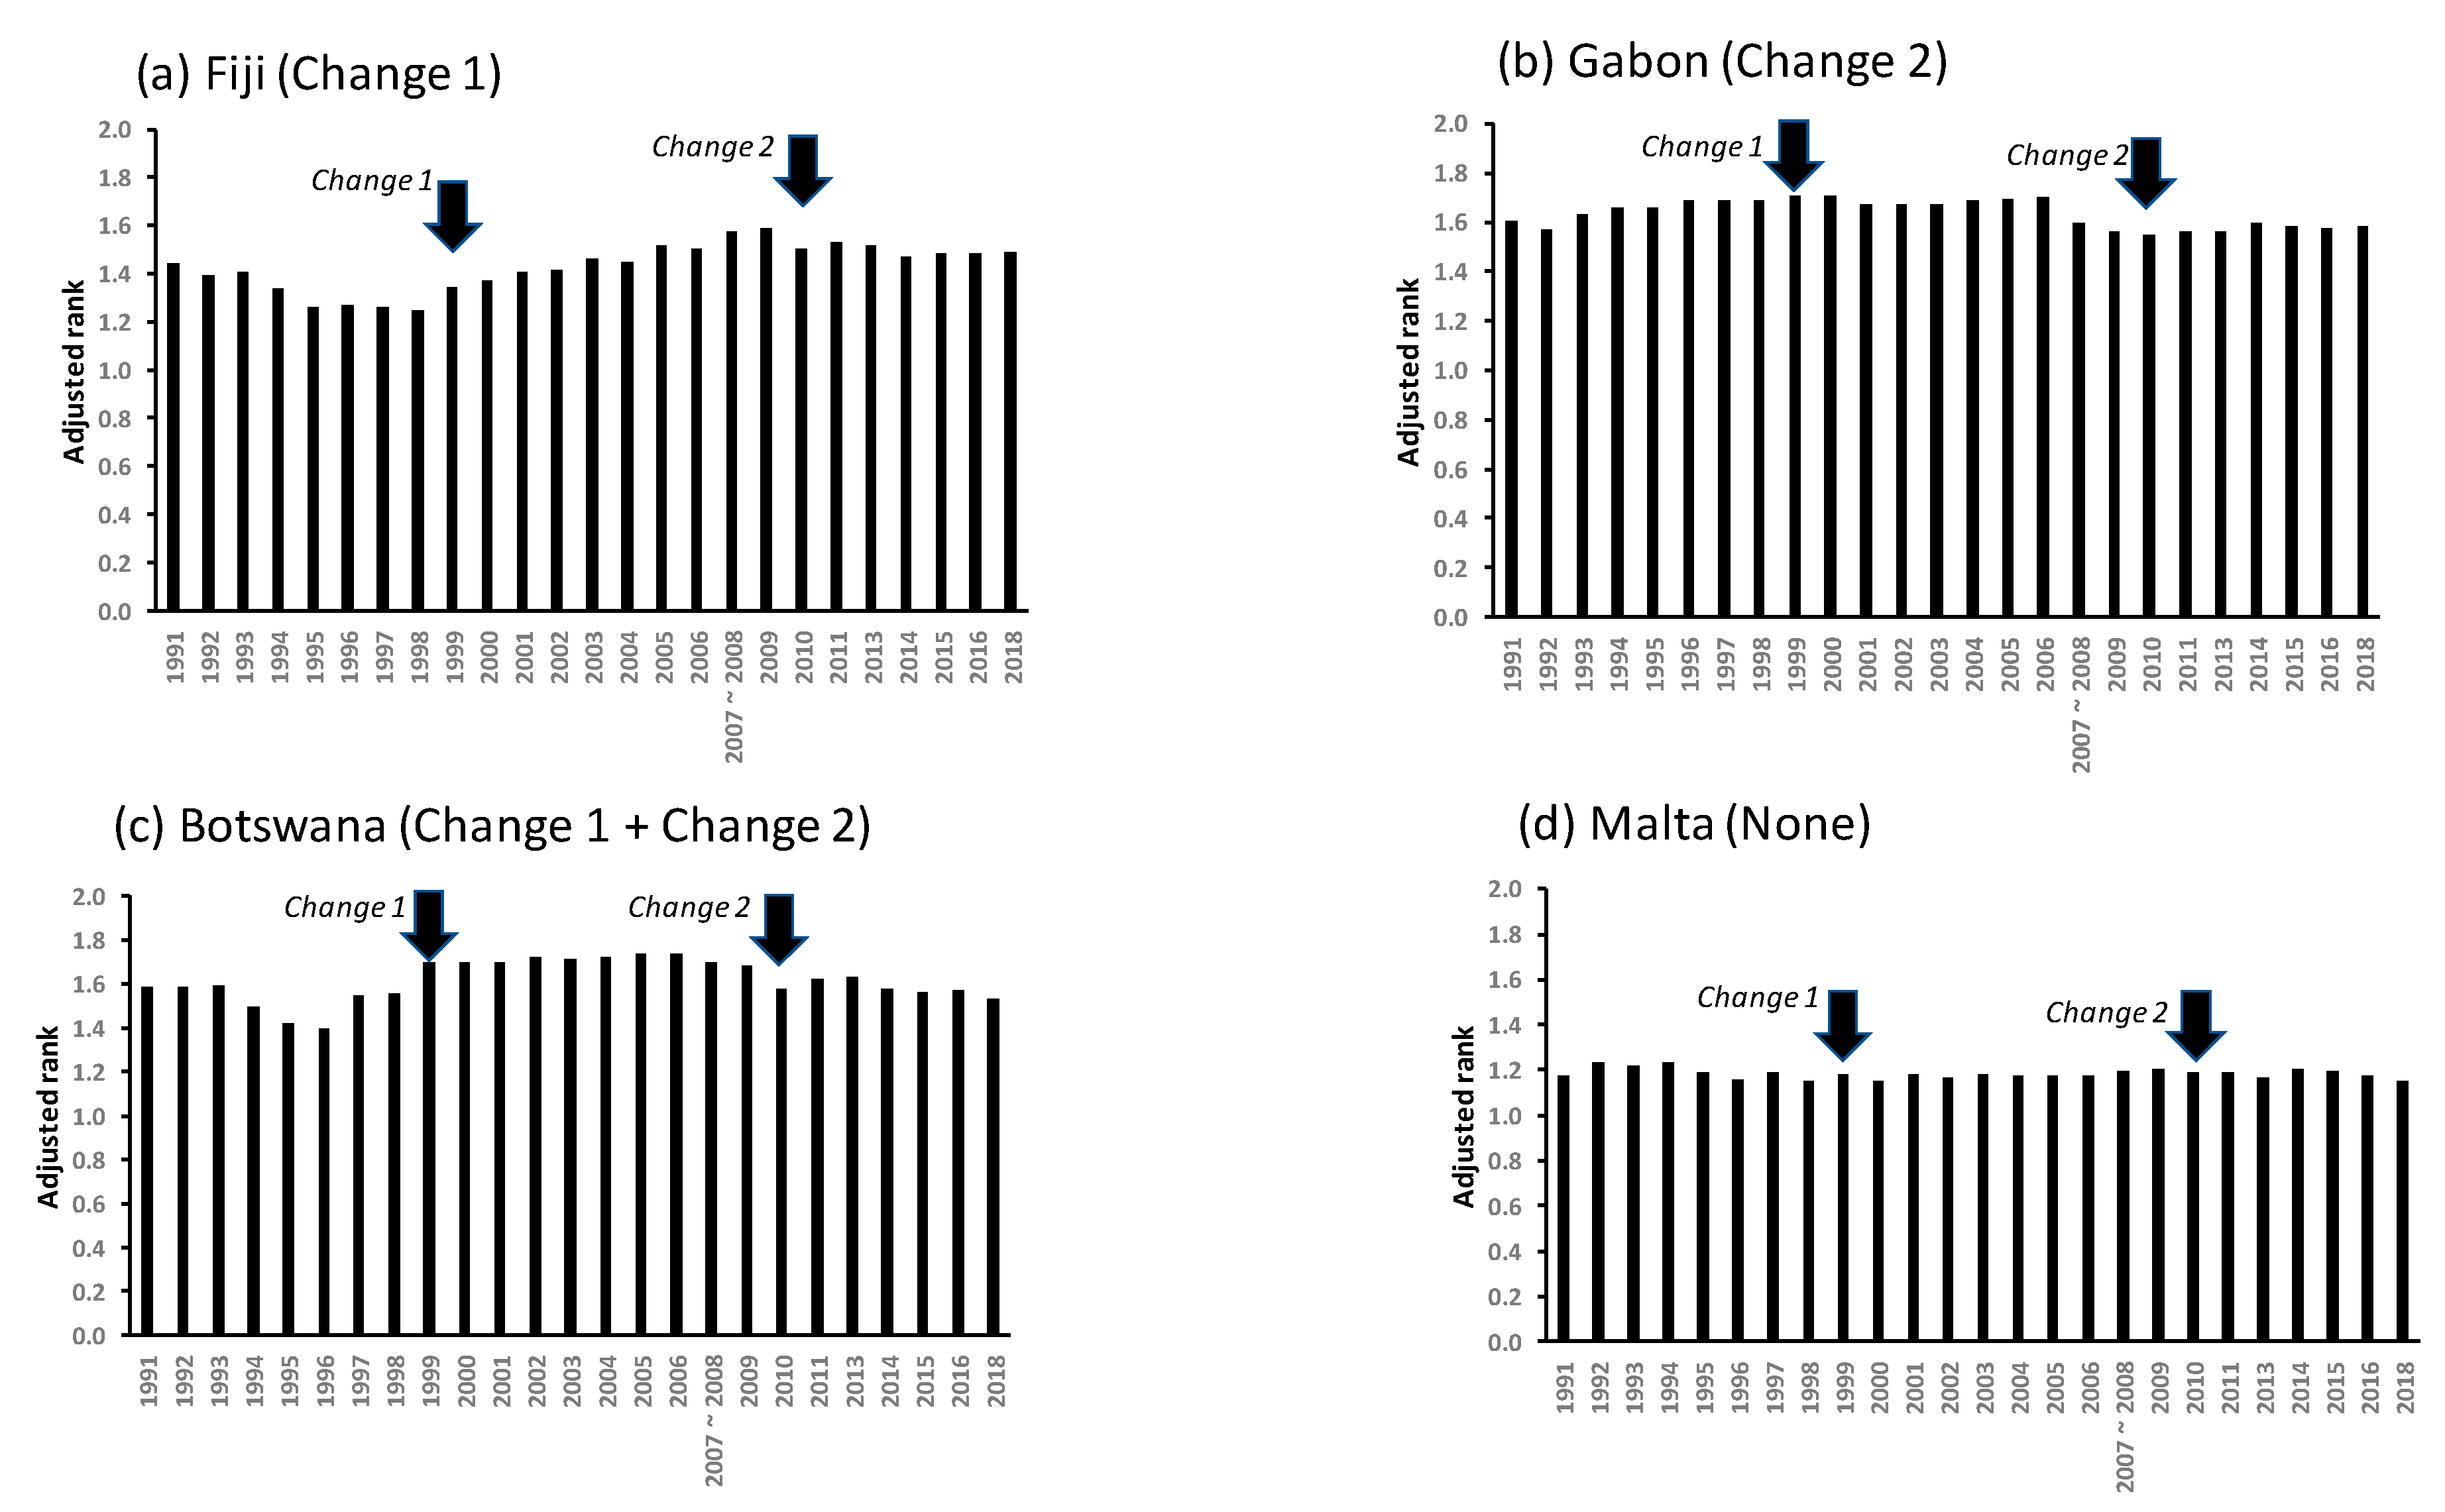
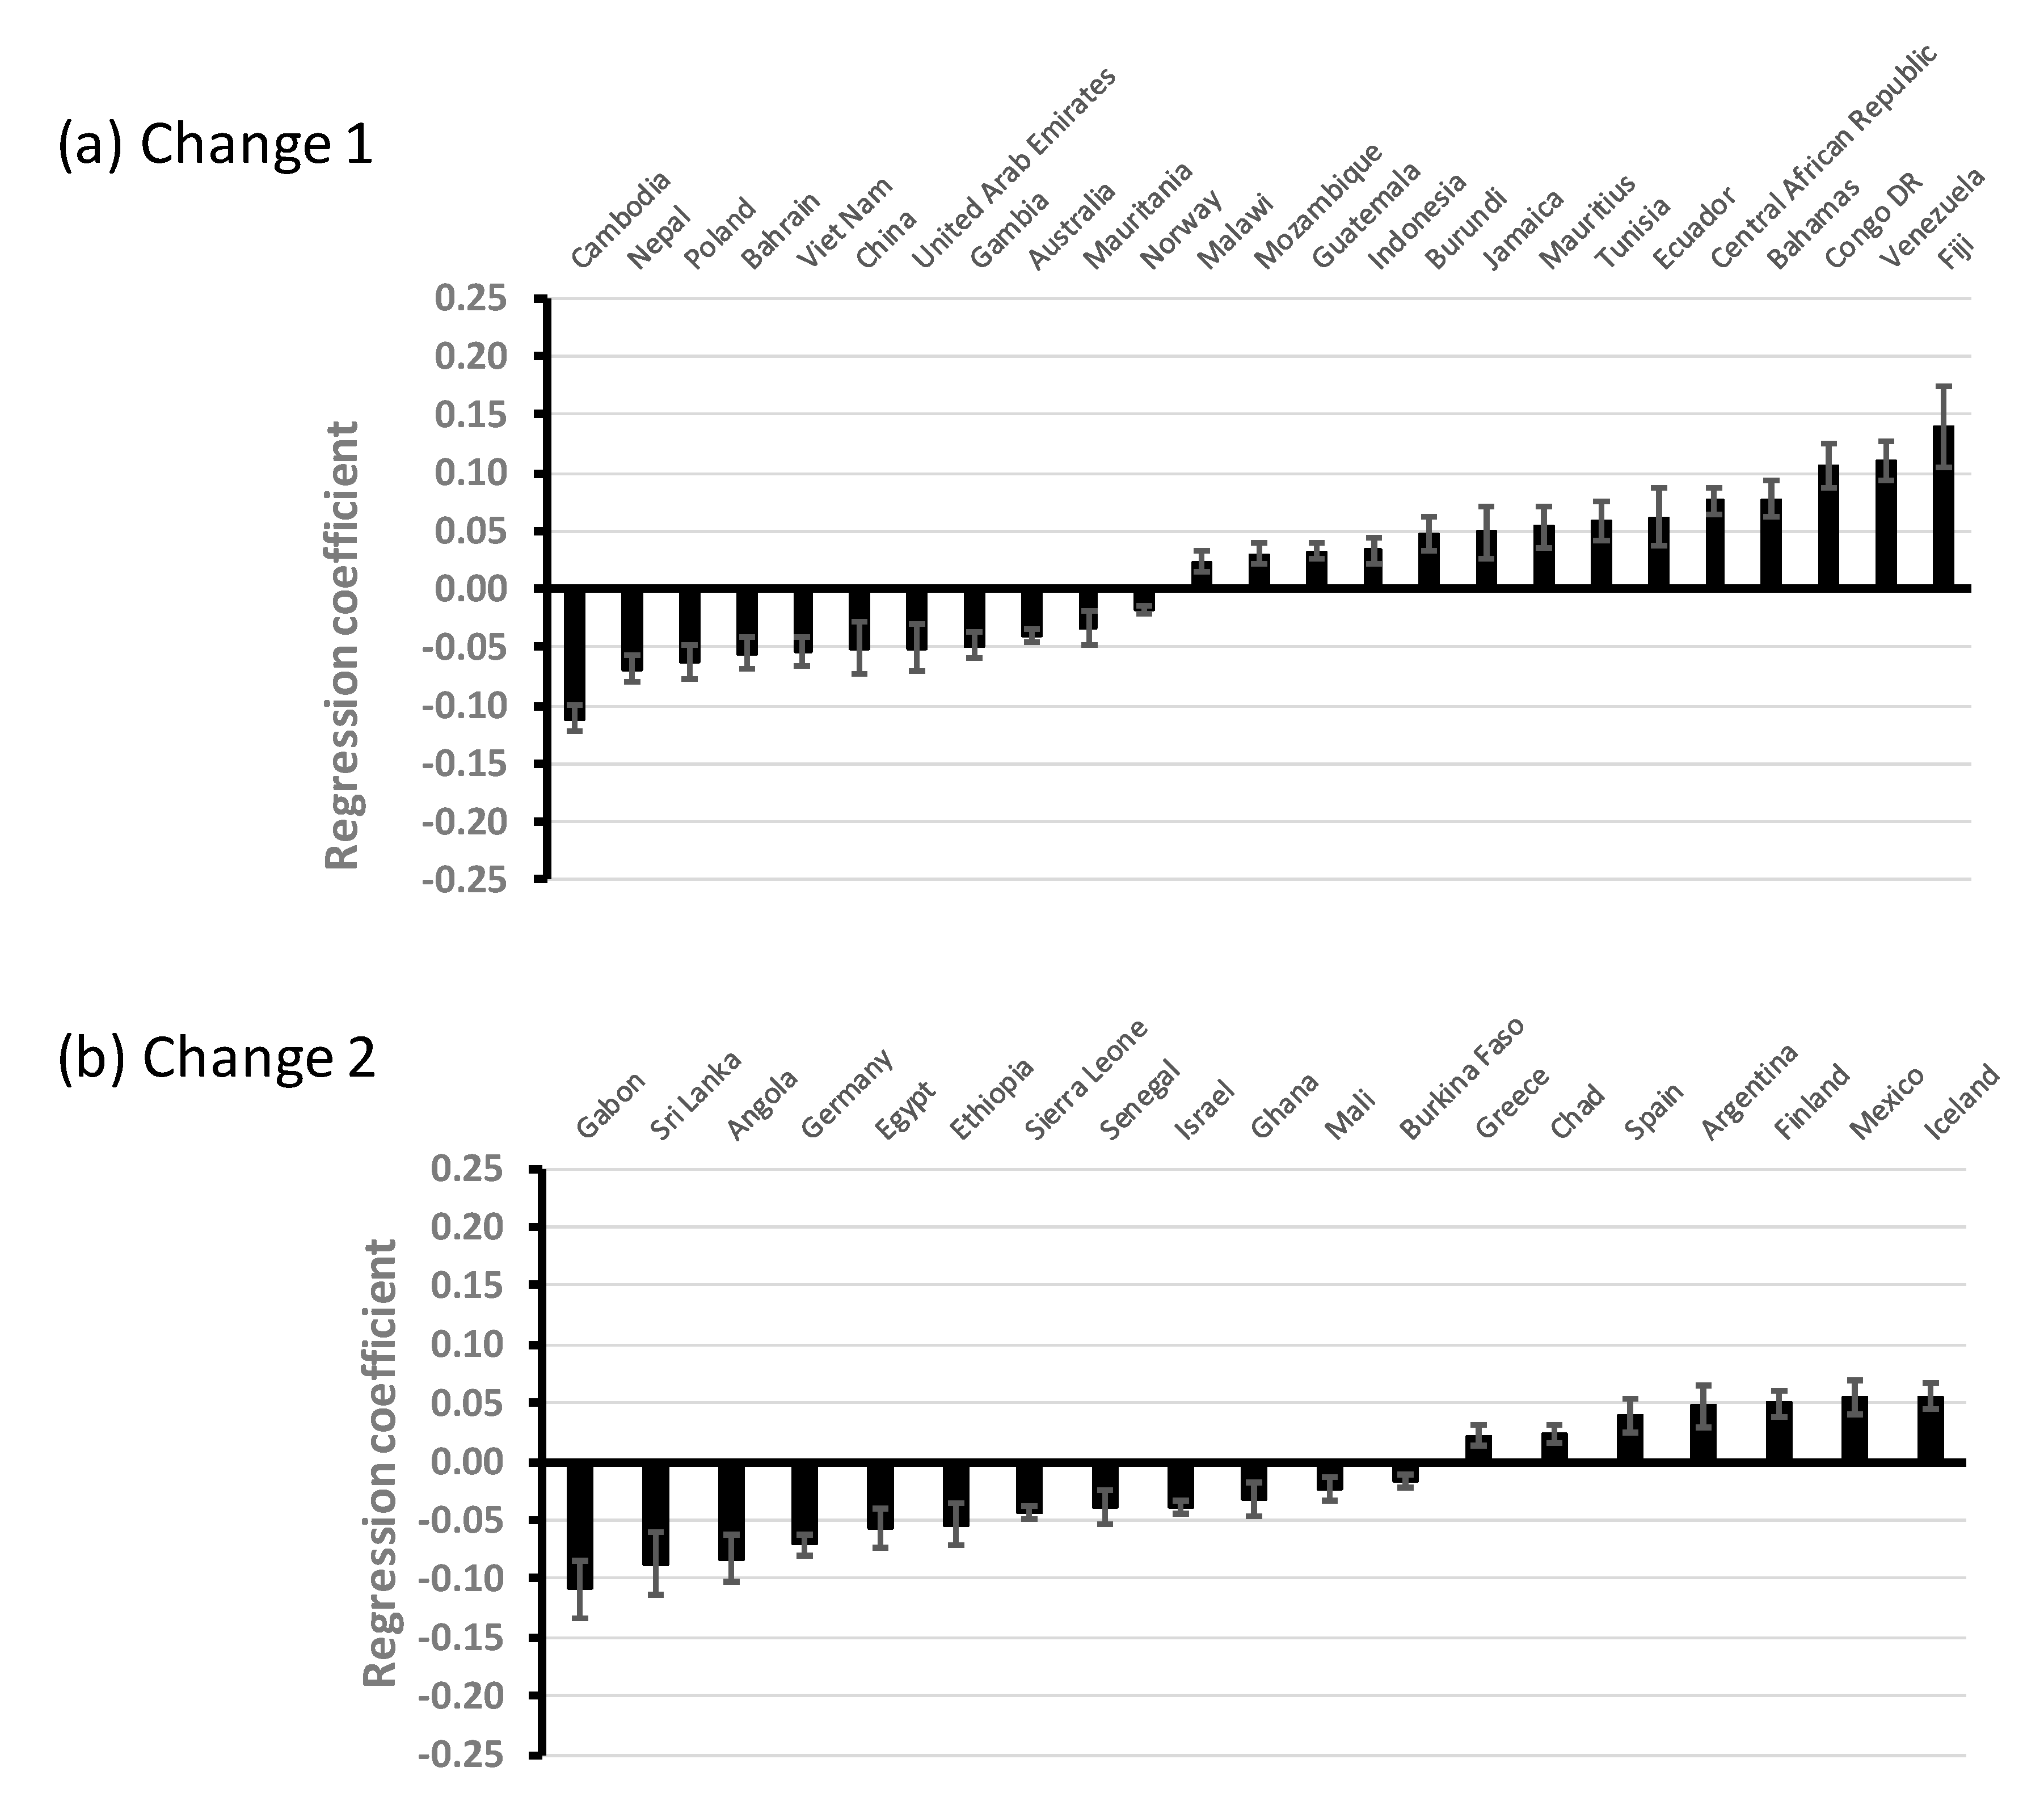
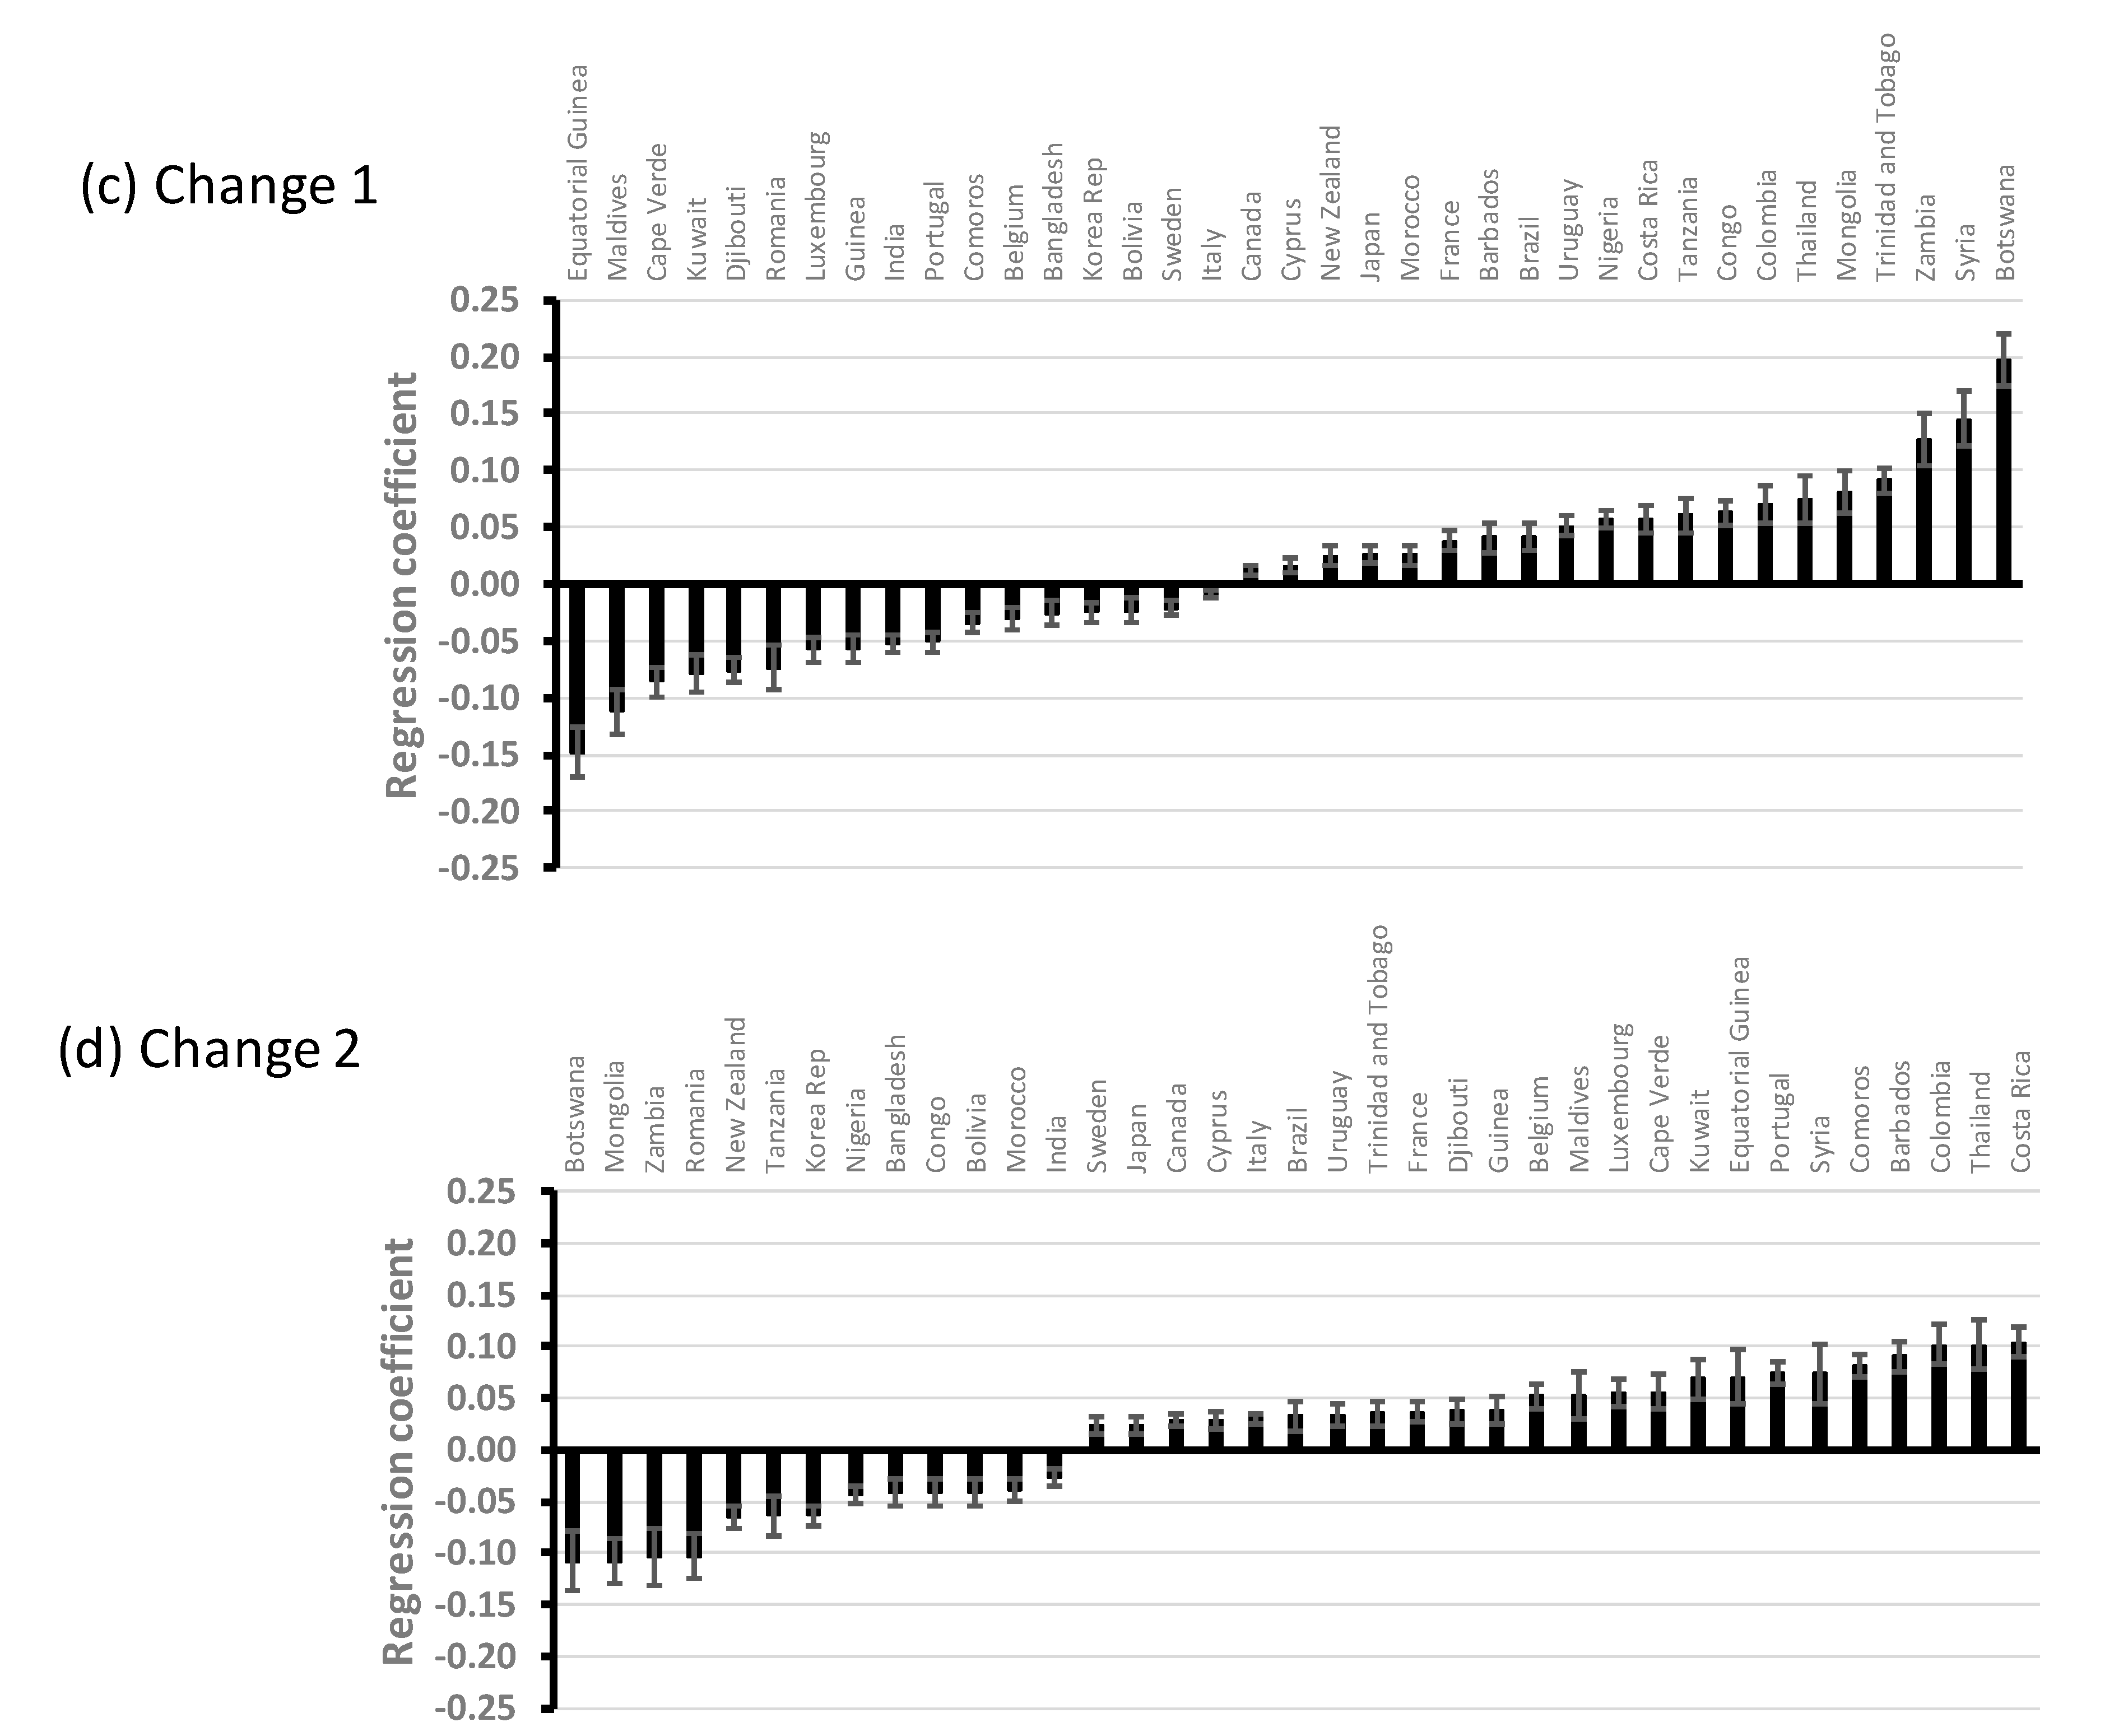
- Change 1 (HDR 1999): Transformation of the GDP/capita component changed from the Atkinson formula to the use of logarithm (base 10).
- Change 2 (HDR 2010): Adult literacy rate was dropped from the education component and changes were made to the way in which the income component was calculated and transformed. In addition, there was a shift from arithmetic to geometric mean for combining the three components of the HDI.
3. Materials and Methods
3.1. HDI Ranks
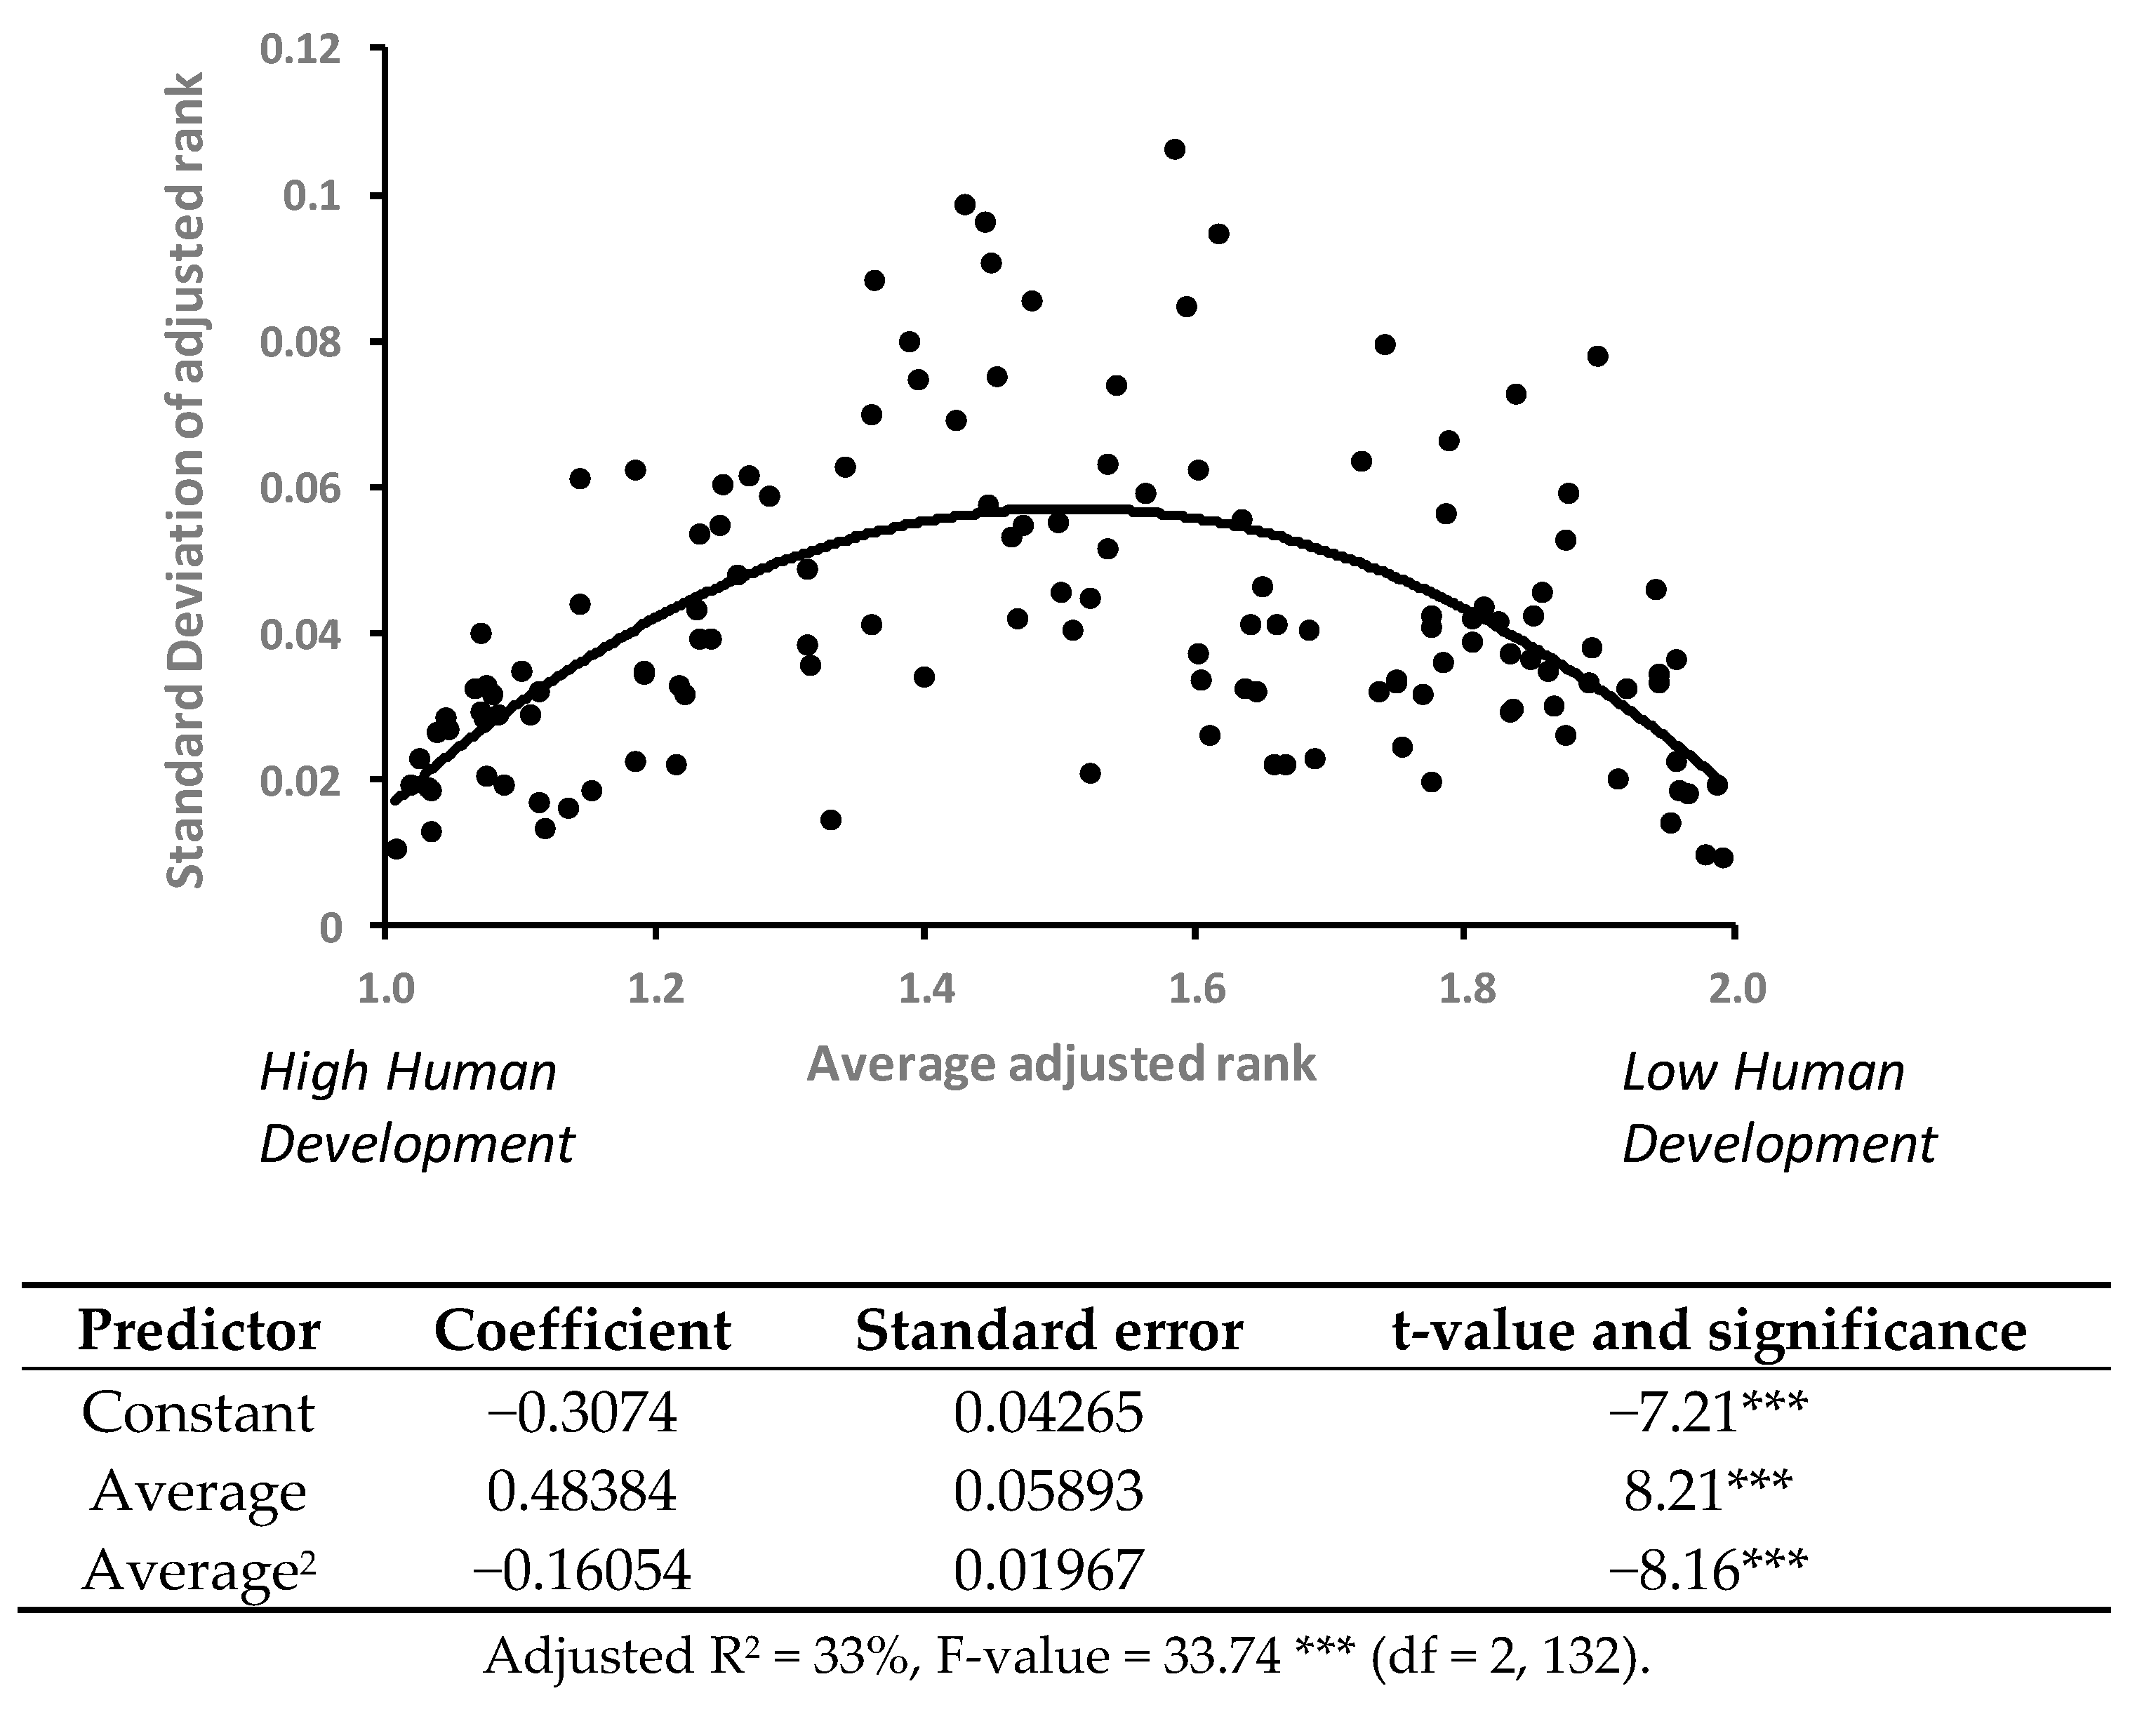
3.2. Analysis of HDI Adjusted Rank
4. Results
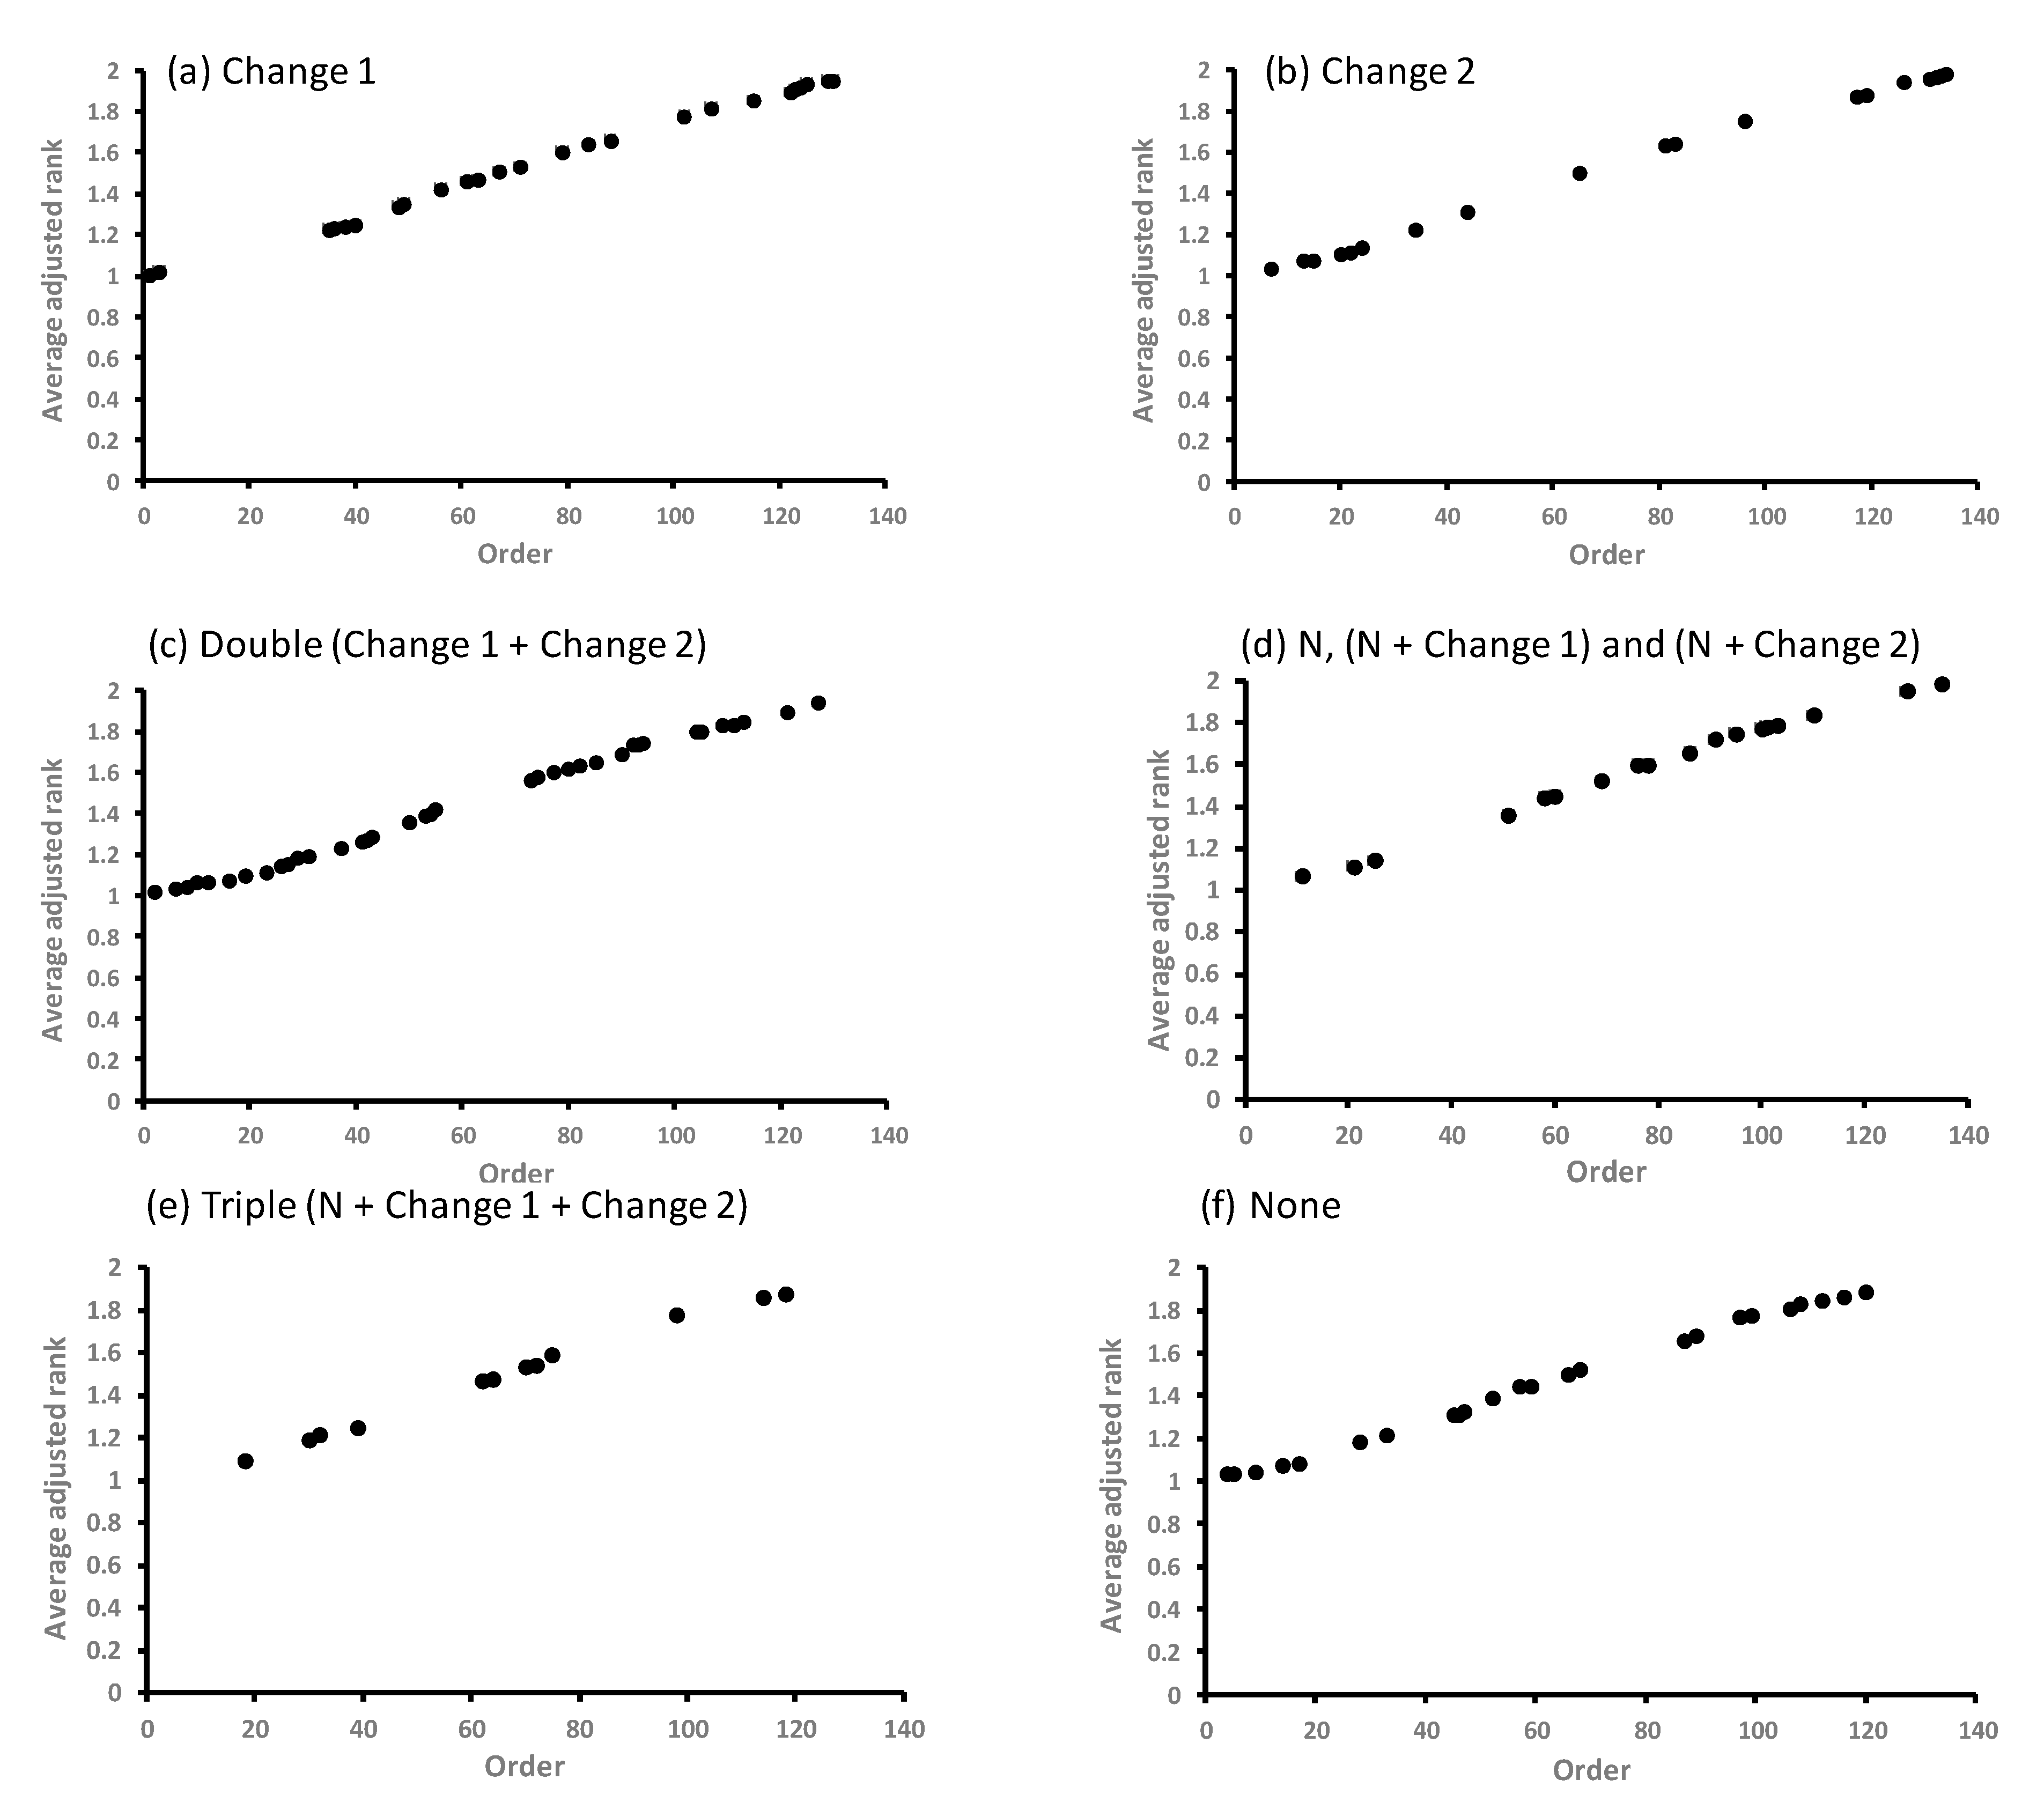
- No significance: None of the regression coefficients are statistically significant at P < 0.05
- Single significance: One coefficient is statistically significant at P < 0.05 (either the number of countries (N), Change 1, or Change 2)
- Double significance: Two coefficients are statistically significant at P < 0.05 (N with Change 1, N with Change 2, or Change 1 with Change 2)
- Triple significance: All three coefficients are statistically significant (N, Change 1, and Change 2)
5. Discussion
The robust economic growth notwithstanding, India has garnered a lowly 119th rank in the United Nation’s Human Development Index due to poor social infrastructure, mainly in areas of education and healthcare. In the ’Human Development Report 2010’ by United Nations Development Programme (UNDP) that covered 169 countries and territories, India’s position is way below China (89th spot) and Sri Lanka (91)………….. India’s position in the index has improved by one position on the basis of a five-year comparison since 2005.—Press Trust of India, New Delhi (4 November 2010)
6. Conclusions
Funding
Acknowledgments
Conflicts of Interest
References
- Herzi, A.A. Sustainability indicators system and policy process in Malaysia: A framework for utilisation and learning. J. Environ. Manag. 2004, 73, 357–371. [Google Scholar]
- Hou, J.; Walsh, P.P.; Zhang, J. The dynamics of Human Development Index. Soc. Sci. J. 2015, 52, 331–347. [Google Scholar] [CrossRef]
- Böhringer, C.; Jochem, P.E.P. Measuring the immeasurable—A survey of sustainability indices. Ecol. Econ. 2007, 63, 1–8. [Google Scholar] [CrossRef]
- Wilson, J.; Tyedmers, P.; Pelot, R. Contrasting and comparing sustainable development indicator metrics. Ecol. Indic. 2007, 7, 299–314. [Google Scholar] [CrossRef]
- Sen, A. Development as Freedom; Oxford University Press: Oxford, UK, 1999. [Google Scholar]
- Morse, S. Harnessing the power of the press with indices. Ecol. Indic. 2011, 11, 1681–1688. [Google Scholar] [CrossRef]
- Ogwang, T. Inter-country inequality in human development indicators. Appl. Econ. Lett. 2000, 7, 443–446. [Google Scholar] [CrossRef]
- Cilingirturk, A.M.; Kocak, H. Human Development Index (HDI) Rank-Order Variability. Soc. Indic. Res. 2018, 137, 481–504. [Google Scholar] [CrossRef]
- Bryane, M. What does Brunei teach us about using Human Development Index rankings as a policy tool? Dev. Policy Rev. 2018, 36, 414–431. [Google Scholar]
- Anand, S.; Sen, A.K. Human Development Index: Methodology and Measurement; Human Development Report Office Occasional Paper; UNDP: New York, NY, USA, 1994. [Google Scholar]
- Carlucci, F.; Pisani, S. A multivariate measure of human development. Soc. Indic. Res. 1995, 36, 145–176. [Google Scholar] [CrossRef]
- Booysen, F. An overview and evaluation of composite indices of development. Soc. Indic. Res. 2002, 59, 115–151. [Google Scholar] [CrossRef]
- Ranis, G.; Stewart, F.; Samman, E. Human Development: Beyond the Human Development Index. J. Hum. Dev. 2006, 7, 323–358. [Google Scholar] [CrossRef]
- Stapleton, L.M.; Garrod, G.D. Keeping things simple: Why the Human Development Index should not diverge from its equal weights assumption. Soc. Indic. Res. 2007, 84, 179–188. [Google Scholar] [CrossRef]
- Nguefack-Tsague, G.; Klasen, S.; Zucchini, W. On weighting the components of the Human Development Index: A statistical Justification. J. Hum. Dev. Capab. 2011, 12, 183–202. [Google Scholar] [CrossRef]
- Kelly, A.C. The Human Development Index: ‘Handle with care’. Popul. Dev. Rev. 1991, 17, 315–324. [Google Scholar] [CrossRef]
- Streeten, P. Human development: Means and ends. Am. Econ. Rev. 1994, 84, 232–237. [Google Scholar]
- Moldan, B. The Human Development Index. In Sustainability Indicators: A Report on the Project on Indicators of Sustainable Development; Moldan, B., Billharz, S., Matravers, R., Eds.; John Wiley and Sons: Chichester, UK, 1997; pp. 242–252. [Google Scholar]
- Ravallion, M. Troubling trade-offs in the Human Development Index. J. Dev. Econ. 2012, 99, 201–209. [Google Scholar] [CrossRef]
- Pinar, M.; Stengos, T.; Topaloglou, N. Testing for the implicit weights of the dimensions of the Human Development Index using stochastic dominance. Econ. Lett. 2017, 161, 38–42. [Google Scholar] [CrossRef]
- Høyland, B.; Moene, K.; Willumsen, F. The tyranny of international index rankings. J. Dev. Econ. 2012, 97, 1–14. [Google Scholar] [CrossRef]
- Morse, S. Bottom rail on top: The shifting sands of sustainable development indicators as tools to assess progress. Sustainability 2013, 5, 2421–2441. [Google Scholar] [CrossRef]
- Kawada, Y.; Nakamura, Y.; Otani, S. An axiomatic foundation of the multiplicative Human Development Index. Rev. Income Wealth 2019, 65, 771–784. [Google Scholar] [CrossRef]
- Tarabusi, E.C.; Guarini, G. Level Dependence of the Adjustment for Unbalance and Inequality for the Human Development Index. Soc. Indic. Res. 2016, 126, 527–553. [Google Scholar] [CrossRef]
- Neumayer, E. The Human Development Index and sustainability—A constructive proposal. Ecol. Econ. 2001, 39, 101–114. [Google Scholar] [CrossRef]
- Neumayer, E. Human development and sustainability. J. Hum. Dev. Capab. 2012, 13, 561–579. [Google Scholar] [CrossRef]
- Bravo, G. The Human Sustainable Development Index: New calculations and a first critical analysis. Ecol. Indic. 2014, 37, 145–150. [Google Scholar] [CrossRef]
- Cherchye, L.; Ooghe, E.; Van Puyenbroeck, T. Robust human development rankings. J. Econ. Inequal. 2008, 6, 287–321. [Google Scholar] [CrossRef]
- The Ecologist and Friends of the Earth. Keeping score: Which countries are the most sustainable? Ecologist 2001, 31, 44–47. [Google Scholar]
- Malay, O.E. Do Beyond GDP indicators initiated by powerful stakeholders have a transformative potential? Ecol. Econ. 2019, 162, 100–107. [Google Scholar] [CrossRef]


| Albania | Cyprus | Jordan | Philippines |
| Algeria | Denmark | Kenya | Poland |
| Angola | Djibouti | Korea (Republic of) | Portugal |
| Argentina | Dominican Republic | Kuwait | Qatar |
| Australia | Ecuador | Lao People’s Democratic Republic | Romania |
| Austria | Egypt | Lesotho | Saudi Arabia |
| Bahamas | El Salvador | Libyan Arab Jamahiriya | Senegal |
| Bahrain | Equatorial Guinea | Luxembourg | Sierra Leone |
| Bangladesh | Ethiopia | Madagascar | Singapore |
| Barbados | Fiji | Malawi | South Africa |
| Belgium | Finland | Malaysia | Spain |
| Belize | France | Maldives | Sri Lanka |
| Benin | Gabon | Mali | Sudan |
| Bolivia | Gambia | Malta | Suriname |
| Botswana | Germany | Mauritania | Swaziland |
| Brazil | Ghana | Mauritius | Sweden |
| Brunei Darussalam | Greece | Mexico | Switzerland |
| Bulgaria | Guatemala | Mongolia | Syrian Arab Republic |
| Burkina Faso | Guinea | Morocco | Tanzania |
| Burundi | Guinea-Bissau | Mozambique | Thailand |
| Cambodia | Guyana | Myanmar | Togo |
| Cameroon | Haiti | Namibia | Trinidad and Tobago |
| Canada | Honduras | Nepal | Tunisia |
| Cape Verde | Hong Kong, China | Netherlands | Turkey |
| Central African Republic | Hungary | New Zealand | Uganda |
| Chad | Iceland | Nicaragua | United Arab Emirates |
| Chile | India | Niger | United Kingdom |
| China | Indonesia | Nigeria | Uruguay |
| Colombia | Iran (Islamic Republic of) | Norway | United States |
| Comoros | Ireland | Pakistan | Venezuela |
| Congo | Israel | Panama | Viet Nam |
| Congo (Democratic Republic of the) | Italy | Papua New Guinea | Yemen |
| Costa Rica | Jamaica | Paraguay | Zambia |
| Côte d’Ivoire | Japan | Peru |
| Regression Coefficients (SE) | ||||||||||||||||
|---|---|---|---|---|---|---|---|---|---|---|---|---|---|---|---|---|
| Groups | Country | Intercept | SE | Countries | SE | Change 1 | SE | Change 2 | SE | F-Value | R2 (%) | |||||
| All (number of countries, Change 1 and Change 2) are significant | Algeria | 2.2602 | (0.3026) | *** | −0.0043 | (0.0018) | * | 0.0808 | (0.0258) | ** | −0.0784 | (0.0310) | * | 9.6 | *** | 52 |
| Austria | 1.3500 | (0.0517) | *** | −0.0016 | (0.0003) | *** | 0.0127 | (0.0044) | ** | 0.0454 | (0.0053) | *** | 31.8 | *** | 79 | |
| Brunei Darussalam | 1.5763 | (0.1084) | *** | −0.0020 | (0.0006) | ** | −0.0510 | (0.0092) | *** | 0.0239 | (0.0111) | * | 21.8 | *** | 72 | |
| Chile | 1.5225 | (0.0974) | *** | −0.0019 | (0.0006) | ** | 0.0314 | (0.0083) | ** | 0.0218 | (0.0100) | * | 7.5 | ** | 45 | |
| Cote d’Ivoire | 1.3781 | (0.1149) | *** | 0.0025 | (0.0007) | ** | 0.0891 | (0.0098) | *** | −0.0281 | (0.0118) | * | 51.6 | *** | 86 | |
| Iran | 2.2868 | (0.3211) | *** | −0.0047 | (0.0019) | * | 0.0839 | (0.0273) | ** | −0.1039 | (0.0329) | ** | 12.6 | *** | 59 | |
| Kenya | 1.3044 | (0.1465) | *** | 0.0025 | (0.0009) | ** | 0.0621 | (0.0125) | *** | −0.0684 | (0.0150) | *** | 16.2 | *** | 65 | |
| Papua New Guinea | 1.4951 | (0.1116) | *** | 0.0014 | (0.0007) | * | 0.0331 | (0.0095) | ** | 0.0377 | (0.0114) | ** | 30.3 | *** | 79 | |
| Peru | 1.1791 | (0.1284) | *** | 0.0020 | (0.0008) | * | −0.0698 | (0.0109) | *** | −0.0438 | (0.0131) | ** | 22.9 | *** | 73 | |
| Philippines | 0.8761 | (0.1689) | *** | 0.0039 | (0.0010) | *** | −0.0847 | (0.0144) | *** | 0.0862 | (0.0173) | *** | 31.9 | *** | 79 | |
| Qatar | 1.6649 | (0.1481) | *** | −0.0021 | (0.0009) | * | −0.0583 | (0.0126) | *** | −0.0326 | (0.0152) | * | 31.3 | *** | 79 | |
| South Africa | 0.6296 | (0.2469) | * | 0.0051 | (0.0014) | ** | 0.1258 | (0.0210) | *** | −0.0612 | (0.0253) | * | 25.8 | *** | 76 | |
| Sudan | 2.1544 | (0.1307) | *** | −0.0016 | (0.0008) | * | −0.0646 | (0.0111) | *** | 0.1023 | (0.0134) | *** | 27.0 | *** | 76 | |
| Change 1 only is significant | Australia | 0.9997 | (0.0676) | *** | 0.0003 | (0.0004) | ns | −0.0402 | (0.0058) | *** | −0.0115 | (0.0069) | ns | 25.2 | *** | 75 |
| Bahamas | 0.9948 | (0.1802) | *** | 0.0010 | (0.0011) | ns | 0.0772 | (0.0153) | *** | 0.0141 | (0.0184) | ns | 17.5 | *** | 67 | |
| Bahrain | 1.5688 | (0.1641) | *** | −0.0017 | (0.0010) | ns | −0.0551 | (0.0140) | *** | 0.0341 | (0.0168) | ns | 8.8 | *** | 49 | |
| Burundi | 1.7695 | (0.1623) | *** | 0.0009 | (0.0010) | ns | 0.0471 | (0.0138) | ** | −0.0048 | (0.0166) | ns | 6.9 | ** | 43 | |
| Cambodia | 1.8029 | (0.1296) | *** | 0.0003 | (0.0008) | ns | −0.1116 | (0.0110) | *** | −0.0054 | (0.0133) | ns | 45.9 | *** | 85 | |
| Central African Republic | 1.7037 | (0.1249) | *** | 0.0011 | (0.0007) | ns | 0.0755 | (0.0106) | *** | 0.0032 | (0.0128) | ns | 30.9 | *** | 79 | |
| China | 1.3879 | (0.2607) | *** | 0.0011 | (0.0015) | ns | −0.0510 | (0.0222) | * | −0.0406 | (0.0267) | ns | 3.9 | * | 27 | |
| Congo DR | 1.4802 | (0.2334) | *** | 0.0019 | (0.0014) | ns | 0.1058 | (0.0199) | *** | 0.0310 | (0.0239) | ns | 23.8 | *** | 74 | |
| Ecuador | 1.8795 | (0.2908) | *** | −0.0026 | (0.0017) | ns | 0.0614 | (0.0248) | * | 0.0113 | (0.0298) | ns | 2.3 | ns | 14 | |
| Fiji | 1.4062 | (0.4183) | ** | −0.0005 | (0.0025) | ns | 0.1394 | (0.0356) | *** | 0.0381 | (0.0428) | ns | 8.5 | *** | 48 | |
| Gambia | 2.1036 | (0.1354) | *** | −0.0009 | (0.0008) | ns | −0.0485 | (0.0115) | *** | 0.0166 | (0.0139) | ns | 8.9 | *** | 50 | |
| Guatemala | 1.6019 | (0.0820) | *** | 0.0002 | (0.0005) | ns | 0.0326 | (0.0070) | *** | 0.0062 | (0.0084) | ns | 13.4 | *** | 61 | |
| Indonesia | 1.8385 | (0.1349) | *** | −0.0014 | (0.0008) | ns | 0.0334 | (0.0115) | ** | 0.0141 | (0.0138) | ns | 3.5 | * | 24 | |
| Jamaica | 0.8775 | (0.2711) | ** | 0.0033 | (0.0016) | ns | 0.0487 | (0.0231) | * | −0.0460 | (0.0277) | ns | 4.4 | * | 30 | |
| Malawi | 1.8069 | (0.1060) | *** | 0.0005 | (0.0006) | ns | 0.0229 | (0.0090) | * | −0.0161 | (0.0108) | ns | 3.2 | * | 21 | |
| Mauritania | 2.0582 | (0.1659) | *** | −0.0010 | (0.0010) | ns | −0.0337 | (0.0141) | * | −0.0062 | (0.0170) | ns | 5.4 | ** | 35 | |
| Mauritius | 1.2646 | (0.2067) | *** | 0.0003 | (0.0012) | ns | 0.0530 | (0.0176) | ** | −0.0106 | (0.0211) | ns | 4.0 | * | 27 | |
| Mozambique | 1.8903 | (0.1030) | *** | 0.0003 | (0.0006) | ns | 0.0302 | (0.0088) | ** | 0.0013 | (0.0105) | ns | 6.5 | ** | 41 | |
| Nepal | 2.0682 | (0.1290) | *** | −0.0011 | (0.0008) | ns | −0.0689 | (0.0110) | *** | 0.0083 | (0.0132) | ns | 22.1 | *** | 73 | |
| Norway | 1.0345 | (0.0331) | *** | −0.0001 | (0.0002) | ns | −0.0181 | (0.0028) | *** | −0.0006 | (0.0034) | ns | 21.0 | *** | 71 | |
| Poland | 1.1710 | (0.1711) | *** | 0.0006 | (0.0010) | ns | −0.0632 | (0.0146) | *** | −0.0263 | (0.0175) | ns | 10.8 | *** | 55 | |
| Tunisia | 1.8730 | (0.1971) | *** | −0.0023 | (0.0012) | ns | 0.0589 | (0.0168) | ** | −0.0151 | (0.0202) | ns | 4.8 | * | 32 | |
| United Arab Emirates | 1.7547 | (0.2413) | *** | −0.0026 | (0.0014) | ns | −0.0510 | (0.0205) | * | −0.0209 | (0.0247) | ns | 10.3 | *** | 54 | |
| Venezuela | 1.5561 | (0.1956) | *** | −0.0017 | (0.0011) | ns | 0.1103 | (0.0167) | *** | 0.0381 | (0.0200) | ns | 21.5 | *** | 72 | |
| Viet Nam | 1.4860 | (0.1476) | *** | 0.0011 | (0.0009) | ns | −0.0535 | (0.0126) | *** | 0.0099 | (0.0151) | ns | 6.1 | ** | 39 | |
| Both Change 1 and Change 2 are significant | Bangladesh | 2.0051 | (0.1312) | *** | −0.0010 | (0.0008) | ns | −0.0259 | (0.0112) | * | −0.0421 | (0.0134) | ** | 17.6 | *** | 67 |
| Barbados | 0.9854 | (0.1493) | *** | 0.0008 | (0.0009) | ns | 0.0406 | (0.0127) | ** | 0.0904 | (0.0153) | *** | 41.4 | *** | 83 | |
| Belgium | 1.0188 | (0.1140) | *** | 0.0003 | (0.0007) | ns | −0.0302 | (0.0097) | ** | 0.0518 | (0.0117) | *** | 11.3 | *** | 56 | |
| Bolivia | 1.6656 | (0.1277) | *** | 0.0000 | (0.0007) | ns | −0.0232 | (0.0109) | * | −0.0406 | (0.0131) | ** | 11.0 | *** | 55 | |
| Botswana | 1.8700 | (0.2791) | *** | −0.0020 | (0.0016) | ns | 0.1966 | (0.0238) | *** | −0.1080 | (0.0286) | ** | 25.0 | *** | 75 | |
| Brazil | 1.5044 | (0.1455) | *** | −0.0008 | (0.0009) | ns | 0.0410 | (0.0124) | ** | 0.0322 | (0.0149) | * | 8.2 | *** | 47 | |
| Canada | 0.9810 | (0.0556) | *** | 0.0001 | (0.0003) | ns | 0.0127 | (0.0047) | * | 0.0282 | (0.0057) | *** | 26.4 | *** | 76 | |
| Cape Verde | 1.4264 | (0.1615) | *** | 0.0015 | (0.0009) | ns | −0.0862 | (0.0138) | *** | 0.0563 | (0.0165) | ** | 16.1 | *** | 65 | |
| Colombia | 1.3105 | (0.1925) | *** | 0.0000 | (0.0011) | ns | 0.0700 | (0.0164) | *** | 0.1019 | (0.0197) | *** | 34.7 | *** | 81 | |
| Comoros | 1.6354 | (0.1040) | *** | 0.0010 | (0.0006) | ns | −0.0342 | (0.0089) | *** | 0.0826 | (0.0106) | *** | 38.4 | *** | 82 | |
| Congo | 1.7723 | (0.1228) | *** | −0.0003 | (0.0007) | ns | 0.0628 | (0.0105) | *** | −0.0414 | (0.0126) | ** | 14.0 | *** | 62 | |
| Costa Rica | 1.4177 | (0.1395) | *** | −0.0012 | (0.0008) | ns | 0.0570 | (0.0119) | *** | 0.1042 | (0.0143) | *** | 46.9 | *** | 85 | |
| Cyprus | 1.2818 | (0.0803) | *** | −0.0008 | (0.0005) | ns | 0.0158 | (0.0068) | * | 0.0290 | (0.0082) | ** | 8.2 | *** | 48 | |
| Djibouti | 1.9699 | (0.1214) | *** | −0.0002 | (0.0007) | ns | −0.0758 | (0.0103) | *** | 0.0373 | (0.0124) | ** | 20.5 | *** | 71 | |
| Equatorial Guinea | 2.0762 | (0.2676) | *** | −0.0015 | (0.0016) | ns | −0.1478 | (0.0228) | *** | 0.0708 | (0.0274) | * | 17.5 | *** | 67 | |
| France | 1.0645 | (0.1026) | *** | −0.0002 | (0.0006) | ns | 0.0375 | (0.0087) | *** | 0.0368 | (0.0105) | ** | 21.0 | *** | 71 | |
| Guinea | 2.0306 | (0.1345) | *** | −0.0003 | (0.0008) | ns | −0.0566 | (0.0115) | *** | 0.0383 | (0.0138) | * | 9.9 | *** | 53 | |
| India | 1.6489 | (0.0833) | *** | 0.0007 | (0.0005) | ns | −0.0530 | (0.0071) | *** | −0.0278 | (0.0085) | ** | 34.0 | *** | 80 | |
| Italy | 1.1665 | (0.0450) | *** | −0.0003 | (0.0003) | ns | −0.0086 | (0.0038) | * | 0.0305 | (0.0046) | *** | 18.2 | *** | 68 | |
| Japan | 0.8699 | (0.0881) | *** | 0.0008 | (0.0005) | ns | 0.0253 | (0.0075) | ** | 0.0244 | (0.0090) | * | 22.2 | *** | 73 | |
| Korea Rep | 1.3337 | (0.0974) | *** | −0.0009 | (0.0006) | ns | −0.0249 | (0.0083) | ** | −0.0634 | (0.0100) | *** | 49.6 | *** | 86 | |
| Kuwait | 1.4431 | (0.1901) | *** | −0.0008 | (0.0011) | ns | −0.0784 | (0.0162) | *** | 0.0689 | (0.0194) | ** | 10.7 | *** | 55 | |
| Luxembourg | 1.2040 | (0.1319) | *** | −0.0005 | (0.0008) | ns | −0.0572 | (0.0112) | *** | 0.0544 | (0.0135) | *** | 12.3 | *** | 59 | |
| Maldives | 1.5875 | (0.2209) | *** | 0.0002 | (0.0013) | ns | −0.1125 | (0.0188) | *** | 0.0522 | (0.0226) | * | 13.1 | *** | 60 | |
| Mongolia | 1.8105 | (0.2200) | *** | −0.0013 | (0.0013) | ns | 0.0802 | (0.0187) | *** | −0.1078 | (0.0225) | *** | 15.5 | *** | 64 | |
| Morocco | 1.5724 | (0.1073) | *** | 0.0006 | (0.0006) | ns | 0.0254 | (0.0091) | * | −0.0381 | (0.0110) | ** | 5.8 | ** | 37 | |
| New Zealand | 1.0629 | (0.1088) | *** | 0.0001 | (0.0006) | ns | 0.0246 | (0.0093) | * | −0.0654 | (0.0111) | *** | 16.6 | *** | 66 | |
| Nigeria | 1.7658 | (0.0905) | *** | 0.0002 | (0.0005) | ns | 0.0566 | (0.0077) | *** | −0.0438 | (0.0093) | *** | 22.6 | *** | 73 | |
| Portugal | 1.3785 | (0.1028) | *** | −0.0010 | (0.0006) | ns | −0.0504 | (0.0088) | *** | 0.0738 | (0.0105) | *** | 24.1 | *** | 74 | |
| Romania | 1.1343 | (0.2224) | *** | 0.0017 | (0.0013) | ns | −0.0736 | (0.0189) | *** | −0.1028 | (0.0228) | *** | 20.5 | *** | 71 | |
| Sweden | 0.8905 | (0.0737) | *** | 0.0009 | (0.0004) | ns | −0.0209 | (0.0063) | ** | 0.0238 | (0.0075) | ** | 10.6 | *** | 55 | |
| Syria | 1.2339 | (0.2837) | *** | 0.0013 | (0.0017) | ns | 0.1447 | (0.0242) | *** | 0.0743 | (0.0290) | * | 31.8 | *** | 79 | |
| Tanzania | 1.8223 | (0.1845) | *** | 0.0000 | (0.0011) | ns | 0.0608 | (0.0157) | *** | −0.0635 | (0.0189) | ** | 7.8 | ** | 46 | |
| Thailand | 1.7462 | (0.2384) | *** | −0.0023 | (0.0014) | ns | 0.0744 | (0.0203) | ** | 0.1019 | (0.0244) | *** | 16.3 | *** | 66 | |
| Trinidad and Tobago | 1.0992 | (0.1220) | *** | 0.0006 | (0.0007) | ns | 0.0910 | (0.0104) | *** | 0.0346 | (0.0125) | * | 57.4 | *** | 88 | |
| Uruguay | 1.1405 | (0.1044) | *** | 0.0003 | (0.0006) | ns | 0.0513 | (0.0089) | *** | 0.0340 | (0.0107) | ** | 32.3 | *** | 80 | |
| Zambia | 1.7438 | (0.2728) | *** | 0.0002 | (0.0016) | ns | 0.1262 | (0.0232) | *** | −0.1030 | (0.0279) | ** | 12.7 | *** | 59 | |
| Change 2 only is significant | Angola | 2.2368 | (0.2047) | *** | −0.0019 | (0.0012) | ns | 0.0000 | (0.0174) | ns | −0.0825 | (0.0209) | *** | 16.4 | *** | 66 |
| Argentina | 1.4837 | (0.1719) | *** | −0.0016 | (0.0010) | ns | −0.0008 | (0.0146) | ns | 0.0479 | (0.0176) | * | 2.5 | ns | 16 | |
| Burkina Faso | 1.8893 | (0.0514) | *** | 0.0005 | (0.0003) | ns | −0.0014 | (0.0044) | ns | −0.0165 | (0.0053) | ** | 3.6 | * | 24 | |
| Chad | 1.8901 | (0.0719) | *** | 0.0003 | (0.0004) | ns | 0.0081 | (0.0061) | ns | 0.0236 | (0.0074) | ** | 11.9 | *** | 58 | |
| Egypt | 1.9139 | (0.1633) | *** | −0.0015 | (0.0010) | ns | 0.0186 | (0.0139) | ns | −0.0569 | (0.0167) | ** | 10.9 | *** | 55 | |
| Ethiopia | 1.7010 | (0.1741) | *** | 0.0013 | (0.0010) | ns | 0.0296 | (0.0148) | ns | −0.0538 | (0.0178) | ** | 3.9 | * | 27 | |
| Finland | 1.1263 | (0.1120) | *** | −0.0004 | (0.0007) | ns | 0.0097 | (0.0095) | ns | 0.0494 | (0.0115) | *** | 11.3 | *** | 56 | |
| Gabon | 1.3911 | (0.2393) | *** | 0.0015 | (0.0014) | ns | 0.0135 | (0.0204) | ns | −0.1084 | (0.0245) | *** | 7.9 | *** | 46 | |
| Germany | 1.0528 | (0.0942) | *** | 0.0002 | (0.0006) | ns | 0.0159 | (0.0080) | ns | −0.0711 | (0.0096) | *** | 26.7 | *** | 76 | |
| Ghana | 1.6170 | (0.1396) | *** | 0.0008 | (0.0008) | ns | 0.0053 | (0.0119) | ns | −0.0321 | (0.0143) | * | 1.7 | ns | 8 | |
| Greece | 1.2249 | (0.0876) | *** | −0.0006 | (0.0005) | ns | 0.0037 | (0.0075) | ns | 0.0220 | (0.0090) | * | 2.6 | ns | 16 | |
| Iceland | 1.2555 | (0.1150) | *** | −0.0013 | (0.0007) | ns | −0.0140 | (0.0098) | ns | 0.0557 | (0.0118) | *** | 7.8 | ** | 46 | |
| Israel | 1.0504 | (0.0551) | *** | 0.0004 | (0.0003) | ns | 0.0066 | (0.0047) | ns | −0.0382 | (0.0056) | *** | 19.4 | *** | 70 | |
| Mali | 1.8479 | (0.0889) | *** | 0.0008 | (0.0005) | ns | −0.0154 | (0.0076) | ns | −0.0232 | (0.0091) | * | 4.8 | * | 32 | |
| Mexico | 1.1809 | (0.1428) | *** | 0.0006 | (0.0008) | ns | 0.0092 | (0.0122) | ns | 0.0556 | (0.0146) | ** | 13.3 | *** | 61 | |
| Senegal | 1.7027 | (0.1413) | *** | 0.0010 | (0.0008) | ns | 0.0120 | (0.0120) | ns | −0.0385 | (0.0145) | * | 2.5 | ns | 16 | |
| Sierra Leone | 1.9312 | (0.0537) | *** | 0.0004 | (0.0003) | ns | 0.0015 | (0.0046) | ns | −0.0430 | (0.0055) | *** | 29.4 | *** | 78 | |
| Spain | 1.3843 | (0.1422) | *** | −0.0017 | (0.0008) | ns | 0.0233 | (0.0121) | ns | 0.0396 | (0.0145) | * | 4.5 | * | 30 | |
| Sri Lanka | 1.4945 | (0.2632) | *** | 0.0001 | (0.0015) | ns | 0.0225 | (0.0224) | ns | −0.0869 | (0.0269) | ** | 5.2 | ** | 35 | |
| Only the number of countries is significant | Honduras | 1.3832 | (0.1179) | *** | 0.0016 | (0.0007) | * | −0.0122 | (0.0100) | ns | 0.0027 | (0.0121) | ns | 3.0 | ns | 20 |
| Niger | 1.8774 | (0.0479) | *** | 0.0006 | (0.0003) | * | 0.0051 | (0.0041) | ns | −0.0037 | (0.0049) | ns | 4.1 | * | 28 | |
| Togo | 1.4464 | (0.1245) | *** | 0.0022 | (0.0007) | ** | −0.0080 | (0.0106) | ns | 0.0155 | (0.0127) | ns | 8.7 | *** | 49 | |
| Both number of countries and Change 1 are significant | Cameroon | 1.4206 | (0.1159) | *** | 0.0019 | (0.0007) | * | 0.0532 | (0.0099) | *** | −0.0200 | (0.0119) | ns | 20.2 | *** | 71 |
| El Salvador | 1.2022 | (0.1368) | *** | 0.0025 | (0.0008) | ** | −0.0583 | (0.0117) | *** | −0.0189 | (0.0140) | ns | 9.9 | *** | 53 | |
| Guinea-Bissau | 2.0699 | (0.0508) | *** | −0.0008 | (0.0003) | * | 0.0278 | (0.0043) | *** | −0.0094 | (0.0052) | ns | 14.7 | *** | 63 | |
| Ireland | 1.4830 | (0.1344) | *** | −0.0022 | (0.0008) | * | −0.0383 | (0.0114) | ** | −0.0089 | (0.0137) | ns | 17.9 | *** | 68 | |
| Lesotho | 0.9626 | (0.2054) | *** | 0.0044 | (0.0012) | ** | 0.0552 | (0.0175) | ** | 0.0091 | (0.0210) | ns | 22.0 | *** | 72 | |
| Singapore | 1.7666 | (0.1792) | *** | −0.0033 | (0.0010) | ** | −0.0525 | (0.0153) | ** | −0.0272 | (0.0183) | ns | 25.3 | *** | 75 | |
| Swaziland | 1.0508 | (0.2538) | *** | 0.0036 | (0.0015) | * | 0.0675 | (0.0216) | ** | −0.0168 | (0.0260) | ns | 10.4 | *** | 54 | |
| Turkey | 1.9671 | (0.2546) | *** | −0.0032 | (0.0015) | * | 0.0865 | (0.0217) | *** | −0.0425 | (0.0260) | ns | 7.2 | ** | 44 | |
| Both number of countries and Change 2 are significant | Guyana | 1.2014 | (0.1275) | *** | 0.0023 | (0.0007) | ** | −0.0186 | (0.0109) | ns | 0.0420 | (0.0130) | ** | 16.6 | *** | 66 |
| Hong Kong | 1.4730 | (0.0600) | *** | −0.0020 | (0.0004) | *** | 0.0049 | (0.0051) | ns | −0.0405 | (0.0061) | *** | 73.6 | *** | 90 | |
| Myanmar | 1.3265 | (0.1113) | *** | 0.0024 | (0.0007) | ** | −0.0026 | (0.0095) | ns | 0.0265 | (0.0114) | * | 18.2 | *** | 68 | |
| Paraguay | 1.1121 | (0.1215) | *** | 0.0023 | (0.0007) | ** | −0.0055 | (0.0103) | ns | 0.0585 | (0.0124) | *** | 30.7 | *** | 79 | |
| Saudi Arabia | 1.9945 | (0.2634) | *** | −0.0034 | (0.0015) | * | 0.0016 | (0.0224) | ns | −0.1229 | (0.0269) | *** | 24.0 | *** | 74 | |
| Suriname | 0.8304 | (0.2668) | ** | 0.0033 | (0.0016) | * | 0.0283 | (0.0227) | ns | 0.0697 | (0.0273) | * | 15.0 | *** | 64 | |
| None of the factors are significant | Albania | 0.8875 | (0.5286) | ns | 0.0034 | (0.0031) | ns | −0.0169 | (0.0450) | ns | −0.0945 | (0.0541) | ns | 1.2 | ns | 2 |
| Belize | 0.8812 | (0.5098) | ns | 0.0030 | (0.0030) | ns | 0.0419 | (0.0434) | ns | 0.0387 | (0.0522) | ns | 2.9 | ns | 19 | |
| Benin | 1.8899 | (0.1886) | *** | 0.0000 | (0.0011) | ns | 0.0117 | (0.0161) | ns | −0.0359 | (0.0193) | ns | 1.7 | ns | 8 | |
| Bulgaria | 0.9972 | (0.2883) | ** | 0.0018 | (0.0017) | ns | 0.0181 | (0.0245) | ns | −0.0436 | (0.0295) | ns | 0.9 | ns | 0 | |
| Denmark | 1.2593 | (0.1059) | *** | −0.0010 | (0.0006) | ns | −0.0007 | (0.0090) | ns | −0.0095 | (0.0108) | ns | 3.6 | * | 25 | |
| Dominican Republic | 1.5007 | (0.1328) | *** | 0.0001 | (0.0008) | ns | 0.0001 | (0.0113) | ns | −0.0010 | (0.0136) | ns | 0.0 | ns | 0 | |
| Haiti | 1.4418 | (0.1871) | *** | 0.0023 | (0.0011) | ns | 0.0114 | (0.0159) | ns | −0.0017 | (0.0191) | ns | 3.7 | * | 25 | |
| Hungary | 0.9181 | (0.1971) | *** | 0.0018 | (0.0012) | ns | −0.0108 | (0.0168) | ns | −0.0186 | (0.0202) | ns | 0.8 | ns | 0 | |
| Jordan | 1.8305 | (0.2482) | *** | −0.0019 | (0.0015) | ns | 0.0298 | (0.0211) | ns | −0.0302 | (0.0254) | ns | 2.5 | ns | 16 | |
| Lao | 2.0406 | (0.1328) | *** | −0.0015 | (0.0008) | ns | −0.0096 | (0.0113) | ns | −0.0234 | (0.0136) | ns | 8.7 | *** | 49 | |
| Libya | 1.4009 | (0.4489) | ** | 0.0001 | (0.0026) | ns | −0.0763 | (0.0382) | ns | 0.0688 | (0.0459) | ns | 1.8 | ns | 9 | |
| Madagascar | 1.3551 | (0.2360) | *** | 0.0026 | (0.0014) | ns | 0.0244 | (0.0201) | ns | −0.0302 | (0.0241) | ns | 2.5 | ns | 16 | |
| Malaysia | 1.2963 | (0.0801) | *** | 0.0002 | (0.0005) | ns | 0.0124 | (0.0068) | ns | −0.0166 | (0.0082) | ns | 2.2 | ns | 13 | |
| Malta | 1.2665 | (0.1358) | *** | −0.0004 | (0.0008) | ns | −0.0133 | (0.0116) | ns | 0.0066 | (0.0139) | ns | 0.8 | ns | 0 | |
| Namibia | 1.5828 | (0.2389) | *** | 0.0006 | (0.0014) | ns | 0.0050 | (0.0203) | ns | −0.0392 | (0.0244) | ns | 1.0 | ns | 0 | |
| Netherlands | 1.1529 | (0.0724) | *** | −0.0007 | (0.0004) | ns | 0.0053 | (0.0062) | ns | −0.0051 | (0.0074) | ns | 2.3 | ns | 14 | |
| Nicaragua | 1.1965 | (0.2240) | *** | 0.0026 | (0.0013) | ns | 0.0127 | (0.0191) | ns | −0.0145 | (0.0229) | ns | 2.5 | ns | 16 | |
| Pakistan | 1.5752 | (0.1065) | *** | 0.0011 | (0.0006) | ns | 0.0143 | (0.0091) | ns | −0.0186 | (0.0109) | ns | 2.8 | ns | 18 | |
| Panama | 1.5842 | (0.2077) | *** | −0.0017 | (0.0012) | ns | 0.0282 | (0.0177) | ns | 0.0189 | (0.0213) | ns | 1.3 | ns | 4 | |
| Switzerland | 1.1080 | (0.1533) | *** | −0.0003 | (0.0009) | ns | 0.0077 | (0.0131) | ns | −0.0236 | (0.0157) | ns | 1.6 | ns | 7 | |
| Uganda | 1.6455 | (0.1747) | *** | 0.0014 | (0.0010) | ns | −0.0271 | (0.0149) | ns | −0.0081 | (0.0179) | ns | 1.3 | ns | 4 | |
| United Kingdom | 1.1104 | (0.1604) | *** | −0.0002 | (0.0009) | ns | 0.0074 | (0.0137) | ns | 0.0282 | (0.0164) | ns | 2.0 | ns | 11 | |
| United States | 0.9107 | (0.1114) | *** | 0.0007 | (0.0007) | ns | 0.0119 | (0.0095) | ns | −0.0135 | (0.0114) | ns | 1.3 | ns | 3 | |
| Yemen | 1.5585 | (0.2126) | *** | 0.0015 | (0.0012) | ns | −0.0022 | (0.0181) | ns | 0.0102 | (0.0218) | ns | 1.5 | ns | 6 | |
| Group | Sub-Groups | Number of Countries in Sub-Group | Percentage (%) |
|---|---|---|---|
| None | No significant coefficients | 24 | 18 |
| Number of countries (N) | 3 | 2 | |
| Single | Change 1 | 25 | 19 |
| Change 2 | 19 | 14 | |
| Sub-total | 47 | 35 | |
| N and Change 1 | 9 | 7 | |
| Double | N and Change 2 | 6 | 4 |
| Change 1 and Change 2 | 37 | 27 | |
| Sub-total | 52 | 38 | |
| Triple | N and Change 1 and Change 2 | 12 | 9 |
| Overall total | 135 | 100 |
© 2020 by the author. Licensee MDPI, Basel, Switzerland. This article is an open access article distributed under the terms and conditions of the Creative Commons Attribution (CC BY) license (http://creativecommons.org/licenses/by/4.0/).
Share and Cite
Morse, S. To Rank or Not to Rank with Indices? That Is the Question. Sustainability 2020, 12, 5572. https://doi.org/10.3390/su12145572
Morse S. To Rank or Not to Rank with Indices? That Is the Question. Sustainability. 2020; 12(14):5572. https://doi.org/10.3390/su12145572
Chicago/Turabian StyleMorse, Stephen. 2020. "To Rank or Not to Rank with Indices? That Is the Question" Sustainability 12, no. 14: 5572. https://doi.org/10.3390/su12145572
APA StyleMorse, S. (2020). To Rank or Not to Rank with Indices? That Is the Question. Sustainability, 12(14), 5572. https://doi.org/10.3390/su12145572