Article

An Epitome of Building Floor Systems by Means of LCA Criteria

by
Yovanna Elena Valencia-Barba
1,
José Manuel Gómez-Soberón
2,*,
María Consolación Gómez-Soberón
3 and
Fernando López-Gayarre
4
1
Barcelona School of Architecture, Polytechnic University of Catalonia, 649 Diagonal Avenue, 08028 Barcelona, Spain
2
Barcelona School of Building Construction, Polytechnic University of Catalonia, 44-50 Doctor Marañón Avenue, 08028 Barcelona, Spain
3
Civil Engineering School, Metropolitan Autonomous University, 180 San Pablo Avenue, México City 02200, Mexico
4
Department of Construction and Manufacturing Engineering, Campus de Gijón, University of Oviedo, 33203 Asturias, Spain
*
Author to whom correspondence should be addressed.
Sustainability 2020, 12(13), 5442; https://doi.org/10.3390/su12135442
Submission received: 22 May 2020 / Revised: 17 June 2020 / Accepted: 2 July 2020 / Published: 6 July 2020
(This article belongs to the Special Issue Environmental Assessment of Buildings for Deep Impact Reductions)

Abstract

:
Studies of the elements that make up the structure of a building have generally focused on topics related to their physical and structural capacities. Although research has been carried out into environmental impact during the life cycle stages, the environmental profile is far from established. This research aims to reduce the gap in the knowledge of this subject, offering useful information to professionals in the construction industry, which will enable them to consider environmental aspects when choosing the best construction systems. The present study applies the methodology of the life cycle assessment (LCA), to analyze and compare four floor construction systems in two different scenarios (“A” with a functional homogeneous unit of 1 m2 and “B” with 1 m² made up of the percentages of the floor system and the special areas of the building). The analysis is performed using the LCA Manager software, along with the Ecoinvent 3.1 database and with a cradle to handover perspective (A1–A5). Comparison was made using two environmental impact methodologies, Eco-indicator 99 and CML 2001. The results highlight the stages A1–A3 as those that generate the greatest environmental impact. Comparing the environmental profiles of the different floor systems, one-way floor systems I and II had the best environmental scores, 30% less than two-way floor system III and 50% less than slab floor system IV.

Graphical Abstract

1. Introduction

The European Commission has identified the construction industry as being one of the greatest causes of environmental impact, due to its consumption of resources and energy as well as the generation of emissions and residues [1]. Regarding this, the so-called construction and demolition waste (CDW) account for a third part of the total flow of waste generated in the European region [2]. At local level, in the location used in the research, this percentage is not far from the European, representing approximately 25% of the total waste generated [3]. As this sector is constantly growing, it is necessary to try new proposals and initiatives to help identify (by analyzing the stages in each process) the causes of the impact generated. Consequently, it will be possible to design strategies that apply more sustainable building practices to reduce these affectations.
Nowadays, standardized information tools and procedures have been developed allowing professionals in the sector, on one hand to perform, and on the other hand to obtain information related to the environmental profile and the impact generated in construction [4]. At the building level, there are regulations and standards for the evaluation of sustainability such as: EN 15643-1, EN 15643-2, EN 15643-3, EN 15643-4, EN 15643-5 y EN 15978 [5,6,7,8,9,10]; which make up the framework for the evaluation and calculation of sustainability in the construction of buildings—including the life cycle assessment (LCA). Among other systems of sustainable evaluation of buildings, the so-called certification systems have also been implemented (which establish an evaluation of the environmental performance of the buildings); those with higher diffusion being LEED and BREEAM. At product level, the Environmental Product Declaration (EPD) have been implemented, which are documents that provide information on the environmental profile during the life cycle (LC) of different construction products and are regulated by EN 15804, CEN/TR 15941, EN 15942, etc. [11,12,13].
Currently, the energy efficiency and environmental impact certificates for buildings are focused on evaluating their use stages (stages B1-7) [14]. The energy consumption of heating, ventilation, air-conditioning (HVAC), and lighting is the main indicator. However, the energy incorporated in the building materials is not considered [15,16]. The continuing improvements in energy consumption in stages B1-7 will also mean that, in any future analysis of a building’s environmental behavior, the omitted stages (extraction and production of materials—stages A1-3) and as well as the construction process (stages A4-5) will have more important impact, since its optimal selection were not considered or included in the design phase. Therefore, the widely used and accepted life cycle assessment (LCA) is proposed as the method to analyze and globally evaluate the sustainability of buildings.
The LCA is a methodology model based on the principle that every activity generates an environmental affectation. Consequently, it identifies, quantifies, and evaluates these impacts within a complete LC process of an element [17,18]. Several studies have confirmed that it is a valuable and useful tool for the industry. However, it is necessary to incorporate improvements that enhance the comparability of the studies and mitigate its limitations, due to factors such as the complexity of the construction industry, the variety in construction methods, the lack of homogeneity in the data available from different databases—linked to geographic or climatic factors—etc. [19,20,21,22].
Of the several aspects studied from an LCA perspective, there are some works that analyze the impact generated by the production of different materials, as in the case of several researchers [23,24,25,26]; other studies have focused on comparing the use of different materials as products in a project [27,28,29,30,31,32]. They identify the embodied energy (EE) in the elements (the total amount of energy required for all the process related to the construction of a building, its maintenance, and end-of-life [33]), the opportunities of optimization in the LC, the impact generated by the materials, and which ones generate fewer environmental impact.
There are also studies that analyze both the construction process and the building, studying the energy increase in different scenarios [34,35,36,37]. They confirm the importance of the choice of materials as a strategy for reducing the impact generated.
In the search for strategies that will help reduce the demand in B1-7, a significant number of LCA studies have concentrated on an analysis of the energy efficiency of buildings, demonstrating their importance when considering the environmental impact of a building’s full life cycle [38,39,40]. This focus has led, in part, to less attention being paid to detailed analysis of the other stages. However, some recent studies have included A1-5 [41,42,43,44,45]; while they have a lower impact on the total environmental load (from cradle to grave) they are quicker to carry out, generating a greater affectation in a shorter amount of time (according to an impact/time relation).
The study of building structures has been limited to topics related to their physical, structural and durability properties, leaving the environmental impact unexplored [46]. This, however, ignores the fact that a building’s structure represents a high percentage of the building’s weight and, consequently, its repercussions in A1-5 might provide a wealth of opportunities for reducing the environmental impact. Of the different elements that integrate the structure of a building, reinforced concrete slabs are among the most important, being used as floors, mezzanines, and roofs. The floor systems are horizontal or sloped structures that bear the various loads, which are later transmitted to the other elements of the structure [47]. More technology and new materials are increasingly used in their assembly; however, reinforced concrete is still the most widely used material, due to its advantages over other materials [48]. Despite this supposed suitability, producing concrete with conventional methods has high environmental repercussions [29] and so, several studies are engaged in trying to improve its environmental compatibility [49], investigating the substitution of natural aggregates by recycled ones [50,51,52,53], or even replacing the cement itself with cementitious supplementary materials [54,55].
Among the efforts being made to identify sustainable alternatives in floor systems, some studies have analyzed different environmental categories, in particular those concerning the EE and greenhouse gas emissions (GHGs) [56]—which is a group of gases that contribute to the global warming and climate change [57]; it has been established that a rigorous environmental analysis can influence the adoption of more sustainable designs [46]; regarding the design of new floor systems, the importance of developing a circular economy in the process of obtaining steel and cement is evident [58].
Although these methods seek to conform to the directives of CEN/TC 350, there are still areas to be studied, such as the deterioration of a structure due to its environs and the chemical behavior of its materials [59]. Additionally, the importance of evaluating each of the stages that make up the LC of each structure has been established; for example, B1-7 should be considered in terms of the climatic zone in which it is built, as its variations with regard to the other stages (production, execution, and demolition) may reach up to 140% [60]. For its part, transport (present in all stages of the LC) is a factor causing fluctuations in the environmental impact (varying from reductions of 65.66% to increases of 18.24%), depending on the project’s location as explained by Ferreiro-Cabello et al. [61].
Although there are several studies regarding environmental impact and each of the stages in the LC of structures, floor systems in particular, their environmental profile is far from being established. Similarly, there is no standardized method for obtaining comparable results at a local, regional, or global level and so more research is needed to increase the knowledge in this area. Therefore, the aim of this work is to contribute to minimizing the gaps in the existing knowledge, generating a study from the perspective of the design and construction of a building (stages A1–A5), in which it is planned to apply the LCA methodology to study and compare the environmental impact produced by a specific building system; in this case, the analysis of the most representative types of floor system in the Spanish ambit in two different evaluation contexts (the theoretical-homogeneous scenario and the scenario of application to a specific building type). The results of the study provide support information for decision making, focusing on construction with sustainable criteria, intended to all professionals in the construction sector.

2. Materials and Methods

2.1. Aim and Scope of the Study

The aim of the work is to apply the methodology of the LCA to study and compare the environmental impact of the four types of floor systems—those most representative in a Spanish context—in two evaluation scenarios: Scenario “A” (theoretical-homogeneous) and “B” (application to a specific building type).
The structural systems to be analyzed fulfill the principal function of being resistant elements used as floor systems in buildings. The functional unit chosen for analysis is one square meter (1 m2) of each type of floor system; as this is a widely used measurement in the construction regulations and is one of the recommended units by the standards [11], it facilitates comparison of different systems and allows verification of compliance with the regulations applicable to the type of construction involved.
To identify the environmental impact caused by the building process, and not those resulting from the building’s use, the scope of the analysis was set as the modules known as “from cradle to handover” [33], which include the stages of raw material extraction (A1), transport to the factory (A2), production (A3), transport to site (A4), and construction (A5). The selection of the stages to be analyzed has been made based on the guidelines established by International Energy Agency [33], based on the criterion that the development in regulations and the state of knowledge related to the Use Stage of the building is such that it has been possible to decrease the affectation derived from it, achieving the design and construction of buildings with high energy efficiency [62,63,64] and even zero-energy buildings (NZEB) [65,66,67].
As a complement to the “from cradle to handover” approach, the analysis of the end-of-life stages of the building has been added (C1- C4), in order to contribute and expand the information described in the article in relation to the damages derived from the demolition, transportation from the site to the landfill, and disposal of waste. In addition, a sensitivity analysis related to the maintenance and replacement stages has been included, in order to analyze the repercussions of scenarios with a high degree of uncertainty. The results are shown separated according to two approaches; on the one hand, the results obtained from the “from cradle to handover” approach are exposed, and on the other hand, the end-of-life stages.

2.2. Case Studies

This work studies two construction scenarios for four different floor system building methods. The constructive solutions of floor systems were selected based on the analysis of the most common systems in the Spanish context, previously performed by Ortega [68], and by the recommendations of the Spanish Regulations available in the Catalog of Constructive Elements [69]. These constructive solutions are interchangeable within the structural system of a building and comply with all the current applicable regulations [70]. Figure 1 shows the constructive details of the floor system types, which are: One-way prestressed concrete joist with ceramic hollow slab blocks (I); one-way precast lattice joist and concrete hollow bricks (II); two-way joist with cast in place concrete and expanded polystyrene filler block (EPS); (III) and reinforced concrete slab (IV).
The technical specifications and the functional properties of the four floor systems are shown in the Table 1.
In Scenario A, the floor system for analysis is considered an entirely homogeneous element, without specially reinforced areas, where the square meter is composed of the materials shown in Figure 1. This scenario is studied to obtain a result that may be applied generically in building projects.
Scenario B proposes an analysis of the floor systems used in Scenario A but applied to a typical Barcelona building [68]. In this case, the analysis includes the areas of special reinforcement specified in the plans of the adopted building solution, such as lift shafts and interior patios, perimeter beams, slab zones in stairs and sloped slabs on parking ramps, reinforcements in irregular areas, etc. Therefore, in order to model the functional unit in this scenario—composed of a real representative percentage of all the project’s elements—it was necessary to weigh and apportion the area of each surface of special reinforcement indicated on each floor, also considering its representativeness in the total area of the building (calculations and details available in [71]). This obtained the characterization of each square meter of floor system, as shown in Figure 2. Surfaces of less than 5% were considered part of the analyzed floor system, as they were considered unimportant for the results of the LCA.
The nomenclature used to characterize each constructive solution is defined by the type of floor system analyzed (I, II, III and IV) and the corresponding scenario (A-B).

2.3. Impact Assessment Method and Categories

The results will be analyzed using two evaluation methods: That of the Eco-indicator 99—to obtain easily interpreted and comparable results, which from an “endpoint” focus, offers results expressed in comparable eco-points focused on the damage approach of three categories [73]. The methodology CML 2001 [74], with a “midpoint” focus, is used in order to identify the indicator at a level of cause–effect chain between the analyzed processes and the LC stage in which they occurred. Table 2 shows the impact categories considered in the study.
The LCA Manager 1.3 software has been used as a support for developing the LCA [18], as it enables evaluation according to regulation ISO 14044 [14] and facilitates the analysis of results by means of different impact categories.

2.4. Data Inventory

The data of the environmental impact to be used come from the Ecoinvent 3.1 database [75], developed by the Swiss Federal Offices and the ETH Zurich. This is globally recognized for containing information on a broad spectrum of activities, as well as being constantly updated and having reliable and transparent calculation processes. As there are no specific data for the Spanish area, the use of reliable European area data was deemed acceptable for the purpose of this research [76].
The BEDEC database, developed by the Catalonia Institute of Construction Technology (ITeC), was used for quantifying the materials and machinery needed for constructing each system to be analyzed. This database contains detailed information about constructive elements, contract specifications, and building products from all provinces of Spain [77]. For the CDW calculation and the quantification of the machinery necessary for the demolition, the software-database CYPE was used [78].

2.5. Assumptions

The following assumptions were made for this study. According to the established in the Spanish regulations, the reference service life of the elements is considered as 50 years [72]. Stage A4: For calculating the corresponding distances, Barcelona (41°23′56.2″ N 2°09′42.9″ E) was established as the reference location due to its central geographic position in the city [66]. In Stage A5: The use of a tower crane for lifting materials and the use of auxiliary machinery for the construction process were considered. Due to the lack of specific information in Ecoinvent, the available generic machines were used, which implicate all the processes, maintenance, and energy consumption of the machinery involved. Specifically, in the absence of a specific process on the production of ceramic hollow slab blocks, the “brick production” dataset has been used as a substitute, because the process followed by the manufacture of the bricks and the slab blocks are similar and the results can be extrapolated (according to what is specified by Ecoinvent [75]).
The analysis of the end-of-life stages represents more complexity in its definition than other stages of the Life Cycle; mainly due to the higher level of uncertainty in the processes that have to be considered in the analysis. This uncertainty is linked to the future development or advance in the measures and technologies used for demolition, and to the development of new material recovery scenarios [79]. However, in this analysis, the environmental impacts assigned to the module C (end-of-life), are considered to begin when the activity that generates the waste takes place, and consider the waste management as a process that generates materials to be “discarded, recovered, recycled or reused” [10]. The impacts assigned to this module refers to this waste management and the disposal of waste to the landfill. If this were not the final destination of the waste, at the end of their condition as waste, the resulting materials would be analyzed in module D—“Benefits and loads beyond the system” (recovery, reuse, and/or recycling) [80].

2.6. Life Cycle Inventory (LCI)

Once the study cases have been established and the technical specifications and regulations complied with, along with the constructive details of the solutions, specific databases of the construction industry were used to quantify the materials that make up each floor system (considering the totality of the elements both individually and specifically). To obtain significant results and simplifying the LCA process, those materials with a representative percentage of less than 5% of the total were discarded, as it has been shown that their non-consideration does not generate significant alterations in the results [44]. Figure 3 shows the flow diagram of the life cycle inventory (LCI) studied in the analysis.
Production stage (A1–A3): The calculation and quantification of the materials needed for each square meter of the floor system analyzed was carried out using the BEDEC database [77], and this was based on the plans, sections, and construction details of the project. The data corresponding to the input and output flows of energy and material supplies, resource extraction, transport of raw materials to the production center, their handling in the factory, and the residues generated by the process were obtained by weighing the quantified data regarding the units required by the Ecoinvent V3.1 database.
Table 3 shows the detailed characterization of the materials and quantities that make up the functional unit of each of the analyzed floor systems and their positioning in the Ecoinvent database, which was used to establish the input and output flow of materials and energy.
Transport stage (A4): Table 4 shows the distances for each type of material considered in the analysis; they were made by averaging the distances used in previous studies and the real distances from the available factories in the local environs [45,81]. It was also assumed that the materials were transported by a normal, diesel-powered, 28-ton lorry [82]. The performance and wear associated with transporting the materials were calculated based on a service life of 540,000 km.
Construction stage (A5): Table 3 shows the amount of supplementary machinery and materials required for building one square meter of each type of floor system. To carry out the quantification, the data available in the BEDEC database and the basic properties of the materials were considered (such as density, volume, composition, etc.), as well as the performance and wear of the machinery and the reuse of the wood formwork.
To obtain the proportional quantity of wood formwork to be used, the amount of wood required for each system (m3) was divided by 10, representing the total number of possible reuses [77]. For the calculations regarding the concrete pump, a pump with a capacity of 63 m3/h and average service life of 10,000 h was considered [83]. A performance of 20 m3/h with an electric motor of 1.3 kW was considered in the case of the vibrations of the concrete elements, as this was the recommended machinery for these elements [84]. A 40-m high tower crane with a 40-m arm was considered for lifting the materials within the building. This had a load capacity of 2 tons, speed of 35 m/min, and an average 10,000 h of average service life [85].
Maintenance—replacement Stage (B2–B4): The use and maintenance manuals of a building establish that, in the case of conventional structural elements, a higher level of inspection is not required than the regular routine of a building, which is established as a visual inspection every 10 years [78,86]. Therefore, theoretically, the maintenance needs or replacement actions of elements for damages presented during the time are null. However, to know the repercussion of this variable, a sensitivity analysis has been carried out including different scenarios of replacement of percentages of the functional unit (Section 3.1.3).
Demolition Stage (C1): For the analysis of the Demolition stage of the building, it has been considered that it will be demolished “element by element”, which allows visualizing the demolition implications and requirements of the functional unit used in the research (one square meter of floor system). The CYPE software was used to quantify the machinery necessary for the demolition of each element (pneumatic hammer, cutting equipment, and portable compressor) [78]. The quantification of the machinery in “Scenario A” focuses solely on the demolition of the floor system; while in “Scenario B”, the machinery necessary for the demolition of each element that is included in the functional unit, has been quantified relatively to its percentage (refer to “Figure 2”, where the percentages of the elements in the functional unit are specified). Table 5 shows the inventory of the machinery considered.
Transport from site to disposal (C2): Following the principle of proximity indicated in the regulations, it is established that the CDW are transported within a radius of 15 km from the urban center under study, the transport used is containers of 7 cubic meter of capacity [87]. This corresponds to the average distance of the closest recycling plants to the study location [88]. Table 6 specifies the inventory of materials and its transportation to the landfill.
Waste processing and Disposal (C3–C4): Once the quantification of the machinery required for the demolition has been carried out, the types of waste generated are quantified and identified—based on the weight of the materials that are considered in each floor system. Using the CYPE database [78], the classification of the waste generated has been established, most of which correspond to the CDW level II group: CDW of non-petrous nature (metals) and CDW of petrous nature (concrete and ceramic materials) [89]. As being of petrous, metallic, and petroleum origin, the materials are considered inert and its processing does not represent a potential risk to the environment [90]. Table 7 specifies the inventory of the CDW generated in each group of waste.
It is necessary to highlight that the local regulations establish that the segregation of construction waste “in place” is mandatory when, individually, the expected quantity generated exceeds 80 t of concrete; 40 t of bricks, tiles, and ceramic materials; 2 t of metals, etc. [78]. Such quantification is outside the scope of this investigation, due to the nature of the functional unit. Therefore, for the analysis of the final stage, the waste treatment is only established until its final disposal.

3. Results and Discussion

3.1. Results of the Life Cycle Impact Assessment (LCIA)

The LCIA aims to characterize the input and output elements of the flows modelled in the LCI, assigning these results to the environmental impact categories chosen for analysis. The results obtained from the methodologies Eco-indicator 99 and CML 2001 are presented below, where the environmental impact of the different systems in each scenario is identified, which of them have the greatest contribution to the categories of damage or environmental indicators, and the stages that produce the greatest impact. The presentation and analysis of results have been separated; on the one hand, the results of the “from the cradle to handover” approach are shown, and on the other, the stages with potential for waste generation are shown (replacement stage (B4) and the end-of-life stages of the building (C1–C4)). In order to provide a complete overview of the environmental impact, a differentiated visualization by the different stages was generated, allowing the relationship of each stage with the impact generated to be clearly identified.

3.1.1. Results of the Eco-Indicator 99 Method

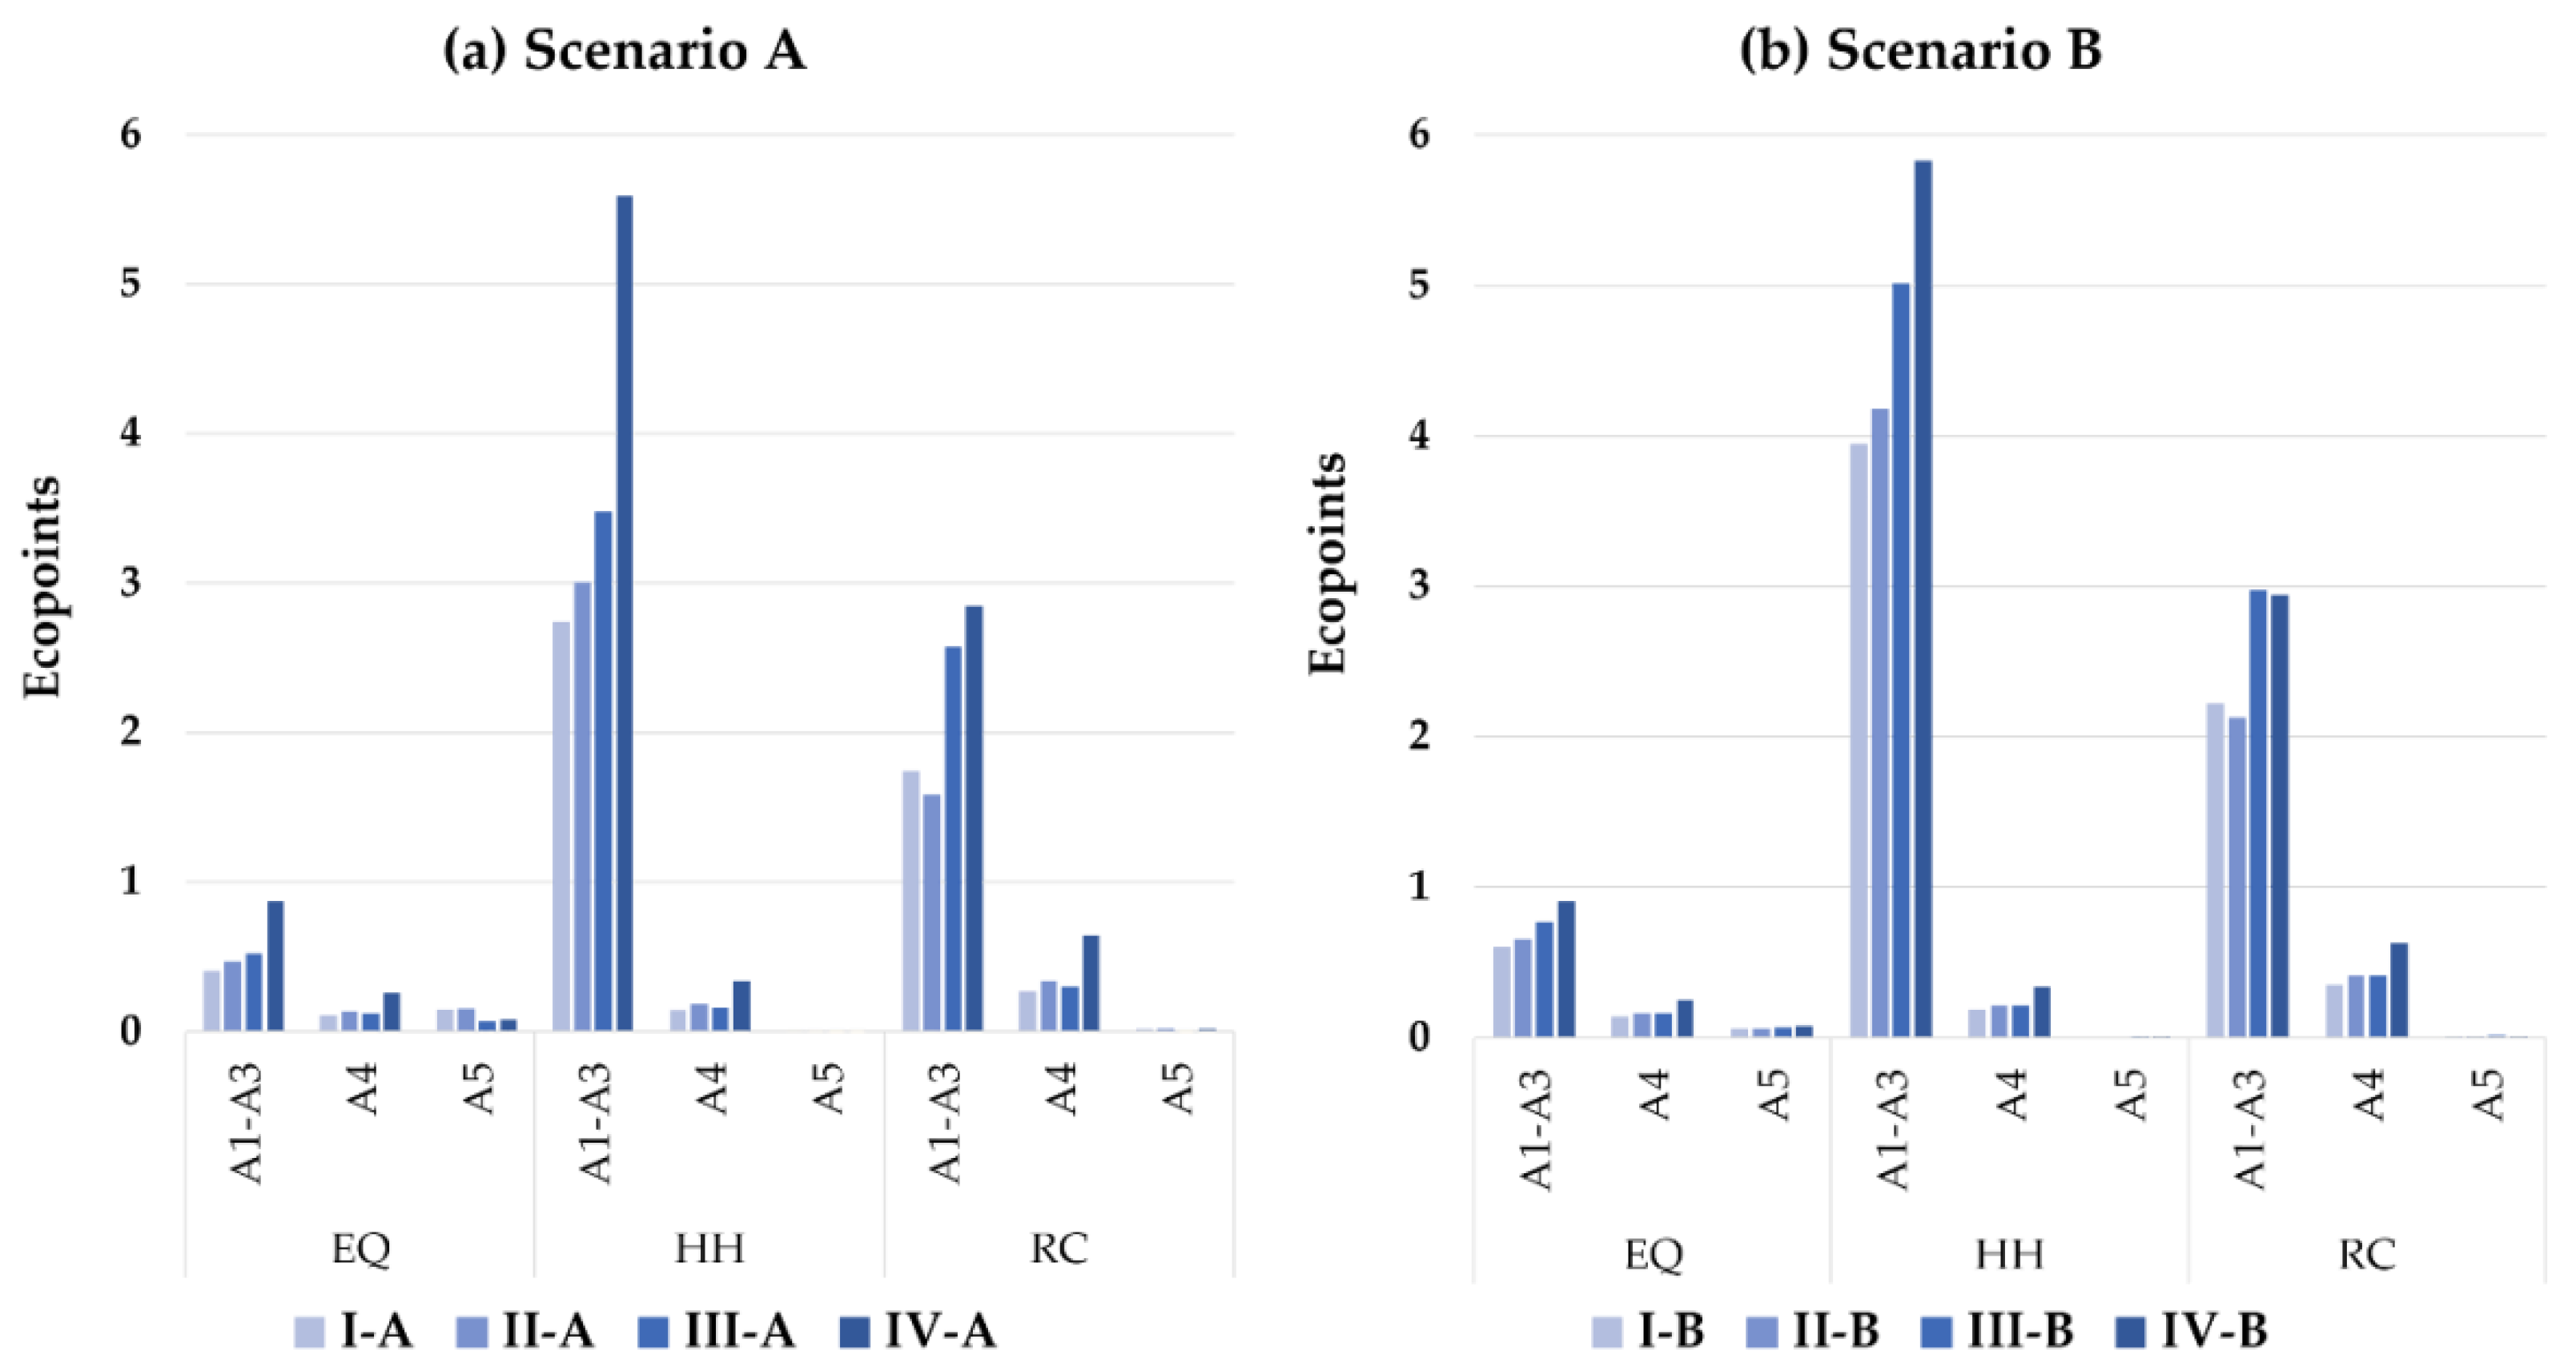
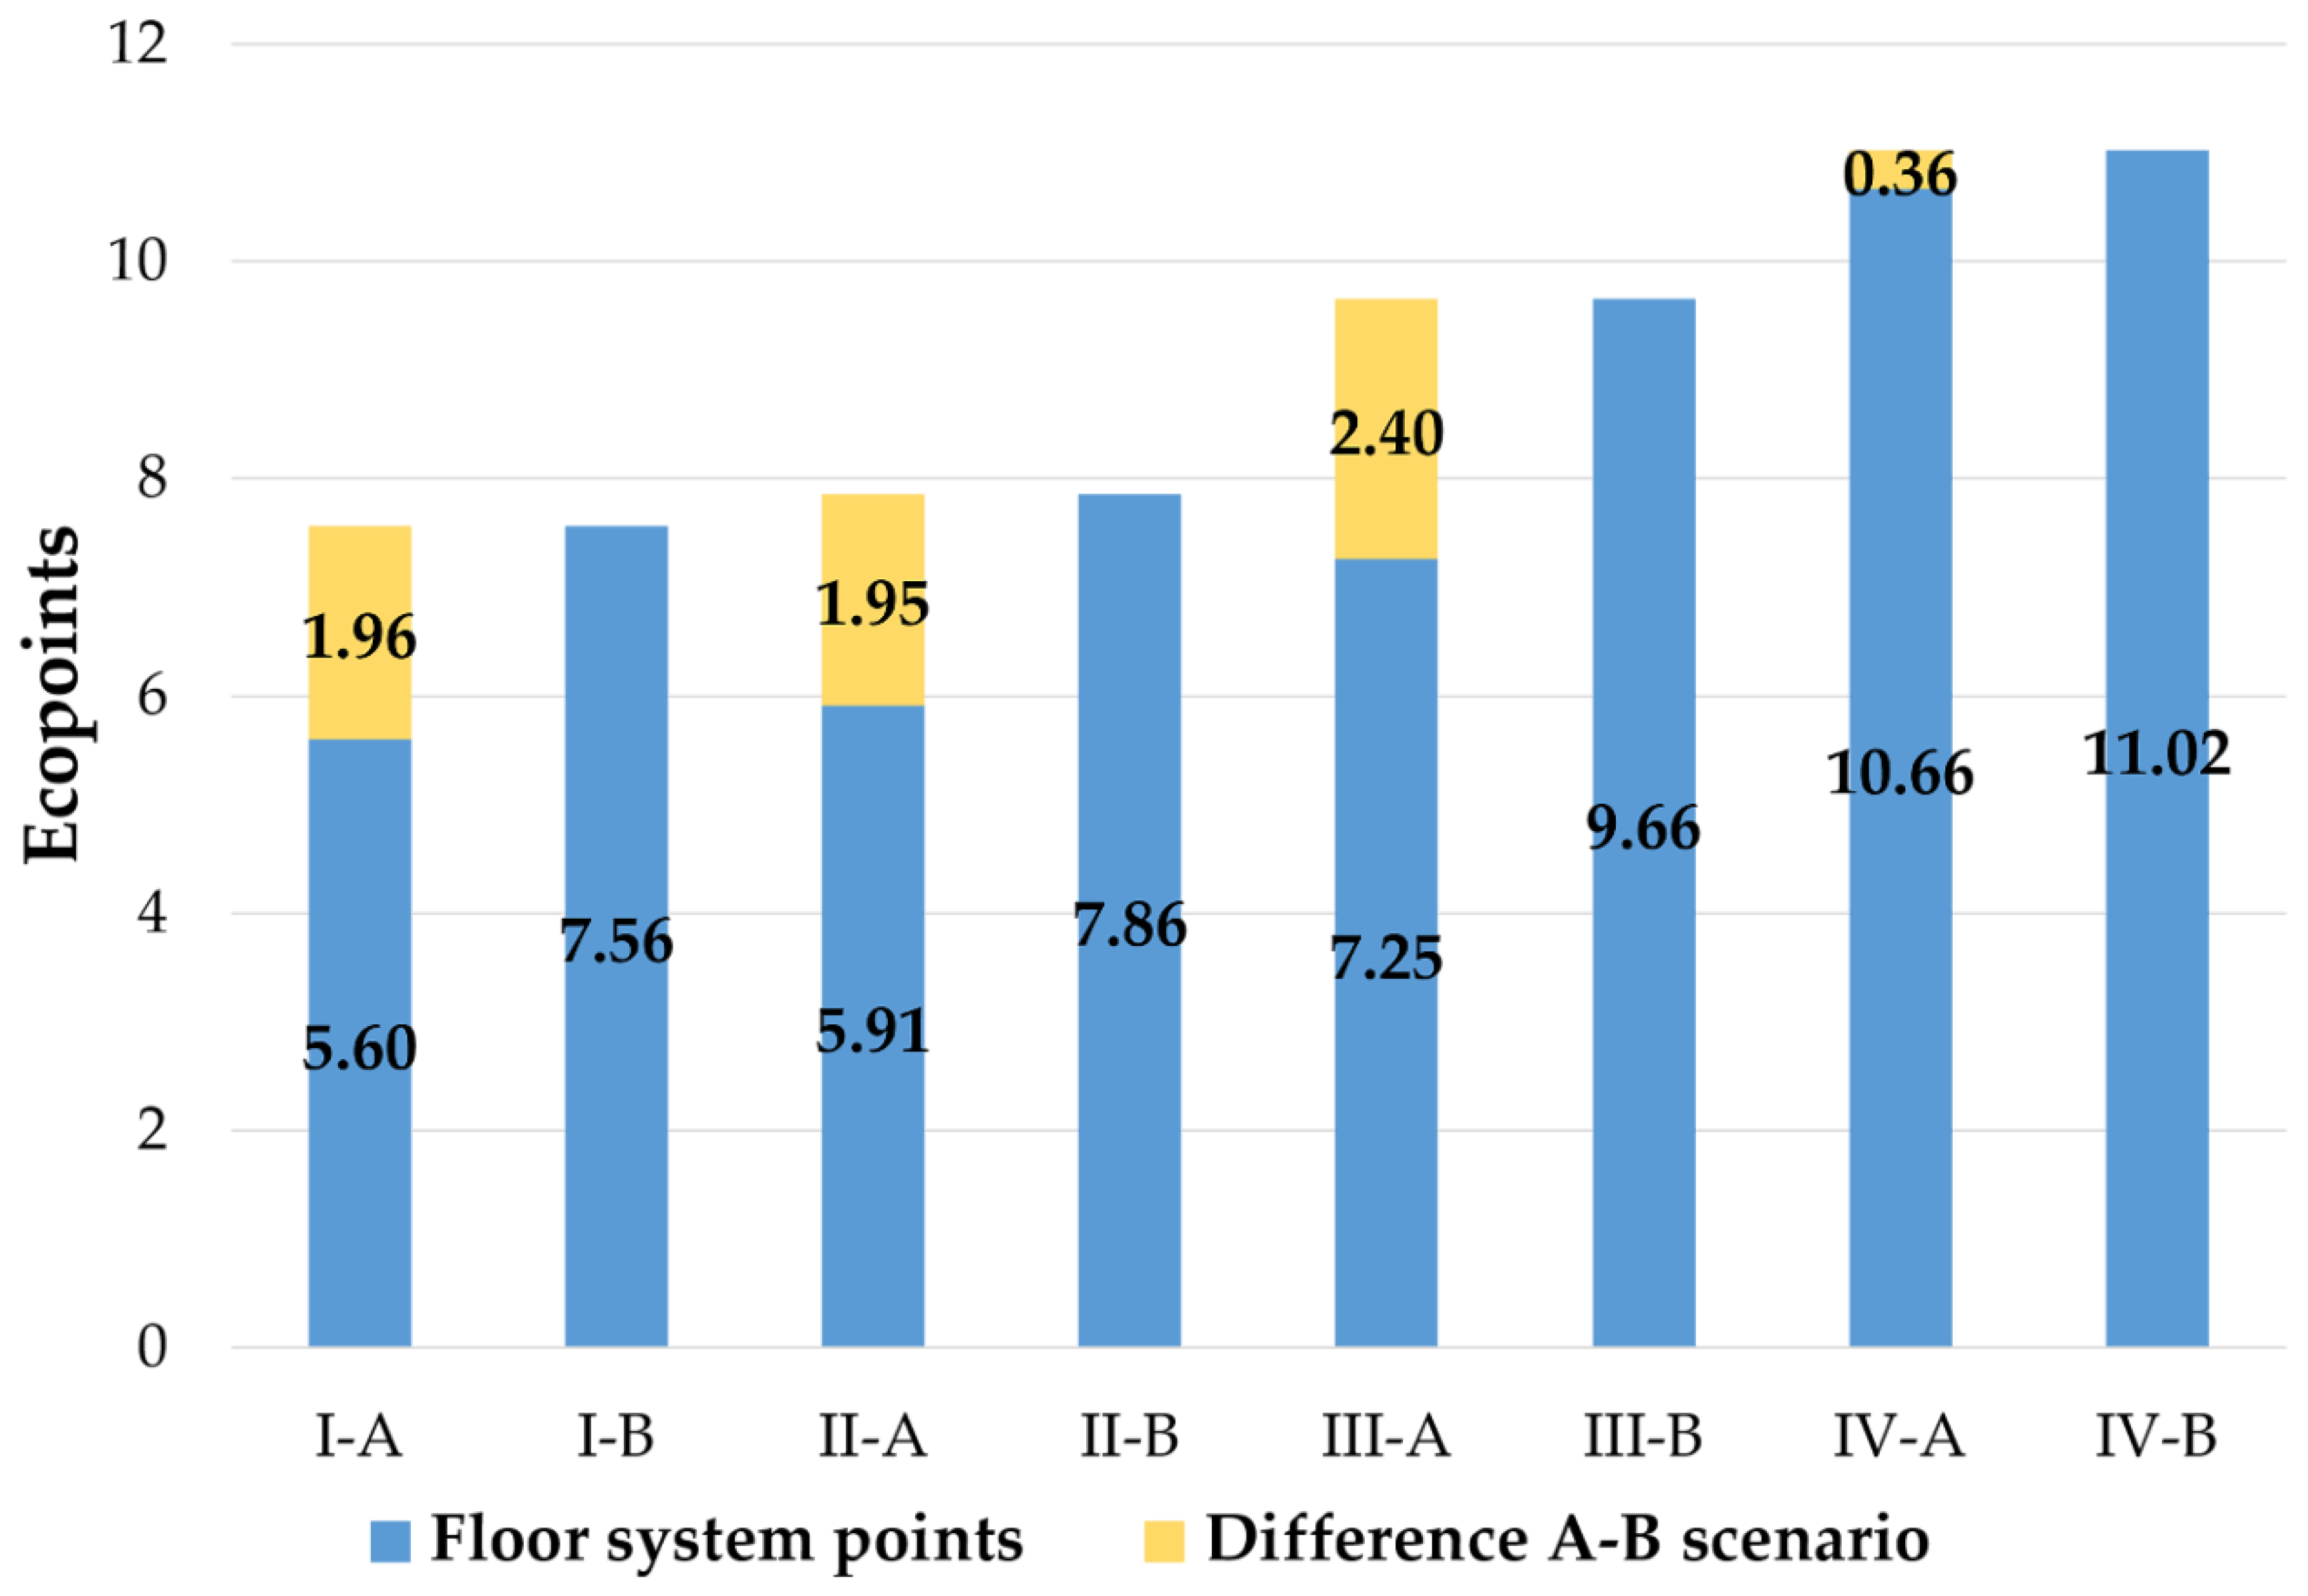
Figure 4 shows the results obtained by the Eco-indicator 99 method in the approach of “from cradle to handover”. In general, of all the systems analyzed, A1-A3 was the stage with most environmental impact. The greatest contribution came from the category HH, with 55% of the average score of the total eco-points, followed by RC with 34%. The category of EQ had the lowest effect, with 10% of the average.
Scenario A: In Figure 4a, it can be seen that the floor system that generated the greatest environmental effect in the scenario was IV-A, with a total of 10.66 eco-points; the floor system with the lowest impact (and therefore the most sustainable in terms of LCA in this comparison) was I-A, with a total of 5.60 eco-points.
Stages A1–A3: The greatest contribution to the environmental impact occurred in this stage, with floor system IV-A generating the most, a total of 9.31 eco-points. HH was the category with the biggest impact, in which IV-A continued generating the most effect, with 5.59 eco-points, while I-A generated the least, with 2.74 eco-points.
Stage A4: Transport of the materials to the building site was the most important stage after that of A1-A3. The category generating the most impact was RC, with fuel consumption being the principal factor. The floor system with the largest contribution was IV-A, with 0.64 eco-points, which doubled the eco-points generated by floor systems I-A (0.27 pts.), II-A (0.34 pts.) and III-A (0.31 pts.).
Stage A5: This building stage had its greatest contribution in category EQ, in which the floor systems generating the biggest effect were I-A and II-A, with 0.15 and 0.16 eco-points, respectively. The building process and the generation of residues from the system had the greatest effect.
“Comparison by each category scenario A: The category HH was the one that had more environmental damage, with the IV-A being the system with more eco-points (5.94 eco-points), followed by III-A with 3.65 eco-points, II-A with 3.20 eco-points, and, lastly, I-A with 2.90 eco-points. In the RC category, it can be seen that IV-A continued to have the bigger environmental impact with 3.51 eco-points, followed by III-A with 2.89 eco-points, I-A with 2.03 eco-points, and II-A with 1.95 eco-points. Lastly, in the EQ category the floor system IV-A gets 1.21 eco-points, followed by II-A with 0.77 eco-points, III-A with 0.71 eco-points and I-A with 0.67 eco-points.”
Scenario B: Figure 4b shows a strong similarity with the results obtained in Scenario A, with floor system IV-B being the least environmentally efficient, with a total of 11.02 eco-points, while the most sustainable scenario was I-B, with 7.56 eco-points.
Stage A1–A3: The floor system with the biggest contribution in this stage is IV-B, with 9.69 eco-points, followed by III-B with 8.76 eco-points; the floor systems with least environmental impact are I-B and II-B, with 6.78 and 6.97 eco-points. Category HH produces 59% more effect regarding the categories of EQ and RC. Floor system IV-B has the greatest impact in EQ (0.91 eco-points) and HH (5.83 eco-points) and system III-B has the greatest impact in RC (2.97 eco-points).
Stage A4: This stage shows minimal variations regarding Scenario A, with effect values remaining at similar levels where, despite being reduced, the greatest effect is from floor system IV-B with 1.22 eco-points, followed by III-B with 0.79, II-B with 0.79, and I-B with 0.69.
Stage A5: The environmental impact in this stage is still mainly generated in category EQ. In this scenario, the environmental impact of the floor systems was more balanced, with floor system IV-B continuing to generate the biggest impact with 0.08 eco-points, followed by III-B with 0.069 eco-points, II-B with 0.067, and I-B with 0.067.
Comparison by each category scenario B: The category HH was the one that had more environmental damage, with the IV-B the system with more eco-points (6.17 eco- points), followed by III-B with 5.24 eco- points, II-B con 4.41 eco- points and, at last, I-B with 4.14 eco- points. In the RC category, it can be seen that IV-B continues to have the bigger environmental impact with 3.60 eco-points, followed by III-B with 3.40 eco-points, I-B with 2.60 eco-points, and II-B with 2.56 eco-points. Lastly, in the EQ category, the floor system IV-B generates 1.25 eco-points, followed by III-B with 1.01 eco- points, II-B with 0.89 eco- points and I-B with 0.82 eco- points.
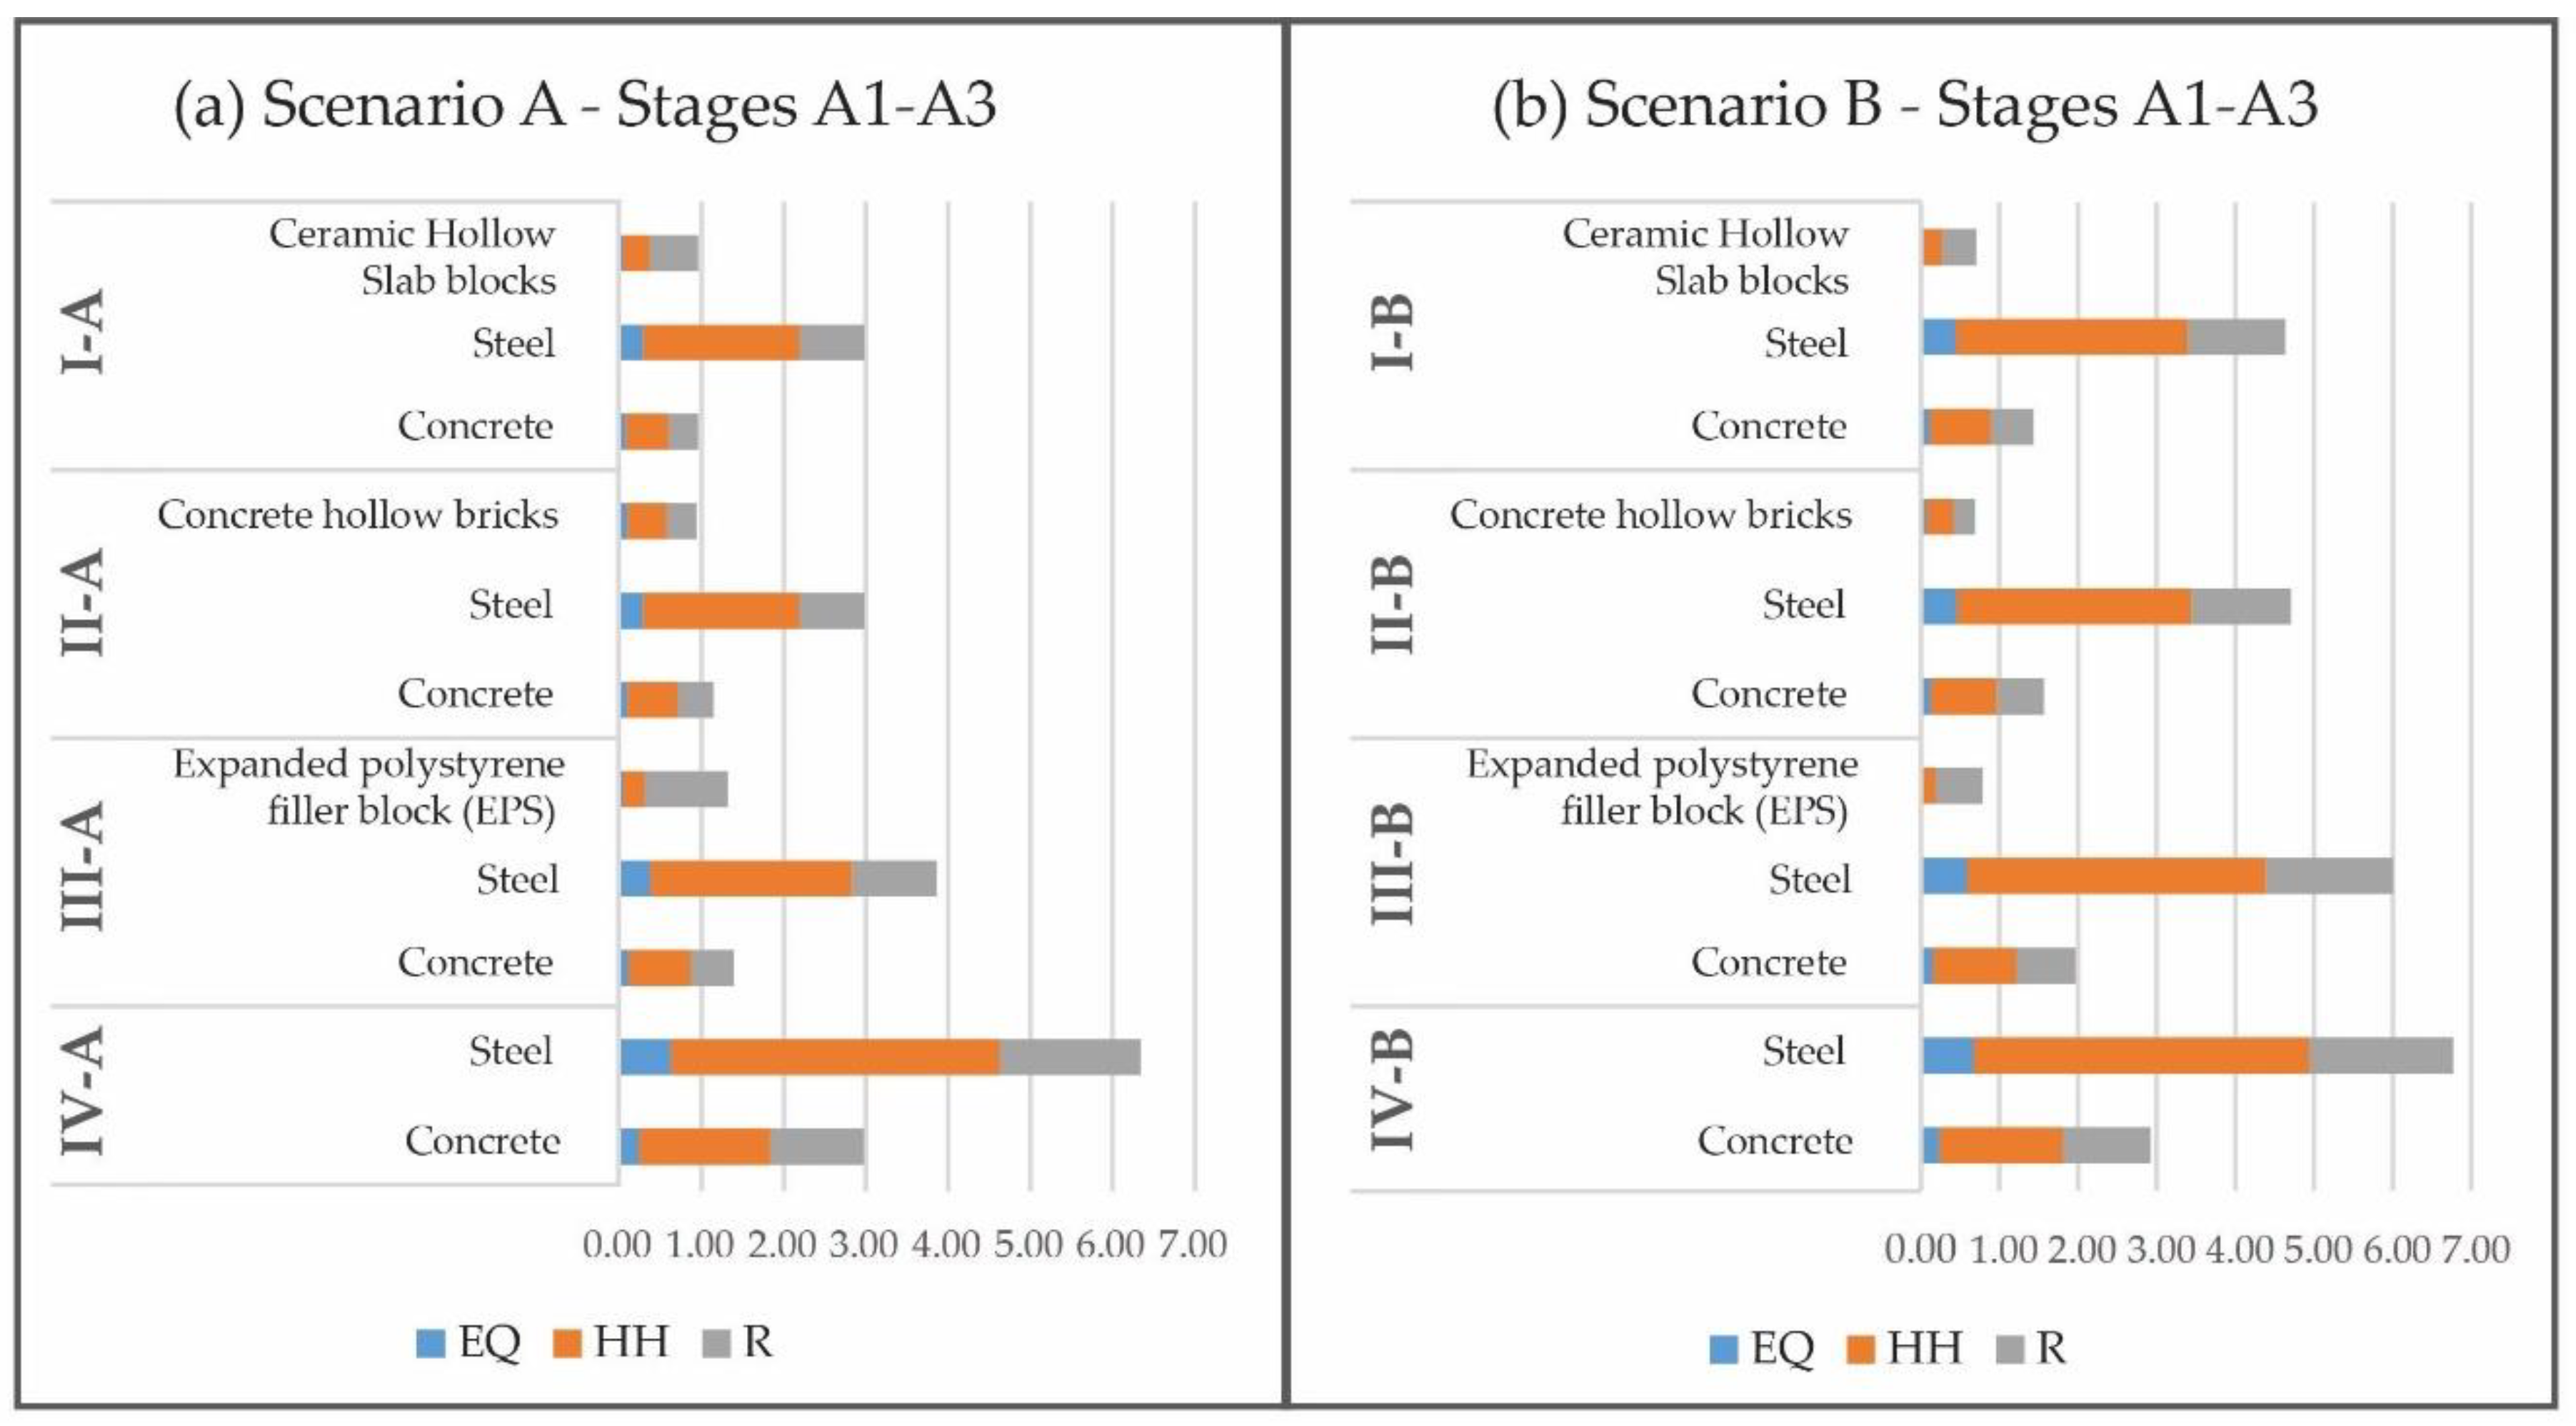
Analysis of the Stages A1–A3: Since stages A1–A3 obtained the highest score in the stages of the LC, an analysis of the contribution to the impact of the materials used in each construction system has been carried out (Figure 5), in order to identify the material with the higher environmental impact in each floor system. It was observed that steel is the material that generates a greater contribution to the environmental impact in all the systems and scenarios analyzed. In scenario A, in the floor system I-A, steel generated 2.98 eco-points of impact, while concrete and ceramic hollow slab blocks generated 0.959 and 0.956, respectively. In II-A, steel generated 2.98 eco-points, followed by concrete with 1.14 eco-points and concrete hollow bricks with 0.93 eco-points. In III-A, steel obtained 3.86 eco-points, followed by concrete and EPS with 1.39 and 1.31 eco-points, respectively. Finally, in IV-A, the steel generated 6.34 eco-points and the steel 2.97 eco-points.
In scenario B, in the floor system I-B, steel generated 4.63 eco-points of affectation, while concrete and ceramic hollow slab blocks generated 1.43 and 0.70, respectively. In II-B, steel generated 4.70 eco-points, followed by concrete with 1.57 eco-points and concrete hollow bricks with 0.69 eco-points. In III-B, steel obtained 6.00 eco-points, followed by concrete with 1.96 and EPS with 0.78 eco-points, respectively. Finally, in IV-B, the steel generated 6.76 eco-points and the steel 2.92 eco-points.
It can be seen when comparing the scenarios that in scenario B, the eco-points corresponding to steel and concrete increases, and this is due to the characterization of the functional unit and, therefore, the amount of this materials increased, decreasing the quantity of lightening elements used.
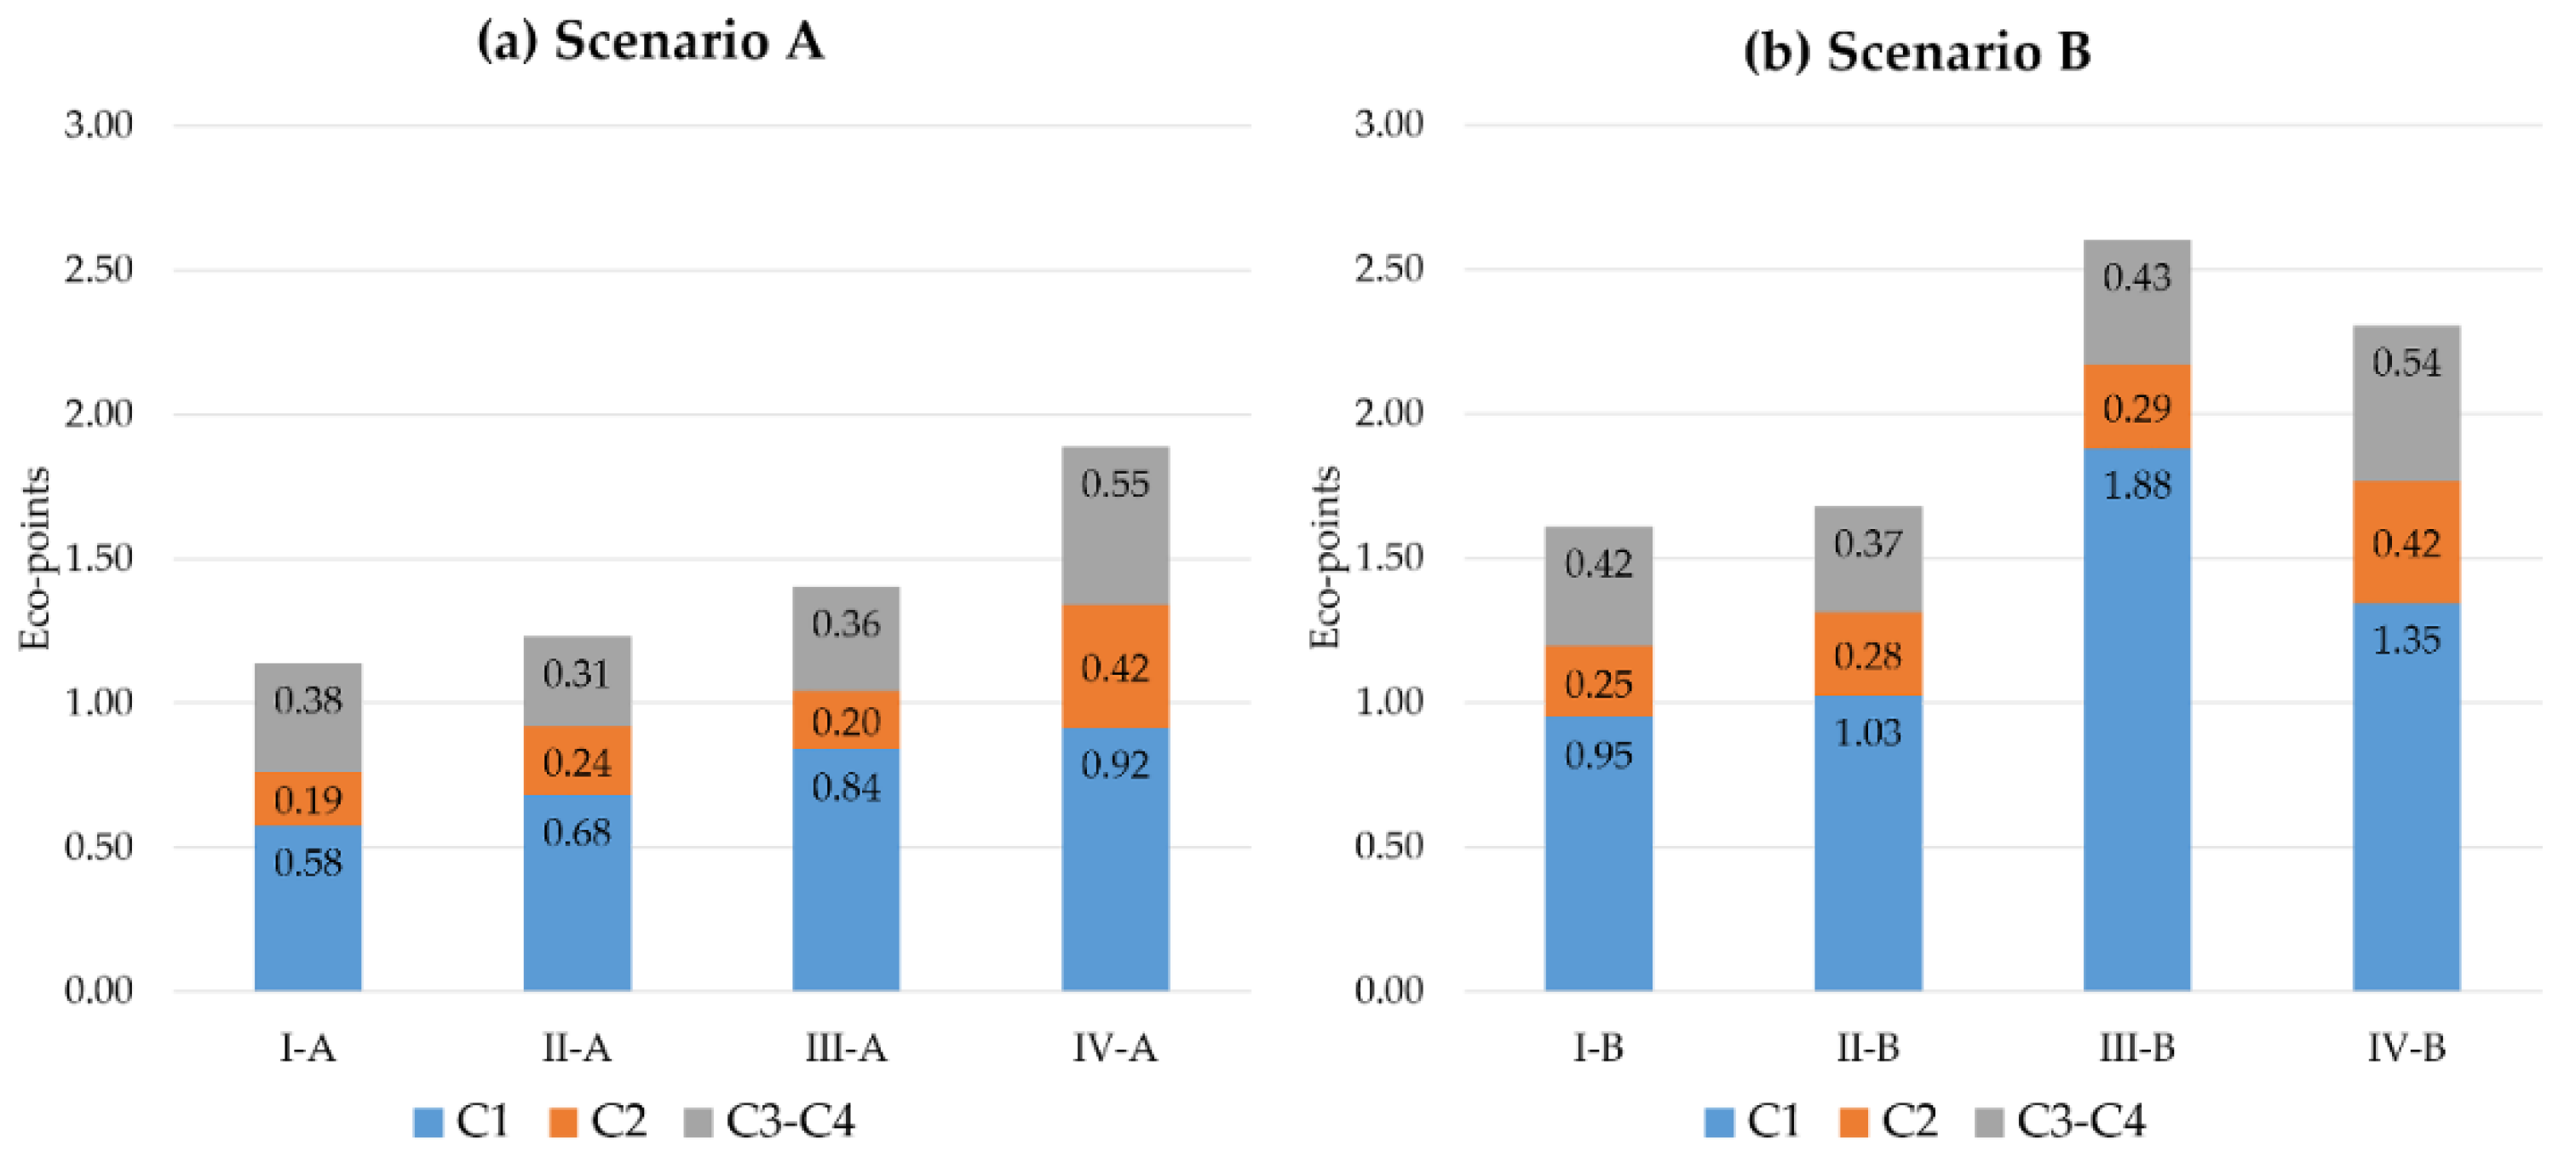
Figure 6 shows the results of the environmental impact in the Eco-indicator 99 methodology of the end-of-life stages, where it can be seen that the stage that generates the greatest impact is the Demolition stage (C1), followed by the stage of Waste Disposal (C3-C4).
Scenario A: The same trend that had been occurring in the “from cradle to handover” stages can be observed, where the floor system IV-A was the one that generated the greatest environmental impact, with a total of 1.89 eco-points. This was followed by III-A with 1.40 eco- points, II-B with 1.23 eco- points, and I-A with 1.14 eco- points.
Scenario B: In this scenario, the floor system III-B generates a greater environmental impact with 2.60 eco-points, followed by the floor system IV-B with 2.31 eco- points. The floor systems I-B and II-B had the lower environmental impact with 1.61 y 1.68 eco- points, respectively. The increase in the impact generated by III-B is mainly due to the stage C1, which indicates that it requires a greater amount of demolition work and, therefore, requires greater use of machinery. This is also directly related to the constitution of the percentages included in the functional unit (Figure 2), where it can be observed that a higher percentage of reinforcements is included.

3.1.2. Results of the CML 2001 Method

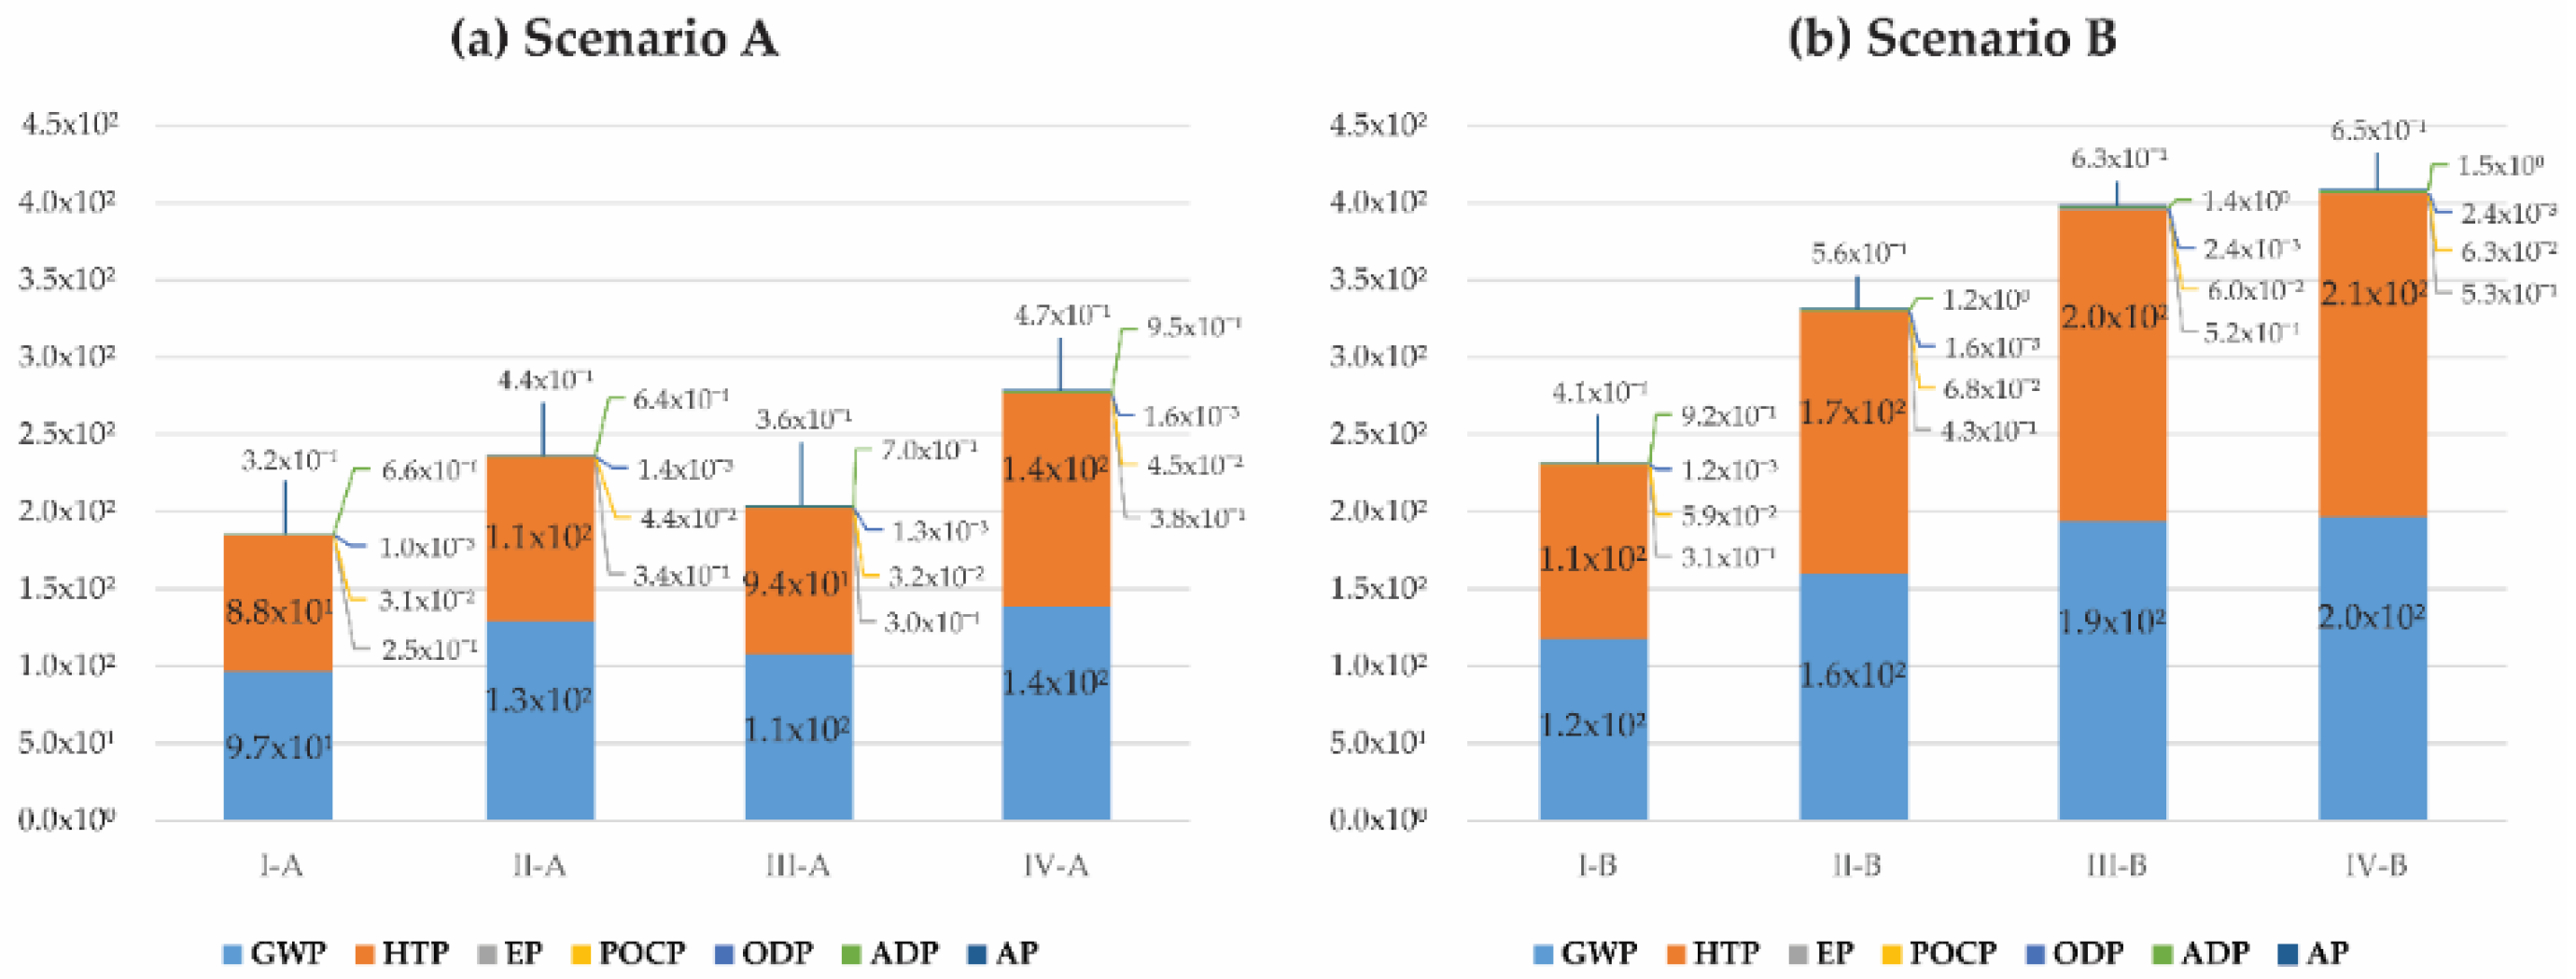
Figure 7 shows the environmental impact obtained from the CML 2001 evaluation method in the approach “from cradle to handover”. In order to visualize the effects generated by the different categories and to compare the proportional contribution in each indicator, the results are presented in stacked columns for each slab in both scenarios.
It can be seen in Scenario A that IV-A was the floor system generating more environmental impact and that in all the floor systems, the impact categories with the greater percentage were the GWP and HTP, while the impact categories AP, EP, POCP, ODP, and ADP had percentages that are barely visible on the graph. It can be observed that the indicator GWP was the one with the bigger contribution in all the floor systems in scenario A, representing the 51.91% in I-A, 54.64% in II-A, 53.19% in III-A, and 49.8% in IV-A; followed by the indicator HTP, representing 47.41% in I-A, 44.74% in II-A, 46.19% in III-A, and 49.5% in IV-A. In the category ADP, the floor system with a higher impact percentage is IV-A with 0.34%, while I-A has 0.35%, II-A has 0.27%, and III-A has 0.34%. In the category AP, the floor systems IV-A and II-A had the bigger impact, but represent 0.17% and 0.19%, respectively, from their total environmental impact generated, while in I-A, the impact represents 0.17% and in III-A 0.18% of their total impact. In the category EP, the floor system with higher impact was IV-A and the impact represented 0.14% regarding its total, followed by II-A with 0.14%, III-A with 0.15%, and I-A with 0.14%. In POCP, the percentage of impact generated within each floor system was 0.15% for III-A and 0.14% for I-A, II-A, and IV-A. Lastly, ODP had the smaller impact by percentage in the impact of each floor system, where it was 0.001% in all the systems (I-A, II-A, III-A, and IV-A).
In the scenario B, it can be observed that the indicator HTP was the one with the bigger contribution in the floor systems II-B, III-B, and IV-B, followed by the indicator of GWP (which has the biggest contribution in I-B), unlike the scenario A. It can be observed that the percentages of the category indicator AP, EP, POCP, ODP, and ADP continue being considerably smaller than the indicators of HTP and GWP. In the category HTP, the floor systems IV-B and II-B had similar percentages, with 51.17% and 51.23%, respectively; followed by III-B with 50.68% and I-B with 48.49%. The category GWP was second relative to percentage, except for the floor system I-B, which had the biggest contribution by 50.78% of its total, followed III-B with 48.65%, IV-B with 48.16%, and II-B with 48.09%. In the category ADP, the percentage from the total of the environmental impact was considerably smaller, representing 0.40% of I-B and 0.36% for II-B, III-B, and IV-B. In the category AP, the contribution in each floor systems represented 0.18% for I-B, 0.17 for II-B, and 0.16% for III-B and IV-B. In the category EP, the percentage in each of the floor systems represented 0.13% (I-B, II-B, III-B, and IV-B). In POCP, the percentage of impact generated within each floor system was 0.03% for I-B and 0.02% for II-B, III-B, and IV-B. Lastly, ODP had the smaller impact by percentage in the impact of each floor system where IV-B and III-B had 0.0006%, II-B and I-B had 0.0005%.
Table 8 shows the results of each category indicator mentioned in Figure 7. In both scenarios, the most important categories regarding quantity of emissions were GWP and HTP; floor system IV-A had the greatest effect in Scenario A, generating 138.81 kg CO2 eq and 138.10 kg 1.4-DB eq, respectively, while in Scenario B, floor system IV-B generated 196.96 kg CO2 eq and 209.26 kg 1.4-DB eq, respectively, followed very closely by floor system III-B with 193.77 kg CO2 eq and 201.87 kg 1.4-DB eq.
Studying the two scenarios, the floor systems in Scenario A showed the least impact compared with those in Scenario B. From the perspective of the CML 2001 method, the floor systems of Scenario A generated less environmental impact per impact category indicator than Scenario B, while floor systems I and II contributed least to the environmental impact in general.
In 
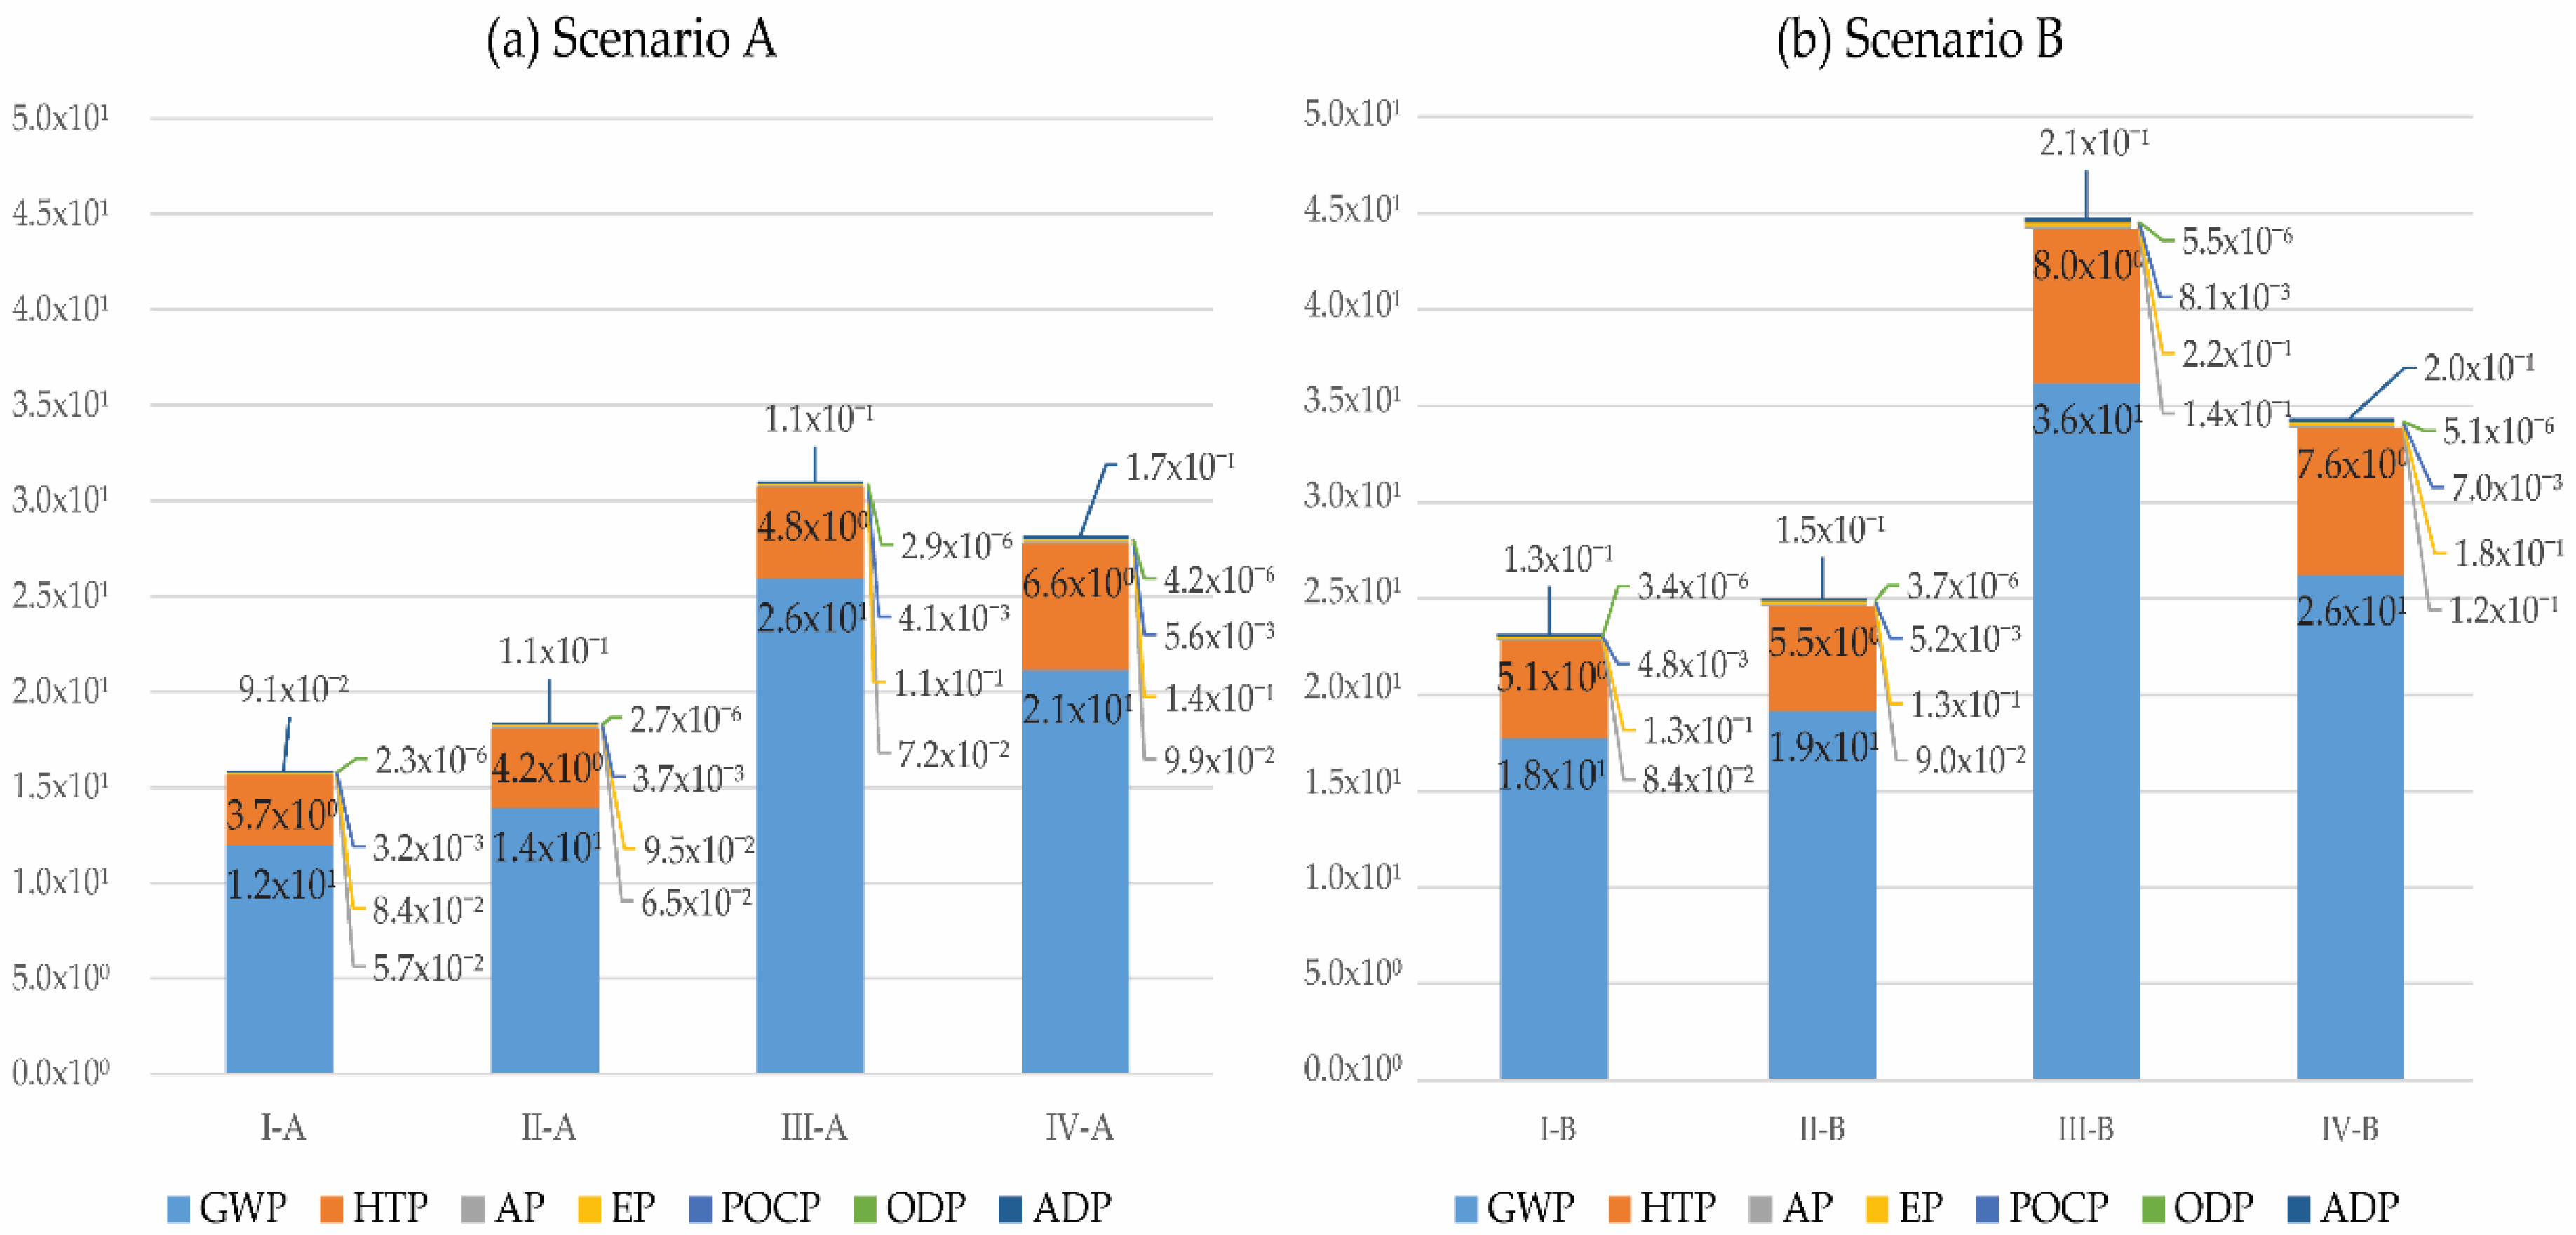
Figure 8, the environmental impacts for the “end-of-life” stages are quantified with the CML methodology, complemented with Table 9, which shows the results in the values of each indicator.
Scenario A: It can be observed that the indicator with higher contribution to the environmental impact was GWP, representing more than 75% of the total impact generated in all the floor systems. The category GWP represented 75.4% in the floor system I-A, 75.9% in the floor system II-A, 83.6% the floor system III-A, and 75% in the floor system IV-A. The category HTP was the next in relevance, where it represented 23.04% of the impact generated by the floor system I-A, 22.6% in the floor system II-A, 15.4% in the floor system III-A, and 23.4% in the floor system IV-A. The following categories represented a considerable decrease in the amount of emissions, where the category ADP in the floor system I-A represented 0.58%, II-A represented 0.59%, III-A represented 0.36%, and IV-A 0.6%. The category EP represented a percentage of 0.50% in the floor systems I-A, II-A, and IV-A, while III-A represented 0.35%. The category AP represented a percentage of 0.30% in the floor systems I-A, II-A, and IV-A, while III-A represented 0.23%. The categories of POCP and ODP had lower percentages than 0.02% in all floor systems.
Scenario B: It can be observed that the indicator with higher contribution to the environmental impact was still GWP, representing more than 75% of the total impact generated in all the floor system. The category GWP represented 76.5% in the floor system I-B, 76.6% in the floor system II-B, 80.82% in the floor system III-B, and 76.3% in the floor system IV-B. The category HTP was the next in relevance, where it represented 22% of the total impact generated by the floor system I-B, 21.8% in the floor system II-B, 17.8% in the floor system III-B, and 22.2% in the floor system IV-B. The following categories represented a considerable decrease in the amount of emissions, where the category ADP in the floor system I-B represented the 0.57%, II-B represented 0.58%, III-B represented 0.48%, and IV-B 0.58%. The category EP represented a percentage around 0.53% in the floor systems I-B, II-B, and IV-B, while III-B represented 0.49%. The category AP represented a percentage around 0.36% in the floor systems I-B, II-B, and IV-B, while III-B represented 0. 31%. The categories POCP and ODP had lower percentages than 0.02% in all the floor systems.
Finally, a proportional increase in the affectations of scenario B was observed. When comparing both scenarios, it was observed that the floor systems with the least contribution to the environmental impact at the end-of-life stages were I and II. It was also observed that in scenario A, the floor system with the greatest environmental impact was IV-A, while in scenario B, the floor system with the greatest impact was III-B

3.1.3. Sensitivity Analysis of Maintenance-Replacement stages (B2–B4)

As discussed in Section 2.6, the building maintenance regulations and manuals only establish, for stage B2, visual inspections of the structural element [78], which, in a utopian approach, would mean that the floor systems of the building would remain unchanged until the end of life. However, in order to know the variability of the environmental impact generated by specific situations that may arise in a building, where total or partial replacement needs might be required, a sensitivity analysis was carried out, incorporating percentage replacement scenarios in the analysis. These scenarios are proposed by including in the total environmental impact of the functional unit, a percentage relative to the environmental impact generated by the substitution scenario. The hypothesis proposed for the scenario considers: The need to replace a percentage of the functional unit, passing through the demolition of the element, handling and management of generated waste, and subsequent reconstruction. For this, the following percentages were established: Replacement of 25% of the functional unit, replacement of 50% of the functional unit, replacement of 75% of the functional unit, and replacement of 100% of the functional unit; compared to a base scenario where no substitution was generated (0%).
In Figure 9, can be seen that the inclusion of these scenarios generated a significant variation in the results, which is relative to the percentages considered. The replacement of constructive elements within a building for reasons other than deterioration is usually not establish within its initial conception. Therefore, it was observed that the selection of elements with less environmental impact would decrease the escalation in environmental loads related to these unforeseeable situations. The foregoing shows that a correct choice of materials, a tight realization or construction of the elements, and an adequate use of them can avoid, in the maintenance phase, the environmental impacts caused by the total or partial replacement of the element analyzed.

3.2. Discussion of the LCIA Results

Comparative analysis of the floor systems: The floor system with greatest environmental impact was IV, with a value of around 5 points more in scenario A than the points obtained by the systems I and II (5.06 and 4.75, respectively). This is because the quantities of materials needed in its construction, such as concrete and steel, are greater than in the other floor systems mentioned. In addition, the floor systems with lower impact (I and II) contain lightening elements, which reduce the use of these materials (although they increase the amount of wood formwork, making their effect in stage A5 greater than the other floor systems). The floor system with the second highest effect is III, which has a score very similar to that of IV. In this case, the system also contains a high amount of concrete and steel, as well as including the use of EPS as a lightening element. This means that its environmental impact is related to the production and consumption of this material of petrous origin [92]. The results obtained agree with the conclusions reached in similar research [93,94,95].
Comparative analysis of Scenarios A-B “from cradle to handover”: Comparing each floor system in the two scenarios, it can be seen that applying the floor system to a real case increases the environmental impact caused by the system. Figure 10 shows the differences in eco-points of the same floor system in the two scenarios. It is noticeable that, in floor systems I, II, and III, the generated environmental impact increased significantly, by 33–35%, while in floor system IV, the increase was lower, with a total increase of 3%.
The increase in score in Scenario B is due to the increase in the quantification and characterization of the materials used, as a larger amount of steel and concrete are used in constructing the special areas; this in turn leads to a proportional increase in the environmental impact generated. In the case of floor system IV, the lower percentile increase is because the use of these materials does not increase as much, as this floor type is made exclusively of concrete and steel. Additionally, the importance of the lightweight elements for the sustainability of the floor systems is evident, as it has been seen that decreasing the quantities of these materials (such as EPS panels, hollow ceramic, or cement bricks) and using more concrete and steel will generate greater impact (the difference between scenario A and B).
By analyzing the end-of-life stages, a perspective of the environmental repercussions derived from the demolition and disposal of waste in the construction can be obtained. In the results, it can be observed that the increase in Scenario B, related to Scenario A, is different for all the floor systems, showing the variability in the results that can be generated when different construction systems are combined in the analysis of a building. In the Eco-indicator 99 methodology, the floor system “I” had an increase of 29% from scenario A to B, the floor system “II” increased 27%, the floor system III presented the greatest difference in the result obtained between the two scenarios, obtaining an increase of 46%. Finally, the scenario IV had the lowest percentage of increase, this being 18%. Using the CML methodology, it can be seen that the highest impact is due to the contribution in greenhouse gas emissions—kg CO2 eq.

4. Conclusions

This study has made a comparison of the four most commonly used floor systems in the Spanish ambit, from two perspectives: Scenario A, which considers each system as a homogeneous element, and Scenario B, which considers the system applied in a real building conditioned by the different types of surfaces involved in the project. The results corroborate that the LCA method is a suitable tool for analyzing and comparing the environmental impact generated by the different building systems.
Consequently, the comparison of the floor system’s life cycle stages shows that those that generate most environmental impact are A1–A3, as the floor systems that use more concrete and steel have the greatest effect, due to their production process.
The development of Scenario A allows the floor system generating the least environmental impact to be identified from a theoretical perspective, considering that in reality the elements are not strictly homogeneous. The results led to the conclusion that the one-way floor systems (type I-A and II-A) generate the least impact, with the results being more sustainable as the homogeneity of the project increases. In this scenario, it can be seen that the reinforced concrete slab floor system generates the biggest impact; therefore, the floor systems with lightening elements are more sustainable from the LCA perspective.
The development of Scenario B allows for obtaining a more realistic approach in the results, because it is closer to the reality of the construction industry; however, these results are subject to the variations inherent to each construction project. In this scenario, the results showed that the differences in the environmental impact of the different floor systems were reduced as a consequence of mixing with other constructive systems. Therefore, the influence of the specific elements can be identified, with the conclusion being that the sustainability of construction systems depends on the specific and geometric characteristics of a building.
According to the results of the stages “from cradle to handover”, the floor systems with the best environmental results in terms of LCA are the one-way types I and II. The difference in the environmental impact of the functional unit on both is minimal (with values of 5.60 and 5.91 eco-points in Scenario A and 7.56 and 7.86 eco-points in Scenario B, respectively), and is related to the system of blocks and slabs used. In comparison with floor system III, the two-way waffle system, they generate between 18.49% and 23.88% less impact in Scenario A and from 21.70% to 18.61% less in Scenario B. When compared with floor system IV (reinforced concrete slab), the difference in the impact rises to a reduction of between 55% and 53% in the environmental impact generated in Scenario A and 31.38% to 28.67% in Scenario B. In the end-of-life stages, it can be seen that the demolition works and the waste management of the floor systems I and II continue to be those with the least environmental impact, with a difference from the floor system IV of 40% and 35% in Scenario A, and 30% and 27% in Scenario B, respectively.
The two-way floor system III had values of 7.25 and 9.66 eco-points in Scenarios A and B, the results being due to the quantities of concrete and steel required for the reinforced slabs used in its construction. However, it can be seen that the impact is from 10% to 30% lower than the reinforced concrete slab (type IV) due to the lightweight element (EPS panels). In the end-of-life stages, in Scenario A, it is observed that it generates less impact than IV-A by 26%, while in Scenario B, the environmental impact is greater than IV-B by 11% due to the work required to demolish the floor system.
Floor system IV, the reinforced concrete slab, obtained the highest impact of the eco-points for each scenario (10.66 and 11.02 eco-points). This represented a considerable difference regarding the other floor systems, 47% more than the floor system with the best environmental performance in Scenario A. Despite the results, this floor system is essential in buildings with difficult geometric areas. Therefore, as its use cannot be excluded, efforts must be made to find more sustainable solutions in order replace the process of obtaining raw materials, such as adding lightening agents that adapt to the geometric context or using the system as an auxiliary system in the building rather than as the main construction system.
In the results obtained from the present investigation, it is observed that the environmental impact relative to the end-of-life stages represents 15–21% of the total, if they are analyzed together with the stages “from cradle to handover”.
The importance of the analysis of the end-of-life stages in the construction sector has been evidenced in the development and implementation of rules and regulations regarding CDW. However, the uncertainty in the data and the hypotheses that must be stipulated for its calculation condition the results obtained. Being for a future prospective, these results may be affected by the development of new technologies or techniques for the recovery of materials, which could manage to reincorporate a greater percentage of CDWs in the production chain, which will potentially decrease the overall impact of the sector.
Currently, at European level, the recycling and reuse rates of materials vary between each country, where some have achieved percentages of up to 70% (such as Netherlands) [96]; others are far from this percentage. In the case of Spain, the percentage of revalorization of materials has reached 43% [97]. However, the use of recycled materials (such as those from concrete) have been practically used only as aggregates in asphalt or in road construction [96]. Furthermore, its use in the construction of structural elements is currently only in a “recommendations for its use” stage, mostly due to the lack of guarantees of its proper application that ensure the quality of the structural concrete [98]. The foregoing shows the need to carry out studies on the behavior of these recycled concretes as part of a structural system. In addition, in the proposal for future research using the LCA methodology, the inclusion of the analysis of different waste management, as well as the stages of module D—benefits and loads beyond the system (reused, recovery, and/or recycling), can enhance the interest in the inclusion of these aggregates in the constructive elements.
However, the realization of projections and waste management plans must prevail in all construction projects, following the hierarchy of: Prevention of waste generation, preparation for reuse-recycling, and other final recovery scenarios [96]; both in the development of the construction stage, and in the demolition of buildings, to achieve a potential reduction in the damage generated.
Finally, the comparison of the building elements carried out in this work allows the most efficient building system in terms of environmental impact to be identified, as well as generating useful information, which can be studied by construction industry professionals when making decisions about building design. Additionally, it contributes to the awareness of the environmental impact generated by the different systems, to extend the research to other construction systems, and analyze the implementation of measures that reduce the impact located at each stage analyzed.

Author Contributions

Methodology, Y.E.V.-B. and J.M.G.-S.; validation, F.L.-G. and M.C.G.-S; formal analysis, Y.E.V.-B. and J.M.G.-S.; investigation, J.M.G.S; resources, J.M.G.-S; data curation, Y.E.V.-B.; writing—original draft preparation, Y.E.V.-B. and J.M.G.-S.; writing—review and editing, F.L.-G. and M.C.G.-S.; visualization, Y.E.V.-B.; supervision, J.M.G.-S. All authors have read and agreed to the published version of the manuscript.

Funding

This research received no external funding.

Acknowledgments

The authors would like to thank CONACYT for its doctoral scholarship program, the Barcelona School of Building Construction-UPC and the Department of Architecture Technology-EPSEB-UPC.

Conflicts of Interest

The authors declare no conflict of interest.

References

  1. Comisión Europea. Oportunidades Para un Uso Más Eficiente de los Recursos en el Sector de la Construcción. Agenda; Comisión Europea: Brussels, Belgium, 2014; Volume 445, pp. 1–21. Available online: http://eur-lex.europa.eu/legal-content/ES/TXT/?uri=CELEX:52014DC0445 (accessed on 17 November 2017).
  2. Comisión Europea. Protocolo de Gestión de Residuos de Construcción y Demolición en la UE; Series 6914779; Comisión Europea: Brussels, Belgium; ECORYS: Rotterdam, The Netherlands, 2016; p. 61. [Google Scholar]
  3. Agencia de Residuos de Cataluña, PRECAT20. Programa General de Prevención y Gestión de Residuos y Recursos de Cataluña 2020. 2018. Available online: http://mediambient.gencat.cat/ca/05_ambits_dactuacio/empresa_i_produccio_sostenible/economia_verda/impuls_economia_verda/ (accessed on 6 June 2020).
  4. European Insulation Manufacturers Association. Environmental Assessment of Construction Works Alignment Required and Products on CEN/TC 350 Standards; EURIMA: Brussels, Belgium, 2012. [Google Scholar]
  5. Asociación Española de Normalización. UNE-EN 15643-1:2011 Sustainability of Construction Works—Sustainability Assessment of Buildings—Part. 1: General Framework, Spain. 2012. Available online: https://www.une.org/encuentra-tu-norma/busca-tu-norma/norma?c=N0046856 (accessed on 25 March 2020).
  6. Asociación Española de Normalización. UNE-EN 15643-2:2012 Sustainability of Construction Works—Assessment of Buildings—Part 2: Framework for the Assessment of Environmental Performance, Spain. 2012. Available online: https://www.une.org/encuentra-tu-norma/busca-tu-norma/norma?c=N0050350 (accessed on 25 March 2020).
  7. Asociación Española de Normalización. UNE-EN 15643-3:2012 Sustainability of Construction Works—Assessment of Buildings—Part. 3: Framework for the Assessment of Social Performance, Spain. 2012. Available online: https://www.une.org/encuentra-tu-norma/busca-tu-norma/norma/?c=N0050351 (accessed on 25 March 2020).
  8. Asociación Española de Normalización. UNE-EN 15643-4:2012 Sustainability of Construction Works—Assessment of Buildings—Part. 4: Framework for the Assessment of Economic Performance, Spain. 2012. Available online: https://www.une.org/encuentra-tu-norma/busca-tu-norma/norma?c=N0050352 (accessed on 25 March 2020).
  9. Asociación Española de Normalización. UNE-EN 15643-5:2012 Sustainability of Construction Works—Assessment of Buildings and Civil Engineering Works—Part 5: Framework on Specific Principles and Requirement for Civil Engineering Works, Spain. 2012. Available online: https://www.une.org/encuentra-tu-norma/busca-tu-norma/norma?c=N0060427 (accessed on 25 March 2020).
  10. Asociación Española de Normalización. UNE-EN 15978:2012 Sustainability of Construction Works—Assessment of Environmental Performance of Buildings—Calculation Method, Spain. 2012. Available online: https://www.une.org/encuentra-tu-norma/busca-tu-norma/norma/?c=N0049397 (accessed on 15 May 2020).
  11. Asociación Española de Normalización y Certificación. AENOR: Norma UNE-EN 15804:2012 Sostenibilidad en la Construcción. Declaraciones Ambientales de Producto. Reglas de Categoría de Producto Básicas para Productos de Construcción, Spain. 2014. Available online: www-aenor-es (accessed on 9 May 2018).
  12. Asociación Española de Normalización. UNE-CEN/TR 15941:2011 IN Sustainability of Construction Works—Environmental Product Declarations—Methodology for Selection and Use of Generic Data, Spain. 2011. Available online: https://www.une.org/encuentra-tu-norma/busca-tu-norma/norma?c=N0048025 (accessed on 15 May 2020).
  13. Asociación Española de Normalización. UNE-EN 15942:2013 Sustainability of Construction Works—Environmental Product Declarations—Communication Format Business-to-Business, Spain. 2013. Available online: https://www.une.org/encuentra-tu-norma/busca-tu-norma/norma?c=N0049432 (accessed on 15 May 2020).
  14. ISO. ISO 14044:2006, Environmental Management—Life Cycle Assessment—Requirements and Guidelines. 2006. Available online: https://www.iso.org/obp/ui/#iso:std:iso:14044:ed-1:v1:es (accessed on 27 February 2018).
  15. Broun, R.; Menzies, G.F. Life cycle energy and environmental analysis of partition wall systems in the UK. Procedia Eng. 2011, 21, 864–873. [Google Scholar] [CrossRef] [Green Version]
  16. Ferrández-García, A.; Ibáñez-Forés, V.; Bovea, M.D. Eco-efficiency analysis of the life cycle of interior partition walls: A comparison of alternative solutions. J. Clean. Prod. 2016, 112, 649–665. [Google Scholar] [CrossRef]
  17. Rebitzer, G.; Ekvall, T.; Frischknecht, R.; Hunkeler, D.; Norris, G.; Rydberg, T.; Schmidt, W.; Suh, S.; Weidema Bp And Pennington, D.W. Life Cycle Assessment: Framework, goal and scope definition, inventory analysis, and applications. Environ. Int. 2004, 30, 701–720. [Google Scholar] [CrossRef]
  18. Simpple. User Manual LCA Manager v. 1.3 (Manual de Usuario LCA Manager Versión 1.3.); Simpple: Tarragona, Spain, 2010; pp. 1–16. Available online: https://www.simpple.com/wp-content/uploads/2013/12/Manual_LCAm.pdf (accessed on 3 July 2020).
  19. Chau, C.K.; Leung, T.M.; Ng, W.Y. A review on life cycle assessment, life cycle energy assessment and life cycle carbon emissions assessment on buildings. Appl. Energy 2015, 143, 395–413. [Google Scholar] [CrossRef]
  20. Dossche, C.; Boel, V.; De Corte, W. Use of Life Cycle Assessments in the Construction Sector: Critical Review. Procedia Eng. 2017, 171, 302–311. [Google Scholar] [CrossRef]
  21. Singh, A.; Berghorn, G.; Joshi, S.; Syal, M.; Asce, M. Review of Life-Cycle Assessment Applications in Building Construction. J. Archit. Eng. 2011, 17, 15–23. [Google Scholar] [CrossRef]
  22. Zabalza Bribián, I.; Aranda Usón, A.; Scarpellini, S. Life cycle assessment in buildings: State-of-the-art and simplified LCA methodology as a complement for building certification. Build. Environ. 2009, 44, 2510–2520. [Google Scholar] [CrossRef]
  23. Koroneos, C.; Dompros, A. Environmental assessment of brick production in Greece. Build. Environ. 2007, 42, 2114–2123. [Google Scholar] [CrossRef]
  24. Esin, T. A study regarding the environmental impact analysis of the building materials production process (in Turkey). Build. Environ. 2007, 42, 3860–3871. [Google Scholar] [CrossRef]
  25. Pittau, F.; Krause, F.; Lumia, G.; Habert, G. Fast-growing bio-based materials as an opportunity for storing carbon in exterior walls. Build. Environ. 2018, 129, 117–129. [Google Scholar] [CrossRef]
  26. Sameer, H.; Bringezu, S. Life cycle input indicators of material resource use for enhancing sustainability assessment schemes of buildings. J. Build. Eng. 2019, 21, 230–242. [Google Scholar] [CrossRef]
  27. Asif, M.; Muneer, T.; Kelley, R. Life cycle assessment: A case study of a dwelling home in Scotland. Build. Environ. 2007, 42, 1391–1394. [Google Scholar] [CrossRef]
  28. Ximenes, F.A.; Grant, T. Quantifying the greenhouse benefits of the use of wood products in two popular house designs in Sydney, Australia. Int. J. Life Cycle Assess. 2013, 18, 891–908. [Google Scholar] [CrossRef]
  29. Sameer, H.; Weber, V.; Mostert, C.; Bringezu, S.; Fehling, E.; Wetzel, A. Environmental assessment of ultra-high-performance concrete using carbon, material, and water footprint. Materials 2019, 16, 851. [Google Scholar] [CrossRef] [PubMed] [Green Version]
  30. Jönsson, Å.; Tillman, A.-M.; Svensson, T. Life cycle assessment of flooring materials: Case study. Build. Environ. 1997, 32, 245–255. [Google Scholar] [CrossRef] [Green Version]
  31. Nebel, B.; Zimmer, B.; Wegener, G. Life cycle assessment of wood floor coverings: A representative study for the German flooring industry. Int. J. Life Cycle Assess. 2006, 11, 172–182. [Google Scholar] [CrossRef]
  32. Nicoletti, G.M.; Notarnicola, B.; Tassielli, G. Comparative Life Cycle Assessment of flooring materials: Ceramic versus marble tiles. J. Clean. Prod. 2002, 10, 283–296. [Google Scholar] [CrossRef]
  33. International Energy Agency. Evaluation of Embodied Energy and CO2eq for Building Construction (Annex 57). 2016. Available online: https://www.buildup.eu/en/practices/publications/iea-ebc-annex-57-overview-results-0. (accessed on 18 June 2019).
  34. Fay, R.; Treloar, G.; Iyer-Raniga, U. Life-cycle energy analysis of buildings: A case study. Build. Res. Inf. 2000, 28, 31–41. [Google Scholar] [CrossRef] [Green Version]
  35. Citherlet, S.; Defaux, T. Energy and environmental comparison of three variants of a family house during its whole life span. Build. Environ. 2007, 42, 591–598. [Google Scholar] [CrossRef]
  36. Muga, H.; Mukherjee, A.; Mihelcic, J. An Integrated Assessment of the Sustainability of Green and Built-up Roofs. J. Green Build. 2008, 3, 106–127. [Google Scholar] [CrossRef] [Green Version]
  37. Ortiz, O.; Bonnet, C.; Bruno, J.C.; Castells, F. Sustainability based on LCM of residential dwellings: A case study in Catalonia, Spain. Build. Environ. 2009, 44, 584–594. [Google Scholar] [CrossRef]
  38. Scheuer, C.; Keoleian, G.A.; Reppe, P. Life cycle energy and environmental performance of a new university building: Modeling challenges and design implications. Energy Build. 2003, 35, 1049–1064. [Google Scholar] [CrossRef]
  39. Kofoworola, O.F.; Gheewala, S.H. Life cycle energy assessment of a typical office building in Thailand. Energy Build. 2009, 41, 1076–1083. [Google Scholar] [CrossRef]
  40. Ortiz-Rodríguez, O.; Castells, F.; Sonnemann, G. Life cycle assessment of two dwellings: One in Spain, a developed country, and one in Colombia, a country under development. Sci. Total Environ. 2010, 408, 2435–2443. [Google Scholar] [CrossRef]
  41. Venkatarama Reddy, B.V.; Jagadish, K.S. Embodied energy of common and alternative building materials and technologies. Energy Build. 2003, 35, 129–137. [Google Scholar] [CrossRef]
  42. Utama, N.A.; McLellan, B.C.; Gheewala, S.H.; Ishihara, K.N. Embodied impact of traditional clay versus modern concrete houses in a tropical regime. Build. Environ. 2012, 57, 362–369. [Google Scholar] [CrossRef]
  43. Jang, M.; Hong, T.; Ji, C. Hybrid LCA model for assessing the embodied environmental impact of buildings in South Korea. Environ. Impact Assess. Rev. 2015, 50, 143–155. [Google Scholar] [CrossRef]
  44. Gámez-García, D.C.; Gómez-Soberón, J.M.; Corral-Higuera, R.; Saldaña-Márquez, H.; Gómez-Soberón, M.C.; Arredondo-Rea, S.P. A cradle to handover life cycle assessment of external walls: Choice of materials and prognosis of elements. Sustainability 2018, 10, 2748. [Google Scholar] [CrossRef] [Green Version]
  45. Zabalza Bribián, I.; Valero Capilla, A.; Aranda Usón, A. Life cycle assessment of building materials: Comparative analysis of energy and environmental impact and evaluation of the eco-efficiency improvement potential. Build. Environ. 2011, 46, 1133–1140. [Google Scholar] [CrossRef]
  46. Napolano, L.; Menna, C.; Asprone, D.; Prota, A.; Manfredi, G. Life cycle environmental impact of different replacement options for a typical old flat roof. Int. J. Life Cycle Assess. 2015, 20, 694–708. [Google Scholar] [CrossRef]
  47. Rodriguez, L.F. Various Structures: Floor Systems (Estructuras Varias: Forjados), 2nd ed.; Fundación Escuela de la Edificación/UNED Getafe, Ed.; Fundación Escuela de la Edificación: Madrid, Spain, 1986. [Google Scholar]
  48. McCormac, J.; Brown, R. Design of Reinforced Concrete: ACI 318-05 Code, 7th ed.; John Wiley & Sons Ltd.: San Francisco, CA, USA, 2001. [Google Scholar]
  49. Sprung, S.; Rechenberg, W.; Bachmann, G. Environmental compatibility of cement and concrete. Stud. Environ. Sci. 1994, 369–386. [Google Scholar] [CrossRef]
  50. Ding, T.; Xiao, J.; Tam, V.W.Y. A closed-loop life cycle assessment of recycled aggregate concrete utilization in China. Waste Manag. 2016, 56, 367–375. [Google Scholar] [CrossRef] [PubMed]
  51. Marinković, S.; Radonjanin, V.; Malešev, M.; Ignjatović, I. Comparative environmental assessment of natural and recycled aggregate concrete. Waste Manag. 2010, 30, 2255–2264. [Google Scholar] [CrossRef]
  52. Serres, N.; Braymand, S.; Feugeas, F. Environmental evaluation of concrete made from recycled concrete aggregate implementing life cycle assessment. J. Build. Eng. 2016, 5, 24–33. [Google Scholar] [CrossRef]
  53. Braga, A.M.; Silvestre, J.D.; de Brito, J. Compared environmental and economic impact from cradle to gate of concrete with natural and recycled coarse aggregates. J. Clean. Prod. 2017, 162, 529–543. [Google Scholar] [CrossRef]
  54. Tait, M.W.; Cheung, W.M. A comparative cradle-to-gate life cycle assessment of three concrete mix designs. Int. J. Life Cycle Assess. 2016, 21, 847–860. [Google Scholar] [CrossRef] [Green Version]
  55. Turk, J.; Cotic, Z.; Mladenovic, A.; Sajna, A. Environmental evaluation of green concretes versus conventional concrete by means of LCA. Waste Manag. 2015, 45, 194–205. [Google Scholar] [CrossRef]
  56. Goggins, J.; Keane, T.; Kelly, A. The assessment of embodied energy in typical reinforced concrete building structures in Ireland. Energy Build. 2010, 42, 735–744. [Google Scholar] [CrossRef] [Green Version]
  57. Eurostat. Glossary: Greenhouse Gas (GHG)-Statistics Explained. 2016. Available online: https://ec.europa.eu/eurostat/statistics-explained/index.php?title=Glossary:Greenhouse_gas_(GHG) (accessed on 22 April 2020).
  58. Fraile-Garcia, E.; Ferreiro-Cabello, J.; Martinez-Camara, E.; Jimenez-Macias, E. Adaptation of methodology to select structural alternatives of one-way slab in residential building to the guidelines of the European Committee for Standardization (CEN/TC 350). Environ. Impact Assess. Rev. 2015, 55, 144–155. [Google Scholar] [CrossRef]
  59. Fraile-Garcia, E.; Ferreiro-Cabello, J.; Martinez-Camara, E.; Jimenez-Macias, E. Optimization based on life cycle analysis for reinforced concrete structures with one-way slabs. Eng. Struct. 2016, 109, 126–138. [Google Scholar] [CrossRef]
  60. Ferreiro-Cabello, J.; Martinez-Camara, E.; Jimenez-Macias, E.; Fraile-Garcia, E. Repercussion the use phase in the life cycle assessment of structures in residential buildings using one-way slabs. J. Clean. Prod. 2017, 143, 191–199. [Google Scholar] [CrossRef]
  61. Ferreiro-Cabello, J.; Fraile-Garcia, E.; Martinez-Camara, E.; Perez-de-la-Parte, M. Sensitivity analysis of Life Cycle Assessment to select reinforced concrete structures with one-way slabs. Eng. Struct. 2017, 132, 586–596. [Google Scholar] [CrossRef]
  62. Pacheco, R.; Ordóñez, J.; Martínez, G. Energy efficient design of building: A review. Renew. Sust. Energy Rev. 2012, 16, 3559–3573. [Google Scholar] [CrossRef]
  63. Hauge, Å.L.; Thomsen, J.; Berker, T. User evaluations of energy efficient buildings: Literature review and further research. Adv. Build. Energy Res. 2011, 5, 109–127. [Google Scholar] [CrossRef]
  64. Sartori, I.; Hestnes, A.G. Energy use in the life cycle of conventional and low-energy buildings: A review article. Energy Build. 2007, 39, 249–257. [Google Scholar] [CrossRef]
  65. Cao, X.; Dai, X.; Liu, J. Building energy-consumption status worldwide and the state-of-the-art technologies for zero-energy buildings during the past decade. Energy Build. 2016, 128, 198–213. [Google Scholar] [CrossRef]
  66. Kylili, A.; Fokaides, P.A. European smart cities: The role of zero energy buildings. Sustain. Cities Soc. 2015, 15, 86–95. [Google Scholar] [CrossRef]
  67. Li, D.H.; Yang, L.; Lam, J.C. Zero energy buildings and sustainable development implications–A review. Energy 2013, 54, 1–10. [Google Scholar] [CrossRef]
  68. Ortega Rastrojo, M. Simulation Analysis for Comparison and Quantification of Residues of Various Types of Floor. Universitat Politècnica de Catalunya. 2013. Available online: http://www.recercat.cat/handle/2072/231126 (accessed on 25 November 2019).
  69. Ministerio de Vivienda, Instituto de Ciencias de la Construcción Eduardo Torroja, CSIC, Catálogo de elementos constructivos del CTE, España. 2008. Available online: https://www.codigotecnico.org/images/stories/pdf/aplicaciones/nCatalog_infoEConstr/CAT-EC-v06.3_marzo_10.pdf (accessed on 7 February 2018).
  70. Ministerio de Vivienda. Real Decreto 314/2006-Código Técnico de la Edificación; Ministerio de Vivienda: Lima, Peru, 2006; pp. 11816–11831. Available online: https://www.codigotecnico.org/ (accessed on 29 March 2006).
  71. Méndez Specia, J.E.; Gómez-Soberón, J.M. Comparative Analytical Study of Floor Types by Evaluating Life Cycle Analysis (Estudio Analítico Comparativo de Tipologías de Forjados Mediante la Evaluación de Análisis del Ciclo de Vida). Master’s Thesis, Universidad Politécnica de Cataluña, Barcelona, Spain, 2016. Available online: https://upcommons.upc.edu/handle/2117/88206 (accessed on 21 April 2016).
  72. Ministerio de Fomento. EHE-08 Structural Concrete Instruction (Instrucción de Hormigón Estructural). Spain. 2010. Available online: www.fomento.es (accessed on 6 June 2018).
  73. Pré Consultants. Eco-Indicator 99 Manual for Designers, Ministry of Housing, Spatial Planning and the Environment. 2000. Available online: http://www.pre-sustainability.com/download/manuals/EI99_Manual.pdf. (accessed on 6 June 2018).
  74. University of Leiden. Institute of Environmental Sciences (CML), CML 2001 Methodology. 2011. Available online: https://www.universiteitleiden.nl/en/science/environmental-sciences (accessed on 20 August 2019).
  75. Swiss Federal Offices, E.Z. Ecoinvent Database V3.1, V3.1. 2014. Available online: https://www.ecoinvent.org/database/database.html (accessed on 21 April 2018).
  76. Martínez-Rocamora, A.; Marrero, M.; Solís-Guzmán, J.; Marrero, M. LCA databases focused on construction materials: A review. Renew. Sust. Energy Rev. 2016, 58, 565–573. [Google Scholar] [CrossRef]
  77. Catalonia Institute of Construction Technology (Instituto de Tecnología de la Construcción de Cataluña) Database BEDEC—ITeC—ITEC. 2017. Available online: https://itec.es/banco-precios-bedec/ (accessed on 17 April 2018).
  78. CYPE Ingenieros. Software para Arquitectura, Ingeniería y Construcción. 2019. Available online: http://www.cype.es/cypeingenieros/ (accessed on 9 June 2020).
  79. Silvestre, J.D.; De Brito, J.; Pinheiro, M.D. Environmental impacts and benefits of the end-of-life of building materials—Calculation rules, results and contribution to a “cradle to cradle” life cycle. J. Clean. Prod. 2014, 66, 37–45. [Google Scholar] [CrossRef]
  80. Giorgi, S.; Lavagna, M.; Campioli, A. Life—Cycle Assessment of Building End of Life. 2018. Available online: https://re.public.polimi.it/retrieve/handle/11311/1093086/385568/Life%20Cycle%20Assessment%20of%20building%20end%20of%20life.pdf (accessed on 6 June 2020).
  81. Guardigli, L.; Monari, F.; Bragadin, M.A. Assessing environmental impact of green buildings through LCA methods: A comparison between reinforced concrete and wood structures in the European context. Procedia Eng. 2011, 21, 1199–1206. [Google Scholar] [CrossRef] [Green Version]
  82. Ministerio de Fomento de España. Inspection and Transport. Safety—Ground Transportation (Inspección y Seguridad en el Transporte—Transporte Terrestre). 2015. Available online: https://www.fomento.gob.es/MFOM/LANG_CASTELLANO/DIRECCIONES_GENERALES/TRANSPORTE_TERRESTRE/IGT/PESO/Pesos/vehiculos_motor/VM_2EJES.htm (accessed on 4 June 2018).
  83. AENOR. UNE-ISO/TR 12603 IN: Building Construction Machinery and Equipment—Classification. 2018. Available online: https://www.en.aenor.com/normas-y-libros/buscador-de-normas/une/?c=N0059842 (accessed on 6 August 2019).
  84. Dynapac Fayat Group. Dynapac Concrete Equipment. 2017. Available online: www.dynapac.com (accessed on 11 April 2019).
  85. Donaire, S.; Romero, R. Tower Crane Safety in Andalusia Construction Works. (Seguridad En Las Grúas Torre En Las Obras De Construcción De Andalucía); Universidad de Málaga, Ed.; Lumen Gráfica: Seville, Spain, 2008; ISBN 978-84-692-2001-6. [Google Scholar]
  86. Ministerio de Fomento de España. EHE-08 Instrucción de Hormigón Estructural—Capítulo xviii-Mantenimiento, Spain. 2007. Available online: https://www.mitma.gob.es/recursos_mfom/capituloxviiiborde1.pdf. (accessed on 15 June 2020).
  87. Ministerio de Medio Ambiente Español. II Plan. Nacional de Residuos de Construcción y Demolición. 2007. Available online: https://www.boe.es/buscar/doc.php?id=BOE-A-2001-13436 (accessed on 9 June 2020).
  88. Suárez Silgado, S.S. Propuesta Metodológica para Evaluar el Comportamiento Ambiental y Económico de los Residuos de Construcción y Demolición (RCD) en la Producción de Materiales Pétreos. Ph.D. Thesis, Universidad Politécnica Catalunya, Barcelona, Spain, 2015; p. 305. [Google Scholar]
  89. Ministerio de Medio Ambiente. Operaciones de Valoración y Eliminación de Residuos, Lista Europea de Residuos, MAM/304/2002. 2002. Available online: https://www.boe.es/eli/es/o/2002/02/08/mam304 (accessed on 9 June 2020).
  90. Gámez-García, D.C.; Saldaña-Márquez, H.; Gómez-Soberón, J.M.; Arredondo-Rea, S.P.; Gómez-Soberón, M.C.; Corral-Higuera, R. Environmental challenges in the residential sector: Life cycle assessment of Mexican social housing. Energies 2019, 12, 2837. [Google Scholar] [CrossRef] [Green Version]
  91. UK Government. Classify Different Types of Waste: Construction and Demolition Waste–GOV.UK. 2018. Available online: https://www.gov.uk/how-to-classify-different-types-of-waste/construction-and-demolition-waste (accessed on 9 June 2020).
  92. Fernandez-Ceniceros, J.; Fernandez-Martinez, R.; Fraile-Garcia, E.; Martinez-De-Pison, F.J. Decision support model for one-way floor slab design: A sustainable approach. Automat. Constr. 2013, 35, 460–470. [Google Scholar] [CrossRef]
  93. Dossche, C.; Boel, V.; De Corte, W. Comparative material-based life cycle analysis of structural beam-floor systems. J. Clean. Prod. 2018, 194, 327–341. [Google Scholar] [CrossRef]
  94. Ahmed, I.M.; Tsavdaridis, K.D. Life cycle assessment (LCA) and cost (LCC) studies of lightweight composite flooring systems. J. Build. Eng. 2018, 20, 624–633. [Google Scholar] [CrossRef]
  95. Trabucco, D.; Wood, A.; Vassart, O.; Popa, N. A Whole LCA of the Sustainable Aspects of Structural Systems in Tall Buildings. Int. J. High-Rise Build. 2016, 5, 71–86. [Google Scholar] [CrossRef] [Green Version]
  96. Gervasio, H.; Dimova, S. Model for Life Cycle Assessment (LCA) of buildings. Publ. Off. EU 2018. [Google Scholar] [CrossRef]
  97. Instituto de Estadística de Cataluña, Idescat. Indicadores de la Unión Europea. Available online: https://www.idescat.cat/indicadors/?id=ue&lang=es (accessed on 11 June 2018).
  98. Alaejos Gutierrez, P.; Sanchez de Juan, M. Hormigón reciclado estructural: Utilización de árido reciclado procedente de escombros de hormigón. Ing. Civ. 2015, 55–62. Available online: http://ingenieriacivil.cedex.es/index.php/ingenieria-civil/article/download/530/503/ (accessed on 5 June 2020).
Figure 1. Constructive detail of each floor system. Source: Authors, based on specifications in [71,72].
Sustainability 12 05442 g001
Figure 2. Percentages making up each square meter of floor system in Scenario B.
Sustainability 12 05442 g002
Figure 3. Flow diagram of the processes included in the life cycle inventory (LCI).
Sustainability 12 05442 g003
Figure 4. Results of the life cycle impact assessment (LCIA) regarding Eco-indicator 99 for each type of floor system: (a) Results in the scenario A; (b) results in the scenario B.
Sustainability 12 05442 g004
Figure 5. Analysis of the environmental impact generated by materials in stages A1-A3. (a) Results in the scenario A; (b) results in the scenario B.
Sustainability 12 05442 g005
Figure 6. Results of the LCIA for the stages C1-C4 regarding Eco-indicator 99 for each type of floor system: (a) Results in the scenario A; (b) results in the scenario B.
Sustainability 12 05442 g006
Figure 7. Environmental impact “from cradle to handover” obtained for the CML 2001 indicators: (a) Results in the scenario A; (b) results in the scenario B.
Sustainability 12 05442 g007
Figure 8. Results of the LCIA for the stages C1-C4 regarding CML methodology for each type of floor system: (a) Results in the scenario A; (b) results in the scenario B.
Sustainability 12 05442 g008
Figure 9. Results for the sensitivity analysis of the scenarios of replacement (Eco-indicator 99). (a) Results in the scenario A; (b) results in the scenario B.
Sustainability 12 05442 g009
Figure 10. Differences in scores for each type of floor system in the two scenarios “from cradle to handover” (Eco-indicator 99).
Sustainability 12 05442 g010
Table 1. Technical specifications and functionality properties of the floor systems under study [71].
Floor SystemsDescriptionThickness (cm)Properties
Self-Weight (kN/m²)Acoustic Isolation (dBA)Fire Resistance
TYPE IOne-way prestressed concrete joist with ceramic hollow slab blocks353.5554R180
TYPE IIOne-way precast lattice joist and concrete hollow bricks354.4054R180
TYPE IIITwo-way joist with cast in place concrete and expanded polystyrene filler block (EPS)353.6254R180
TYPE IVReinforced concrete slab358.2454R180
Table 2. Impact method and categories considered in the study.
Eco-Indicator 99CML 2001
Impact CategoryUnitImpact CategoryUnit
Ecosystem quality (EQ)PointsGlobal warming potential (GWP)kg CO2 eq.
Acidification and Eutrophication Acidification potential (AP)kg SO2 eq.
Eco-toxicity Eutrophication potential (EP)kg PO43− eq.
Land-use Photochemical oxidation (POCP)kg ethylene eq.
Human health damages (HH)PointsOzone layer depletion (ODP)kg CFC-11 eq.
Carcinogenic effects on humans Human toxicity (HTP)kg 1.4-DCB eq.
Climate change Abiotic depletion (ADP)kg Sb eq.
Ionizing radiation
Ozone layer depletion
Respiratory effects on humans
Resources (RC)Points
Fossil fuels
Mineral extraction
Table 3. Inventory of materials for 1 m² of each floor system analyzed.
LCFLOWUI-AI-BII-AII-BIII-AIII-BIV-AIV-BECOINVENT PROCESS
A1–A3Concretem30.110.170.140.190.160.230.350.34Concrete production normal/RER
Steel corrugated barskg15.0024.6015.0025.0020.0032.4035.0037.40Reinforcing steel production/RER
Welded meshkg2.201.662.201.662.071.41 Steel, converter, unalloyed/RER
Ceramic hollow slab blockskg81.4060.24------Brick production/RER
Concrete hollow slab brickskg--129.5095.83----Concrete block production/RER
EPS filler blockkg----3.442.06--Polystyrene foam slab production/RER
Annealed wirekg------0.420.38Steel, converter, unalloyed/RER
A4Lorry 28ttkm38.1150.9048.4258.5043.5561.5991.0489.78Transport, freight, lorry 16–32 metric ton, EURO6/RER
A5Woodm37.2 × 10−033.1 × 10−037.4 × 10−033.1 × 10−033.1 × 10−033.3 × 10−033.9 × 10−033.9 × 10−03Sawn wood, board, softwood, raw, air dried/RER
Tower cranehr.3.88 × 10−035.26 × 10−034.95 × 10−036.04 × 10−034.48 × 10−036.27 × 10−035.863 × 10−046.11 × 10−04machine operation, diesel, >= 18.64 kW and < 74.57 kW, steady-state /GLO
Concrete vibratorhr.0.00480.00780.0060.00880.00820.01160.01750.0172machine operation, diesel, < 18.64 kW, steady-state/GLO
Concrete pumpHr.1.41 × 10−032.31 × 10−031.84 × 10−032.63 × 10−032.44 × 10−033.46 × 10−035.22 × 10−035.13 × 10−03machine operation, diesel, >= 18.64 kW and < 74.57 kW, steady-state/GLO
Table 4. Distances considered for transport of machinery [45,81].
Transportation Distances
FactoryRound Trip (km)
Concrete Factories in Barcelona100
Steel factories in Barcelona100
Precast concrete factories300
Ceramic factories100
EPS factories140
Table 5. Inventory of machine use per square meter of floor system for the demolition stage.
DatasetUnitI-AII-AIII-AIV-AI-BII-BIII-BIV-B
Machine operation diesel, <18.64 kW, steady-state/GLOhour1.451.722.122.312.392.594.743.39
Table 6. Inventory of construction and demolition waste (CDW)-transport of floor system to final disposal.
Floor SystemDatasetDistance (km)Weight (ton)Transport (tkm)
I-Atransport, freight, lorry 3.5–7.5 metric ton, EURO615.000.324.87
II-Atransport, freight, lorry 3.5–7.5 metric ton, EURO615.000.426.25
III-Atransport, freight, lorry 3.5–7.5 metric ton, EURO615.000.355.30
IV-Atransport, freight, lorry 3.5–7.5 metric ton, EURO615.000.7411.03
I-Btransport, freight, lorry 3.5–7.5 metric ton, EURO615.000.426.37
II-Btransport, freight, lorry 3.5–7.5 metric ton, EURO615.000.497.39
III-Btransport, freight, lorry 3.5–7.5 metric ton, EURO615.000.507.50
IV-Btransport, freight, lorry 3.5–7.5 metric ton, EURO615.000.7310.89
Table 7. Inventory and classification of CDW of floor system for the end-of-life stage [78,89,91].
Floor SystemMaterialCodeWaste StatusQuantityUnit
I-AConcrete (concrete, mortar and prefabricated)17 01 01Non-hazardous226kg
Iron and steel17 04 05Non-hazardous17.2kg
Tiles and ceramics17 01 03Non-hazardous81.4kg
II-AConcrete (concrete, mortar and prefabricated)17 01 01Non-hazardous399.5kg
Iron and steel17 04 05Non-hazardous17.2kg
III-AConcrete (concrete, mortar and prefabricated)17 01 01Non-hazardous328kg
Iron and steel17 04 05Non-hazardous22.07kg
Other insulation materials17 06 04Non-hazardous3.44kg
IV-AConcrete (concrete, mortar and prefabricated)17 01 01Non-hazardous700kg
Iron and steel17 04 05Non-hazardous35.42kg
I-BConcrete (concrete, mortar and prefabricated)17 01 01Non-hazardous338kg
Iron and steel17 04 05Non-hazardous26.258kg
Tiles and ceramics17 01 03Non-hazardous60.24kg
II-BConcrete (concrete, mortar and prefabricated)17 01 01Non-hazardous465.83kg
Iron and steel17 04 05Non-hazardous26.66kg
III-BConcrete (concrete, mortar and prefabricated)17 01 01Non-hazardous464kg
Iron and steel17 04 05Non-hazardous33.81kg
Other insulation materials17 06 04Non-hazardous2.06kg
IV-BConcrete (concrete, mortar and prefabricated)17 01 01Non-hazardous688kg
Iron and steel17 04 05Non-hazardous37.78kg
Table 8. Results of the categories indicators for each floor system with the CML 2001 method “from cradle to handover”.
Floor SystemGWPAPEPPOCPODPHTPADP
kg CO2 eq.kg SO2 eq.kg PO4 eq.kg C2H4 eq.kg CFC-11 eq.kg 1.4-DB eq.kg Sb eq.
I-A9.66 × 1013.16 × 10−12.51 × 10−13.13 × 10−21.01 × 10−38.82 × 1016.59 × 10−1
II-A1.29 × 1024.39 × 10−13.43 × 10−14.43 × 10−21.36 × 10−31.06 × 1026.39 × 10−1
III-A1.08 × 1023.57 × 10−12.97 × 10−13.18 × 10−21.29 × 10−39.41 × 1016.99 × 10−1
IV-A1.39 × 1024.74 × 10−13.79 × 10−14.52 × 10−21.56 × 10−31.38 × 1029.47 × 10−1
I-B1.18 × 1024.12 × 10−13.07 × 10−15.93 × 10−21.16 × 10−31.13 × 1029.20 × 10−1
II-B1.60 × 1025.62 × 10−14.26 × 10−16.80 × 10−21.56 × 10−31.70 × 1021.20 × 100
III-B1.94 × 1026.35 × 10−15.16 × 10−16.00 × 10−22.42 × 10−32.02 × 1021.45 × 100
IV-B1.97 × 1026.55 × 10−15.26 × 10−16.30 × 10−22.39 × 10−32.09 × 1021.46 × 100
Table 9. Results for the stages C1-C4 of the categories indicators for each floor system with the CML 2001 method.
Floor SystemGWPAPEPPOCPODPHTPADP
kg CO2 eq.kg SO2 eq.kg PO4 eq.kg C2H4 eq.kg CFC-11 eq.kg 1.4-DB eq.kg Sb eq.
I-A1.2 × 1013.7 × 1005.7 × 10−28.4 × 10−23.2 × 10−32.3 × 10−69.1 × 10−2
II-A1.4 × 1014.2 × 1006.5 × 10−29.5 × 10−23.7 × 10−32.7 × 10−61.1 × 10−1
III-A2.6 × 1014.8 × 1007.2 × 10−21.1 × 10−14.1 × 10−32.9 × 10−61.1 × 10−1
IV-A2.1 × 1016.6 × 1009.9 × 10−21.4 × 10−15.6 × 10−34.2 × 10−61.7 × 10−1
I-B1.8 × 1015.1 × 1008.4 × 10−21.3 × 10−14.8 × 10−33.4 × 10−61.3 × 10−1
II-B1.9 × 1015.5 × 1009.0 × 10−21.3 × 10−15.2 × 10−33.7 × 10−61.5 × 10−1
III-B3.6 × 1018.0 × 1001.4 × 10−12.2 × 10−18.1 × 10−35.5 × 10−62.1 × 10−1
IV-B2.6 × 1017.6 × 1001.2 × 10−11.8 × 10−17.0 × 10−35.1 × 10−62.0 × 10−1

