1. Introduction
To satisfy the enormous energy demands, many high gravity dams are being or will be built in China [
1,
2]. The stability of a dam foundation is one of the crucial factors affecting its normal operation [
3,
4]. Once the dam foundation suffers destruction, it will cause enormous losses. Therefore, foundation stability analysis is essential, which forms an important part of the safety assessment for gravity dams.
Three approaches are commonly executed for the mechanical and deformation analyses of dam foundations: the limit equilibrium method, geomechanical model method and numerical method [
5,
6]. The computational process of the limit equilibrium method is simple and clear, and it provides a simple stability index in the form of the safety factor [
7,
8,
9]. Nevertheless, ignoring the deformation compatibility conditions and stress–strain relation [
10], it only considers the equilibrium conditions of the system under analysis by regarding the rock masses as a rigid body. The assumptions and simplifications may not be sufficient for representing the real situations in complex geological conditions. In order to investigate the deformation characteristics of rock masses and intuitively reflect failure scenarios, the geomechanical model method is implemented in stability analyses [
11,
12,
13,
14]. Based on similarity theory, the geomechanical model method can represent the spatial relationships of geological structures. Considering the complexity and high cost involved in implementing the geomechanical model, the numerical method [
15,
16,
17] is becoming popular and is widely utilized with the rapid development of high-performance computers. The advantages of using the numerical method lie in its flexibility to model complex geometries and geologic conditions, and its ability to simulate a variety of material behaviors and incorporate the influence of construction procedures. The advantages of both the geomechanical model method and numerical method can be synthesized for effective utilization. Consequently, complex engineering technical problems can be comprehensively analyzed and verified from different perspectives.
Determining the failure mechanisms of gravity dams is crucial in stability analysis and reinforcement measure selection [
2]. For different failure mechanisms, the stability analysis methods are not exactly the same, so we first need to determine the specific failure mechanism. At present, the failure mechanisms of dam foundations include shallow shear sliding along the base interface between the concrete dam body and rock masses, and deep shear sliding through the rock masses [
4,
18,
19]. Shallow sliding mainly occurs under conditions in which the strength of the rock masses is much larger than that of the concrete dam body, and in which the rock masses are relatively complete with no massively weak structural planes developing in it. In this case, the shear strength of the base interface is an important index to control the design of the gravity dam [
20,
21]. In comparison with shallow sliding, deep sliding, which arouses popular attention, is more complicated because of the difficulty of assessing rock mass structures and the complexity of determining their shear parameters [
4]. Even so, scholars have conducted substantial research on the failure mechanisms of many large-scale dams [
18,
22,
23].
Great progress has been made in the study of the failure mechanisms of gravity dams. However, a type of geological structure, whose effects on dam stability are not emphasized, has always been neglected. This type of geological structure is characterized by a combination of gentle through-going and steep structural discontinuities. The former is always constituted by bedding surfaces, faults, and soft interlayers, whereas the latter are embodied as structural fractures. These types of dam rock mass structures remind us of the landslide buckling failure mechanism, which is always characterized by steep through-going and gentle non-persistent discontinuities subjected to erect gravity [
24,
25]. Rotating the buckling force and geological structures equals our model, which may thus trigger catastrophic rock mass failure as well. However, the buckling failure mechanism is totally different from the shear failure introduced in the last paragraph. Therefore, an intensive study of this type of rock mass structure with potential buckling failure is essential.
In this paper, we attempt to study the failure mechanism of the No. 28 sluice rock masses, which are a part of the dam foundation of the Datengxia Hydropower Station. This station is the primary project of the Chinese Ministry of Water Resources for 2016–2020, and the rock masses of the dam (sluice) foundation are characterized by a combination of gentle through-going and steep structural discontinuities. The purpose of this study is to ascertain the failure mechanism of the rock masses or check if there is a completely new failure mechanism, such as buckling similar to landslide failure. In order to ensure the reliability of the results, numerical modeling (discrete element method) and the geomechanical model method are introduced in this paper. Consequently, the failure mechanism is confirmed on the basis of the stress and deformation distributions in the rock masses. The results can provide a scientific basis for practical project construction.
2. Study Area and Data Acquisition
2.1. Study Area
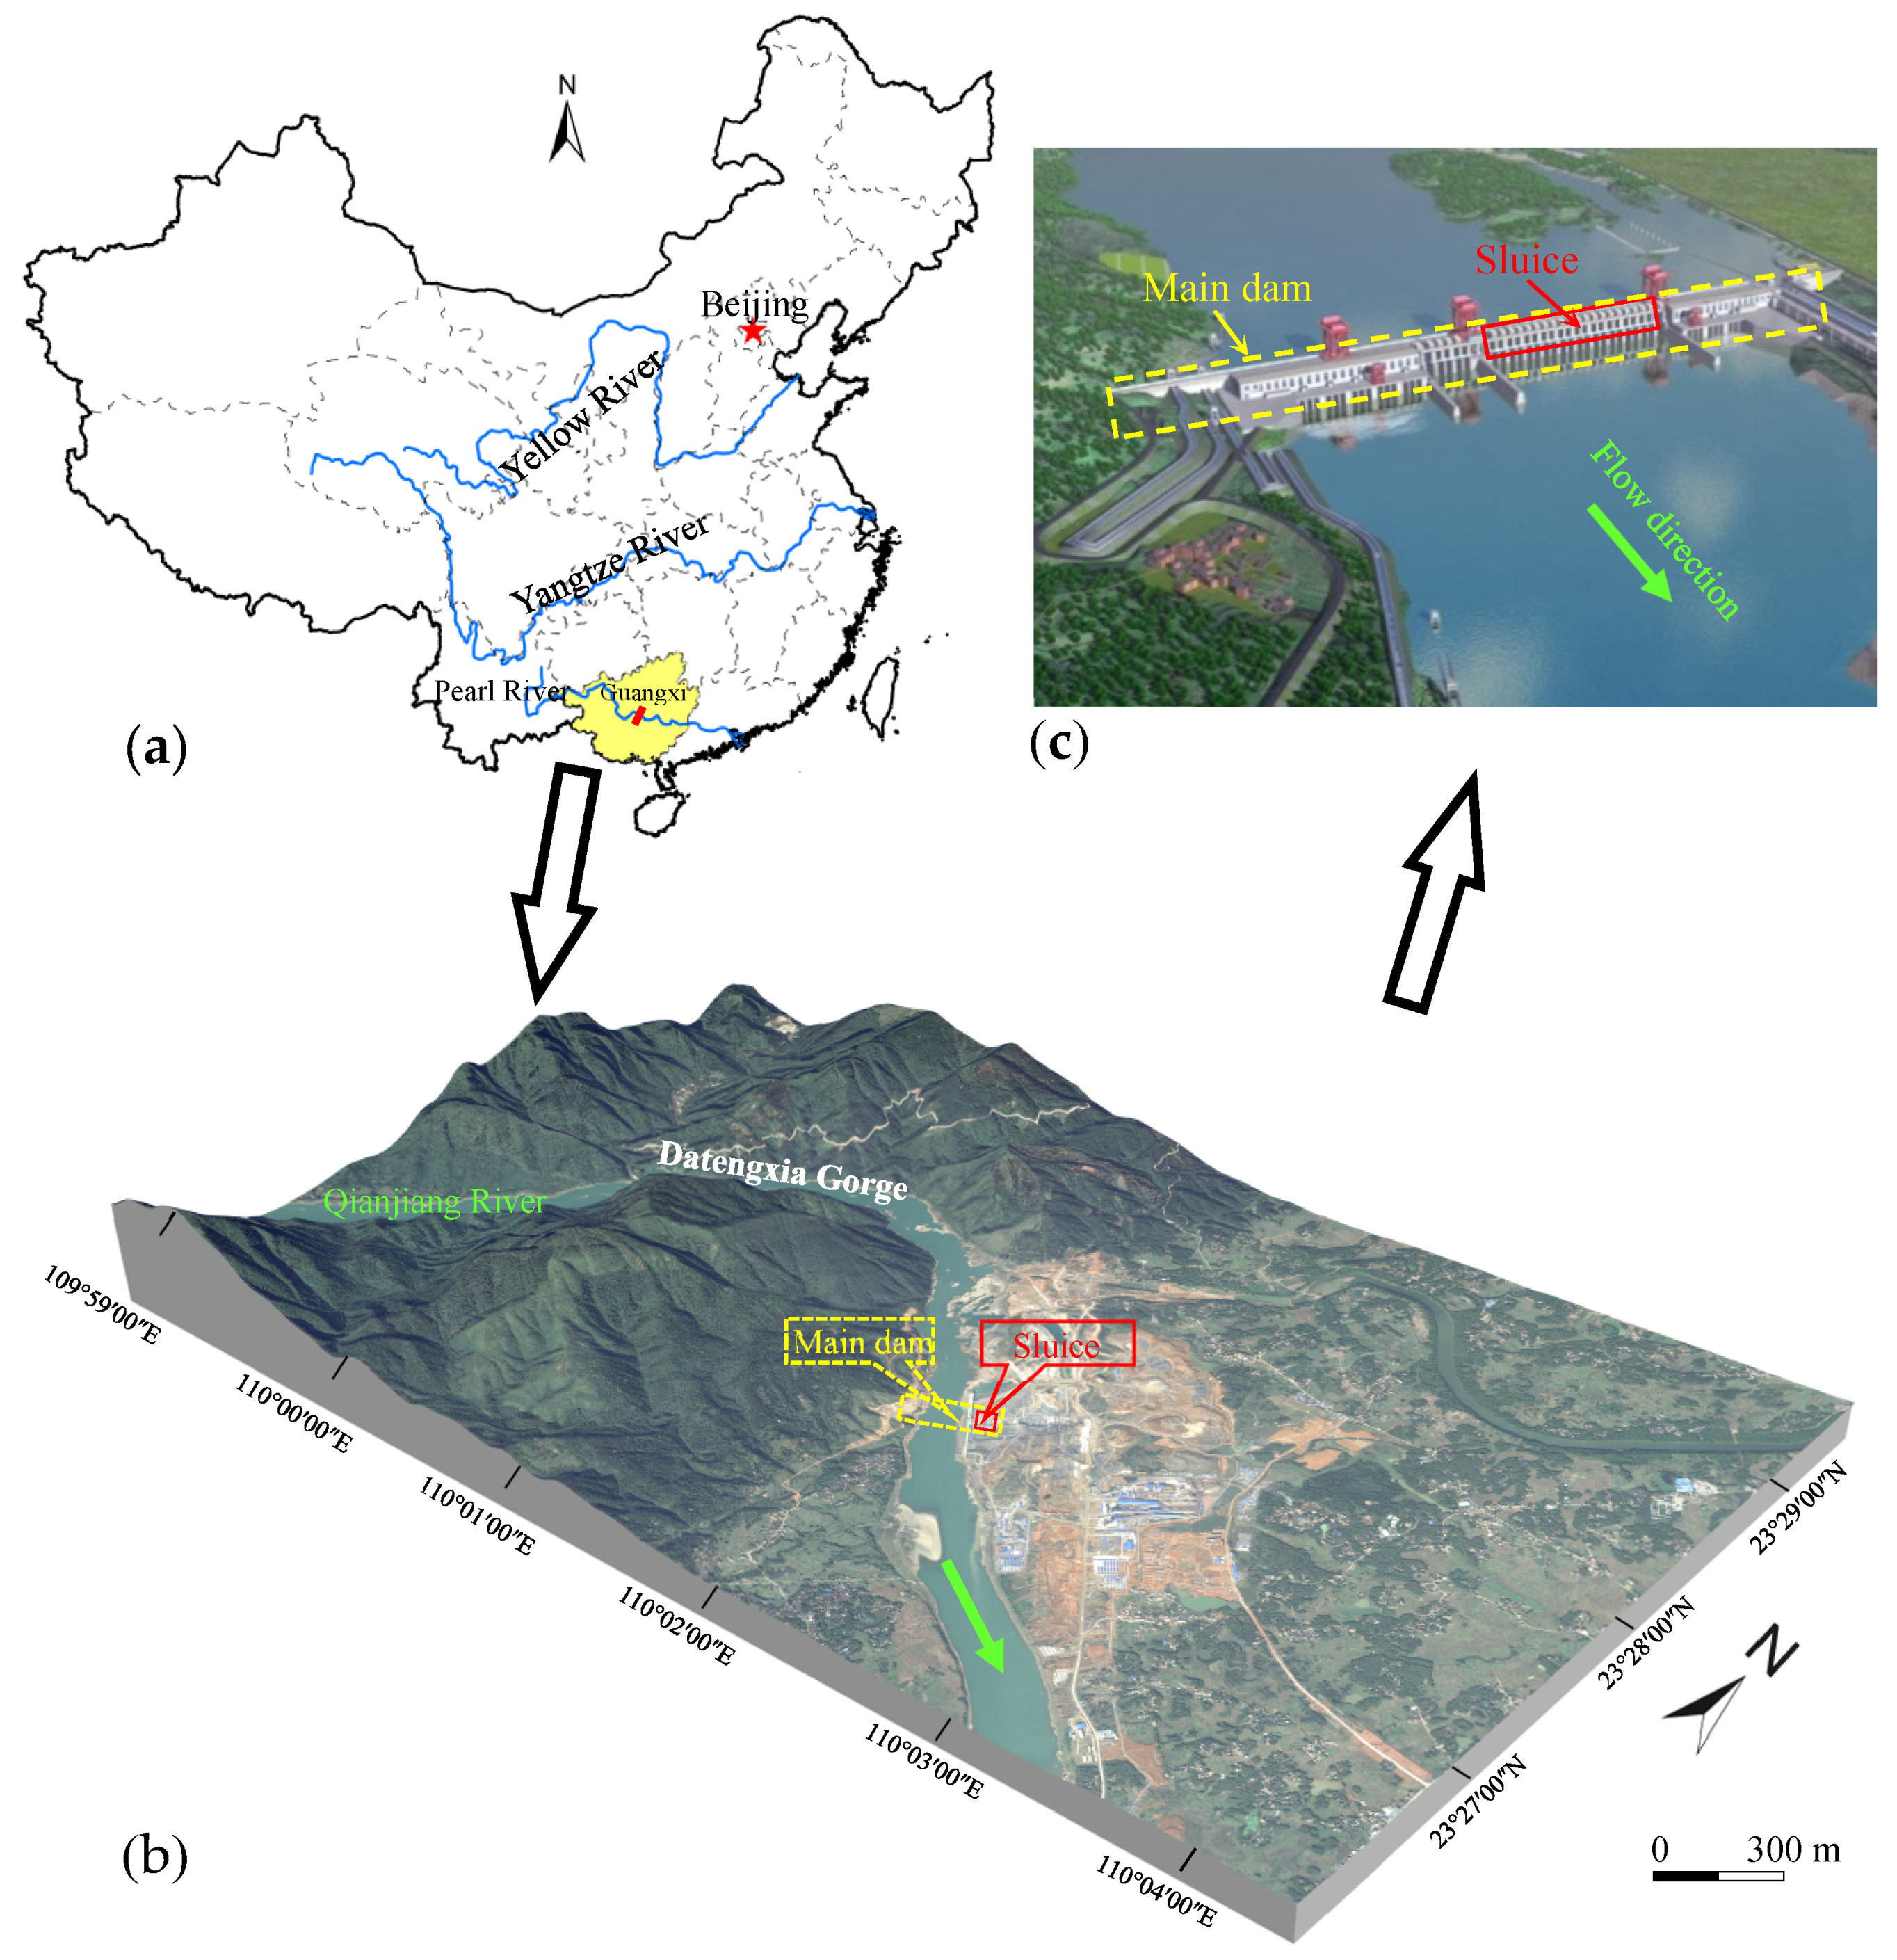
The study area is located at the Pearl River Basin in Guiping City, Guangxi Zhuang Autonomous Region, China (
Figure 1a). The Datengxia Hydropower Station—whose important tasks are flood control, shipping, power generation, and irrigation—is currently under construction in this area. The normal water levels of the upstream and downstream reservoirs are 61.0 m and 22.7 m, respectively, and the corresponding storage capacity is 2.81 × 10
9 m
3. As shown in
Figure 1b, the upstream reservoir area belongs to the mountain area where the elevation is approximately 300 m to 500 m, with a V-shaped gorge. In the downstream reservoir, the reservoir area belongs to the plain area whose elevation ranges from 60 m to 130 m. The main dam, which is a concrete gravity type with a height of 80.01 m and length of 1343.1 m, is located at the exit of the Datengxia gorge of the Qianjiang River (
Figure 1b). The sluice sections, consisting of Nos. 23–33, are important parts of the main dam (
Figure 1c).
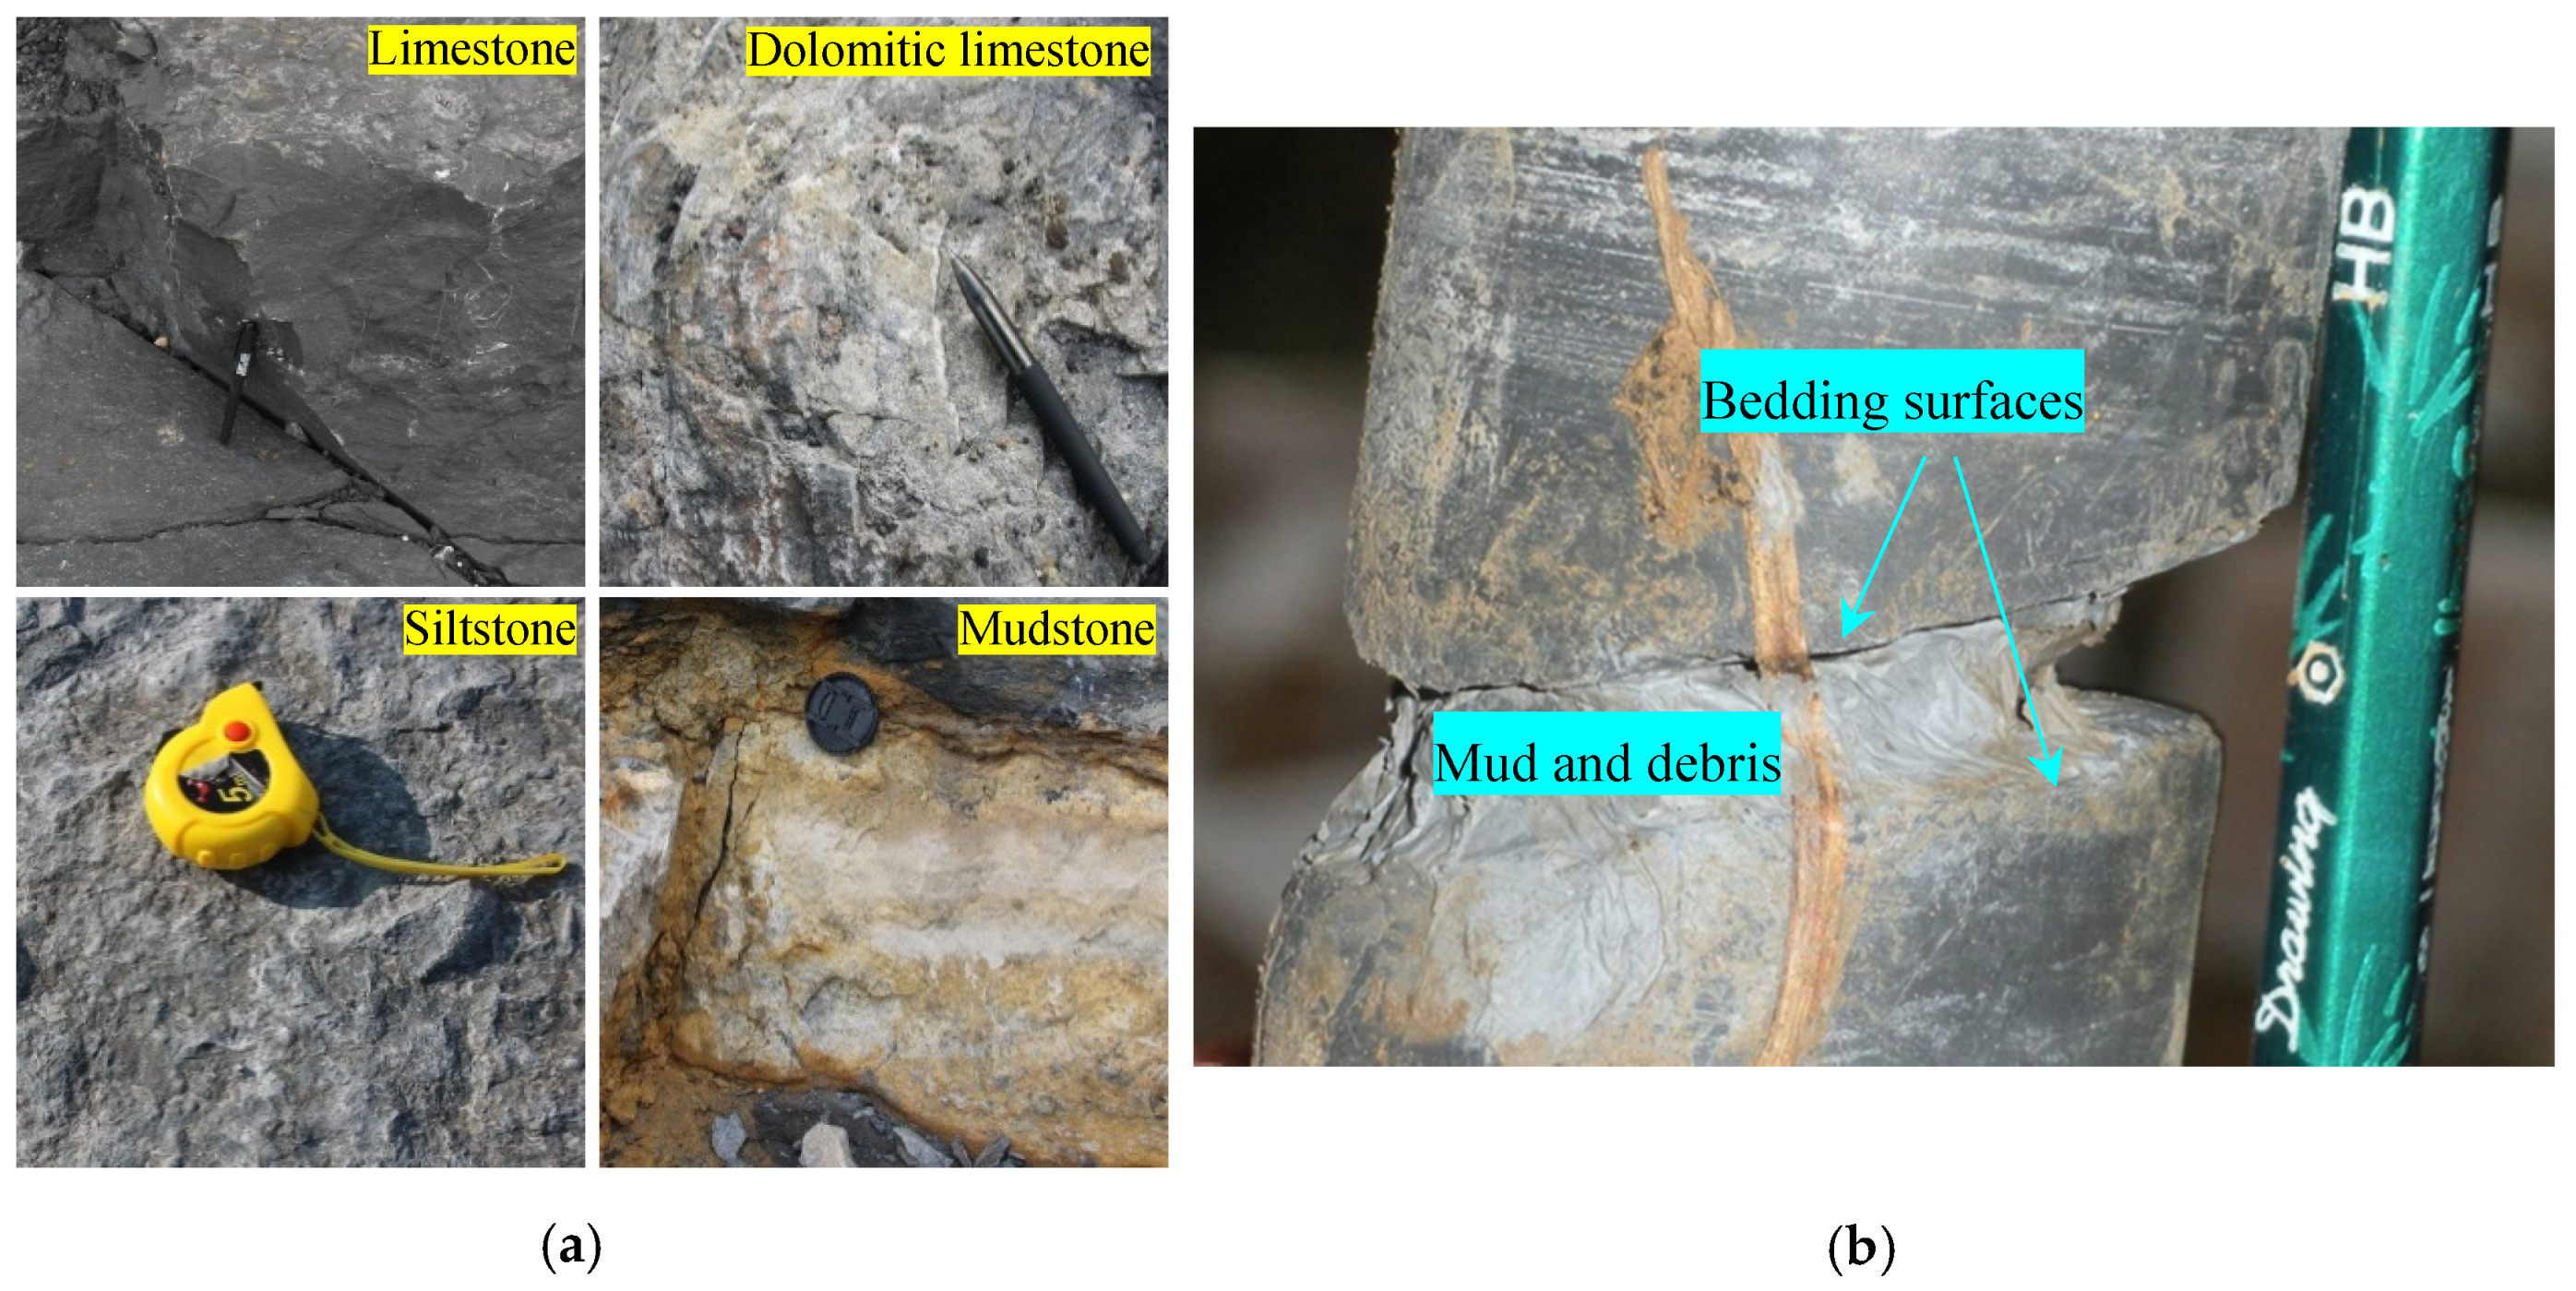
The Nagaoling (D
1n) and Yujiangian (D
1y) formations, which belong to lower Devonian (D
1), crop out in the sluice sections. The rock strata are sedimentary rocks, including mainly limestone, dolomitic limestone, siltstone and mudstone (
Figure 2a). The rock strata dip at direction of 100°–110° with dip angle of 10°–15°. There are many kinds of discontinuous planes in rock masses, i.e., faults, bedding surfaces, soft interlayers, and structural fractures. After reservoir impoundment, the sluice will withstand greater water thrust force. Consequently, a further investigation of the safety level and the failure mechanism of the sluice sections, with full consideration of the influence of unfavorable geological conditions, is necessary for ensuring project safety.
As shown in
Figure 3, faults are found in the foundation, most of which are characterized by crush zones with widths less than 1 m and steep dip angles. All these faults intersect the dam axis at a relatively large angle. F216, which dips at N70° W, SW ∠75°–85°, is the largest fault passing through the Nos. 29 and 30 sluice. The 9 m soft materials beneath the outcrop for F216 will be substituted by concrete to highly increase its strength.
Bedding surfaces are developed, and a high proportion of them are filled by materials with mud and debris, forming gentle soft interlayers (
Figure 2b). The soft interlayers have thickness ranging from 3 to 5 mm. Highly reduced strength makes the soft interlayers become a key factor influencing the stability of the sluice rock masses.
The structural fractures in the rock masses are extremely developed, with the vast majority of them dipping with angles of more than 70°. Field observation shows that most fractures are not extended through the soft interlayers as shown in
Figure 4b–d, so the fractures can be regarded as staggered with soft interlayers. The fractures’ characteristics, such as their trace length and orientation, significantly vary across different regions (
Figure 2). In the present study, the structural fractures in one section of the sluice rock masses are introduced in
Section 2.3 in detail.
In the present study, two-dimensional (2–D) analysis with the 2-D profile perpendicular to the dam axis is implemented, which will be discussed in the Discussion section. The fractures that strike approximately perpendicularly to the dam axis act as the surface of separation and will not be displayed on the 2-D profile so that they do not affect the results of the 2-D stability analysis.
Figure 3 shows that the size and number of the fractures developed in the No. 28 sluice are large. It also can be seen that a considerable proportion of the fractures strike parallelly to the dam axis, which forms the outlet of rock mass failure and then controls the stability analysis result for the rock masses. Therefore, the stability of the No. 28 sluice should be paid special attention to.
2.2. Investigation of Soft Interlayers
The geological profile of the No. 28 sluice is shown in
Figure 4a. The lithology in this sluice is characterized by strata in D
1n (including D
1n
12, D
1n
13-1, D
1n
13-2, and D
1n
13-3) and D
1y (including D
1y
1-1, D
1y
1-2, and D
1y
1-3). Extremely thin (3–5 mm) mud and debris fill the bedding surfaces, forming through-going soft interlayers. These soft interlayers (
Figure 4a, see black wavy lines) fill the boundaries of two different strata. The stratigraphic boundary between D
1y
1-3 and D
1y
1-2 and that between D
1y
1-2 and D
1y
1-1 are illustrated in
Figure 4b,c. Apart from these stratigraphic boundaries, the bedding surfaces in the strata of D
1y
1-1 and D
1n are also filled with mud and debris, forming developed soft interlayers with a spacing of 2–5 m. A soft interlayer developed in D
1n
13-2 is taken as an example and shown in
Figure 4d. The shear strength of the soft interlayers is much lower than that of the intact rocks; thus, they form potential failure surfaces for the rock masses in the dam (sluice) foundation.
2.3. Data Acquisition for Fractures
The gentle through-going soft interlayers incline towards underground, lacking outlet planes for an integral failure surface. As shown in
Figure 4a and discussed in
Section 2.1, structural fractures developed in D
1y
1-1, D
1y
1-2, D
1y
1-3 and D
1n
13-3 may constitute the outlet planes. Consequently, the structural fractures along the No. 28 sluice are collected. The sampling window method [
26,
27] is applied to collect fractures with trace lengths larger than 0.5 m on a horizontally excavated rock outcrop (
Figure 5a). The X and Y coordinate axes of the measurement coordinate system are parallel and perpendicular to the dam axis, respectively. The start and end coordinates, dip direction, dip angle, aperture, surface morphology, and filling of fractures are recorded.
A total of 767 fractures are acquired in the field, of which 50, 50, 390, and 277 are developed in D
1n
13-3, D
1y
1-1, D
1y
1-2, and D
1y
1-3, respectively (
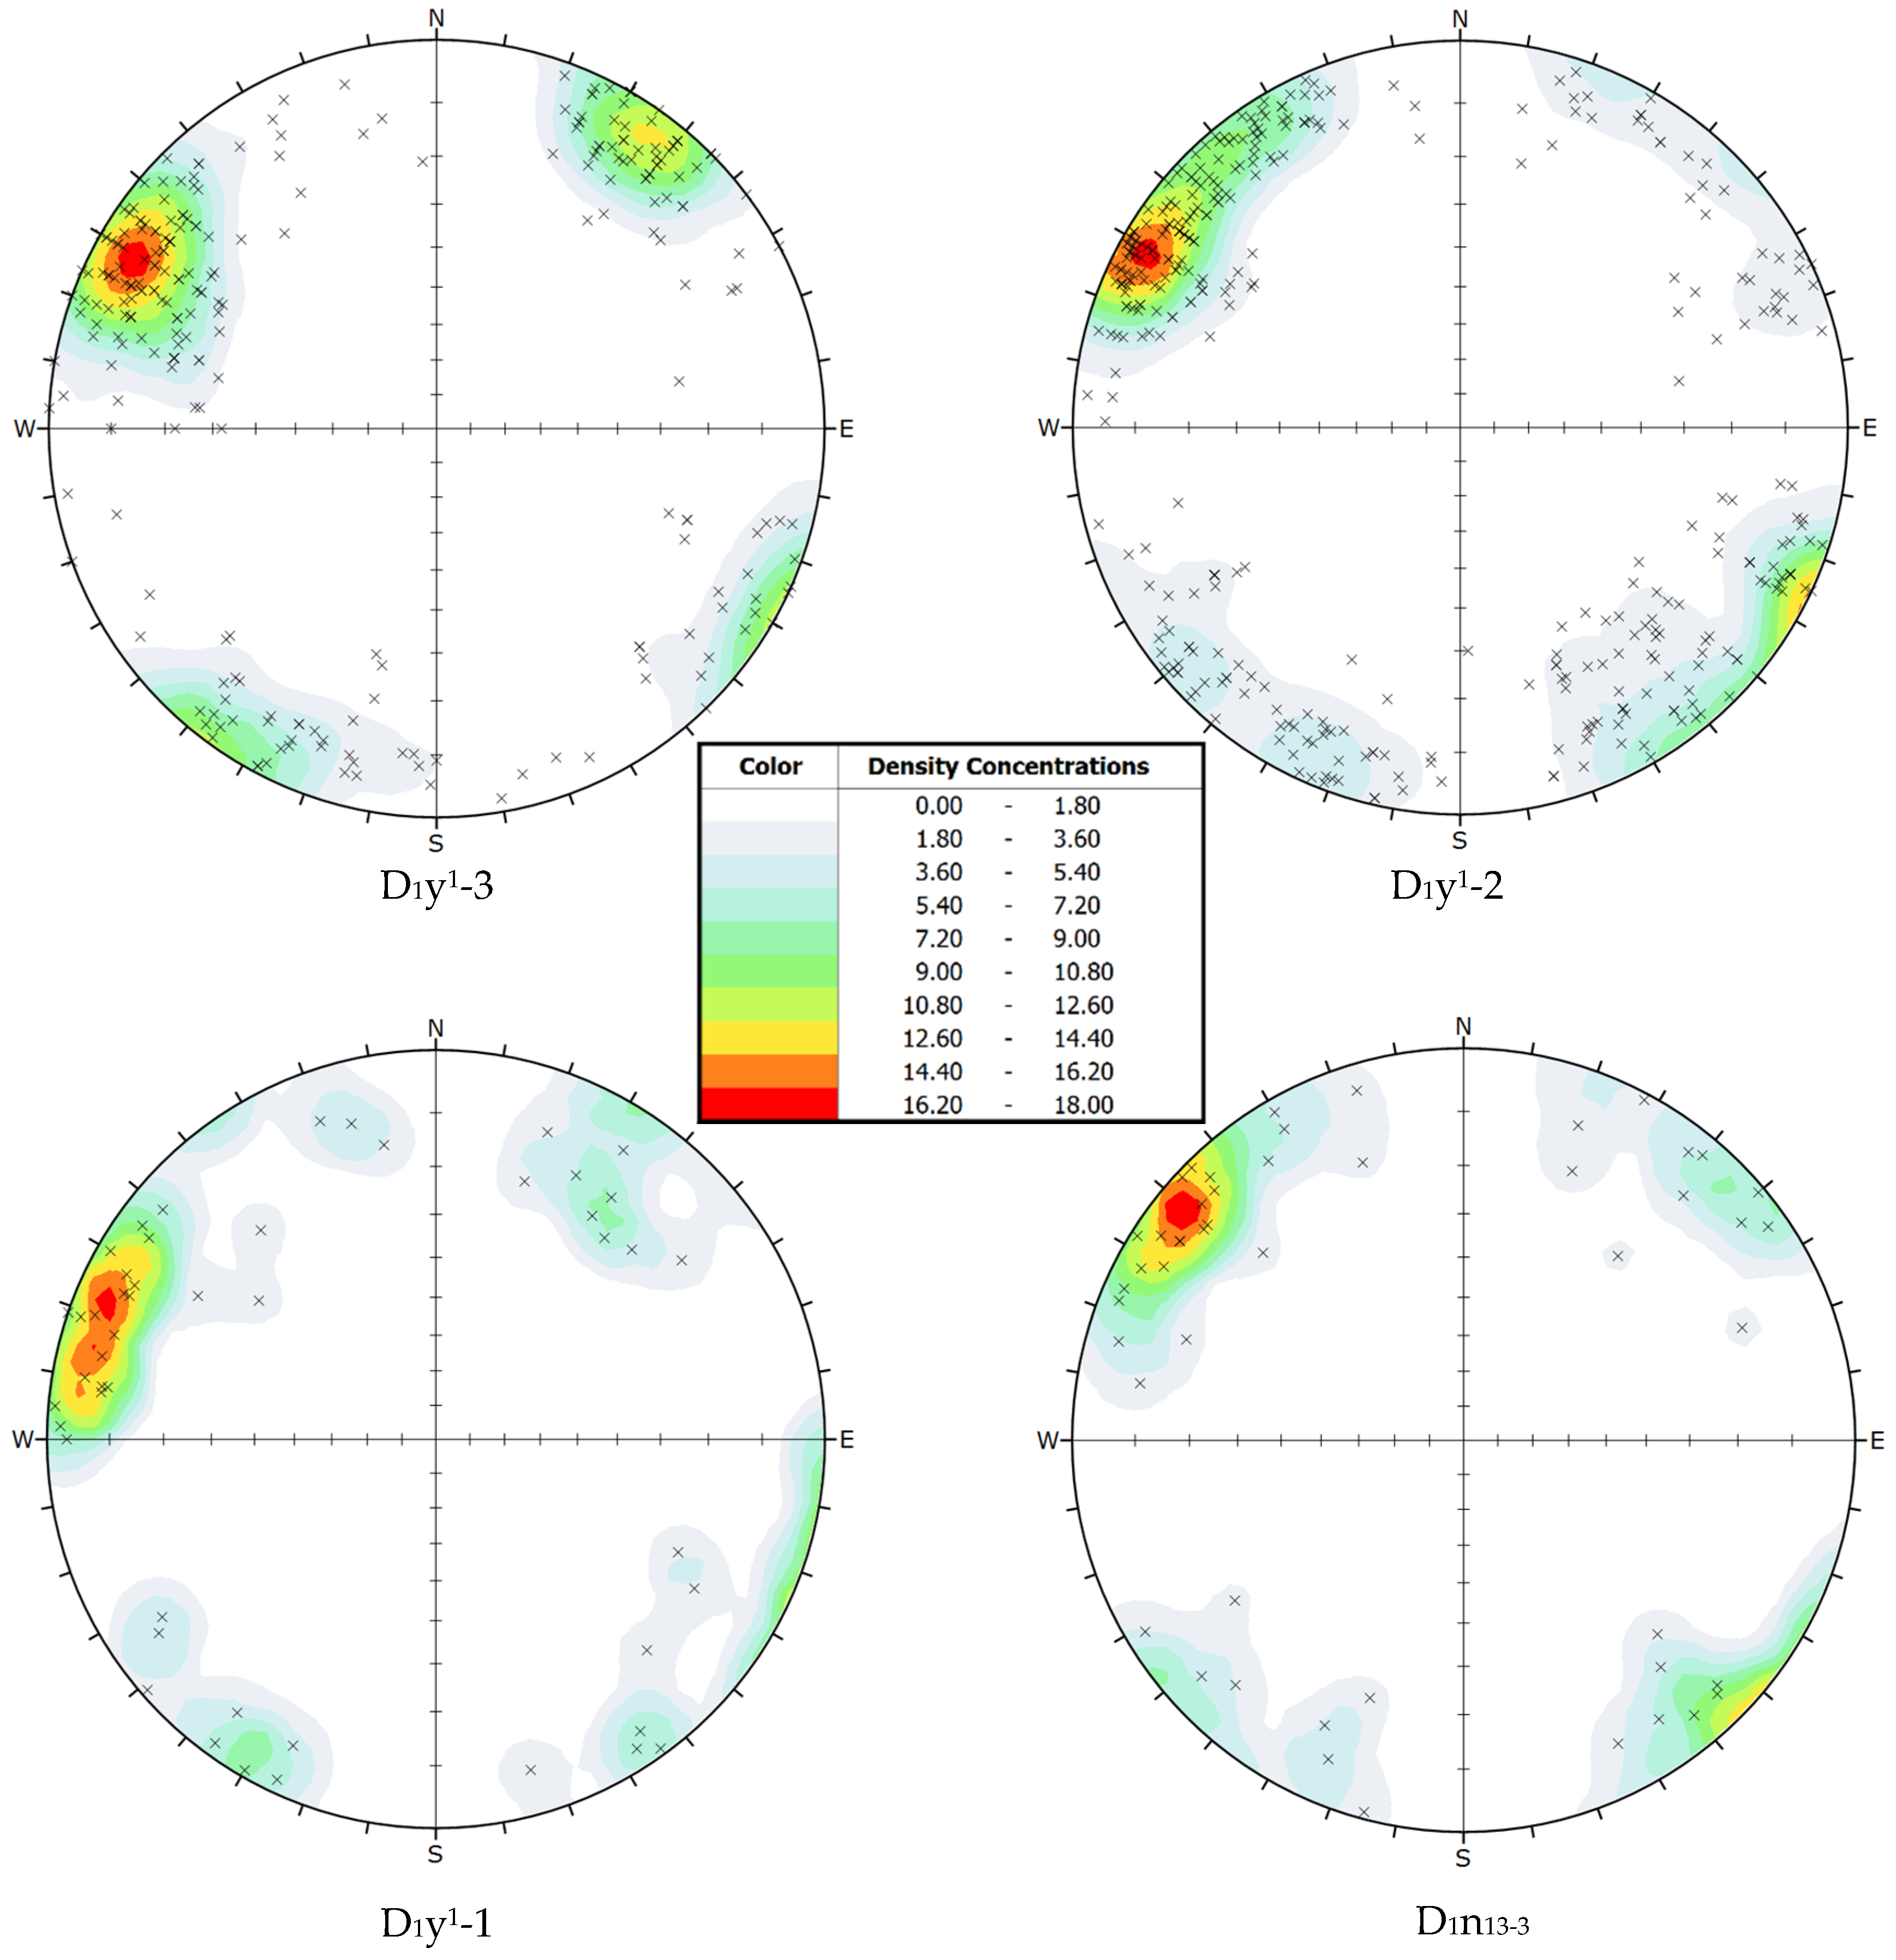
Figure 5b–e). The statistical results of the collected fractures show that steep dip-angled fractures (higher than 70°) prevail and that the apertures locate between 1 mm and 3 mm. The contours of fracture orientation poles are shown in
Figure 6, which represents two sets of fractures consistent with the field observation.
The grouping results are derived based on the method suggested by Shanley and Mahtab [
28] (
Table 1). The results indicate that the mean direction of Fracture Set 1 intersects the dam axis at a low angle, and Fracture Set 2, at a large angle. As previously discussed in
Section 2.1, Set 1 has a majority of fractures dipping upstream approximately perpendicularly to the bedding surfaces and plays an important role in the 2-D stability analysis.
The spacing of Fracture Set 1 should be derived before conducting the 2-D stability analysis of the No. 28 sluice. In the present study, twenty scanlines perpendicular to the dam axis are set to determine the fracture spacing. There is little difference among the spacing values for D
1y
1-1, D
1y
1-2, D
1y
1-3, and D
1n
13-3; thus, the fractures are used for the spacing calculation as a whole. The final results show that the average fracture spacing along the No. 28 sluice profile direction is 2.07 m, which is eventually adopted as 2 m. The values of the fracture spacing of D
1n
13-1, D
1n
13-2, and D
1n
12, which have little influence on the 2-D stability analysis results (
Figure 4), are also adopted as 2 m for convenience.
3. Numerical Modeling
Numerical methods are generally divided into continuum methods (CMs) and discrete methods (DMs) [
29]. CMs mainly include the finite element method, finite difference method, boundary element method, and finite volume method [
30]. DMs mainly include the distinct element method (DEM), discontinuous deformation analysis, and the key block theory [
31]. Numerous geological structural planes are developed in the rock masses of the No. 28 sluice, embodying distinct discrete features of geological materials. Eventually, the commonly used 2-D DEM of Universal Distinct Element Code (UDEC) [
32], which has been proved to have advantages in simulating the deformation and destruction of rock masses with through-going discontinuities, is employed in the present study [
33,
34,
35,
36,
37]. Notably, the non-persistent structural fractures are substituted by through-going fractures to meet the requirements of UDEC, which will be discussed in
Section 3.1.
3.1. Establishment of UDEC Model
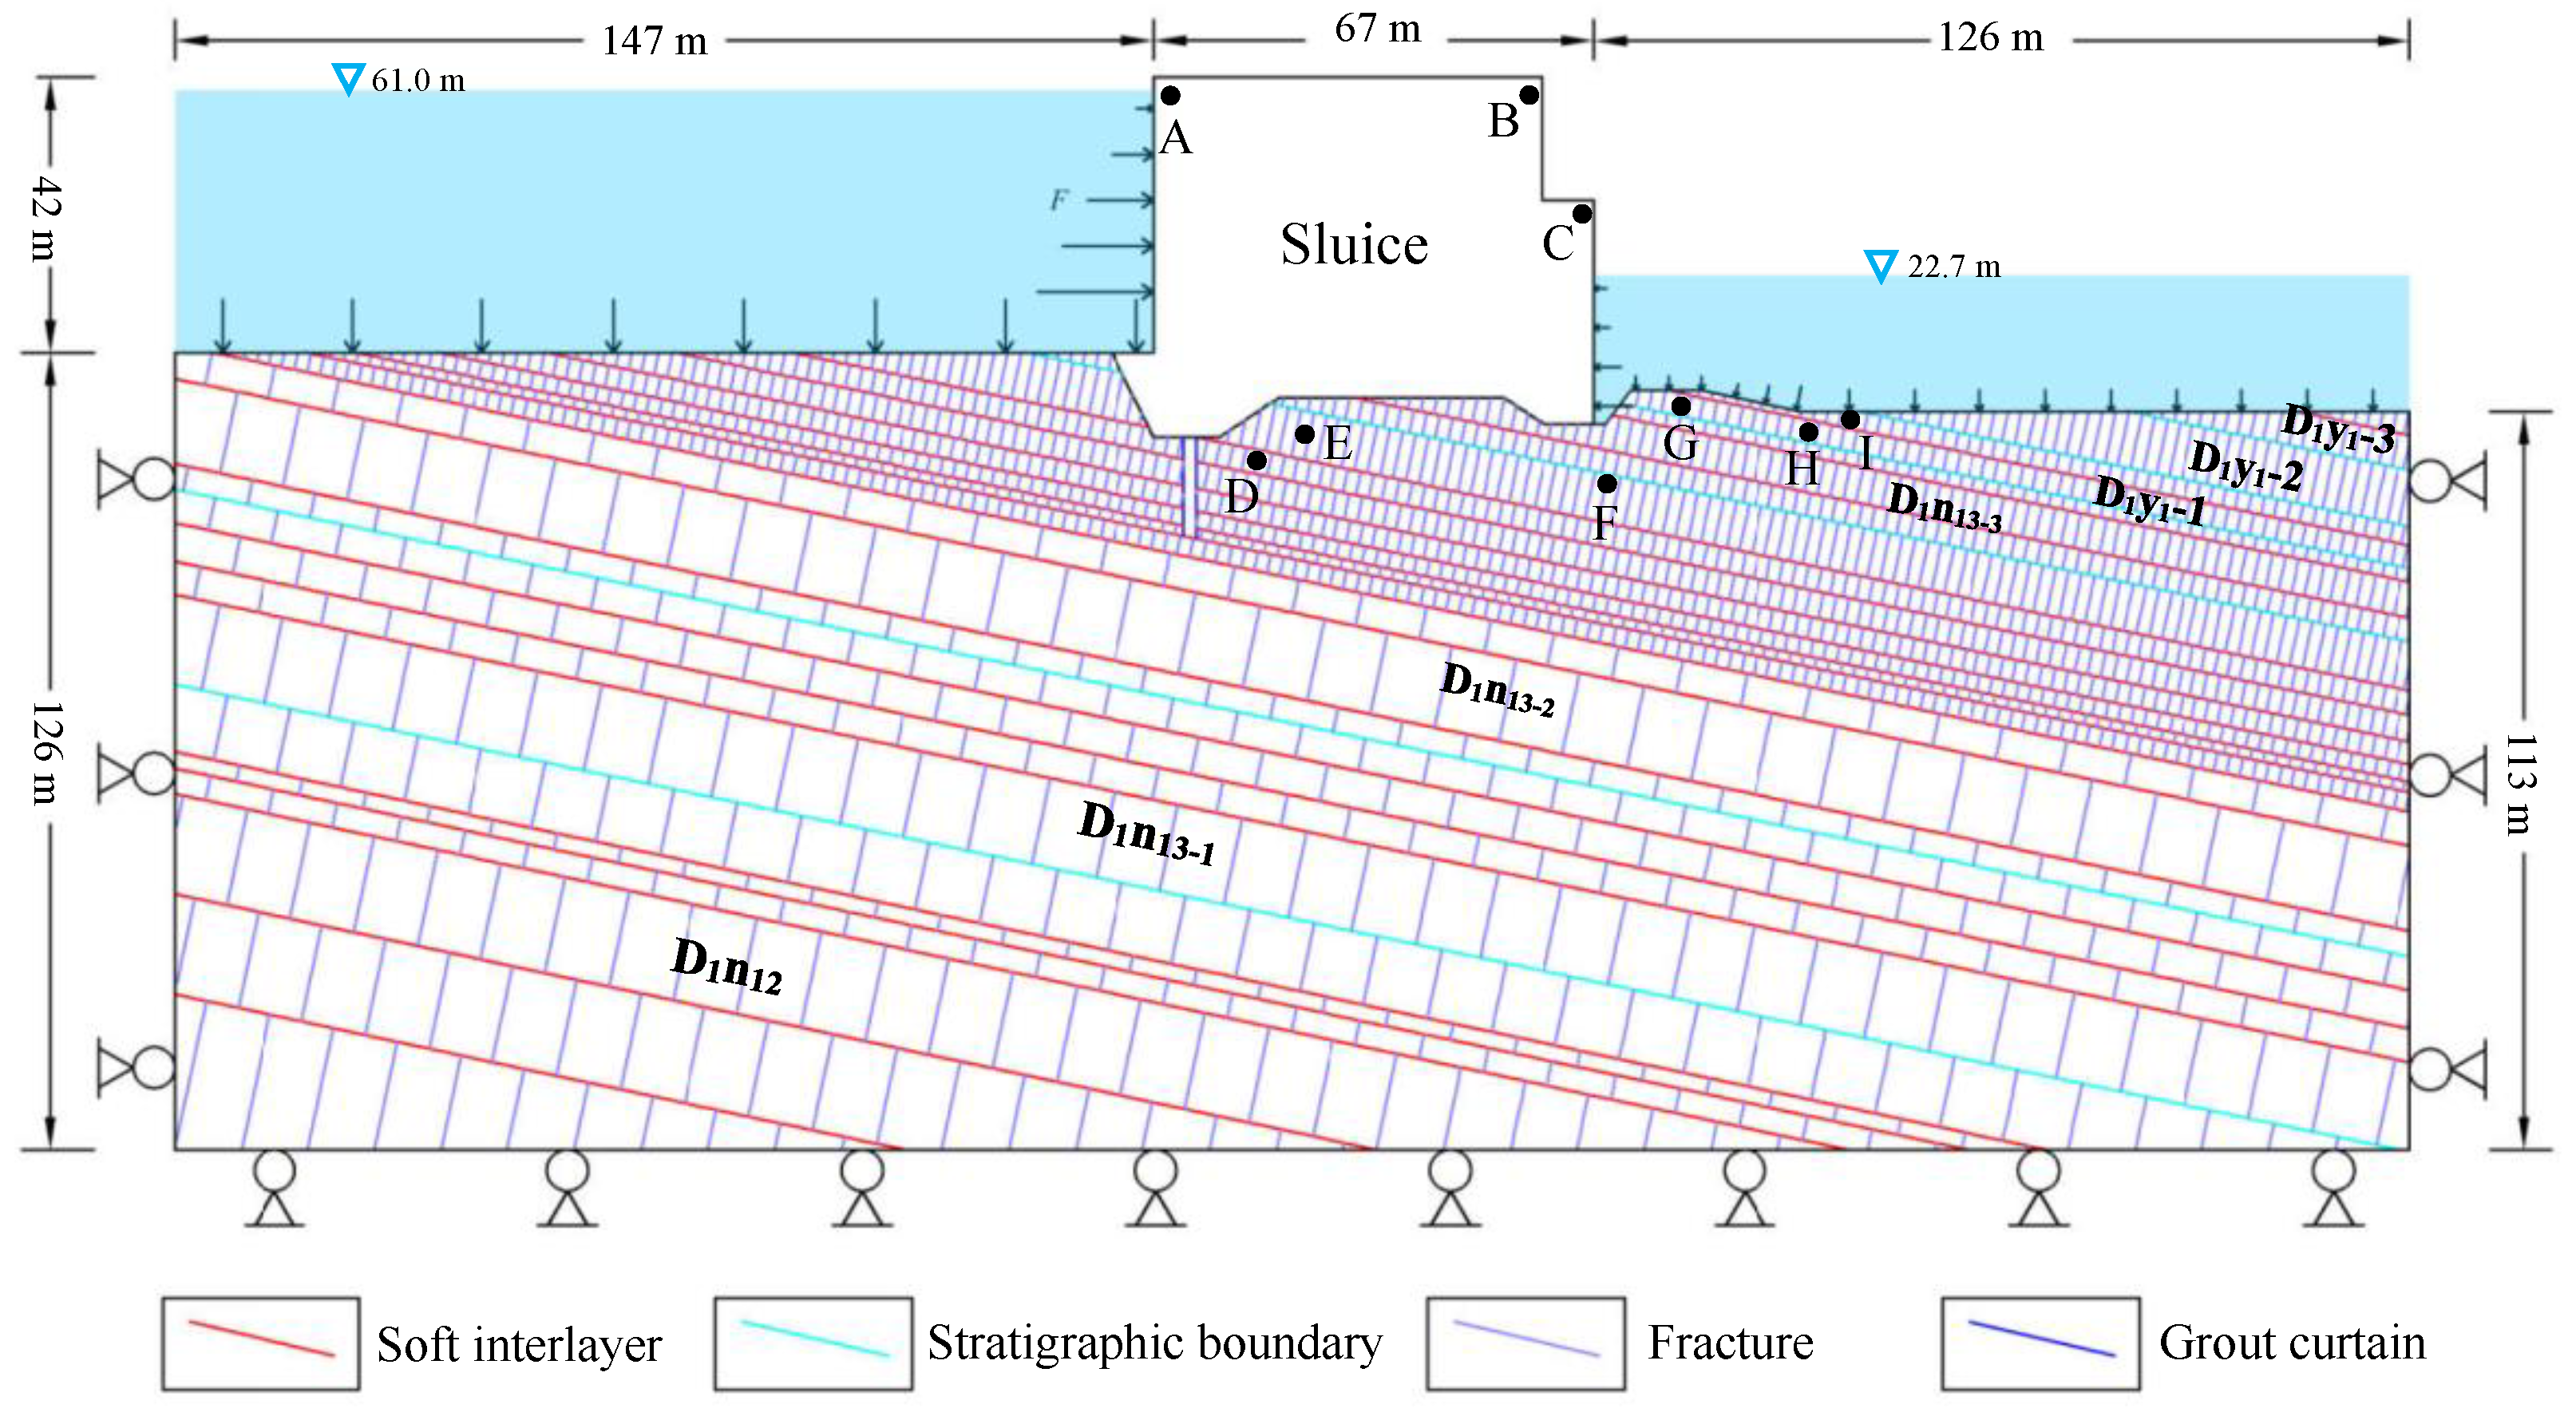
The numerical model should be sufficiently large to overcome the boundary effect [
1,
38]. The UDEC model simulates a domain with 3.5 times the sluice height (42 m) upstream, 3.0 times the sluice height downstream, and 3.0 times the dam height beneath the sluice bottom. Eventually, the total size of the model is 340 m (length) × 168 m (height) (
Figure 6).
The strata are cracked by staggered fractures with a spacing of 2 m according to the geological descriptions in
Section 2.3. However, the deep-seated fractures have minor effects on the deformation. Therefore, the spacing is increased to 10 m in consideration of the calculation speed.
In D1n and D1y1-1, the fractures are nearly perpendicular to the soft interlayers, and the sizes of a large proportion of the fractures are larger than the soft interlayer spacing of 2–5 m; thus, the fractures between two soft interlayers are usually thorough-going. The fractures developed in D1y1-2 and D1y1-3 are virtually non-persistent; however, they are presumed to be through-going for the application of UDEC. It is believed that the possibility that a failure surface extends along these two hard strata far from the sluice is relatively small. This presumption is reasonable if the conservative disposition does not result in the failures of these two strata.
Fault F216, which is reinforced by hard concrete, is located upstream of the sluice and intersected by the dam axis at a relatively large angle. Therefore, F216 has little influence on the 2-D analysis results for the sluice rock masses. Consequently, F216 is not considered in the model. Besides, grout curtain, a barrier that reduces the influence of seepage on the foundation, is taken into account in the numerical model.
The sluice is simulated as a solid block. Finally, a UDEC model of the No. 28 sluice is established (
Figure 7). The bottom and side boundaries of this model are assumed to be impermeable and to be subjected to widely applied roller conditions, which are the boundary conditions in the plane strain analyses [
39,
40]. The influences of sediment pressure and wave pressure are not considered in the numerical method. Finally, hydrostatic pressures are applied to the sluice and on the rock masses according to the designed water level (
Figure 7).
3.2. Material Properties
UDEC analysis requires the material properties of the intact blocks (including intact rocks and sluice) and the discontinuities (including soft interlayers and structural fractures). A linear elastic constitutive model with a Mohr–Coulomb failure criterion is applied to model intact blocks, for which six parameters as shown in
Table 2 are required. These parameters can be determined by performing the pycnometric method, uniaxial compression test, direct shear test, and Brazilian splitting test [
41].
The Coulomb sliding model is used to describe the mechanical behavior of the discontinuities, for which eight parameters as shown in
Table 3 are required.
3.3. Numerical Modeling and Its Results
In the present study, the overload method is applied to the UDEC analysis to check the plastic zone development and the bearing resistance of the sluice and its foundation. This method is achieved by increasing the hydrostatic pressure to
Kp times its original value, where
Kp is the overload factor. As shown in
Figure 7, a water level difference (a pressure difference) exists upstream and downstream, which will lead to water flow along the discontinuities. Based on the steady state flow algorithm in UDEC, the pore pressure of the dam foundation is obtained for later stability analysis. Therefore, the hydro-mechanical coupling, which involves the interaction between hydraulic and mechanical processes, is considered in the numerical modeling.
A large number of monitoring points are set in the sluice and its foundation rock masses, and nine of them (
Figure 7) from different locations are selected to describe the numerical analysis results.
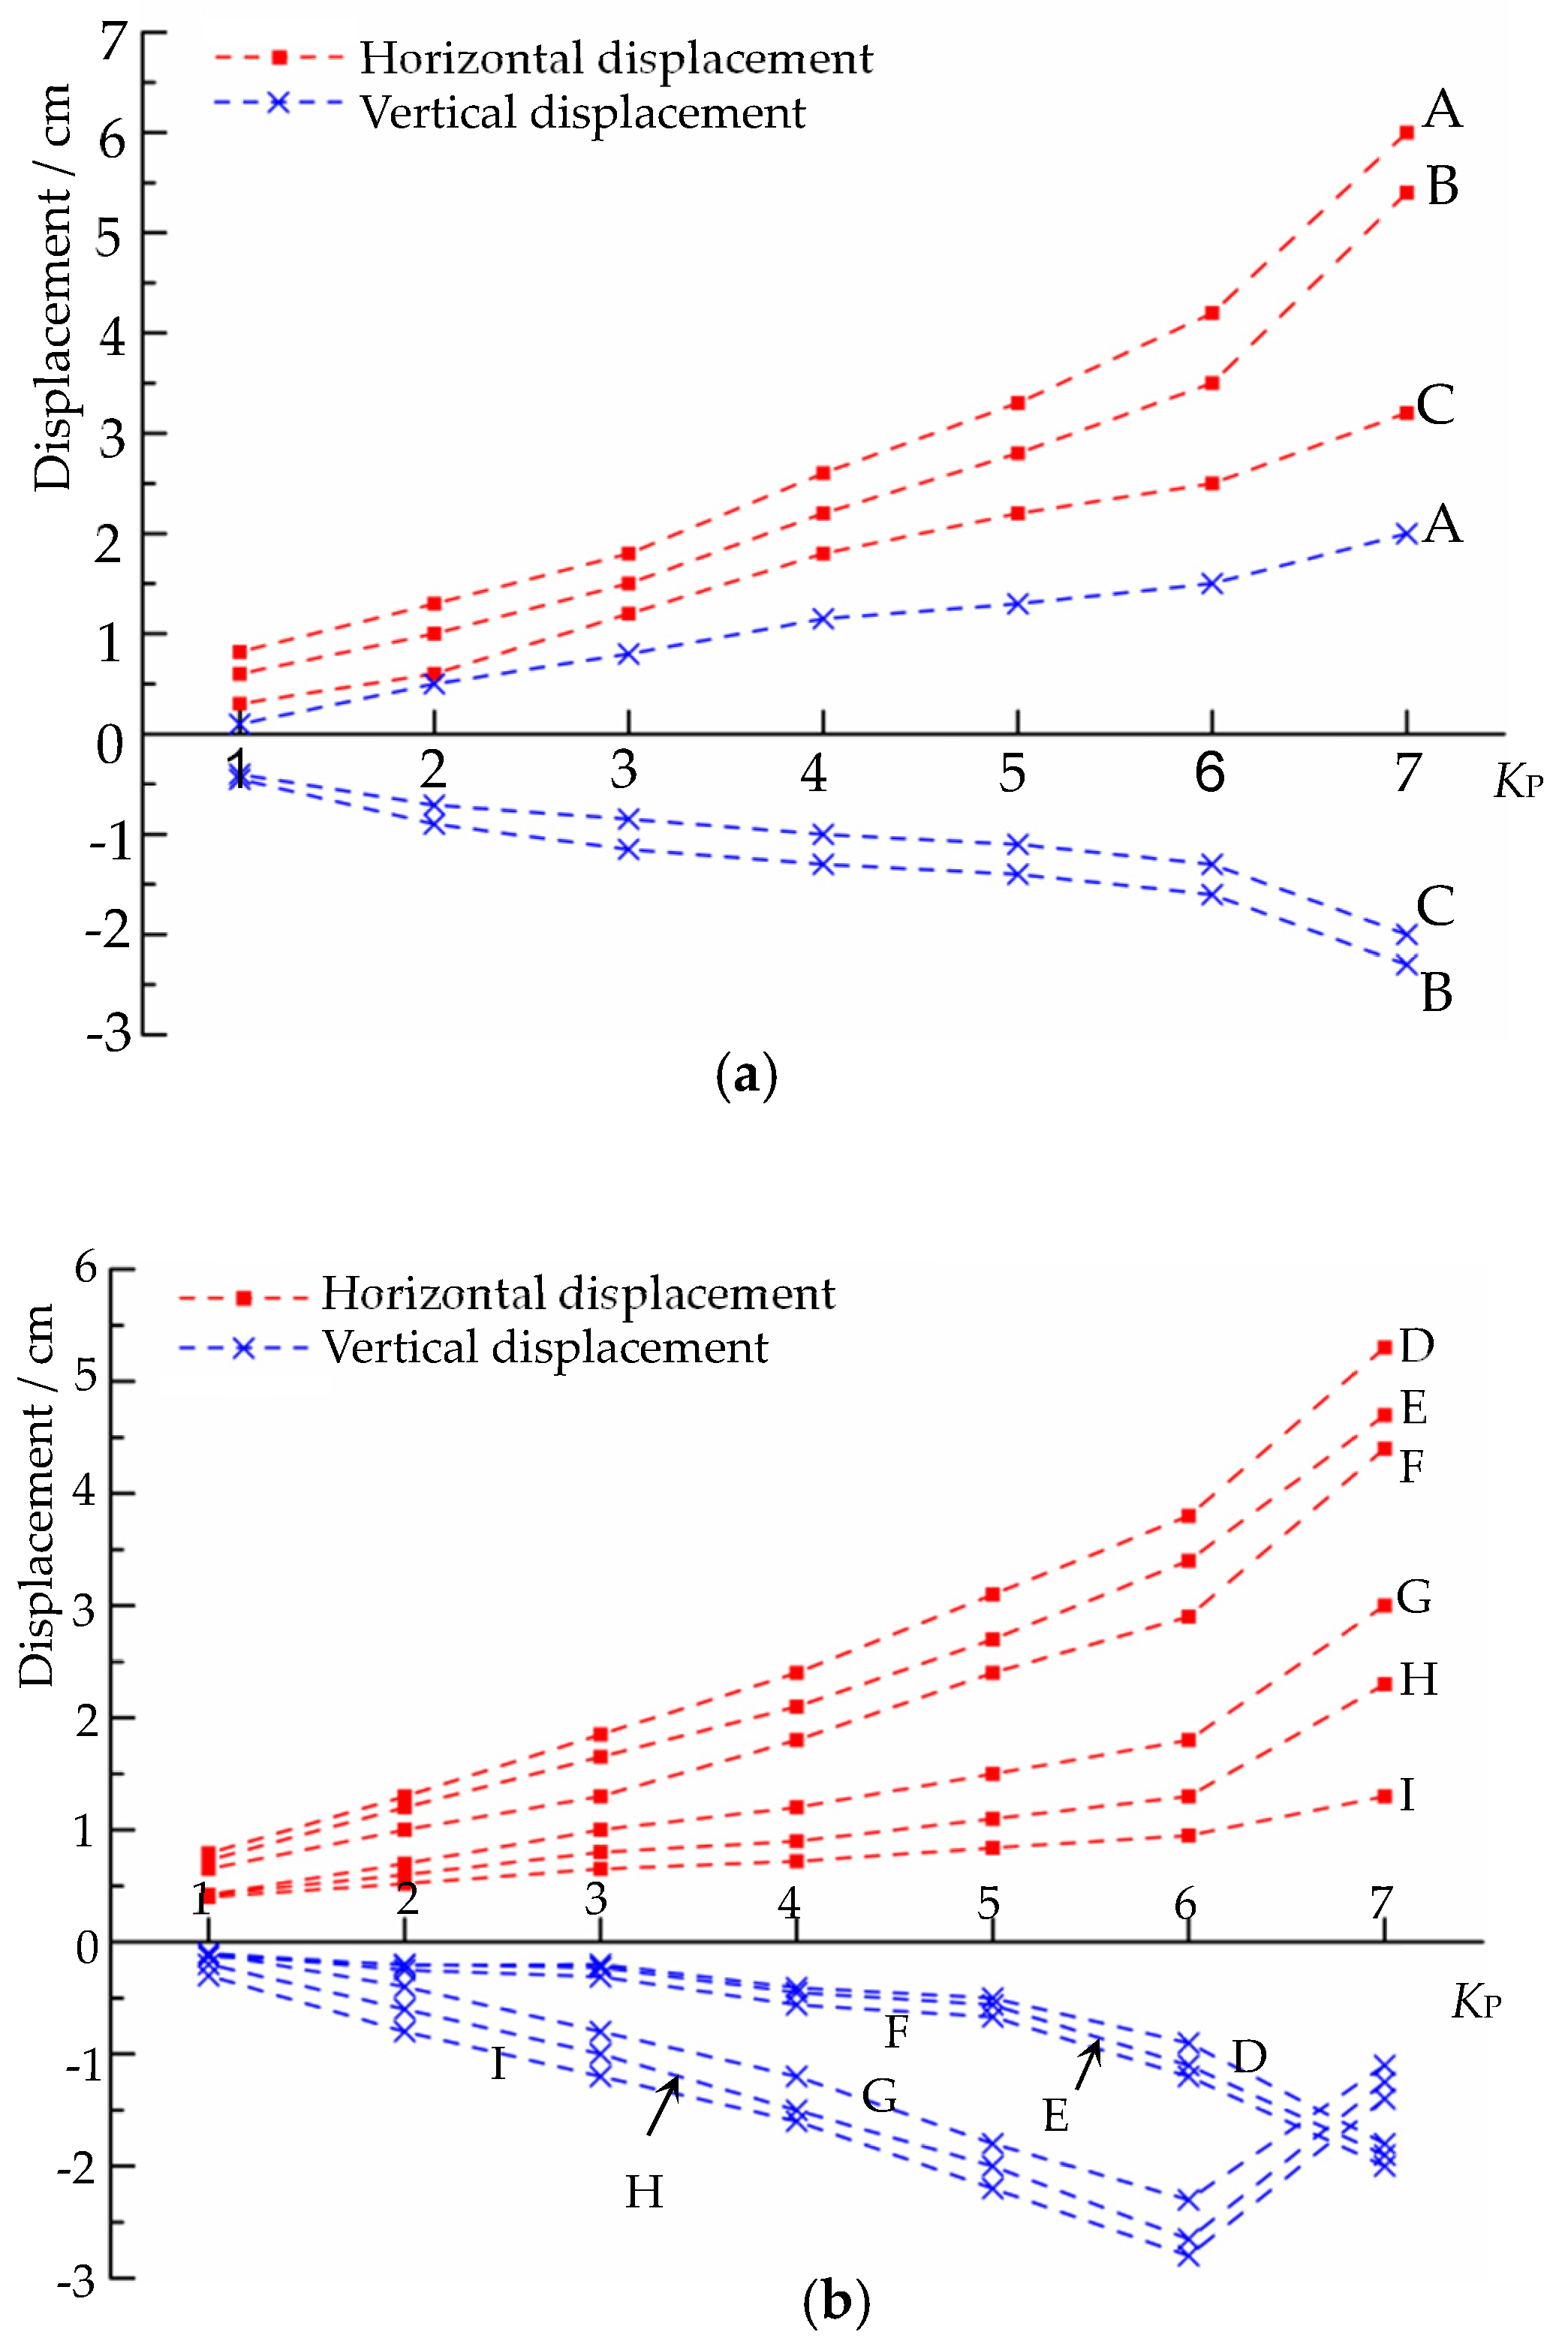
The nine points (A–I) are used to illustrate the variation of the displacement with the overload factor
Kp (
Figure 8). The displacements in the upward and downstream directions are positive, whereas those in the downward and upstream directions are negative. It can be seen that the horizontal displacements and vertical displacements of the monitoring points basically increase uniformly as
Kp increases from 1.0 to 6.0. On the whole, the horizontal displacements are larger than the vertical displacements due to higher horizontal hydrostatic pressures. It is worth noting that the vertical displacements of the sluice upstream point (A) are positive and those of the downstream points (B and C) are negative (downward), which indicates that the sluice has been rotated.
Afterwards, the growth rate of the displacement increases when
Kp rises from 6.0 to 7.0. The vertical displacements of the downstream rock masses close to the sluice (points G, H, and I) have a tendency to move upward. As
Kp = 8.0, the displacements of the monitoring points keep increasing, and the maximum unbalance force value is always in a state of fluctuation; that is, the model has been breached [
4].
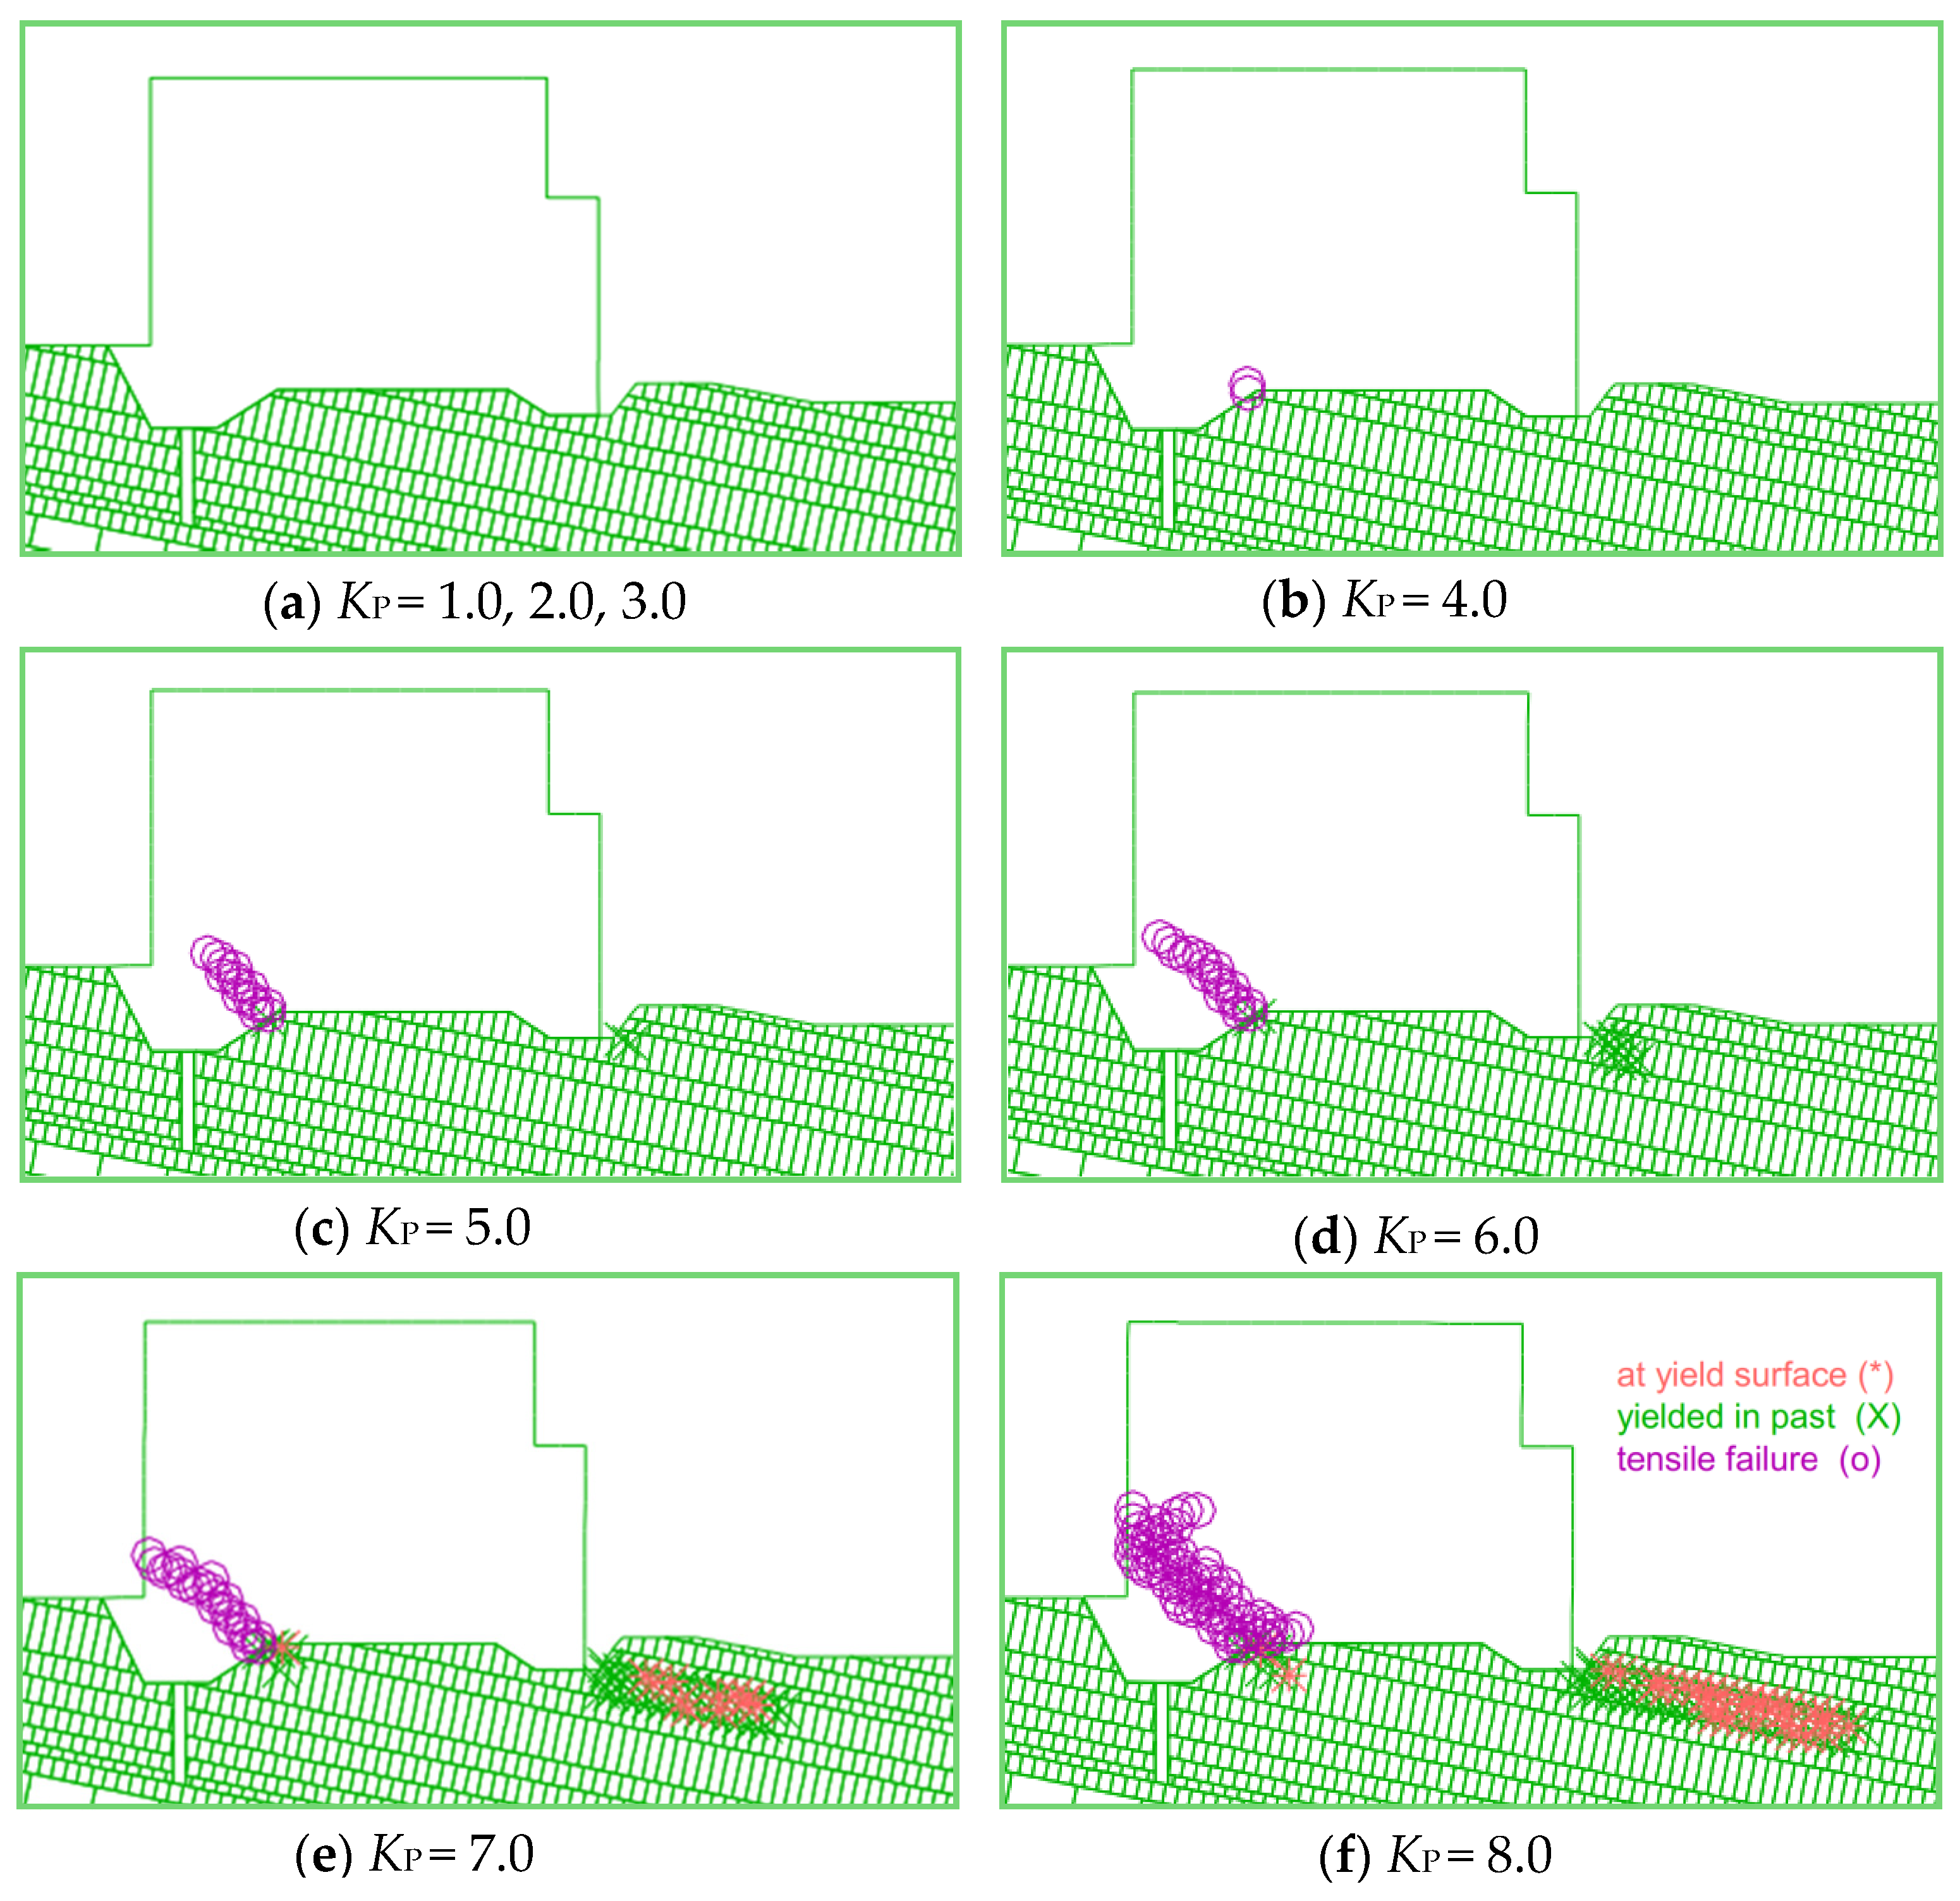
The variations in the mechanical properties of the rock masses during the increase in the overload factor are recorded. When
KP is equal to or smaller than 3.0, the whole model is within the elastic range and no plastic zones are detected. When
Kp is increased to 4.0, tensile plastic zones initially appear in the upstream cutoff trench (
Figure 9b). When
Kp is 5.0, compressive plastic zones initially appear in the rock masses adjacent to the dam toe and the downstream cutoff trench (
Figure 9c). With the increase in
Kp, the tensile and compressive plastic zones all keep propagating. When
Kp increases from 6.0 to 7.0, plastic zones in the rock masses adjacent to the dam toe rapidly extend, indicating an increase in the growth rate (
Figure 8). In addition, the tensile plastic zones run through the sluice. The tensile and compressive plastic zones propagate when
Kp increases to 8.0, and the model is eventually destroyed (
Figure 9f).
4. Geomechanical Model Test
4.1. Model Test Design
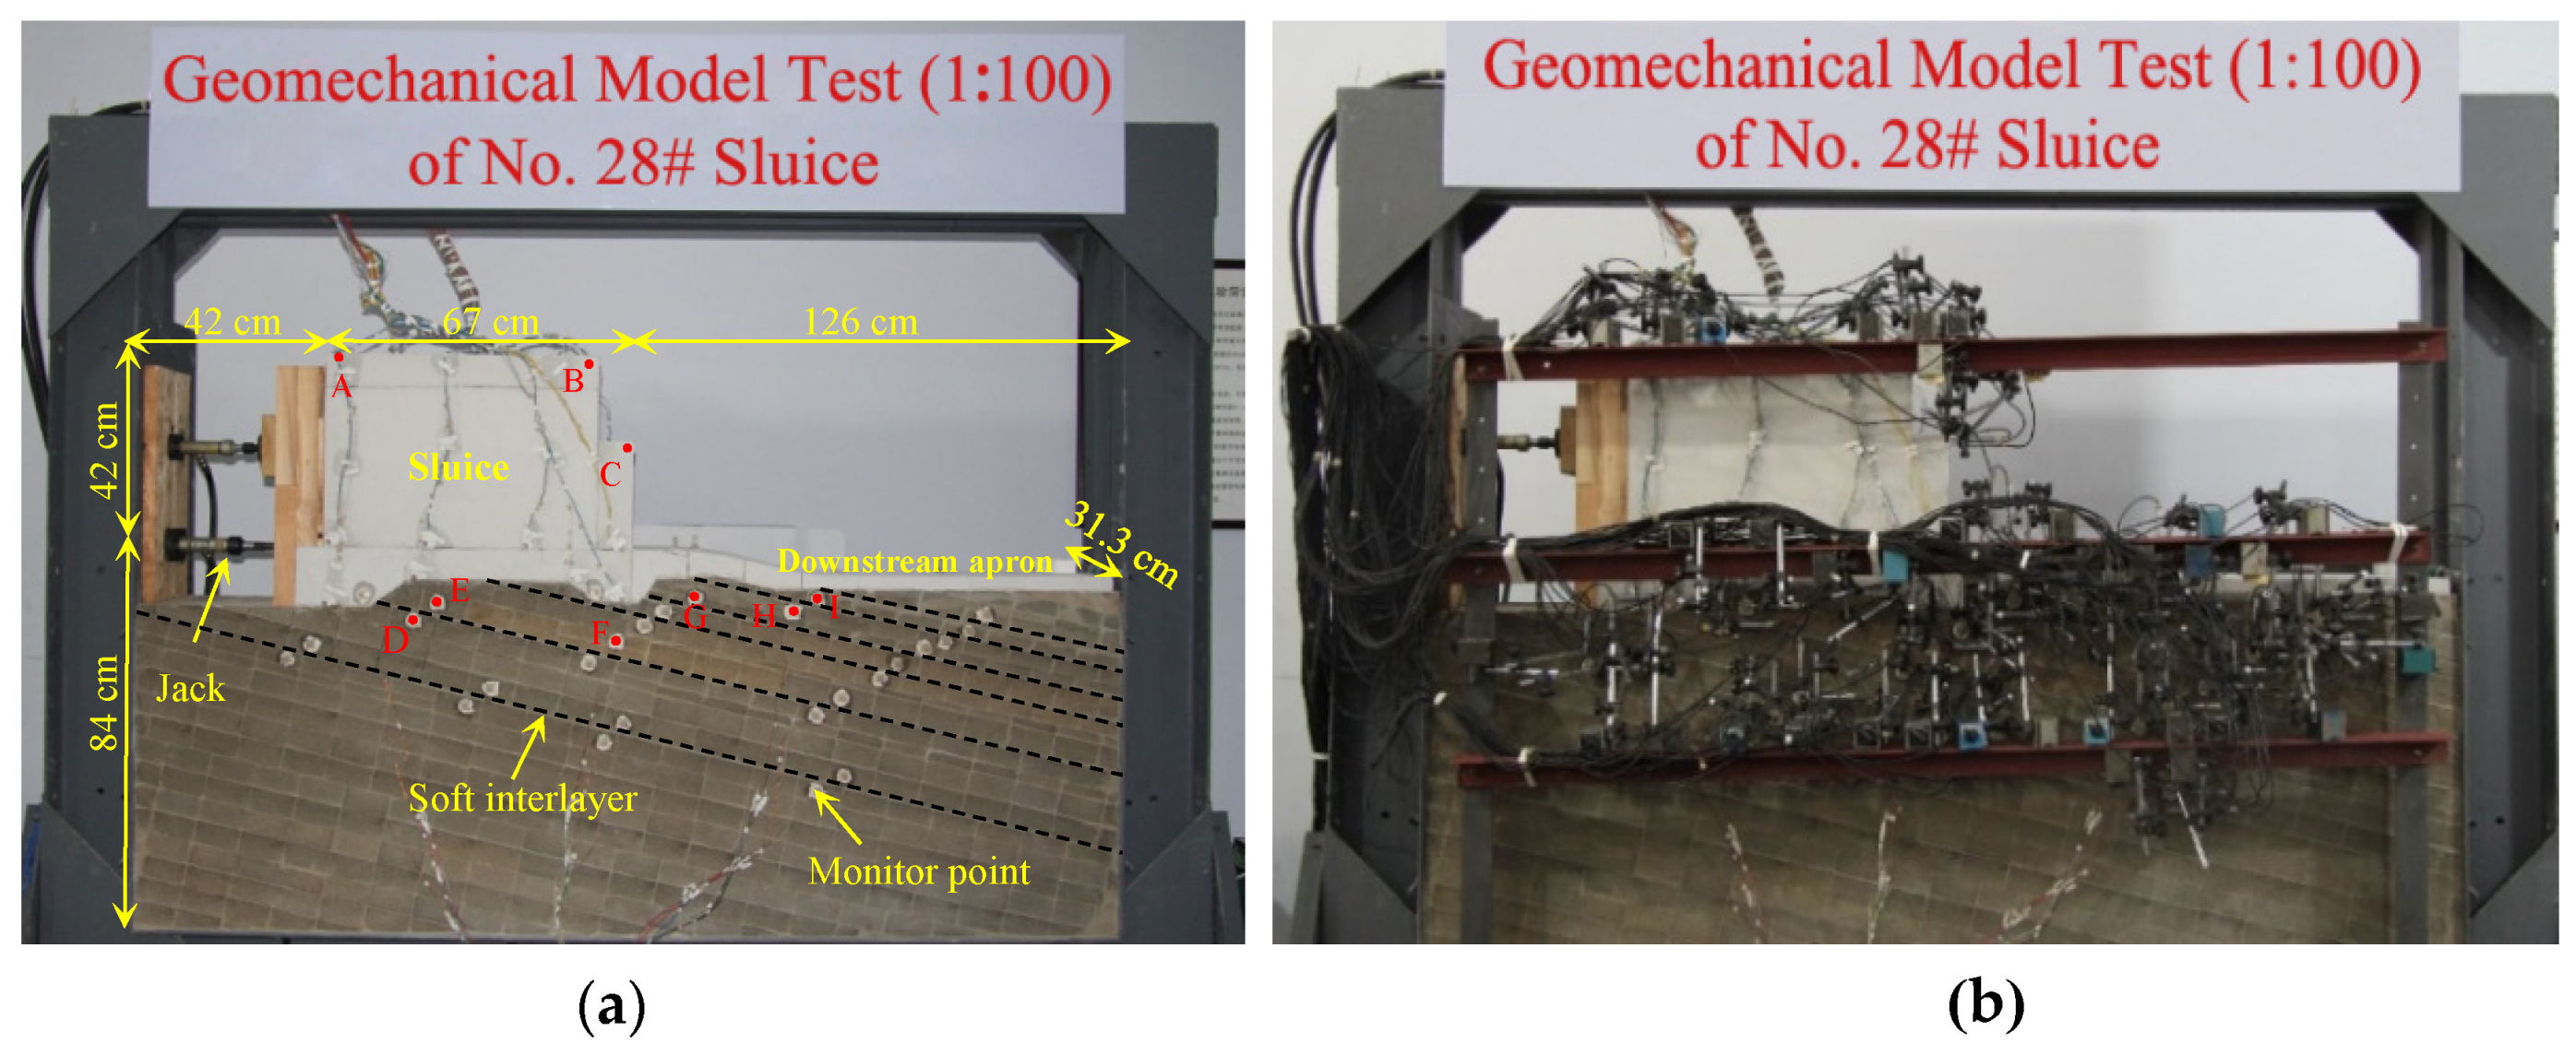
The physical sizes of the sluice and rock masses of the No. 28 sluice are reduced to generate a geomechanical model to study their deformations with an increase in the overload factor. The dimensions of the prototype for the geomechanical model are slightly different from those of the numerical model, i.e., the upstream length and the downward depth are 1.0 and 2.0 times the sluice height. The geomechanical model test is designed and operated according to the similarity principles. The similarity relations between the prototype and the model should be met, which include geometrical and mechanics parameters and the boundary and initial condition. In this study, the geometrical similarity scale of the prototype to the model is set to 100. Considering that one sluice section has a width of 31.3 m (
Figure 3), a geomechanical model measuring 2.35 m × 0.31 m × 1.26 m is produced (
Figure 10). The unit weight
Cγ is set to 1. Then, relevant similarity scales that are essential for geomechanical model generation are derived in
Table 4 according to similarity theory [
42]. The material parameters shown in
Table 3 can be redefined for geomechanical modeling based on the relevant similarity scales. Finally, the results of the geomechanical model test can be converted to actual prototype values.
The materials used for model construction are crucial for generating the geomechanical model and producing acceptable test results. The sluice, downstream apron, and rock masses are composed of barite powder, bentonite, cement, and gypsum powder. Barite powder is used as the weighting material to make the density of the geomechanical model materials equal to that of the prototype materials, and bentonite is used to reduce the Young’s modulus of the material. Cement and gypsum powder are used as the cementing material [
42]. Through the adjustment of the proportions of the above components, model materials with different physical-mechanical parameters can be obtained, respectively (
Table 3). It should be noted that the density of the sluice is slightly raised to incorporate the role of vertical hydrostatic pressure, which will be explained in the Discussion section.
The molds of the sluice and the downstream apron are produced by pouring according to the procedures introduced in Fumagalli [
11]. Consequently, molds are finely carved to the designed shape and dimensions, as shown in
Figure 10. The rock blocks are constructed by small block masonry [
43], with the length of each equaling 10 cm and the height equal to the corresponding soft interlayer spacing.
Structures, i.e., soft interlayers and structural fractures, are much softer and thus crucial for the geomechanical test results. In this test, the cohesive strength of the soft interlayers, which is extremely small, is ignored as a safety buffer. A slice of dewatered gypsum with craft papers is adopted to simulate soft interlayer material [
44]. The other concern is the structural fractures, which are considered perpendicular to the bedding surface and have a spacing of 2 m in superficial layers and 10 m in deep layers in the numerical modeling. A simplification operation is performed in which all the spacing is set to 10 cm (10 m for the prototype) to simplify the masonry work.
Hydrostatic pressure acting on the sluice upstream face is simulated by two hydraulic jacks (
Figure 10a). Two sets of oil pumps and pressure control systems are used to control the pushing forces of the jacks. Similar to in the numerical modeling, the sediment pressure and wave pressure are not considered in the model test. In the process of overloading, the model test performs a step-loading procedure with an incremental load of 0.2
P0 (
P0 denotes the normal hydrostatic pressure).
The deformation development processes of the sluice and foundation are monitored by displacement sensors (
Figure 10b). Forty monitoring points, with different locations as presented in
Figure 10a, are arranged in the model. The displacements in the horizontal and vertical directions of each monitoring point are recorded by a high precision data acquisition system (UCAM-70A, Japan).
4.2. Deformation Analysis
The locations of the selected monitoring points in the geomechanical model are the same as those in the numerical modeling described in
Section 3.3 (
Figure 10a). The relationship between the deformation of the sluice/foundation and the overload factor
KP are investigated. Here, the deformation regulations are the same as those in the numerical modeling.
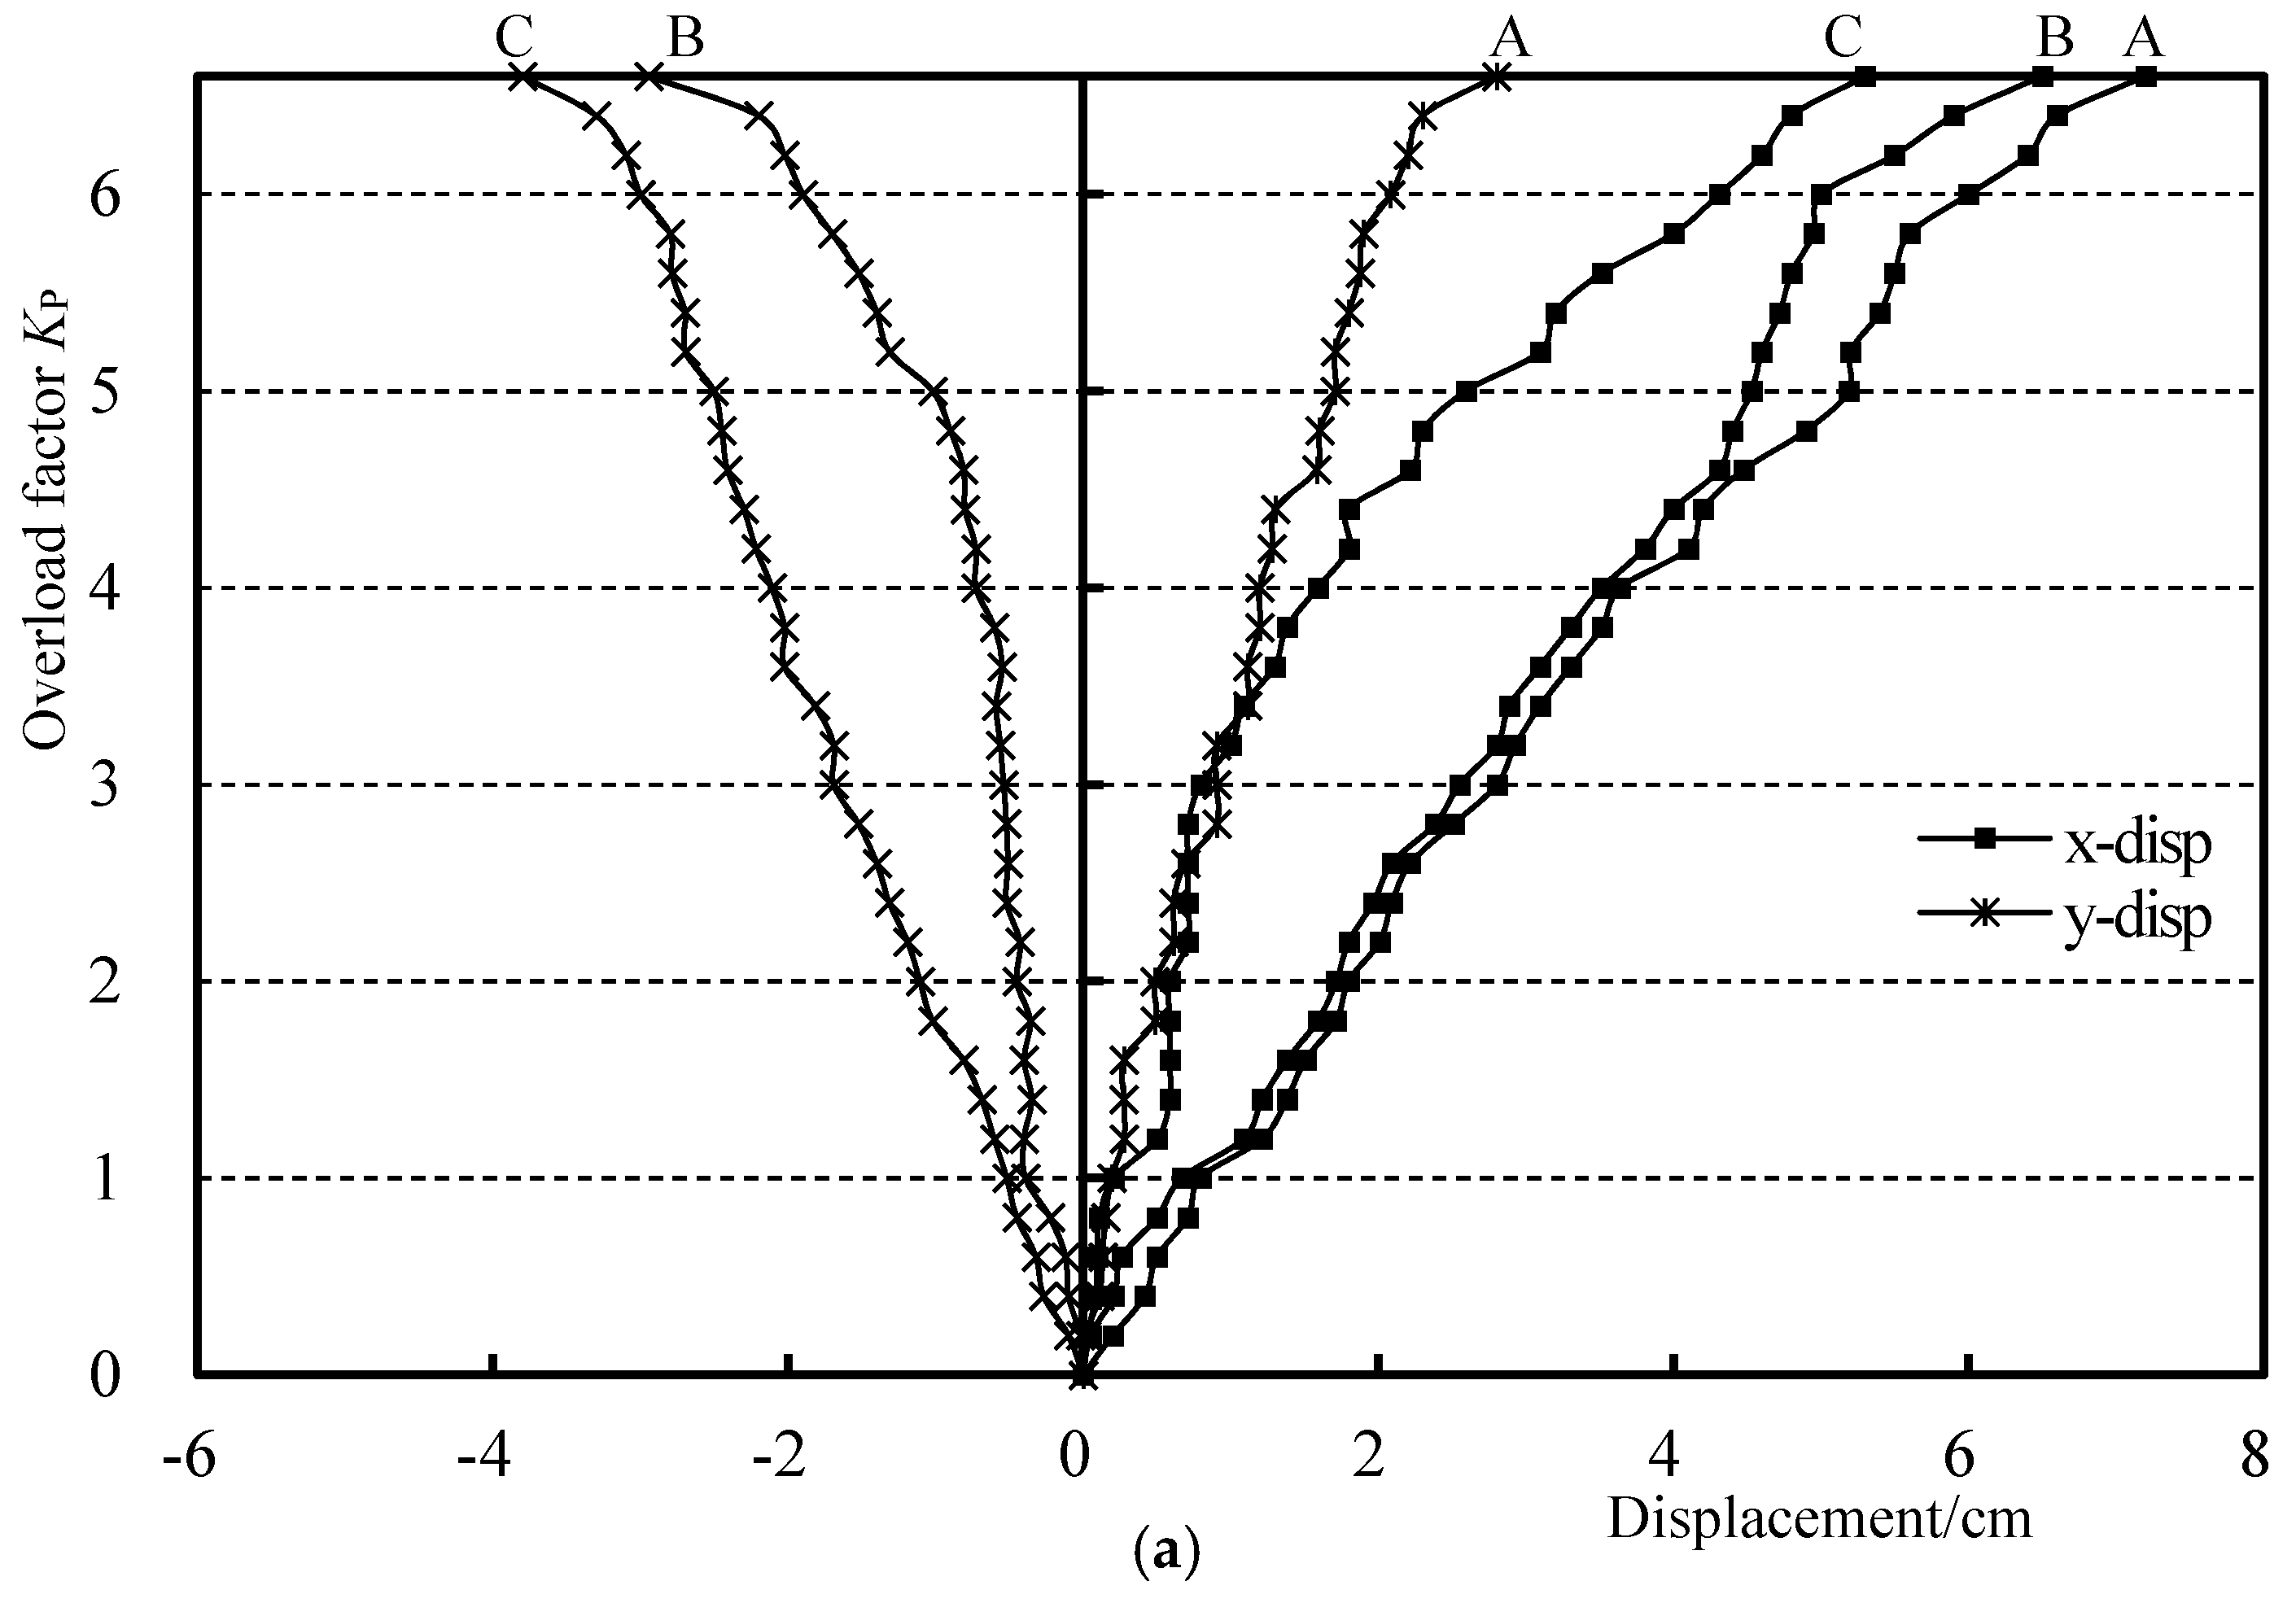
As for the sluice, the horizontal displacements (
Figure 11a) are always positive (downstream direction) subjected to downstream-directed hydrostatic pressures, and the horizontal displacements of the upstream point (A) are larger than those of the downstream points (B and C). Similar to in the results of the numerical modeling, the sluice is also rotated, with positive vertical displacements of the upstream points and negative vertical displacements of the downstream points.
Figure 11b shows the developing process of the horizontal and vertical displacements of the foundation rock masses with
KP values. The horizontal displacements of the monitoring points (D–I) are positive, and they gradually increase with an increase in
KP. When
KP increases from 1.0 to 5.6, the vertical displacements of the monitoring points (D–I) are negative and have been increasing. When
KP is 5.6, an inflection point appears in the vertical displacement curves of the downstream rock masses (points G, H, and I), showing that the vertical displacement values are getting smaller (starting to move up). In the process of overloading, when
KP rises from 5.6 to 6.6, the soft interlayers and the structural fractures gradually open, embodied as gradually increasing cracks.
5. Failure Mechanism Analysis
An overload with a
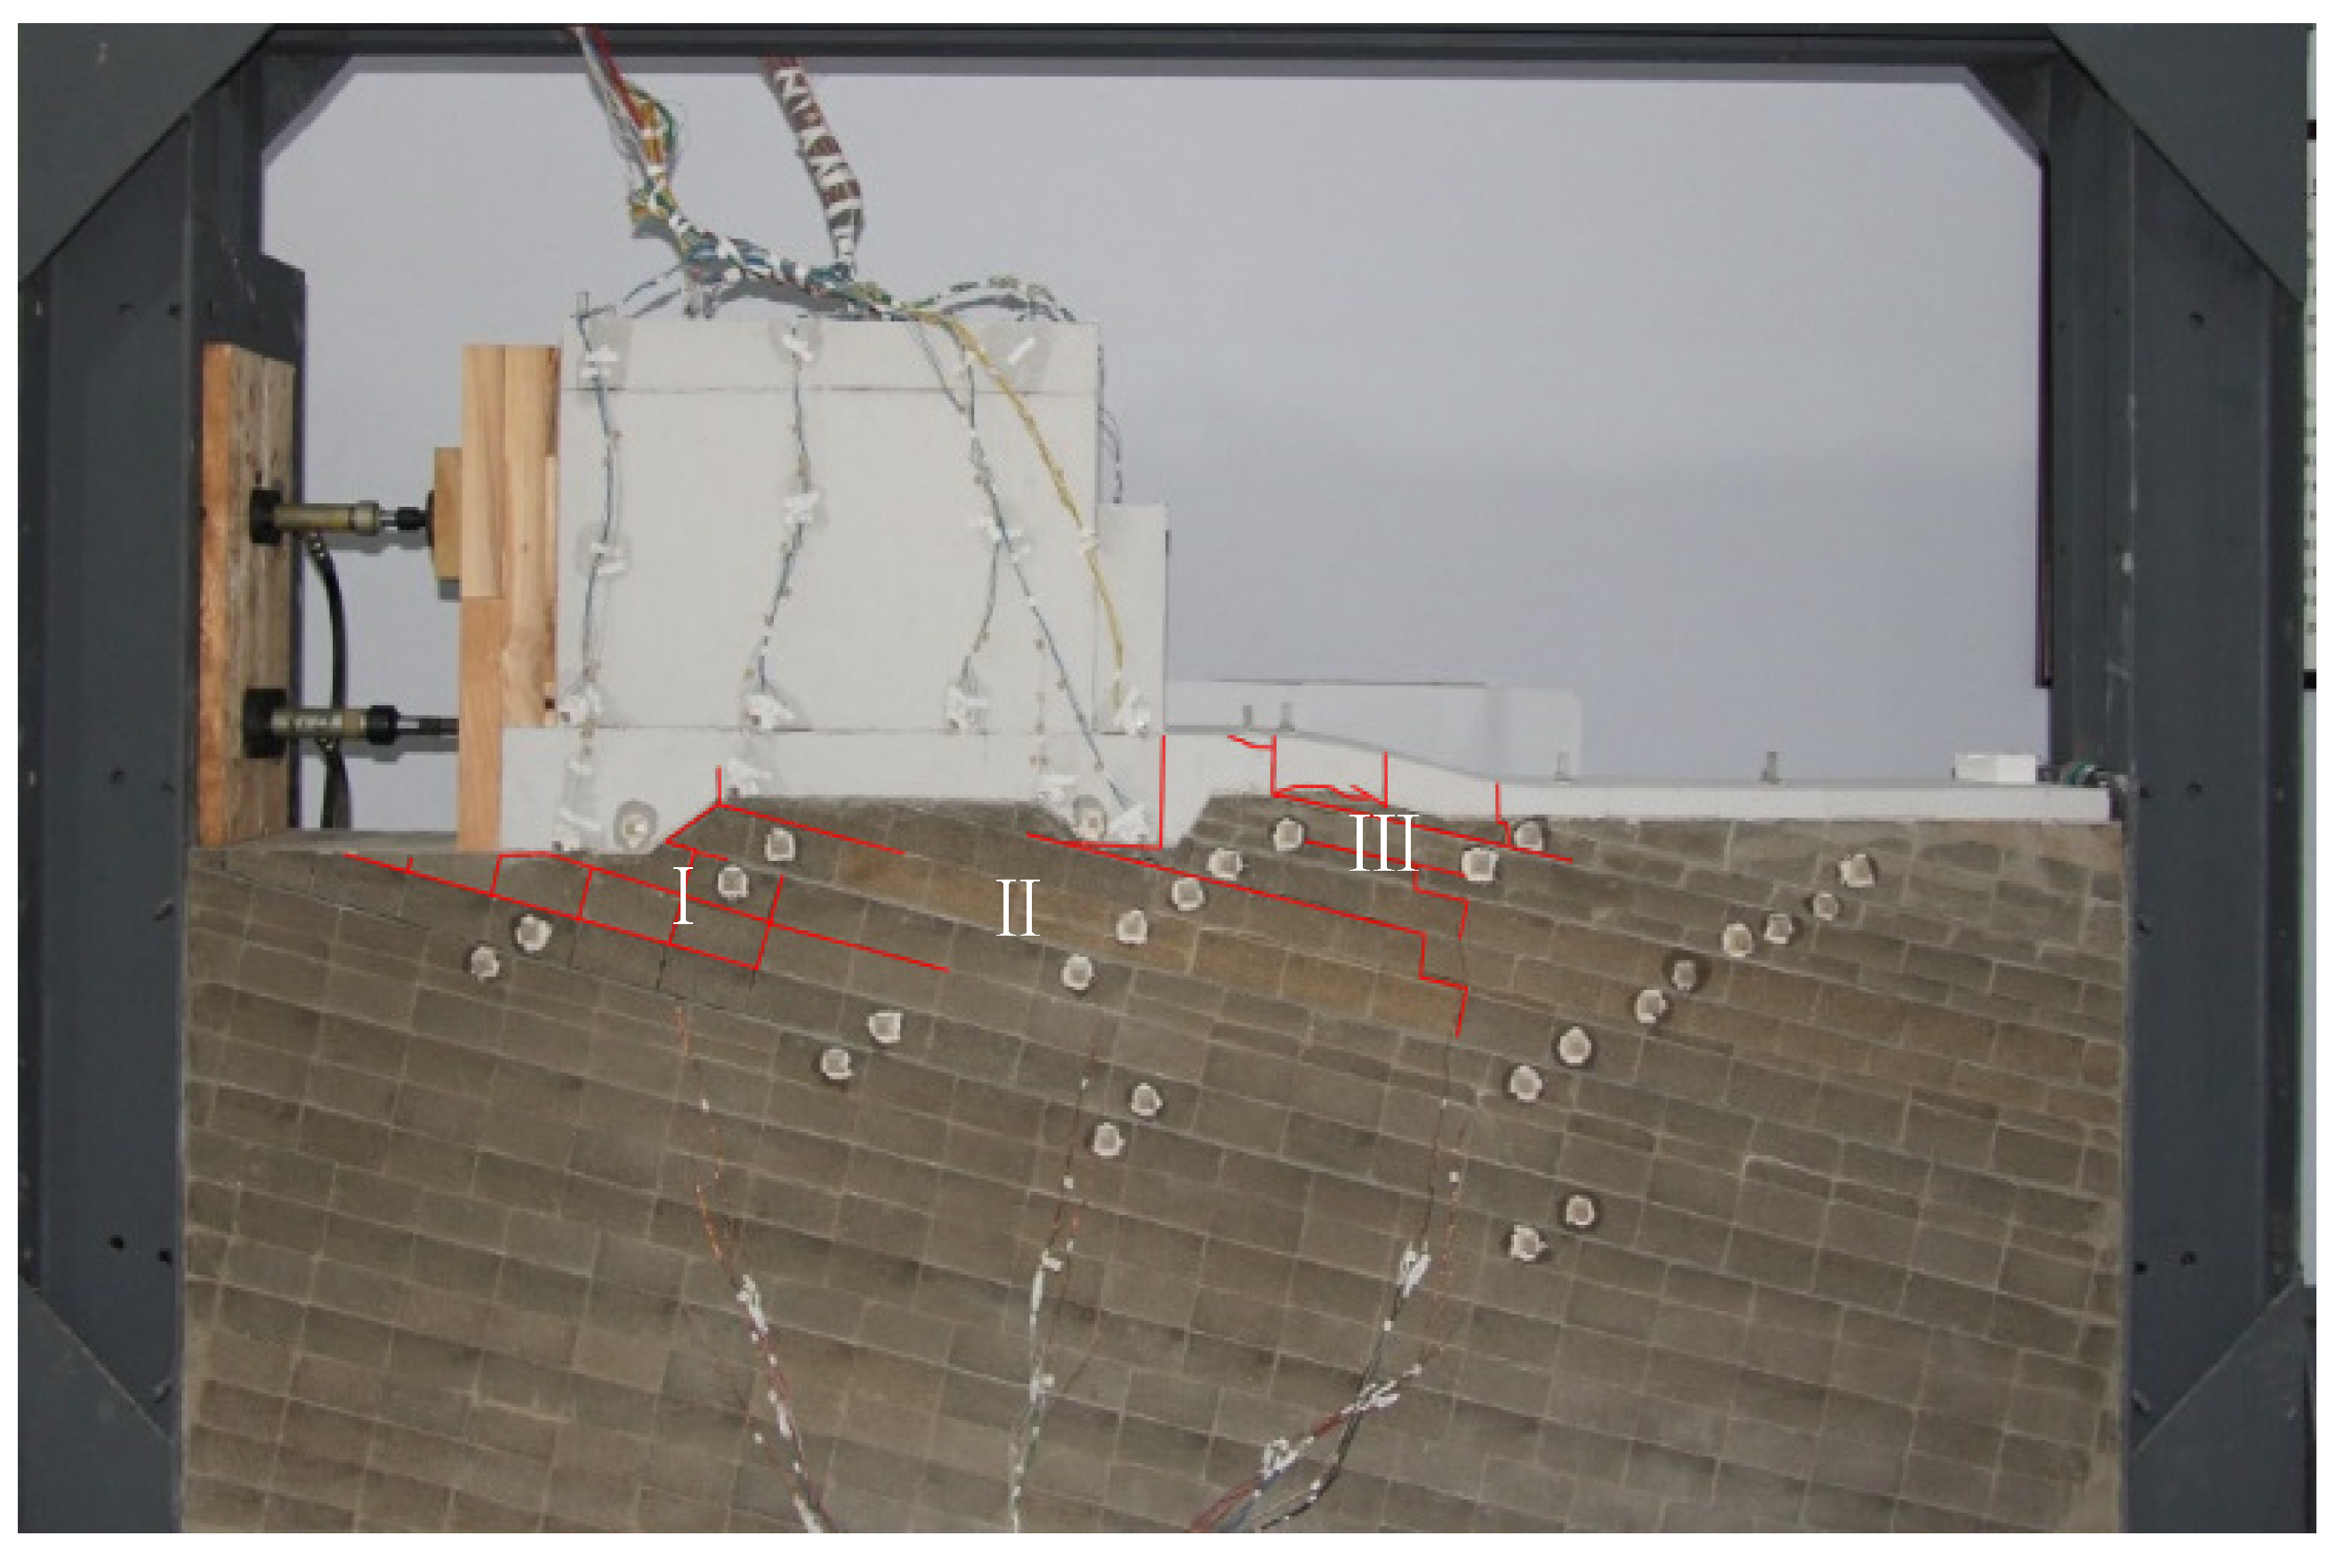
KP equal to 6.6 results in a large number of cracks (
Figure 12). The cracking zones are distributed in rock masses near to the upstream cutoff trench and downstream rock masses close to the sluice. It is likely that an integral shear failure is about to occur along the soft interlayers and the structural fractures. However, a strange area (Zone II in
Figure 12)—which exhibits a lack of cracks and, consequently, separate crack Zones I and III—catches our attention. This phenomenon is contrary to the fact that the shear zone is continuous, which can directly result in an integral failure of the dam foundation. As a result, we suspect that the failure mechanism of this dam foundation is not dominated by the traditional shallow or deep shear mechanism.
The strength reduction method is applied to further ensure the absence of the traditional shear mechanism by carrying out the deformation analysis with gradually reduced shear parameters (i.e., cohesion
cj and internal frictional angle
φj) of the discontinuities (structural fractures and soft interlayers). Points D, F, and H, which are located in different areas in the foundation rock masses, are chosen to exhibit the results of the strength reduction method, which is executed by means of UDEC. The analysis results show that a larger reduction factor results in a greater deformation, as depicted by the horizontal displacement in
Figure 13. A distinct large reduction factor of 10, with the shear strength of discontinuities 0.1 times their original values, results in no significant horizontal displacements. Even a larger reduction factor (e.g., 30) will still not lead to an overall rock mass destruction, which is not described in detail. This is a phenomenon that contradicts the shear mechanism. Meanwhile, the other one arises when we reduce the elastic modulus of the intact rocks and plot it together with the horizontal displacements. The results show that the reduction of the elastic modulus of intact rocks leads to a much larger deformation than that of the shear strengths of the discontinuities (
Figure 13). It is plausible that the rock masses of the sluice are not predominantly affected by shear displacement but are subjected to compression forces leading to intact rock deformation.
Since the shear failure mechanism of the rock dam foundation has already been ruled out, a reasonable mechanism should then be examined. Overload with small
KP values (1.0–7.0 and 1.0–5.6 for numerical method and geomechanical model methods, respectively) results in the negative (downward) vertical displacement of monitoring points (
Figure 8 and
Figure 11) due to the sluice-transmitted compression along the rock layer. Increasing the
KP for different points leads to various deformation development conditions. On the whole, all the points deform downward except those in the downstream rock masses (points G, H, and I), which start moving upward, since
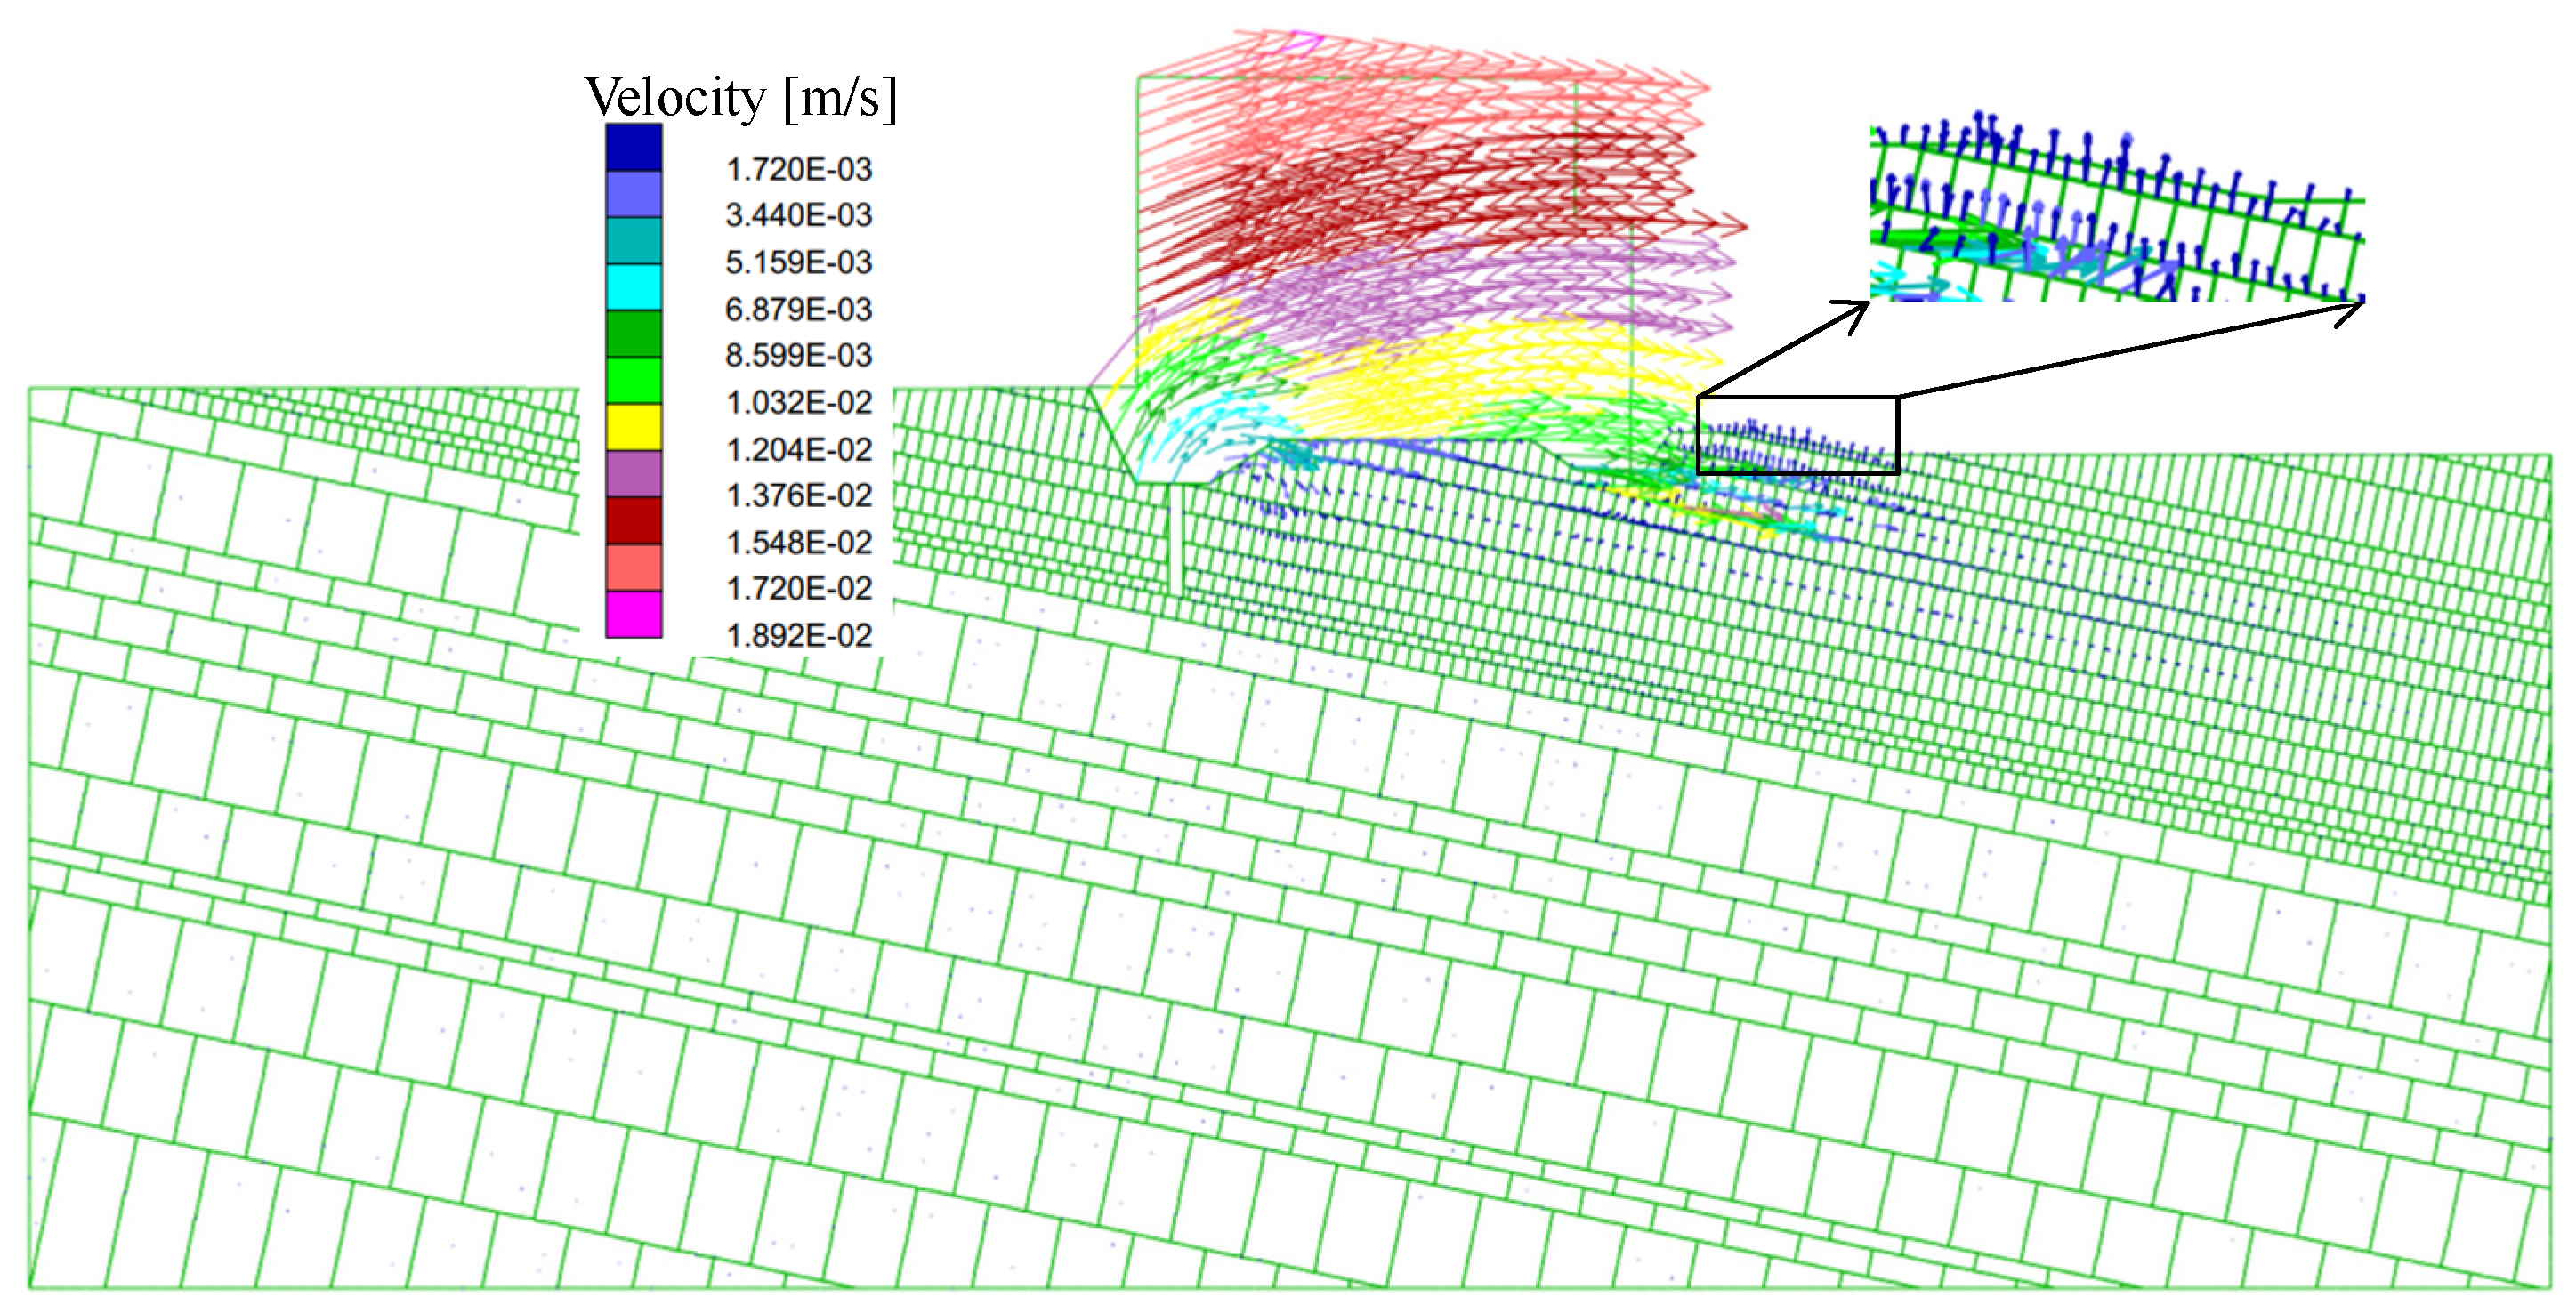
KP is larger than 7.0 and 5.6 for the numerical method and geomechanical model method, respectively. The velocity vector map recorded by the numerical method is further used to depict the deformation of the sluice and the rock masses (
Figure 14). The results in
Figure 14 shows that the sluice has a tendency to rotate, and the rock masses close to the cutoff trench have a tendency to move along the rock layer. Most importantly, the direction of the velocity vector of the downstream rock masses is upward, consistent with the previously described displacement.
Combined with the above analyses, it could be concluded that the pressure transmitted through the sluice results in the compression along the rock layer. This phenomenon causes not only downward displacement components but also expansion in the direction perpendicular to the bedding (upward) due to the Poisson effect. When KP is small, the downward displacements are larger, leading to a downward integral velocity vector. However, the rock masses in a compressive plastic state with a larger Kp rapidly expand, resulting in integral upward displacement. Notably, the expansion of rock masses in the upstream cutoff trench, which are also turned into a compressive plastic state, can hardly be embodied due to the gravity of the sluice. The upward displacements will easily make the downstream rock masses buckled, similarly to the landslide flexural-buckling failure mechanism.
In summary, the rock masses of the dam foundation fractured by gentle through-going and steep structural discontinuities are characterized by upward displacements of the downstream rock masses. Their failure is probably not dominated by the shear mechanism but the buckling mechanism.
6. Discussion
A three-dimensional (3-D) simulation result is an authentic reflection of the practical deformation and destruction of the foundation rock masses [
33,
45]. Although sustained efforts and significant progress have been made, accurate 3-D analysis still seems to be difficult in terms of the current technology level [
46,
47]. The most important reasons for this difficulty come from the uncertainties of the discontinuities and the complexity of he calculation. Only discontinuities in 2-D rock outcrop can be collected; thus, the vast majority of discontinuities are invisible, easily resulting in a large error. However, this error also exists in 2-D analysis, and can be reduced by the elaborative prospecting of the various scales of discontinuities. Due to such a tremendous number of discontinuities, a 3-D calculation is always faced with the dilemma of eliciting a timely result in practical engineering projects, especially involving extremely complex structural fractures [
6]. The present study involves the research of structural fractures, a huge number of which clearly slow down the calculation. Consequently, 3-D analysis becomes extremely difficult or even impossible. Eventually, 2-D analysis is applied in this study; even so, 3-D analysis will be our prospective endeavor.
The modeling results of the numerical method and geomechanical model method, which are regarded as the most important techniques for analyzing foundation rock masses, seem to be coincident with each other. However, there are still a number of discrepancies in their implementation processes, which are mainly embodied by the exerted forces and model configuration. In the light of the difficulty that forces such as those shown in
Figure 7 exerted on the geomechanical model, two hydraulic jacks are applied to exert converted horizontal hydrostatic pressures, and the vertical hydrostatic pressures are added to the sluice gravity. In addition, the seepage forces are not considered in the geomechanical model due to the absence of currently available devices. The discrepancies related to the model configuration are embodied by the upstream model size, the downstream apron, and the structure spacing. The upstream model extends to 3.5 times the sluice height so as to accomplish seepage and hydro-mechanical coupling analyses in the numerical modeling. On the other hand, the absence of seepage analysis in the geomechanical model causes the upstream length to be 1.0 times the sluice height. Deep rock masses have little influence on stability; thus, the downward depth extends to 2.0 times the sluice height in the geomechanical model. The downstream apron, a facility for protecting the river bed from water erosion, is not considered in the numerical method because it always serves as a safety reserve in practical engineering projects. However, the geomechanical model considers this apron as a necessary component part for reconstructing the sluice structures. Possible errors resulting from the inconsistent spacing can be reduced or eliminated by placing the structural fractures in the downstream cutoff trench and dam toe because the deformation and destruction of the rock foundation easily occur there. Nonetheless, despite the abovementioned differences, the failure mechanism reflected by two methods is consistent. That is, the failure mechanism of the No. 28 dam foundation is not a traditional shallow or deep shear failure but a buckling failure mechanism.
7. Conclusions
This study takes the Datengxia Hydropower Station, which is a primary project of the Chinese Ministry of Water Resources for 2016–2020, as a research object. Specifically, the failure mechanism of the rock masses of the sluice, which is an important part of the main dam, is researched via adopting the numerical method and geomechanical model method. Consequently, a new failure mechanism (buckling) for the dam foundations is deduced. The main conclusions are as follows.
(1) The buckling failure mechanism is prone to occurring in a type of geological structure characterized by a combination of gentle through-going and steep structural discontinuities. The former is characterized by soft interlayers, bedding surfaces, or faults, and the latter are always structural fractures. This type of failure mechanism is manifested by the fact that the failure is not predominantly affected by shear displacement but is subjected to compression forces leading to intact rock deformation and upward displacements of downstream rock masses. Therefore, the crack zones are disconnected, and the shear parameters of the discontinuities have much less influence on the foundation deformation and mechanical characteristics than the rock modulus.
(2) The synthetic application of the numerical method and geomechanical model method can efficiently determine the failure mechanism of the rock dam foundation. The geological conditions of the rock dam foundation are highly complicated, and simplification for the geomechanical model is inevitable. However, the geomechanical model method can provide a fundamental means for qualitatively analyzing the failure mechanism, which is meaningful when combined with the numerical method. Therefore, these two means could be capable of verifying each other to some extent.
The 2-D analysis used in this study is an efficient means, which is especially applicable to practical engineering projects involving complex structural fractures. However, the 3-D approach, whose accuracy can be improved by means of refining the structure prospection and computer algorithm/efficiency, is still of great importance. This approach will be the direction for our future efforts.
Author Contributions
Conceptualization, D.C. and H.C.; methodology, D.C.; software, D.C. and B.S.; validation, D.C., J.C. and W.Z.; formal analysis, D.C. and J.C.; investigation, C.T. and Z.M.; resources, C.T. and Z.M.; data curation, W.Z.; writing—original draft preparation, D.C.; writing—review and editing, H.C. and W.Z; visualization, J.C.; supervision, W.Z.; project administration, W.Z.; funding acquisition, W.Z. All authors have read and agreed to the published version of the manuscript.
Funding
This work is supported by the National Nature Science Foundation of China (Grant numbers: 41877220), the National Key Research and Development Plan (Grant numbers: 2017YFC1501000), and the National Nature Key Science Program Foundation (Grant numbers: 41330636).
Acknowledgments
We want to thank the anonymous reviewers for their valuable comments for the revised version of this paper.
Conflicts of Interest
The authors declare no conflict of interest.
References
- Sun, G.; Lin, S.; Cheng, S.; Sui, T.; Li, C.; Zheng, H. Mechanisms of Interaction between an Arch Dam and Abutment Slope Using Physical Model Tests. Rock Mech. Rock Eng. 2018, 51, 2483–2504. [Google Scholar] [CrossRef]
- Wang, S.; Gu, C.; Bao, T. Safety Monitoring Index of High Concrete Gravity Dam Based on Failure Mechanism of Instability. Math. Probl. Eng. 2013, 2013, 1–14. [Google Scholar] [CrossRef]
- Hou, M.X.; Ge, X.R. Stability Analyses of the Three Gorges Dam Foundation against Sliding by Strength Reduction of Finite Elements. Key Eng. Mater. 2007, 340–341, 1315–1320. [Google Scholar] [CrossRef]
- Zhou, W.; Chang, X.; Zhou, C.; Liu, X. Failure analysis of high-concrete gravity dam based on strength reserve factor method. Comput. Geotech. 2008, 35, 627–636. [Google Scholar]
- Chen, Y.; Zhang, L.; Yang, G.; Dong, J.; Chen, J. Anti-sliding stability of a gravity dam on complicated foundation with multiple structural planes. Int. J. Rock Mech. Min. 2012, 55, 151–156. [Google Scholar] [CrossRef]
- Liu, J.; Feng, X.; Ding, X.; Zhang, J.; Yue, D. Stability assessment of the Three-Gorges Dam foundation, China, using physical and numerical modeling—Part I: Physical model tests. Int. J. Rock Mech. Min. 2003, 40, 609–631. [Google Scholar] [CrossRef]
- Bao, T.; Xu, B.; Zheng, X. Hybrid method of limit equilibrium and finite element internal force for analysis of arch dam stability against sliding. Sci. China Technol. Sci. 2011, 54, 793–798. [Google Scholar] [CrossRef]
- Bretas, E.M.; Léger, P.; Lemos, J.V. 3D stability analysis of gravity dams on sloped rock foundations using the limit equilibrium method. Comput. Geotech. 2012, 44, 147–156. [Google Scholar] [CrossRef]
- Zhou, X.P.; Cheng, H. Analysis of stability of three-dimensional slopes using the rigorous limit equilibrium method. Eng. Geol. 2013, 160, 21–33. [Google Scholar] [CrossRef]
- Feng, F.; Zhang, G.X. Deep Anti-Sliding Stability of Wudu RCC Gravity Dam. Adv. Mater. Res. 2012, 446–449, 2776–2782. [Google Scholar] [CrossRef]
- Fumagalli, E. Stability of Arch Dam Rock Abutments. In Proceedings of the first ISRM Congress, Lisbon, Portugal, 25 September–1 October 1966; pp. 503–508. [Google Scholar]
- Lin, P.; Shi, J.; Zhou, W.; Wang, R. 3D geomechanical model tests on asymmetric reinforcement and overall stability relating to the Jinping I super-high arch dam. Int. J. Rock Mech. Min. 2018, 102, 28–41. [Google Scholar] [CrossRef]
- Lin, P.; Zhou, W.; Liu, H. Experimental Study on Cracking, Reinforcement, and Overall Stability of the Xiaowan Super-High Arch Dam. Rock Mech. Rock Eng. 2015, 48, 819–841. [Google Scholar] [CrossRef]
- Song, Z.; Liu, Y.; Yang, Q. Experimental and numerical investigation on the stability of a high arch dam with typical problems of nonsymmetry: Baihetan Dam, China. Bull. Eng. Geol. Environ. 2016, 75, 1555–1570. [Google Scholar] [CrossRef]
- Mouyeaux, A.; Carvajal, C.; Bressolette, P.; Peyras, L.; Breul, P.; Bacconnet, C. Probabilistic stability analysis of an earth dam by Stochastic Finite Element Method based on field data. Comput. Geotech. 2018, 101, 34–47. [Google Scholar] [CrossRef]
- Rohaninejad, M.; Zarghami, M. Combining Monte Carlo and finite difference methods for effective simulation of dam behavior. Adv. Eng. Softw. 2012, 45, 197–202. [Google Scholar] [CrossRef]
- Zhong, Q.M.; Chen, S.S.; Mei, S.A.; Cao, W. Numerical simulation of landslide dam breaching due to overtopping. Landslides 2018, 15, 1183–1192. [Google Scholar] [CrossRef]
- Cabrera, M.; Senent, S.; Olalla, C.; Jimenez, R. Sliding stability analysis of gravity dam founded on rock mass with impersistent joint set. Can. Geotech. J. 2015, 52, 1668–1684. [Google Scholar] [CrossRef]
- Zhang, Q.; Wang, Z.; Xia, X. Interface stress element method and its application in analysis of anti-sliding stability of gravity dam. Sci. China Technol. Sci. 2012, 55, 3285–3291. [Google Scholar] [CrossRef]
- Bretas, E.M.; Lemos, J.V.; Lourenço, P.B. Hydromechanical Analysis of Masonry Gravity Dams and their Foundations. Rock Mech. Rock Eng. 2013, 46, 327–339. [Google Scholar] [CrossRef]
- Duan, Y.; He, Y.; Wang, H.; Lu, S.; Lai, G.; Chang, X. Study on failure process of gravity dam along interface between dam and foundation with theory of real shear strength. Eng. J. Wuhan Univ. 1999, 32, 13–18. [Google Scholar]
- Gens, A.; Alonso, E.E. Aznalco´llar dam failure. Part 2: Stability conditions and failure mechanism. Geotechnique 2006, 3, 185–201. [Google Scholar] [CrossRef]
- Su, H.; Hu, J.; Li, J.; Wu, Z. Deep Stability Evaluation of High-Gravity Dam under Combining Action of Powerhouse and Dam. Int. J. Geomech. 2013, 13, 257–272. [Google Scholar] [CrossRef]
- Cruden, D.M.; Hu, X. Buckling deformation in the Highwood Pass, Alberta, Canada. Can. Geotech. J. 1993, 30, 276–286. [Google Scholar]
- Qin, S.; Jiao, J.J.; Wang, S. A Cusp Catastrophe Model of Instability of Slip-buckling Slope. Rock Mech. Rock Eng. 2001, 34, 119–134. [Google Scholar] [CrossRef]
- Kulatilake, P.H.S.W.; Wu, T.H. Sampling bias on orientation of discontinuities. Rock Mech. Rock Eng. 1984, 17, 243–253. [Google Scholar] [CrossRef]
- Song, J.; Lee, C. Estimation of joint length distribution using window sampling. Int. J. Rock Mech. Min. 2001, 38, 519–528. [Google Scholar] [CrossRef]
- Shanley, R.J.; Mahtab, M.A. Delineation and analysis of clusters in orientation data. J. Int. Assoc. Math. Geol. 1976, 8, 9–23. [Google Scholar] [CrossRef]
- Vorobiev, O. Discrete and continuum methods for numerical simulations of non-linear wave propagation in discontinuous media. Int. J. Numer. Meth. Eng. 2010, 83, 482–507. [Google Scholar] [CrossRef]
- Zhao, X.B.; Zhao, J.; Cai, J.G.; Hefny, A.M. UDEC modelling on wave propagation across fractured rock masses. Comput. Geotech. 2008, 35, 97–104. [Google Scholar] [CrossRef]
- Lian, J.; Li, Q.; Deng, X.; Zhao, G.; Chen, Z. A Numerical Study on Toppling Failure of a Jointed Rock Slope by Using the Distinct Lattice Spring Model. Rock Mech. Rock Eng. 2018, 51, 513–530. [Google Scholar] [CrossRef]
- Itasca. UDEC-Universal Distinct Element Code; Itasca Consulting Group, Inc.: Minneapolis, MI, USA, 2014. [Google Scholar]
- Bondarchuk, A.; Ask, M.V.S.; Dahlström, L.O.; Nordlund, E. Rock Mass Behavior Under Hydropower Embankment Dams: A Two-Dimensional Numerical Study. Rock Mech. Rock Eng. 2012, 45, 819–835. [Google Scholar] [CrossRef]
- Cheng, G.; Chen, C.; Li, L.; Zhu, W.; Yang, T.; Dai, F.; Ren, B. Numerical modelling of strata movement at footwall induced by underground mining. Int. J. Rock Mech. Min. 2018, 108, 142–156. [Google Scholar] [CrossRef]
- Gao, F.Q.; Stead, D. The application of a modified Voronoi logic to brittle fracture modelling at the laboratory and field scale. Int. J. Rock. Mech. Min. 2014, 68, 1–14. [Google Scholar] [CrossRef]
- García, M.; Pastén, C.; Sepúlveda, S.A.; Montalva, G.A. Dynamic numerical investigation of a stepped-planar rockslide in the Central Andes, Chile. Eng. Geol. 2018, 237, 64–75. [Google Scholar] [CrossRef]
- Zheng, Y.; Chen, C.; Liu, T.; Zhang, H.; Xia, K.; Liu, F. Study on the mechanisms of flexural toppling failure in anti-inclined rock slopes using numerical and limit equilibrium models. Eng. Geol. 2018, 237, 116–128. [Google Scholar] [CrossRef]
- Shang, Y. The ways of determining boundary conditions in geomechanical numerical simulation. Chin. J. Rock Mech. Eng. 1999, 18, 201–204. [Google Scholar]
- Alejano, L.R.; Ferrero, A.M.; Ramírez-Oyanguren, P.; Álvarez Fernández, M.I. Comparison of limit-equilibrium, numerical and physical models of wall slope stability. Int. J. Rock Mech. Min. 2011, 48, 16–26. [Google Scholar] [CrossRef]
- Li, Z.; Wang, J.; Li, L.; Wang, L.; Liang, R.Y. A case study integrating numerical simulation and GB-InSAR monitoring to analyze flexural toppling of an anti-dip slope in Fushun open pit. Eng. Geol. 2015, 197, 20–32. [Google Scholar] [CrossRef]
- Gui, Y.; Bui, H.H.; Kodikara, J. An application of a cohesive fracture model combining compression, tension and shear in soft rocks. Comput. Geotech. 2015, 66, 142–157. [Google Scholar] [CrossRef]
- Chen, Y.; Zhang, L.; Yang, B.; Dong, J.; Chen, J. Geomechanical model test on dam stability and application to Jinping High arch dam. Int. J. Rock Mech. Min. 2015, 76, 1–9. [Google Scholar] [CrossRef]
- Liu, Y.R.; Guan, F.H.; Yang, Q.; Yang, R.Q.; Zhou, W.Y. Geomechanical model test for stability analysis of high arch dam based on small blocks masonry technique. Int. J. Rock Mech. Min. 2013, 61, 231–243. [Google Scholar] [CrossRef]
- Zhang, L.; Liu, Y.R.; Yang, Q. Evaluation of Reinforcement and Analysis of Stability of a High-Arch Dam Based on Geomechanical Model Testing. Rock Mech. Rock Eng. 2015, 48, 803–818. [Google Scholar] [CrossRef]
- Leshchinsky, D.; Baker, R. Three-dimensional slope stability: End effects. Soils Found. 1986, 26, 98–110. [Google Scholar] [CrossRef]
- Sun, G.; Zheng, H.; Liu, D. A three-dimensional procedure for evaluating the stability of gravity dams against deep slide in the foundation. Int. J. Rock Mech. Min. 2011, 48, 421–426. [Google Scholar] [CrossRef]
- Ganji, H.T.; Alembagheri, M. Stability of Monolithic Gravity Dam Located on Heterogeneous Rock Foundation. Arab J. Sci. Eng. 2018, 43, 1777–1793. [Google Scholar] [CrossRef]
Figure 1.
Location and surrounding topography of the study area: (a) geographic location of Datengxia Hydropower Station; (b) topography around the main dam; (c) positional relationship between the main dam and the sluice.
Figure 1.
Location and surrounding topography of the study area: (a) geographic location of Datengxia Hydropower Station; (b) topography around the main dam; (c) positional relationship between the main dam and the sluice.
Figure 2.
Main lithology types and soft interlayer in the rock masses of the sluice foundation: (a) exposed sedimentary rocks; (b) a soft interlayer exposed by drilling exploration.
Figure 2.
Main lithology types and soft interlayer in the rock masses of the sluice foundation: (a) exposed sedimentary rocks; (b) a soft interlayer exposed by drilling exploration.
Figure 3.
Unfolded image of fractures and faults of sluice rock masses.
Figure 3.
Unfolded image of fractures and faults of sluice rock masses.
Figure 4.
Geological structures in rock masses of No. 28 sluice: (a) geological profile of No. 28 sluice; (b) stratigraphic boundary between D1y1-3 and D1y1-2; (c) stratigraphic boundary between D1y1-2 and D1y1-1; (d) D1n13-2 with a soft interlayer.
Figure 4.
Geological structures in rock masses of No. 28 sluice: (a) geological profile of No. 28 sluice; (b) stratigraphic boundary between D1y1-3 and D1y1-2; (c) stratigraphic boundary between D1y1-2 and D1y1-1; (d) D1n13-2 with a soft interlayer.
Figure 5.
Data acquisition for fractures in downstream rock masses: (a) collection area in the field; (b) 2-D trace maps of fractures in D1y1-3; (c) 2-D trace maps of fractures in D1y1-2; (d) 2-D trace maps of fractures in D1y1-1; (e) 2-D trace maps of fractures in D1n13-3.
Figure 5.
Data acquisition for fractures in downstream rock masses: (a) collection area in the field; (b) 2-D trace maps of fractures in D1y1-3; (c) 2-D trace maps of fractures in D1y1-2; (d) 2-D trace maps of fractures in D1y1-1; (e) 2-D trace maps of fractures in D1n13-3.
Figure 6.
Contours of fracture orientation poles.
Figure 6.
Contours of fracture orientation poles.
Figure 7.
Numerical model and boundary condition of No. 28 sluice.
Figure 7.
Numerical model and boundary condition of No. 28 sluice.
Figure 8.
Displacement curves for monitoring points with overload factor KP: (a) sluice displacement and (b) foundation displacement.
Figure 8.
Displacement curves for monitoring points with overload factor KP: (a) sluice displacement and (b) foundation displacement.
Figure 9.
Plastic zone distribution at different KP values.
Figure 9.
Plastic zone distribution at different KP values.
Figure 10.
Overall view of geomechanical model for No. 28 sluice: (a) construction in geomechanical model; (b) monitor equipment.
Figure 10.
Overall view of geomechanical model for No. 28 sluice: (a) construction in geomechanical model; (b) monitor equipment.
Figure 11.
Displacement curves with different overload factor KP values: (a) sluice displacement curves and (b) foundation displacement curves.
Figure 11.
Displacement curves with different overload factor KP values: (a) sluice displacement curves and (b) foundation displacement curves.
Figure 12.
Cracking status of the geomechanical model when KP is 6.5.
Figure 12.
Cracking status of the geomechanical model when KP is 6.5.
Figure 13.
Displacement curves with different reduction factors.
Figure 13.
Displacement curves with different reduction factors.
Figure 14.
Velocity vector map when Kp is 8.0.
Figure 14.
Velocity vector map when Kp is 8.0.
Table 1.
Grouping results for collected fracture in the field.
Table 1.
Grouping results for collected fracture in the field.
| Strata | Fracture Set | Fracture Number | Dip Direction (°) | Dip Angle (°) |
|---|
| D1y1-3 | 1 | 158 | 298 | 79 |
| 2 | 119 | 200 | 82 |
| D1y1-2 | 1 | 308 | 294 | 81 |
| 2 | 82 | 212 | 82 |
| D1y1-1 | 1 | 33 | 299 | 78 |
| 2 | 17 | 208 | 80 |
| D1n13-3 | 1 | 31 | 305 | 79 |
| 2 | 19 | 213 | 80 |
Table 2.
Material parameters of intact blocks.
Table 2.
Material parameters of intact blocks.
| Number | Density,
ρ (g/cm3) | Elastic Modulus,
E (GPa) | Poisson’s Ratio,
λ | Friction Coefficient,
φ (°) | Cohesion,
c (MPa) | Tensile Strength,
σt (MPa) |
|---|
| Sluice | 2.4 | 25.5 | 0.2 | 54.8 | 3.18 | 1.54 |
| D1y1-3 | 2.82 | 5.0 | 0.28 | 40.7 | 0.82 | 1.58 |
| D1y1-2 | 2.82 | 8.0 | 0.26 | 41.3 | 0.85 | 1.58 |
| D1y1-1 | 2.79 | 5 | 0.28 | 40.4 | 0.8 | 4.26 |
| D1n13-3 | 2.75 | 5 | 0.26 | 39.0 | 0.79 | 6.1 |
| D1n13-2 | 2.77 | 6 | 0.28 | 48.0 | 1.45 | 7 |
| D1n13-1 | 2.73 | 8 | 0.26 | 50.9 | 1.63 | 5 |
| D1n12 | 2.69 | 9 | 0.26 | 52.2 | 1.72 | 6.5 |
Table 3.
Material parameters of the discontinuities.
Table 3.
Material parameters of the discontinuities.
| Type | Normal Stiffness,
kn
(Pa/m) | Shear Stiffness, ks
(Pa/m) | Friction Angle, φj
(°) | Cohesion cj
(Pa) | Tensile Strength,
σtj
(Pa) | Permeability Factor,
kj
(Pa−1s−1) | Aperture at Zero Normal Stress, a0
(m) | Residual Aperture, ares
(m) |
|---|
| Structural fractures | 4.2 × 10¹¹ | 4.2 × 10¹⁰ | 26.5 | 0 | 0 | 83.3 | 2 × 10⁻³ | 1 × 10⁻³ |
| Soft interlayers (D1y1-2–D1y1-3) | 4.0 × 10¹¹ | 4.0 × 10¹⁰ | 16.7 | 3 × 10⁴ | 0 | 83.3 | 3 × 10⁻³ | 1.5 × 10⁻³ |
| Soft interlayers (D1y1-1) | 3.2 × 10¹¹ | 3.2 × 10¹⁰ | 17.7 | 4 × 10⁴ | 0 | 83.3 | 3 × 10⁻³ | 1.5 × 10⁻³ |
| Soft interlayers (D1n13-1–D1n13-3) | 3.9 × 10¹¹ | 3.9 × 10¹⁰ | 15.6 | 2 × 10⁴ | 0 | 83.3 | 2 × 10⁻³ | 1 × 10⁻³ |
| Soft interlayers (D1n12) | 5.5 × 10¹¹ | 5.5 × 10¹⁰ | 14.5 | 1.5 × 10⁴ | 0 | 83.3 | 2 × 10⁻³ | 1 × 10⁻³ |
Table 4.
Similarity scales of geomechanical model.
Table 4.
Similarity scales of geomechanical model.
| Geometric Dimensions | Unit
Weight | Young’s
Modulus | Stress | Strain | Displacement | Cohesion | Friction
Coefficient | Shear Strength | Poisson’s Ratio |
|---|
| CL | Cγ | CE | Cσ | Cε | Cu | Cc | Cf | Cτ | Cμ |
| 100 | 1 | 100 | 100 | 1 | 100 | 100 | 1 | 100 | 1 |
© 2020 by the authors. Licensee MDPI, Basel, Switzerland. This article is an open access article distributed under the terms and conditions of the Creative Commons Attribution (CC BY) license (http://creativecommons.org/licenses/by/4.0/).

 ,
, 


