Article

Assessing the Potential of Short Sea Shipping and the Benefits in Terms of External Costs: Application to the Mediterranean Basin

Department of Enterprise Engineering, University of Rome Tor Vergata, 00118 Rome, Italy
*
Author to whom correspondence should be addressed.
Sustainability 2020, 12(13), 5383; https://doi.org/10.3390/su12135383
Submission received: 29 May 2020 / Revised: 25 June 2020 / Accepted: 27 June 2020 / Published: 3 July 2020
(This article belongs to the Special Issue Feature Papers in Sustainable Transportation Models and Applications)

Abstract

:
The paper aims to investigate short sea shipping services as a competitive, sustainable freight transport system which is able to respond to economic, social and environmental needs. An assessment methodology is proposed which considers an aggregate discrete choice model, simulating the split between the competitive transport alternatives in the Mediterranean basin. The proposed methodology was used to assess the potential of short sea shipping (SSS) and the net benefits deriving from lower external costs in the north-western Mediterranean basin. Two future scenarios are considered: introduction of new SSS services as envisaged by current EU projects and plans, and the introduction of new SSS routes and an increase in frequencies of existing services. Significant results were obtained in terms of shifting freight traffic from the road network as well as external benefits.

1. Introduction

In recent years, the European Union (EU) has sought to tackle the negative externalities due to road haulage (congestion, environmental impact, etc.) and has set some goals for a competitive and resource-efficient transport system [1]. One such goal is a modal shift from road transport to other more sustainable transport modes, such as rail or waterborne transport. Short sea shipping (SSS), defined by the European Commission as maritime transport of goods between ports in the EU on the one hand, and ports situated in geographical Europe, on the Mediterranean and Black Sea on the other ([2]), could be a means to achieve such goals. Developing the Trans-European Network (TEN-T), the European Commission planned 30 priority axes and projects including land to sea transport networks and the implementation of SSS lines and services [3,4,5,6]. In terms of the freight quantity transported to/from the main European ports, in 2017, SSS attracted well over half (almost 58%). However, focusing on the Mediterranean basin, the proportion of freight transported by SSS in the same year was close to 33% [2], even allowing for the fact that some connections are only possible by sea (i.e., towards islands) Hence, the need to implement strategies and action to make SSS more competitive over road transport germinates.
Furthermore, as recognized by COP 21 ([7]), climate change represents an urgent and potentially irreversible threat to human societies and the planet. It is crucial to accelerate the reduction in global greenhouse gas emissions and also pollutant emissions. Haulage also has to contribute to achieve environmental goals, given that it contributes significantly to emissions of NOx, NMVOCs, PM and CO. NOx contributes to acidification, the formation of ground-level ozone and particulate formation. In particular, contribution of the transport sector to total emissions is: 72% in terms of greenhouse, 66% of NOx, 21% of CO, 14% of PM10 and 20% of PM2.5 emissions [8]. Even if several studies have investigated the environmental issues arising from technology changes, they are mainly devoted to the improvement of the operational energy efficiency of vessels as well as environmental regulations [9,10], and refer to transport providers’ perspective and on the role of a shipper [11], while few of them identify the visions of planners in order to favor the integration of SSS in European intermodal transport chains [10,12]. This shows that further work is needed in this field. Therefore, as stated above, pushed by the desirability to plan European freight transport to meet environmental/green goals, this paper presents the results of an ex-ante assessment of some actions promoted by national and international plans and programs, and identifies some further actions that can be implemented easily for limiting the freight transport impacts. In fact, SSS offers environmental and social benefits compared to road transport and it can facilitate the connection of remote and peripheral regions without requiring high infrastructure investments. Therefore, in a “what if” framework, the opportunity to have an assessment framework that allows us to calculate first scenario metrics to be compared with target ones can support planners in future scenario definitions (e.g., giving indications on which measures are most suitable for freight transport purposes).
After a literature review focused on short sea shipping (Section 2), the first macro-objective of the paper emerges, i.e., to propose a methodology to estimate impacts and system performance, and hence, compare future scenarios according to a set of given target values (Section 3). Besides, such a methodology should not suffer the lack of harmonization and limits comparability of national/international data [13] in developing performing models. The methodology aims to compare different scenarios, where changes in modal choice and services are foreseen with subsequent variations in external costs. The benefits of such a transport mode can thus be evaluated through an assessment methodology that helps identify the share of freight that can be captured by SSS, as shown in Section 4. Therefore, starting from these results, the second macro-objective of the paper is generated: i.e., to investigate the changes of freight transport thanks to SSS as a reasonable alternative to road. The analysis of socio-economic characteristics, as well as level of service attributes, allows to assess their impact on modal choices and then the shift between road and SSS. This modal shift could drive modifications in fleet characteristics (e.g., type of ship and equipment) and operation management [14,15,16,17,18], exploiting the benefits deriving from shifting to SSS.
The paper is structured as follows. In Section 2, a literature review is reported to highlight the main aspects of SSS. Section 3 presents an assessment methodology of the competition of SSS services. In Section 4, the case study is reported, considering two possible future scenarios. Finally, Section 5 reports some conclusions and the road ahead is drawn.

2. Literature Review
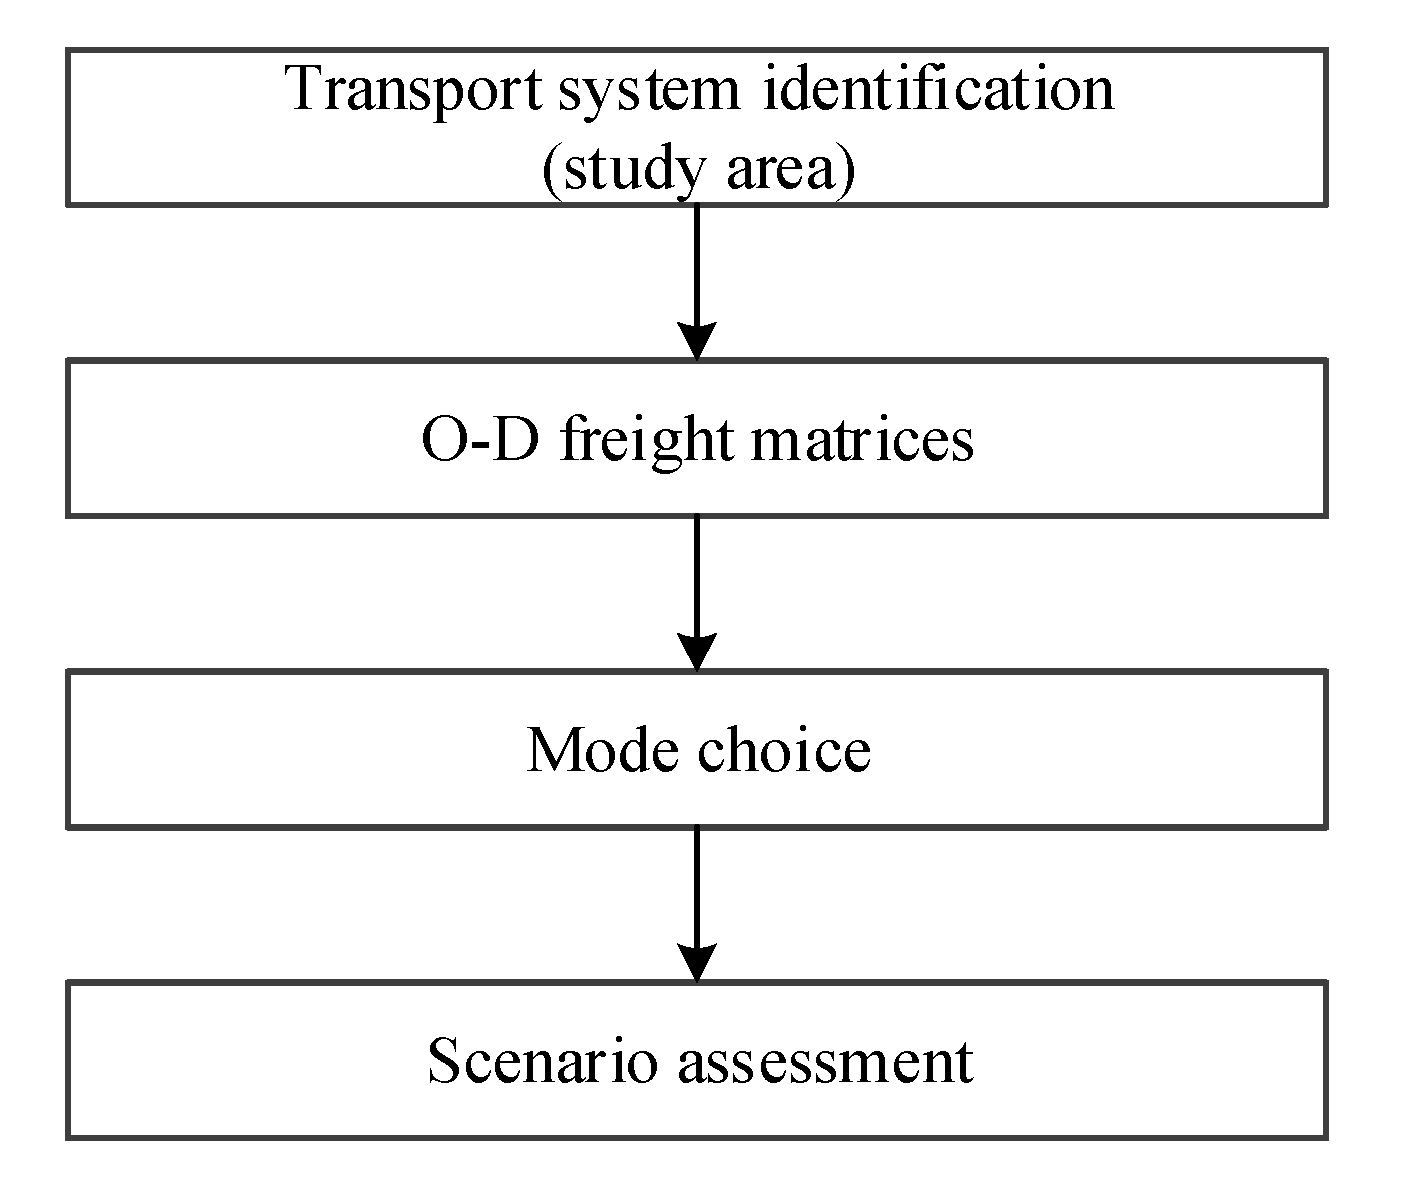
Several studies on short sea shipping (SSS) have highlighted the competition of SSS over land transport modes and the benefits produced by increasing its share. Such studies are reviewed below, especially with regard to simulating mode choice and assessing external impacts.
SSS is a transport mode known to be in competition with land transport [19,20]. The question of modal choice is widely covered in the literature [21,22], identifying the factors that influence such a choice (e.g., cost, frequency, reliability). In order to identify the attributes influencing modal choice, Bergantino et al. ([23]) propose a stated preferences approach to test the potential success of initiatives aimed at enhancing the use of SSS. Similarly, Brooks et al. ([24]) analyze the competitiveness of SSS in Australia in order to evaluate the willingness to pay (WTP) for services on specific transport corridors. The attributes considered in the choice models are frequency, transit time, distance, direction (headhaul/backhaul), delivery window, reliability and price offered by the operators. In [25], the transport companies’ perception between SSS and road transport is investigated so as to identify the service attributes influencing the choice of SSS services. With reference to the Black Sea area, Yotsov et al. ([26]) analyze a set of possible alternatives (i.e., SSS, railway and road) to transporting freight, considering as assessment criteria, time, costs and CO2 emissions. In order to provide information on performance of road transport and intermodal transport using SSS, Lopez et al. ([27]) propose cost and time models, taking into account attributes related to the technical and operative conditions of the fleet, attributes related to routes, and those in relation to cargo units. Koliousis et al. ([28]) explore how road transport deregulation influences SSS from two perspectives: the negative effects on SSS due to changes (improvements) in road transport and the possible environmental benefits of supporting SSS. López-Navarro ([29]) analyzes the possible strategies and issues for road transport actors when they have to choose the combined transport (road and SSS) rather than ‘all road’ transport. The latter study focuses on the change in the business model needed to use SSS, considering the strategies of accompanied or unaccompanied transport.
Another aspect treated in the literature concerns the external effects of SSS, considering both technological aspects and impact quantification in relation to other transport modes. Windover et al. ([30]) report an investigation to assess the technical, economic and environmental potential of an electric propulsion system in SSS operations in the state of New York. Similarly, Spoof-Tuomi and Niemi ([31]) analyze emission performance by using an engine powered by liquefied natural gas (LNG) and liquefied biogas in SSS, comparing the result with conventional diesel engine emissions. The approach proposed by [32] aims to determine the technical characteristics of a Ro-Ro (roll on-roll off) ship and the size of the fleet required for a route in order to satisfy the demand level. In order to find the optimal fleet composition that maximizes the opportunities for success of SSS with respect to road transport, an optimization model able to provide the technical and operative features of fleets is proposed by [33].
In terms of impact quantification, Hjelle ([34]) calculates the CO2 emissions per ton-km transported by SSS services for each trip. The results are compared with emissions from road transport for the same freight tonnage and distance. Similarly, Vallejo-Pinto et al. ([35]) propose an approach to compare SSS and road transport in terms of emissions which, in the authors’ opinion, can be viewed as a complementary approach with respect to cost and time studies. Konstantinus et al. ([36]) provide an assessment of SSS opportunities in the South Africa region, comparing energy consumption of SSS against that of road transport. Spoof-Tuomi and Niemi ([31]) evaluate the emissions performance of fuel choices for SSS, comparing emissions due to the use of different fuels and analyzing impacts in terms of acidification, eutrophication and human health. Bengtsson et al. ([37]) define four criteria (local and regional impacts, overall impact, infrastructures and relation with other transport modes) in order to evaluate the type of fuel to choose in SSS transportation. It has been shown (e.g., [38,39]) that the low energy consumption of SSS per transport unit may be useful to reduce air pollution and contribute to implementing a sustainable transport system. Johnson and Styhre ([40]) consider the reduction in waiting times in ports as a means of reducing energy requirements: the analysis evaluates the possibility of reducing ship speed at sea by reducing the waiting time (also intended as an improvement in port efficiency). The efficient use of energy in SSS is investigated in [41], who use a case study to highlight patterns and barriers to implementing energy efficiency. Schøyen and Bråthen ([42]) propose an activity-based approach in order to estimate energy efficiency for ships involved in SSS, both during navigation and during stops in port.
As shown above, promoting further studies on the potential offered by SSS as an alternative to road transport would appear beneficial. Therefore, Section 3 presents a methodology for assessing freight transport scenarios where a key role can be played by SSS, while not neglecting changes in infrastructures and services as well as in technology [24,36,43,44].

3. Approach

This section aims to highlight the opportunities offered by short sea shipping for reducing negative externalities of road haulage at the European level. An assessment methodology is thus introduced. It can support the analysis of competition of SSS services and is schematized as follows (Figure 1):
  • Transportation system identification (study area). The objective of this first phase is to identify the elements of the system under analysis and their relationships;
  • Origin-Destination (O-D) matrices. This stage aims to estimate the O-D matrices, and it is integrated and related to transportation system identification;
  • Mode choice. The relevant interactions among the various elements of the freight transportation system are simulated in order to assess how socio-economic characteristics as well as level of service attributes impact on modal choices; this phase provides the input for future scenario assessment;
  • Future scenario assessment. Different design scenarios have been implemented according to different hypotheses on the further development of SSS services coming from national and supra-national plans. Subsequently, some scenario metrics and/or performance indicators are calculated and the impacts for the proposed future scenarios, which could be compared with target ones, are estimated.

3.1. Transportation System Identification

The aim of this phase is to determine the elements that make up the system of analysis and their relationships. The elements of interest pertain to three spheres:
  • The demographic, economic and spatial characteristics of transport demand;
  • The supply of transport and logistics infrastructures and services;
  • The external environment, as it plays a role in estimating some impacts.

3.2. Origin-Destination Matrices

The definition of freight service supply and estimation of its impact requires accurate knowledge of freight demand which, for forecast scenarios, can be developed using a modelling system, while for current scenarios, it can be obtained from source. Although the literature contains several methods and models developed for simulating freight demand [45,46], many require extensive information, and the matrices from sources are quite aggregated in their reproduction of freight flows between countries. Therefore, disaggregation approaches are customarily used for splitting country-based freight O-D flows [47].
Given two zones o and d, belonging to two countries R and S, respectively, the quantity of freight exchanged between zones o and d, qod, can be obtained as follows:
q o d = q R S ( X o ) β o ( c o d ) β c h R , k S ( X h ) β o ( c h k ) β c
where
  • Xo is the value of production in region o (equal to the regional GDP);
  • cod is the average transport costs between zones o and d;
  • R is the origin country that contains zone o;
  • S is the destination country that contains zone d;
  • qRS is the freight flow (quantity) between countries R and S;
  • βo and βc are model parameters to calibrate.

3.3. Mode Choice

The freight mode-service choice model plays a key role in the assessment methodology. It simulates competition among alternative modes (e.g., combined road-railway, SSS and road transport). In order to predict long-term effects, the mode-service choice model can be specified through easy-to-capture variables, mainly represented by level-of-service attributes by using a consignment approach [48,49,50]. Therefore, assuming a fixed quantity q for a given load unit, the probability p[m/od] of using transport mode-service m to shift freight in load units (e.g., containers or swap bodies) from origin zone o to destination zone d can be expressed as:
p [ m / o d ] = e x p ( V m o d ) / m e x p ( V m o d ) m m , m I o d
where Iod is the set of possible transport mode-services available on the od pair (e.g., road, combined road-rail, sea) and V m o d is the systematic utility of transport mode-service m, which can be expressed as a linear combination of attributes X m , k o d (e.g., travel times and monetary costs) as follows:
V m o d ( X m , k o d ) = k β m , k X m , k o d
with βm,k model parameters to estimate.

3.4. Scenario Assessment

Design and evaluation of transportation systems, in addition to performance variables perceived by the users, require the modelling of impacts borne by the users, but not perceived in their mobility choices, and of impacts on non-users. Examples of the first type include indirect vehicle costs and accident risks with their consequences. The impacts on non-users include those for other subjects directly involved in the transportation system, such as costs and revenues for the transport service suppliers, and impacts “external” to the transportation system (or market). Examples of externalities are the impacts on the real estate market or on the environment, such as noise and air pollution. Often such functions are named after the specific impact they simulate (e.g., fuel consumption functions or pollutant emission functions). Some impacts may be associated with individual network links and depend on flows. The impacts include:
  • Impacts on users (e.g., travel time and generalized travel cost);
  • Impacts on non-user externalities (e.g., air pollution, energy consumption).
Therefore, the scenarios can be evaluated with respect to indicators of economic (e.g., related to efficiency), social (e.g., related to congestion and safety), and environmental sustainability. The values obtained for the indicators are compared with some reference values (targets). The indicators chosen for this stage of the ex-ante assessment could be monitored in the ex-post assessment to track their real evolution over time. These indicators could be developed considering the set of variables promoted by the European Environment Agency (TERM, Transport and Environment Reporting Mechanism; [51]). In fact, the TERM indicator list covers the most important aspects of the transport and environment system (driving forces, pressures, state of the environment, impacts and societal responses). It represents a long-term vision of the indicators that are ideally needed to monitor the progress and effectiveness of transport and environment integration strategies.
In general, some other types of impacts could be considered, such as financial impacts by reducing costs to carriers and shippers, and energy consumption by changing the amount of energy used.

4. The Case Study

The proposed assessment methodology was implemented to assess the future potential of short sea shipping (SSS) and its benefits in terms of lower external costs in the north-western Mediterranean basin. It focuses only on freight flows between Italy and other Mediterranean countries in which SSS could be a reasonable alternative without requiring substantial changes in transport operators’ businesses.

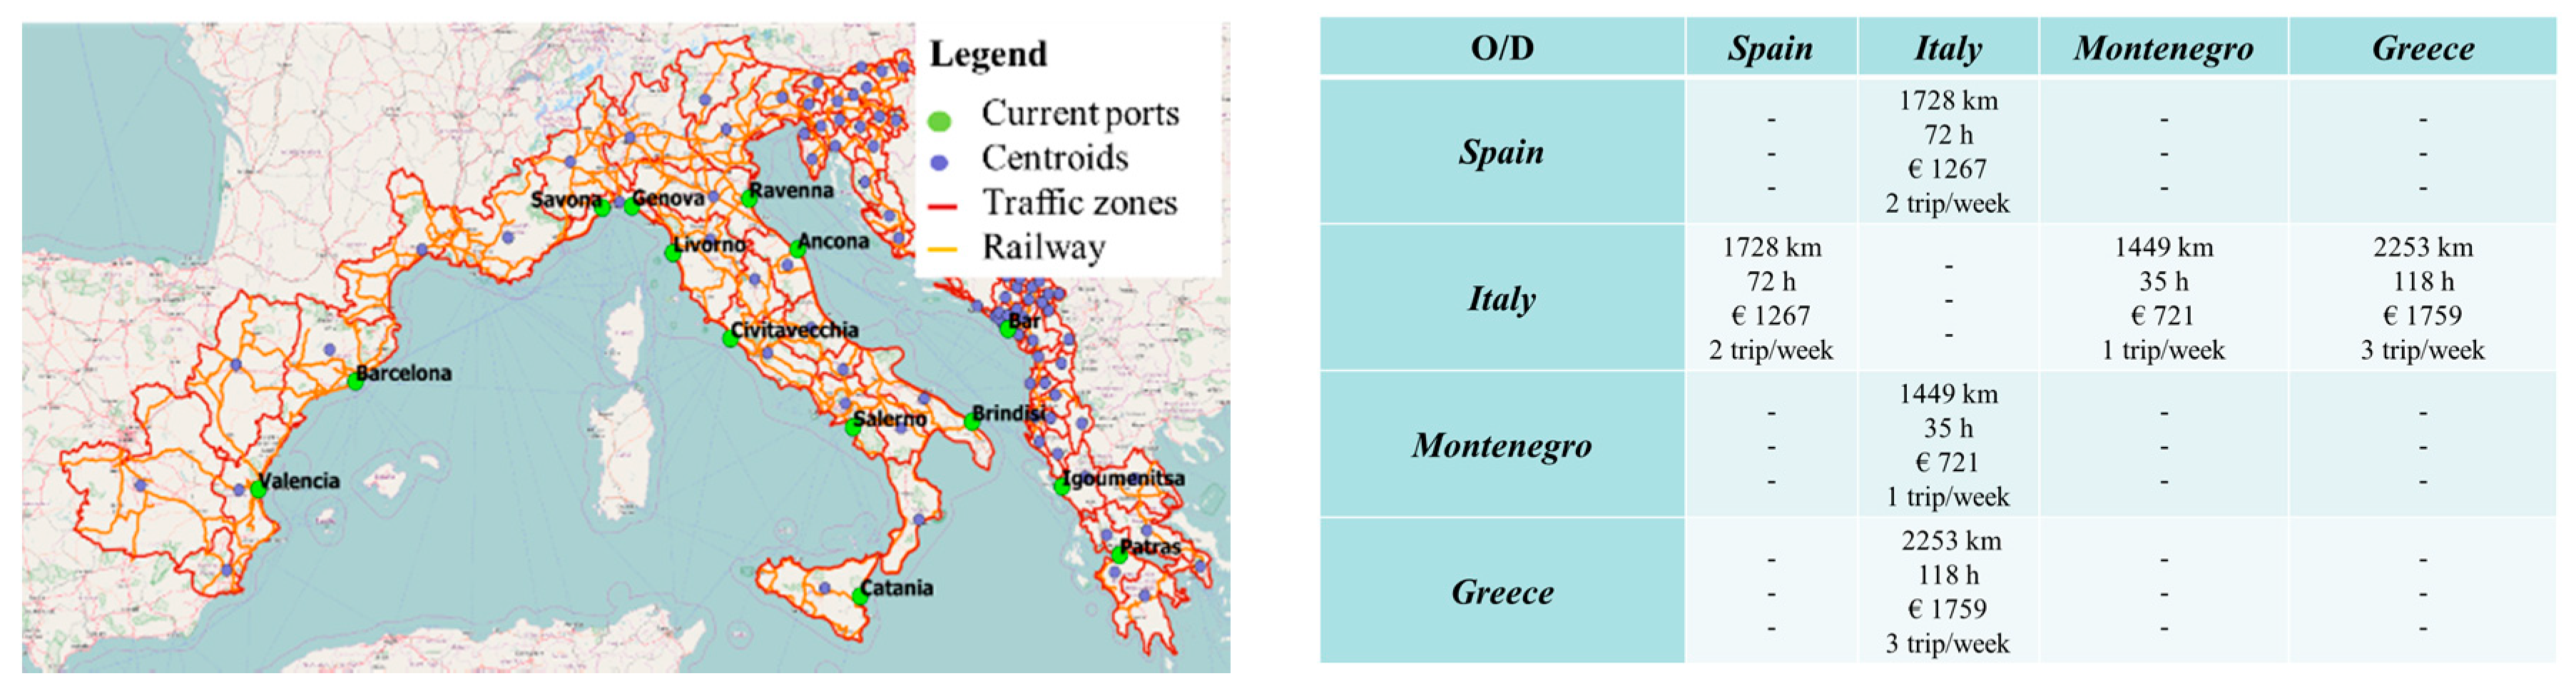
4.1. Transportation System Identification

Once the study area had been identified, zoning was carried out, with the main Ro-Ro ports taken as reference. The choice of traffic areas fell on those accessible by sea and with at least one other modal transport alternative (e.g., combined road-rail transport as shown in Figure 2):
  • Italy, with the ports of Ancona, Brindisi, Catania, Civitavecchia, Genova, Livorno, Marghera and Ravenna, Salerno, Savona, Trieste;
  • France with the port of Marseille;
  • Spain with the ports of Barcelona and Valencia;
  • Slovenia with the port of Koper;
  • Croatia with the ports of Dubrovnik and Split;
  • Montenegro with the port of Bar;
  • Albania with the port of Durres;
  • Greece with the ports of Igoumenitsa and Patras.
For each listed Ro-Ro port, an area of influence with a radius of 300 km from the port was considered in order to determine the traffic areas taken as a reference for zoning. The zoning adopted, and the consequent reconstruction of the transport demand, was implemented assuming a level of regional zoning (NUTS2—Nomenclature of Territorial Units for Statistics), in which the traffic zones coincide with the regions, and O-D matrices are interregional. In all, 86 zones were identified.
The current transport scenario (2018) was defined starting from the current freight transport system, including inter-modality and logistics. Based on the characteristics of freight transport in the Mediterranean, transport services mainly comprise road, rail (traditional and combined) and sea transport (motorways of the sea—SSS) modes.
In the current scenario, a total of 958 weekly freight services (784 combined road-rail transport services and 174 SSS services) were considered for 70 terminals (14 ports and 56 intermodal terminals).

4.1.1. Short Sea Shipping Supply Model

In the Mediterranean basin, there are numerous SSS/Ro-Ro services, and to construct the current transport scenario, a total of 174 international Ro-Ro weekly services were considered, involving the ports of Barcelona, Valencia, Ancona, Brindisi, Catania, Civitavecchia, Genoa, Livorno, Ravenna, Salerno, Savona, Bar, Igoumenitsa and Patras, with a frequency of at least one ship/week. They cover 12 origin-destination pairs. In constructing the supply of services, those between Sardinia and Africa were excluded, given that, for this region and continent, Ro-Ro services represent an exclusive mode of transport and not one of the possible modal alternatives, whereas Sicily was considered, assuming the presence of a road link across the Strait of Messina connecting Messina with Villa San Giovanni [52].
The SSS supply model allows the following O-D level of service attributes to be obtained: travel distance; travel time (return time, include the access/egress time); travel cost and A/R frequency. Figure 3 reports the lines and the average level of service attributes at country level.

4.1.2. Railway Supply Model

As well as for the supply model of the SSS supply, the combined road-rail transport supply model refers to the entire national and international network of interest for freight transport, while private railways and those for the exclusive use of passenger transport were not taken into consideration. Consistent with the level of zoning adopted, all the railway infrastructures relevant to connections between the zones of the study area were extracted. Overall, 1,998,098 kilometers of railway network were taken into consideration, represented through two-way links and representative nodes of stations and freight terminals. An overview of the topological model implemented and the average level of service attributes at country level are shown in Figure 4 below.

4.1.3. Road Supply Model

The road transport supply was built in order to represent all the main national and international road infrastructures. For the road network, the main infrastructures considered were as follows: highways, motorway junctions and main roads, capable of adequately serving the transport demand implemented in the demand model used (described below). Provincial roads were added to the above road infrastructures, which were necessary for the connection of all national and international routes and the main maritime routes. The level of service attributes (Figure 5) were then calculated as the sum of on-road travel time and stop time (detailed information can be found in [53]).

4.2. Origin-Destination Matrices

The transport demand is expressed in terms of Origin-Destination matrices, whose elements represent the flow of freight, in a given historical time, between territorial areas. Demand is consequently correlated with the division of the study area into zones (zoning) previously described. The process used to define the overall freight transport demand for the transport mode of the study area started from the retrieval and homogenization of all the databases made available by Eurostat. Through the transport thematic section, Eurostat provides traffic data relating to the individual modes of transport (road, sea, rail, air) in aggregate (e.g., vehicle-kms and national and international km-tons divided by the type of traffic and goods transported) and disaggregated terms. In the latter case, particular attention is paid to port traffic. In this regard, O-D matrices of unitized loads that can be potentially transferred to SSS (e.g., container traffic between ports in the EU27 area and the world) are also available.
Table 1 below reports the freight volumes exchanged among the countries of the study area. Having considered a level of regional zoning, the need arises to build O-D matrices for each transport mode considered in the analysis. However, as regional data were not directly available, a regionalization model was developed, as described in Section 3 (Equation (1)), capable of disaggregating national flow data into regional ones.

4.3. Mode Choice

Once the Origin-Destination matrices had been determined, the next step was to set up a modal choice model. The aim of the model was to summarize the user choice process. The model used belongs to the family of random utility models, which represents the richest paradigm for simulating the choice of transport and, generally speaking, the choices between discrete alternatives ([54,55,56]). According to Equation (3), the systematic utility of transport mode-service m (i.e., road, combined road-rail transport, SSS) was expressed as a linear combination of the identified attributes as follows:
V r o a d o d = β 1 r o a d C r o a d o d + β 2 r o a d T T r o a d o d + β 10 R O A D V r a i l o d = β 3 r a i l C r a i l o d + β 4 r a i l T T r a i l o d + β 5 r a i l F r e q r a i l o d + β 11 R A I L V s s s o d = β 6 s s s C s e a o d + β 7 s s s T T s e a o d + β 8 s s s F r e q s e a o d
where TTod is the travel time on O-D pair od (h), Cod is the travel cost on O-D pair od (€), Freqod is the service frequency on O-D pair od (runs/weeks), and ROAD and RAIL are the dummy alternative specific attributes for road and combined road-rail transport, respectively. The handling times at origin and destination terminals both for combined road-rail transport and SSS alternatives as well as the access and egress travel times by road were included.
Different specifications were tested and the model with the best statistical performances, according to the above expression, is reported in Table 2. All parameters are correct in sign and the ability of models to reproduce the revealed values is shown by the high value of R2 (0.98).
Further tests were also performed in order to validate the reasonableness and the significance of estimated coefficients. In particular, the direct and cross arc elasticities were calculated as follows:
E k m p [ m ] = Δ p [ m ] p [ m ] / Δ X k m X k m
E k h p [ m ] = Δ p [ m ] p [ m ] / Δ X k h X k h
where Δp[m]/p[m] represents the percentage variation of the choice probability of mode-service m divided by the percentage variation (ΔXkm/Xkm in Equation (5) or ΔXkh/Xkh on Equation (6)) of the attribute k relative to the same mode-service m (direct elasticity) or to another mode-service h (cross elasticity). Both direct and cross-elasticities are useful measures of the model’s sensitivity to variations in the attributes.
The coefficient reciprocal relationships (Table 2) and the above direct and cross elasticities (Table 3) were compared with similar results reported in the literature [53,57,58]. Besides, the ratio between time and monetary cost coefficients, which can be interpreted as value of time (VoT) corresponding to different components of travel time (i.e., check-in and boarding time) on the different mode-services, decreases in value for less appreciated mode-services (i.e., rail and sea).

4.4. Future Scenario Assessment

This section reports the application examples of the methodology for the assessment of SSS transport strategies to be suggested for further development of SSS according to the European Commission and Italian National Transport Plans. In particular, application examples were performed to ascertain whether and to what extent the aims of the EU plans are realistic by quantifying the share of freight traffic that can be transferred to more sustainable modes by 2030.
The hypotheses for the development of SSS were defined with the aim of verifying the effects induced by policies in the freight transport capable of implementing the guidelines of the European Community, which promote an increase in the use of SSS transport with a view to transferring by 2030, on distances greater than 300 km, 30% of the demand by road to other modes, such as SSS and combined road-rail transport.
To this end, the future scenarios, starting from the demand for transport and the supply of infrastructures and services for the future time horizon (2030), implement the following actions devoted to increase the services and to promote incentives. As regards to the service supply, the effects of the following actions were simulated by nesting them in two scenarios (Figure 6):
  • Introduction of new services in line with EU projects as detailed below (scenario 1);
  • Introduction of new SSS services on long-distance connections characterized by the presence of potentially attractive demand from road transport (scenario 2);
  • Boosting of services due to a 10% increase in frequencies of existing SSS services (scenario 2).

4.4.1. Scenario 1

This scenario was implemented to simulate the effects of the introduction of the new SSS services as illustrated in Figure 6. In accordance with European Directives and especially with the objective of the White Paper (Roadmap towards a single European transport area—for a competitive and sustainable transport policy) regarding the need, by 2030, to shift about 30% of freight demand over 300 km from road to SSS, in the first instance, estimation of the potential demand for transport by SSS was pointed out. Therefore, the main potential sea routes were identified, and evaluation of minimal weekly frequency and load factor were identified. Such an analysis was performed in order to verify the possibility of working without exogenous incentives. At the end of this process, 12 new round-trip connections were introduced with 201 new services capable of attracting demand from road and combined road-rail transport.
The reference scenario (base scenario) was also thus defined. It is the scenario to which the system would trend if no further actions were implemented. From the analysis of the results obtained in terms of annual tons transported, it may be observed that the effect of the introduction of new services leads to an increase in the modal share of the Ro-Ro sea service of 12%, which is achieved at the expense of slightly higher road transport, leaving the combined railway transport practically unchanged (2%).
The benefits of introducing scenario 1 are evaluated in terms of modal shift (i.e., freight tons from combined road-rail or road transport to SSS; Table 4) and in terms of total annual distances travelled (i.e., tons-km/year; Table 5). Particularly, it can be seen that the gain of 12% in terms of annual tons (from 12% in base scenario to 24% in scenario 1; Table 4) corresponds to benefits +11% if calculated in terms of total annual distances (i.e., from 13% to 24%; Table 5). This gain is achieved at the expense of road journeys (−11%, i.e., from 84% in base scenario to 73% in scenario 1; Table 5), while for the combined road-rail, there are no significant differences.

4.4.2. Scenario 2

This scenario was constructed to simulate the effects of the increase in the frequency of existing SSS services and the inclusion of routes not provided for in Europe-wide program documents in order to reduce travel times.
From the analysis of the results obtained in terms of annual tons transported (Table 6), it may be observed that the effect of the increase in frequency of existing services leads to about a 20% increase in the modal share of SSS (from 12% to 31%), which is achieved at the expense of road (−19%, from 86% to 67%) and combined road-rail (−1%). As shown in Table 6 and Table 7, this scenario entails a particularly large increase in demand for SSS (167% in terms of tons, 123% in terms of t-km/year). However, compared to the previous scenario, it has the disadvantage of triggering competition between combined road-rail and road transport since the demand is captured by both transport modes.

4.4.3. Externality Scenario Comparison

Although the transport sector is fundamental for socio-economic development, its “unsustainable” development imposes significant costs on society in terms of economic impacts (traffic congestion, barriers to mobility, accidents, service costs, etc.), social impacts on human health and environmental impacts (greenhouse gas emissions, air pollution, noise, habitat loss, etc.). Therefore, the two above scenarios were assessed in terms of such costs: pollutant and greenhouse gas emissions, safety, noise and congestion.
The methodology for estimating the economic value of the impacts is based on the application of unit monetary values (€/t-km) to the value of goods expressed in tons-km, through the unit costs provided by the Handbook on External Costs of Transport [59]. Therefore, the annual external cost of type s due to transport mode m for scenario h, C E s , m h , was expressed as follows:
C E s , m h = T K M m h t k m s , m
where
  • T K M m h is the annual tons-km covered by transport mode m in scenario h;
  • tkms,m is the unit cost for externality s (e.g., air pollutant emissions, greenhouse gas emissions, accidents, congestion, noise) due to transport mode m as proposed by the Handbook on External Costs of Transport.
Table 8 reports the comparison with the base scenario. Significant improvements in terms of external impacts can be observed mainly for project scenario 1. Scenario 2 shows that the inclusion of new connections and a potential increase in the frequency of maritime services yields a further benefit (with respect to scenario 1). In detail, for both scenarios, the impact of SSS increases due to the increase of the share of freight captured by SSS, but, at the same time, for combined road-rail and road transport, the impact decreases. Comparing the total external costs of current scenario with those of scenario 1, there is a reduction of around 16%. Similar considerations emerge for scenario 2, where the reduction of the external costs is about 19%. It shows that Mediterranean freight system has further share of freight that can be captured by SSS if suitable services are planned and implemented.
The described project scenarios show that the development of the Motorways of the Sea could have, in the reorganization of the road haulage, one of the crucial elements for the success of the previously proposed policies. Indeed, an increase in maritime services capable of offering the country-system an integrated sea-road network requires, on the one hand, an investment in human resources for the efficient management of intermodal terminals and new services; on the other, it requires conversion of part of road transport towards access/egress function from/to the land terminals. In particular, pursuant to the predetermined objective (maximization of the modal share on the sea), the reduction of long all-road journeys can contribute to the increase in load factors and favor short-term termination gravitating on the main maritime and railway terminals.
Finally, the proposed analysis could support the decisions of maritime transport operators (e.g., shipping lines, carriers, etc.). It could be suitable to analyze maritime penetration of such services in other sea basins. At the end, it could contribute to provide quantitative support to transport planning activities in progress at EU-Mediterranean level, focusing on the role that shippers can play for the integration of multiple traffic modes into a seamless intermodal transport chain and identifying the main barriers that prevent SSS from being a viable alternative to road transport for certain transport routes. According to these findings, cooperation and shared planning among transport chain agents and a different management approach could be explored more in depth, in order to evaluate the opportunity that large shippers can have in ensuring high frequencies of services for smaller forwarders and shippers, in particular, on origin-destination relations currently not served.

5. Conclusions

The paper analysed the competitive advantage of using SSS services for maritime freight flows between Italy and a set of countries belonging to the north-western range of the Mediterranean basin. An assessment methodology was developed to include an aggregate discrete choice model simulating the split between road, combined road-rail transport and SSS. The study aimed to prepare a competitive and sustainable freight transport system capable of responding to the economic, social and environmental needs of society on a Euro-Mediterranean scale.
Research involved setting up the supply model and the demand model, as well as some ideas on the possibility of integrating transport and macroeconomic models. The supply model was implemented through a theoretical approach and topological and analytical database. First, a road, rail and maritime graph were implemented separately. Air mode was neglected as freight transported by air weights very little compared to freight via other modes. Each of the graphs comprises a topological and analytical element. As regards to the topological part of the road and rail graphs, we started from rather rough bases implemented on GIS support. For the analytical part, it was necessary to proceed with a substantial systematization of the supply model for each mode, with specific state-of-the-art advances, especially with regard to cost functions and fares. In particular, for sea and for combined road-rail transport, the fares currently applied on each section were taken into account.
As regards to demand, a first phase concerned the collection of data on freight flows for the construction of the O-D matrices. The source used, from which to retrieve data according to the geographical size of such flows, is Eurostat, specifically for flows to/from European countries. Once these data were collected, separately for the three modes of transport where available, harmonization in the division of the geographical areas (disaggregation of flows at NUTS 2 level) into the units of measurement (tons/year) was necessary. The O-D matrices obtained, in addition to representing an estimate of current flows, were used to construct the calibration databases of the modal choice model.
Use of the calibrated multinomial logit model showed the potential of improving the SSS supply and was the input for assessing external costs showing the potentiality offered by further sea routes not considered in the planning documents. The negative externalities of the transport system due to their growing monetary and social costs have become a topic of great interest on a global level. Therefore, resources will continue to be used in research applied to mitigate such externalities. In sea transport, where the problem of local pollutants is less commonly felt, the application of liquefied natural gas is a very interesting solution since, as seen above, it does not have particular negative implications. In the long term, the possibility of a combined application of solutions cannot be ruled out, namely electrification of port docks and liquefied natural gas (LNG).
Solutions exist for mitigating emissions and, in some cases, they do not have particularly high costs. As a result, at least in the transport sector, the main constraints to applying short-term solutions are not so much technological or economic, but rather, consequent to behavioural aspects and to the inertia of the system itself.
From the transport perspective, however, the results obtained made it possible to achieve the objective of the European Community regarding the transfer of 30% of road and combined road-rail freight to SSS. Indeed, with the implementation of project scenario 2 (introduction of new services on long-distance connections not envisaged by European documents and boosting of existing services), it is observed that thanks to the addition of new maritime services, a freight flow of 32% takes place on SSS, also bestowing environmental benefits. In conclusion, ships could become the greenest, most effective and cheapest mode of transport.
Attention to the complex mechanisms that underlie current modal choice behaviour of users is a fundamental aspect for the development of user information systems. Therefore, it could push the improvement in the potential of the model with reference to its capacity to predict the effects that the dissemination of information to users has on road traffic, within a specific socio-cultural context.
It can be said, however, that what was developed in this work may be useful for the analysis of possible interventions of new shipping lines in order to be able to boost markets on the shores of the Mediterranean. Consequently, the key to development should consist in a synergistic growth of the various infrastructures and related services, while also allowing the effectiveness of the individual components to be maximized. In this perspective, there should be no doubt about the need to consider interventions to boost the interchange capacity between ports and freight villages or internal logistics platforms as a priority, taking into account the specific nature of the traffic and current market demand.
Finally, the proposed analysis could support the decisions of SSS transport operators (e.g., shipping lines, carriers, etc.), who operate with unitized cargos. It could also be suitable to support the analysis of market penetration of the analysed maritime services in other sea basins, such as the Baltic in Europe. In the end, it could contribute to provide quantitative support to transport planning activities in progress at EU-Mediterranean level.
Further developments of this research mainly regard the specification and calibration of more sophisticated regionalization and mode-service choice models (e.g., based on more disaggregate data, when available) as well as to introduce an heuristics to design the SSS service network.

Author Contributions

Conceptualization, A.C.; Methodology, A.C.; Software, A.P.; Validation, A.C. and A.P.; Formal Analysis, A.C. and A.P.; Investigation, A.C. and A.P.; Data Curation, A.C. and A.P.; Writing–Original Draft Preparation, A.C. and A.P.; Writing–Review & Editing, A.C.; Visualization, A.C. and A.P.; Supervision, A.C. Both authors have read and approved the final manuscript. All authors have read and agreed to the published version of the manuscript.

Funding

This research received no external funding. The APC was funded by MDPI.

Acknowledgments

The authors wish to thank Valentina Zangrilli for her support in collecting and analyzing data, the anonymous reviewers for their suggestions, which were most useful in revising the paper.

Conflicts of Interest

The authors declare no conflict of interest.

References

  1. White Paper. Tabella di Marcia Verso Uno Spazio Unico Europeo Dei Trasporti—Per Una Politica Dei Trasporti Competitiva E Sostenibile; Commissione Europea: Bruxelles, Belgium, 2011. [Google Scholar]
  2. Eurostat. Glossary: Short Sea Shipping (SSS). Available online: https://ec.europa.eu/eurostat/statistics-explained/index.php?title=Glossary:Short_sea_shipping_(SSS)&oldid=424626 (accessed on 18 May 2020).
  3. Douet, M.; Cappuccilli, J.F. A Review of Short Sea Shipping Policy in the European Union. J. Transp. Geogr. 2011, 19, 968–976. [Google Scholar] [CrossRef]
  4. Russo, F.; Musolino, G.; Assumma, V. An integrated procedure to estimate demand flows of maritime container transport at international scale. Int. J. Shipp. Transp. Logist. 2014, 6, 1121–1132. [Google Scholar] [CrossRef]
  5. Lupi, M.; Farina, A.; Pratelli, A.; Gazzarri, A. Evoluzione Della Rete Italiana Delle Autostrade Del Mare. R.E.P.O.T. Riv. Sci. Della Soc. Ital. Econ. Trasp. Della Logist. 2015, 1, 1–17. [Google Scholar]
  6. Lupi, M.; Pratelli, A.; Falleni, M.; Farina, A. An analysis of short sea shipping container routes in the Mediterranean and in the black sea. WSEAS Trans. Environ. Dev. 2019, 15, 1201–1238. [Google Scholar]
  7. COP 21. Adoption of the Paris agreement. In Proceedings of the Parties Twenty-First Session (COP 21), Paris, France, 30 November–11 December 2015. [Google Scholar]
  8. European Environment Agency. Greenhouse Gas Emissions from Transport in Europe. Available online: https://www.eea.europa.eu/ (accessed on 23 June 2020).
  9. Goulielmos, A.; Giziakis, C.; Christodoulou, A. A future regulatory framework for CO2 emissions of shipping in the Mediterranean Area. Int. J. Euro-Mediterr. Stud. 2011, 4, 39–60. [Google Scholar]
  10. Christodoulou, A.; Gonzalez-Aregall, M.; Linde, T.; Vierth, I.; Cullinane, K. Targeting the reduction of shipping emissions to air: A global review and taxonomy of policies, incentives and measures. Marit. Bus. Rev. 2019, 4, 16–30. [Google Scholar] [CrossRef]
  11. Christodoulou, A.; Woxenius, J. Sustainable Short Sea Shipping. Sustainability 2019, 11, 2874. [Google Scholar] [CrossRef] [Green Version]
  12. Paixão Casaca, A.C.; Marlow, P.B. Logistics strategies for short sea shipping operating as part of multimodal transport chains. Marit. Policy Manag. 2009, 36, 1–19. [Google Scholar]
  13. Tavasszy, L.; de Jong, G. Data Availability and Model Form. In Modelling Freight Transport; Tavasszy, L., De Jong, J., Eds.; Elsevier: Amsterdam, The Netherlands, 2014; Chapter 10; pp. 229–244. [Google Scholar] [CrossRef]
  14. Raza, Z. Effects of Regulation-Driven Green Innovations on Short Sea Shipping’s Environmental and Economic Performance. Transp. Res. Part D Transp. Environ. 2020, 84, 102340. [Google Scholar] [CrossRef]
  15. Tran, T.M.T.; Yuen, K.F.; Li, K.X.; Balci, G.; Ma, F. A Theory-Driven Identification and Ranking of the Critical Success Factors of Sustainable Shipping Management. J. Clean. Prod. 2020, 243, 118401. [Google Scholar] [CrossRef]
  16. Yuen, K.F.; Thai, V.V. Corporate Social Responsibility and Service Quality Provision in Shipping Firms: Financial Synergies or Trade-Offs? Marit. Policy Manag. 2017, 44, 131–146. [Google Scholar] [CrossRef]
  17. Yuen, K.F.; Lim, J.M. Barriers to the Implementation of Strategic Corporate Social Responsibility in Shipping. Asian J. Shipp. Logist. 2016, 32, 49–57. [Google Scholar] [CrossRef]
  18. Van den Bos, G.; Wiegmans, B. Short sea shipping: A statistical analysis of influencing factors on SSS in European countries. J. Shipp. Trade 2018, 3, 6. [Google Scholar] [CrossRef] [Green Version]
  19. Russo, F.; Musolino, G.; Assumma, V. Competition between Ro–Ro and Lo–Lo Services in Short Sea Shipping Market: The Case of Mediterranean Countries. Res. Transp. Bus. Manag. 2016, 19, 27–33. [Google Scholar] [CrossRef]
  20. Papadimitriou, S.; Lyridis, D.V.; Koliousis, I.; Tsioumas, V.; Sdoukopoulos, E.; Stavroulakis, P.J. The Dynamics of Short Sea Shipping: New Practices and Trends. In Palgrave Studies in Maritime Economics; Palgrave Macmillan: London, UK, 2018. [Google Scholar]
  21. López-Navarro, M.Á. Environmental Factors and Intermodal Freight Transportation: Analysis of the Decision Bases in the Case of Spanish Motorways of the Sea. Sustainability 2014, 6, 1544–1566. [Google Scholar] [CrossRef] [Green Version]
  22. Arof, A.M. Decision Making Model for Ro-Ro Short Sea Shipping Operations in Archipelagic Southeast Asia. Asian J. Shipp. Logist. 2018, 34, 33–42. [Google Scholar] [CrossRef]
  23. Bergantino, A.; Bolis, S.; Canali, C. A Methodological Framework to Analyse the Market Opportunities of Short Sea Shipping: The Adaptive Stated Preference approach. In Towards Better Performing European Transport Networks; Jourquin, B., Rietveld, P., Westin, K., Eds.; Routledge: London, UK, 2006; pp. 285–304. [Google Scholar]
  24. Brooks, M.R.; Puckett, S.M.; Hensher, D.A.; Sammons, A. Understanding Mode Choice Decisions: A Study of Australian Freight Shippers. Marit. Econ. Logist. 2012, 14, 274–299. [Google Scholar] [CrossRef] [Green Version]
  25. PaixaoCasaca, A.C.; Galvao, C.B.; Robles, L.T.; Cutrim, S.S. Domestic Short Sea Shipping Services in Brazil: Competition by Enhancing Logistics Integration. Int. J. Shipp. Transp. Logist. 2017, 9, 280. [Google Scholar] [CrossRef]
  26. Yotsov, I.V.; Dimitrakiev, D.Y.; Zaburtov, A.; Koritarov, T.D. Analysis of the Logistics Transport Corridors in Black Sea Region Based on the Short Sea Shipping Concept. In Proceedings of the Annual General Assembly of the International Association of Maritime Universities, Barcelona, Spain, 11–13 October 2017. [Google Scholar]
  27. López, A.M.; Sobrino, P.C.; Santos, L.C. Definition of Optimal Fleets for Sea Motorways: The Case of France and Spain on the Atlantic Coast. Int. J. Shipp. Transp. Logist. 2015, 7, 89–113. [Google Scholar]
  28. Koliousis, I.; Koliousis, P.; Papadimitriou, S. Estimating the Impact of Road Transport Deregulation in Short Sea Shipping: Experience from Deregulation in the European Union. Int. J. Shipp. Transp. Logist. 2013, 5, 500–511. [Google Scholar] [CrossRef]
  29. López-Navarro, M.Á. Unaccompanied transport as a strategy for international road hauliers in Ro-Ro short sea shipping. Marit. Econ. Logist. 2013, 15, 374–394. [Google Scholar] [CrossRef]
  30. Windover, P.; Roy, B.; Tario, J. Electric Propulsion in Short Sea Shipping. World Electr. Veh. J. 2012, 5, 288–299. [Google Scholar] [CrossRef] [Green Version]
  31. Spoof-Tuomi, K.; Niemi, S. Environmental and Economic Evaluation of Fuel Choices for Short Sea Shipping. Clean Technol. 2020, 2, 34–52. [Google Scholar] [CrossRef] [Green Version]
  32. Santos, T.A.; Soares, C.G. Methodology for Ro-Ro Ship and Fleet Sizing with Application to Short Sea Shipping. Marit. Policy Manag. 2017, 44, 859–881. [Google Scholar] [CrossRef]
  33. López, A.M.; Kronbak, J.; Jiang, L. Cost and Time Models for the Evaluation of Intermodal Chains by Using Short Sea Shipping in the North Sea Region: The Rosyth-Zeebrugge Route. Int. J. Shipp. Transp. Logist. 2015, 7, 494–520. [Google Scholar] [CrossRef]
  34. Hjelle, H.M. Atmospheric Emissions of Short Sea Shipping Compared to Road Transport Through the Peaks and Troughs of Short-Term Market Cycles. Transp. Rev. 2014, 34, 379–395. [Google Scholar] [CrossRef]
  35. Vallejo-Pinto, J.A.; Garcia-Alonso, L.; Álvarez Fernández, R.; Mateo-Mantecón, I. Iso-Emission Map: A Proposal to Compare the Environmental Friendliness of Short Sea Shipping vs. Road Transport. Transp. Res. Part D Transp. Environ. 2019, 67, 596–609. [Google Scholar] [CrossRef]
  36. Konstantinus, A.; Zuidgeest, M.; Christodoulou, A.; Raza, Z.; Woxenius. Barriers and Enablers for Short Sea Shipping in the Southern African Development Community. Sustainability 2019, 11, 1532. [Google Scholar] [CrossRef] [Green Version]
  37. Bengtsson, S.K.; Fridell, E.; Andersson, K.E. Fuels for Short Sea Shipping: A Comparative Assessment with Focus on Environmental Impact. Proc. Inst. Mech. Eng. Part M J. Eng. Marit. Environ. 2013, 228. [Google Scholar] [CrossRef]
  38. Mulligan, R.F.; Lombardo, G.A. Short Sea Shipping: Alleviating the Environmental Impact of Economic Growth. WMU J. Marit. Aff. 2006, 5, 181–194. [Google Scholar] [CrossRef]
  39. Medda, F.; Trujillo, L. Short-sea shipping: An analysis of its determinants. Marit. Policy Manag. Flagship J. Int. Shipp. Port Res. 2010, 37, 285–303. [Google Scholar] [CrossRef]
  40. Johnson, H.; Styhre, L. Increased Energy Efficiency in Short Sea Shipping through Decreased Time in Port. Transp. Res. Part A Policy Pr. 2015, 71, 167–178. [Google Scholar] [CrossRef] [Green Version]
  41. Johnson, H.; Johansson, M.; Andersson, K. Barriers to improving energy efficiency in short sea shipping: An action research case study. J. Clean. Prod. 2014, 66, 317–327. [Google Scholar] [CrossRef]
  42. Schøyen, H.; Brathen, S. Measuring and Improving Operational Energy Efficiency in Short Sea Container Shipping. Res. Transp. Bus. Manag. 2015, 17, 26–35. [Google Scholar] [CrossRef]
  43. Casaca, A.C.P.; Marlow, P.B. The Impact of the Trans-European Transport Networks on the Development of Short Sea Shipping. Marit. Econ. Logist. 2007, 9, 302–323. [Google Scholar] [CrossRef]
  44. Christodoulou, A.; Raza, Z.; Woxenius, J. The Integration of RoRo Shipping in Sustainable Intermodal Transport Chains: The Case of a North European RoRo Service. Sustainability 2019, 11, 2422. [Google Scholar] [CrossRef] [Green Version]
  45. Nuzzolo, A.; Coppola, P.; Comi, A. Freight transport modeling: Review and future challenges. Int. J. Transp. Econ. 2013, 40, 151–181. [Google Scholar]
  46. Tavasszy, L.; De Jong, J. Modelling Freight Transport; Elsevier Ltd.: Amsterdam, The Netherlands, 2014. [Google Scholar]
  47. Cascetta, E.; Marzano, V.; Papola, A.; Aponte, D.; D’Agostino, Z.; Varrone, M. The Role of Modelling in Freight Governance: The Case of LOGICA (Agency For Freight Transport and Logistics Promotion of the Campania Region). In Proceedings of the European Transport Conference, Strasbourg, France, 1 October 2005. [Google Scholar]
  48. Nuzzolo, A.; Russo, F. Modal Split at International Level: A System of Models for Italian-Based Freight. In Proceedings of the European Transport Conference, London, UK, 1–5 September 1997. [Google Scholar]
  49. Rotaris, L.; Danielis, R.; Sarman, I.; Marcucci, E. Testing for Nonlinearity in the Choice of a Freight Transport Service. Eur. Transp.—Transp. Eur. 2012, 50, 1–22. [Google Scholar]
  50. Delle Site, P.; Kilani, K.; Gatta, V.; Marcucci, E.; de Palma, A. Estimation of consistent Logit and Probit models using best, worst and best–worst choices. Transp. Res. Part B Methodol. 2019, 128, 87–106. [Google Scholar] [CrossRef]
  51. Dobranskyte-Niskota, A.; Perujo, A.; Pregl, M. Indicators to Assess Sustainability of Transport Activities—Part 1: Review of the Existing Transport Sustainability Indicators Initiatives and Development of an Indicator Set to Assess Transport Sustainability Performance; European Commission: Luxembourg, 2007. [Google Scholar]
  52. Di Gangi, M.; Polimeni, A. A model to simulate multimodality in a mesoscopic dynamic network loading framework. J. Adv. Transp. 2017, 2017. [Google Scholar] [CrossRef] [Green Version]
  53. Nuzzolo, A.; Crisalli, A.; Comi, A. An aggregate transport demand model for import and export flow simulation. Transport 2015, 30, 43–54. [Google Scholar] [CrossRef] [Green Version]
  54. Ben-Akiva, M.; Lerman, S.R. Discrete Choice Analysis: Theory and Application to Travel Demand; The MIT Press: Cambridge, MA, USA, 1985. [Google Scholar]
  55. Train, K.E. Discrete Choice Methods with Simulation; Cambridge University Press: Cambridge, UK, 2009. [Google Scholar]
  56. Nuzzolo, A.; Comi, A. Individual utility-based path suggestions in transit trip planners. IET Intell. Transp. Syst. 2016, 10, 219–226. [Google Scholar] [CrossRef]
  57. De Jong, G.; Schroten, A.; Van Essen, H.; Otten, M.; Bucci, P. Price Sensitivity of European Road Freight Transport–Towards a Better Understanding of Existing Results: A Report for Transport & Environment; Report 9012-1; CE Delft: Delft, The Netherlands, 2010. [Google Scholar]
  58. Crisalli, U.; Comi, A.; Rosati, L. A methodology for the assessment of rail-road freight transport policies. Procedia Soc. Behav. Sci. 2013, 87, 292–305. [Google Scholar] [CrossRef]
  59. HECT. Handbook on External Costs of Transport; European Commission: Brussels, Belgium, 2019. [Google Scholar]
Figure 1. Assessment methodology.
Sustainability 12 05383 g001
Figure 2. Main Ro-Ro ports considered in the north-western Mediterranean basin.
Sustainability 12 05383 g002
Figure 3. SSS (short sea shipping) services and average level of service attributes (174 weekly services).
Sustainability 12 05383 g003
Figure 4. Combined road-rail services and average level of service attributes (784 weekly services).
Sustainability 12 05383 g004
Figure 5. Road services and average level of service attributes.
Sustainability 12 05383 g005
Figure 6. Scenario definition: Scenario 1 (a), scenario 2 (b).
Sustainability 12 05383 g006
Table 1. Origin-Destination matrix at country level.
O-D
[tons/year]
SpainItalyMontenegroGreece
Spain-SSS: 652,000 (26%)
Railway: 272,000 (5%)
Road: 3,664,000 (69%)
--
ItalySSS: 603,000 (28%)
Railway: 141,000 (3%)
Road: 3,294,000 (69%)
-SSS: 1000 (50%)
Railway: 8000 (35%)
Road: 9000 (15%)
SSS: 245,000 (73%)
Railway: 9000 (0%)
Road: 858,000 (27%)
Montenegro-SSS: 1000 (58%)
Railway: 2000 (16%)
Road: 10,000 (26%)
--
Greece-SSS: 256,000 (70%)
Railway: 2000 (0%)
Road: 947,000 (30%)
--
Table 2. Mode choice model: Parameter estimation.
Attribute/
Mode Alternative
SSSCombined Road-RailRoad
Time (h)−0.0403−0.0408−0.0386
Cost (€)−0.6572−0.7646−0.5241
Frequency (runs/week)0.03000.0182-
ASA-−0.74181.1046
R20.98
VoT (€/h)61.3453.4173.71
Table 3. Validation results of mode choice model: Direct and cross arc elasticities.
Percentage Variation of the CostSSSCombined Road-RailRoad
SSS: ΔCsea/Csea = +10%−0.610.290.31
Combined road-rail: ΔCrail/Crail = +10%0.02−0.680.03
Road: ΔCroad/Croad = +10%0.650.70−0.39
Table 4. Assessment results: Modal share in scenario 1 in terms of tons.
Transport ModeBase ScenarioScenario 1Scenario 1 vs. Base Scenario
SSS12%24%106%
Combined road-rail2%2%−21%
Road86%74%−14%
Table 5. Scenario 1 assessment results: Modal share in terms of t-km/year.
Transport ModeBase ScenarioScenario 1Scenario 1 vs. Base Scenario
SSS13%24%68%
Combined road-rail3%3%−23%
Road84%73%−21%
Table 6. Assessment results: Modal share in scenario 2 in terms of tons.
Transport ModeBase ScenarioScenario 2Scenario 2 vs. Base Scenario
SSS12%31%167%
Combined road-rail2%2%−30%
Road86%67%−22%
Table 7. Scenario 2 assessment results: Modal share in terms of t-km/year.
Transport ModeBase ScenarioScenario 2Scenario 2 vs. Base Scenario
SSS13%32%123%
Combined road-rail3%2%−29%
Road84%66%−24%
Table 8. Assessment results: Comparison in terms of external costs.
Scenario 1 vs. Base Scenario
SSSCombined Road-RailRoad
air pollutant91%−23%−21%
accidents93%−23%−21%
congestion93% −21%
noise93%−23%−21%
greenhouse70%−23%−21%
Total86%−23%−21%
Average−16%
Scenario 2 vs. Base Scenario
SSSCombined Road-RailRoad
air pollutant147%−29%−24%
accidents148%−29%−24%
congestion148% −24%
noise148%−29%−24%
greenhouse125%−29%−24%
Total142%−29%−24%
Average−19%

