A Dual Challenge in China’s Sustainable Total Factor Productivity Growth
Abstract
1. Introduction
2. Methodology
2.1. Decomposing Total Factor Productivity Growth
2.2. Data Sources
3. Empirical Results and Discussion
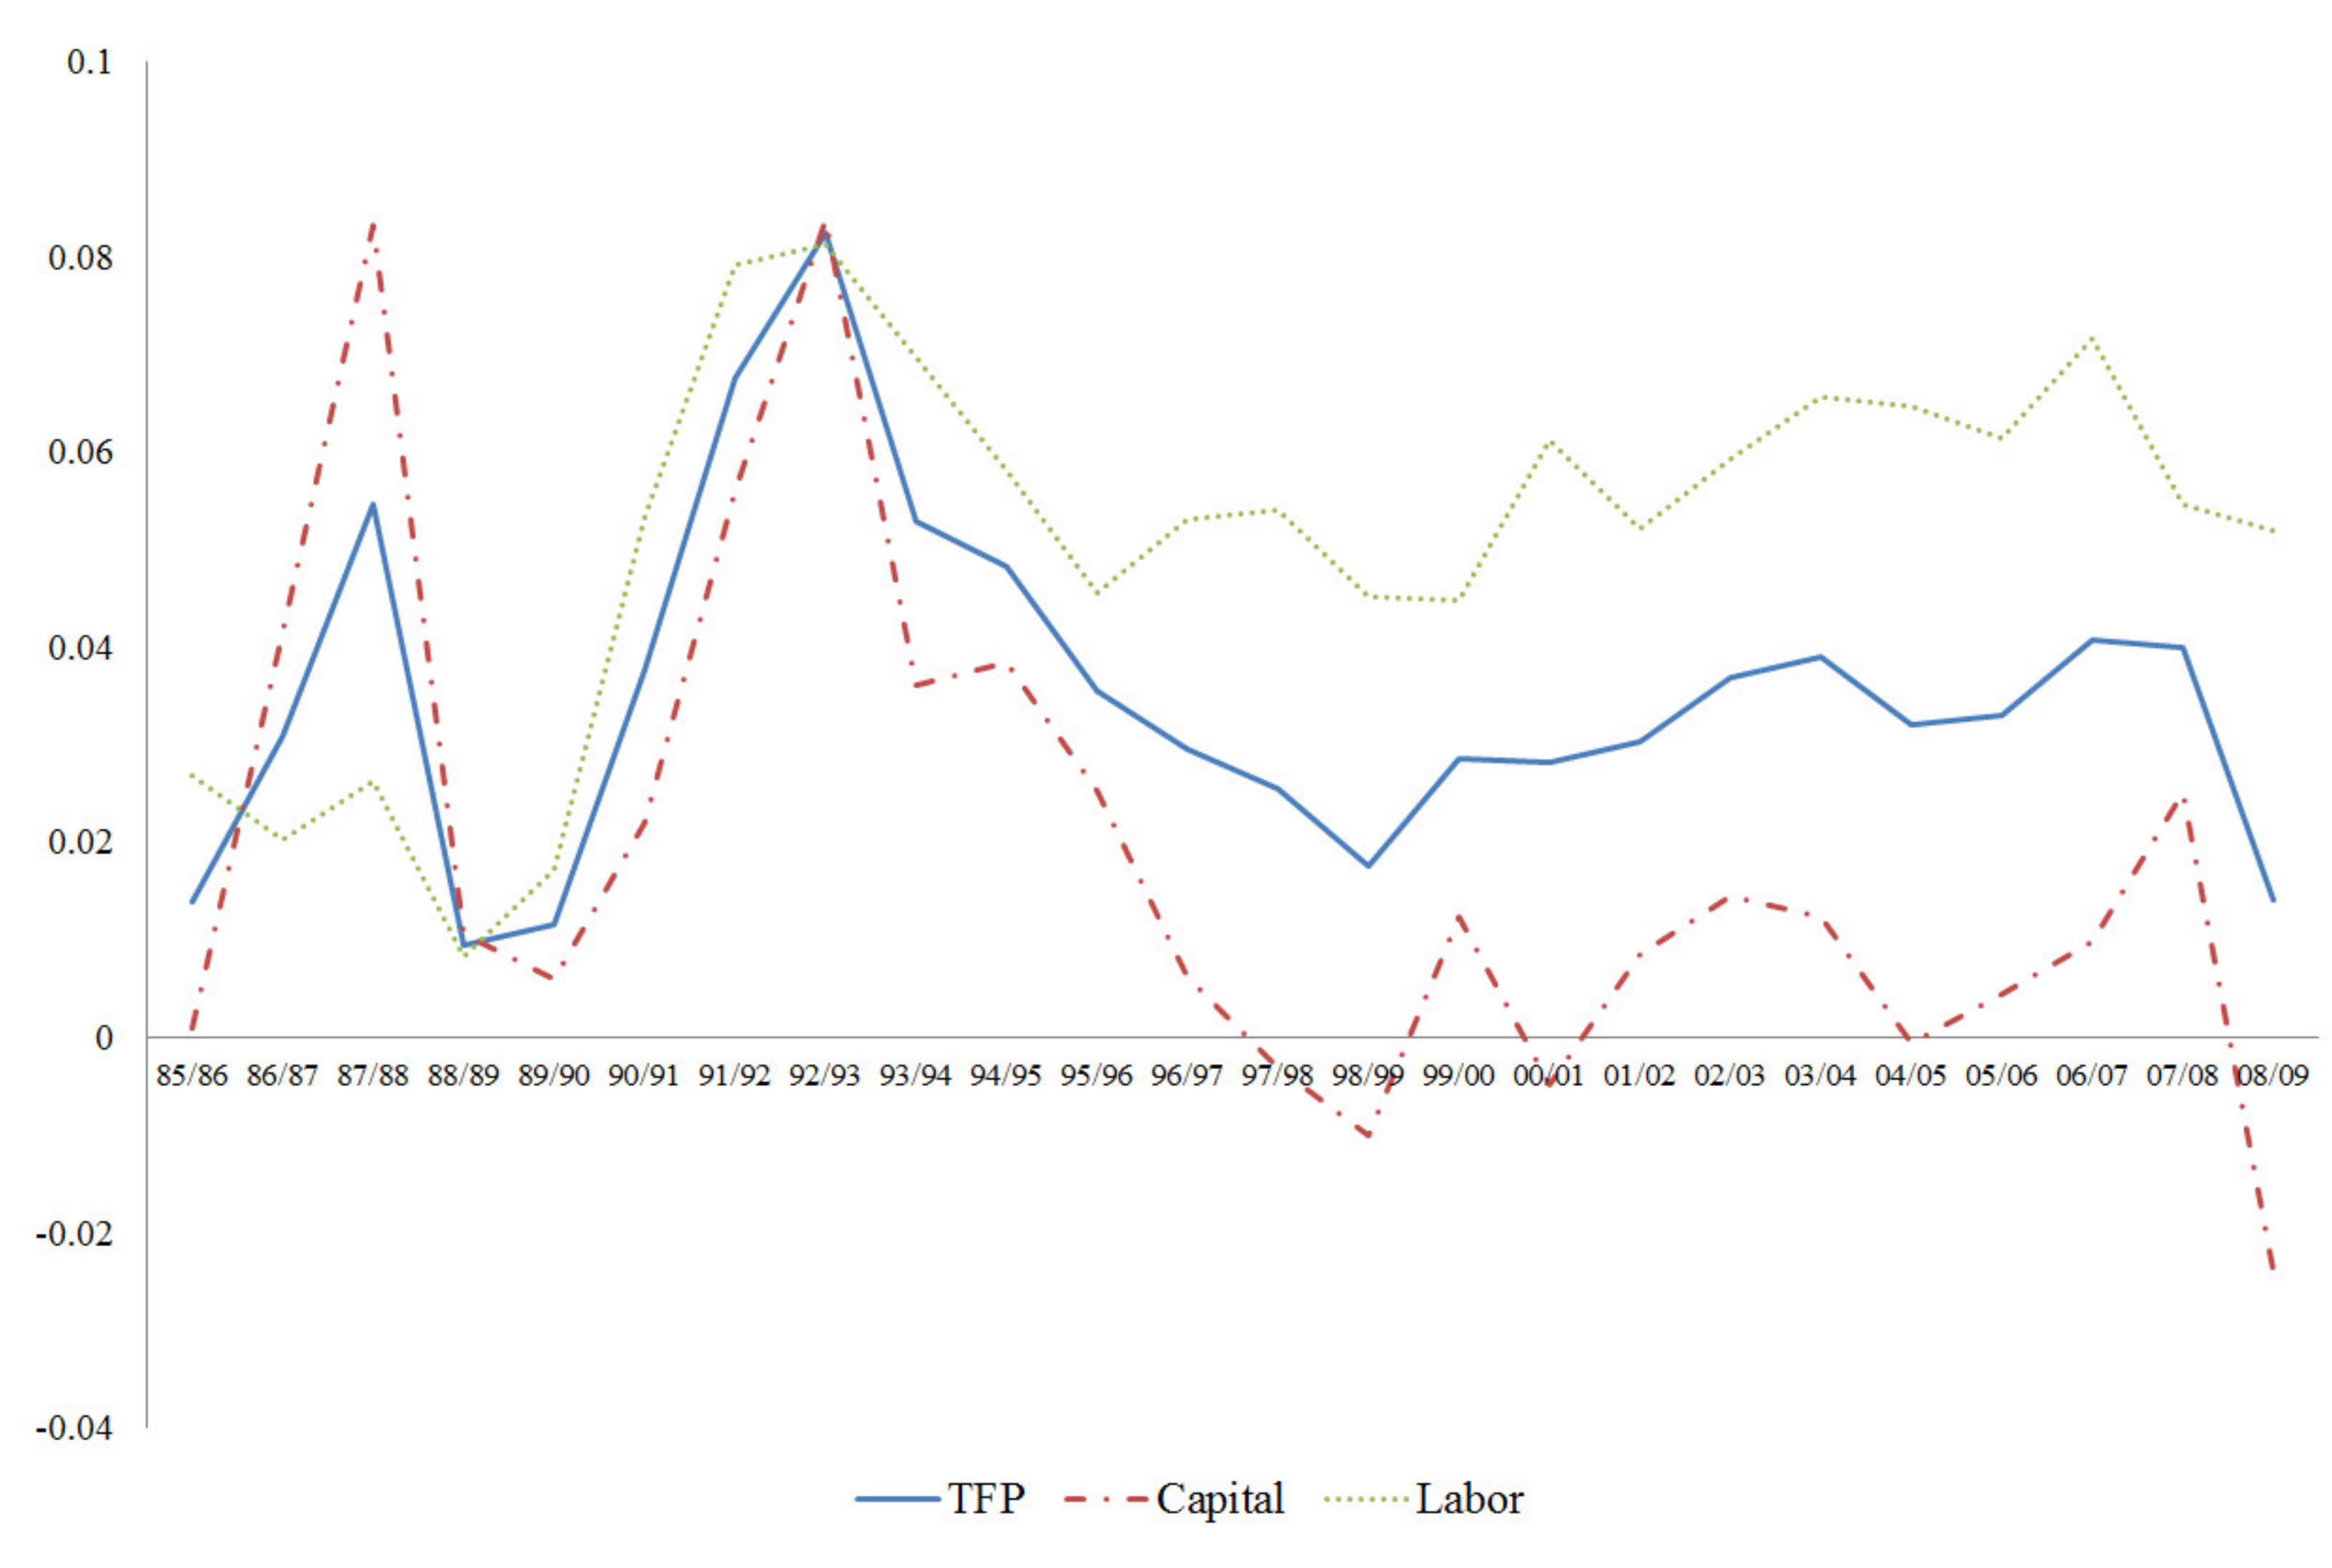
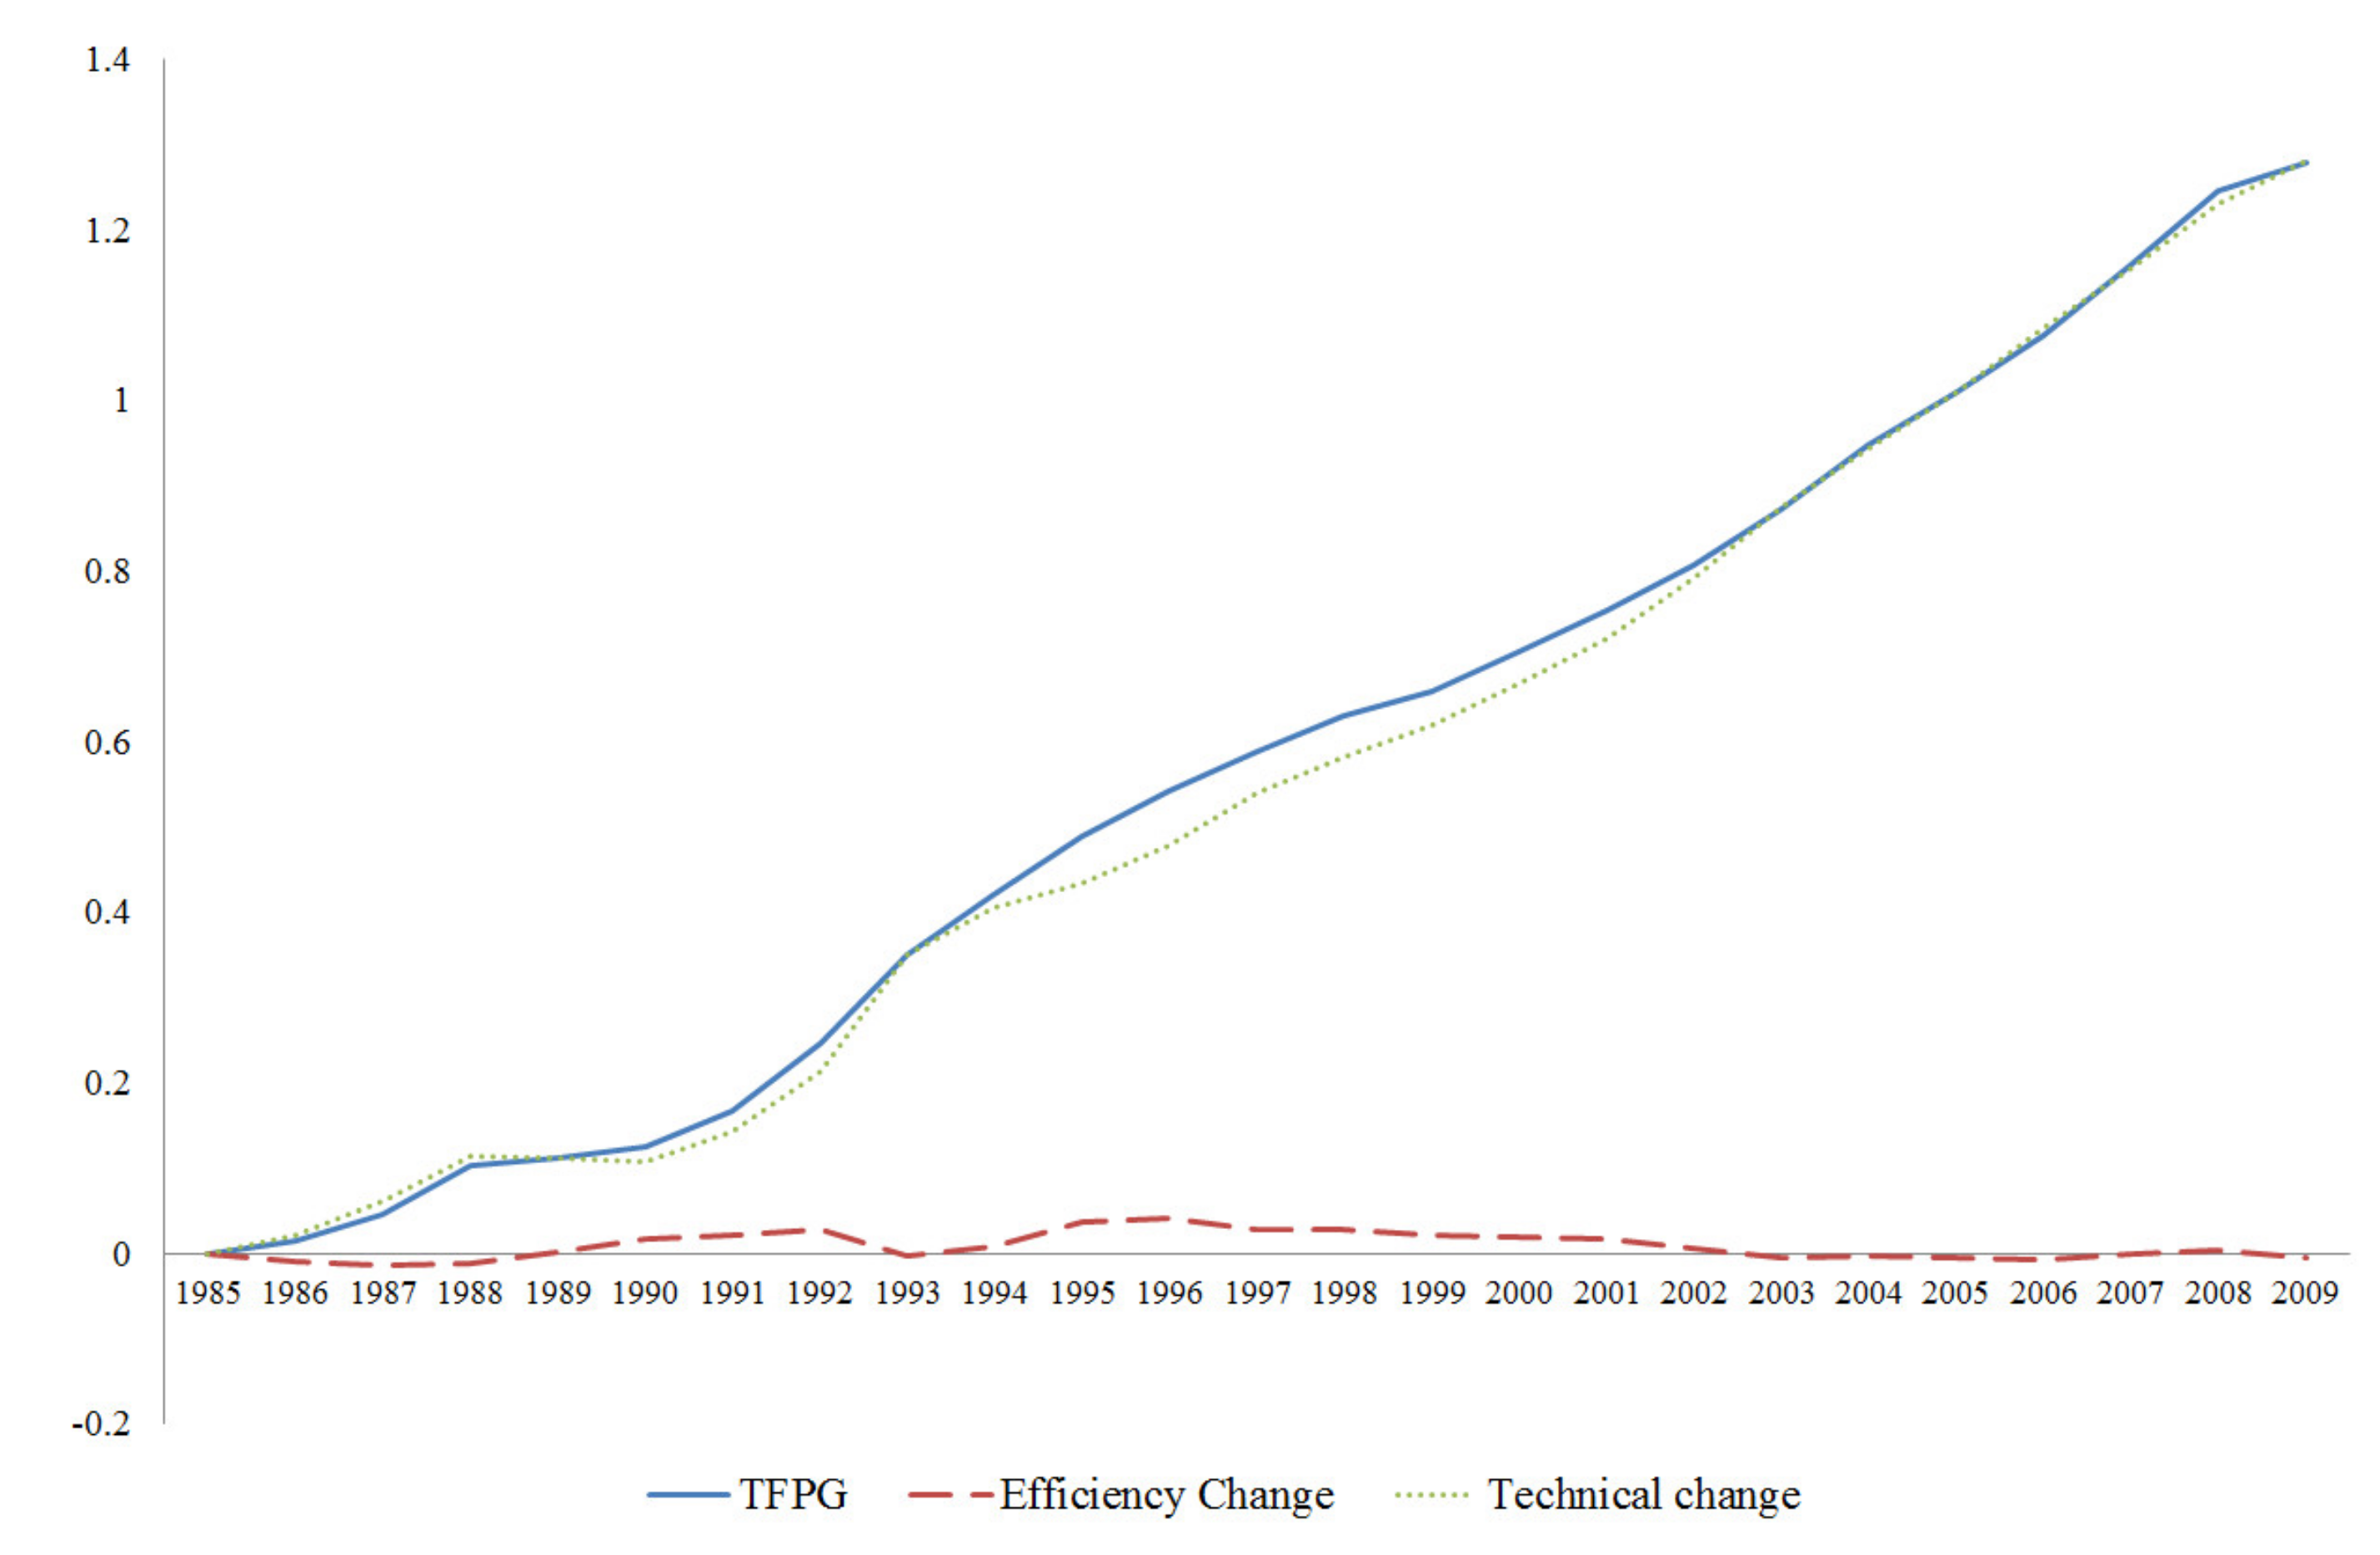
3.1. TFPG at the National Level
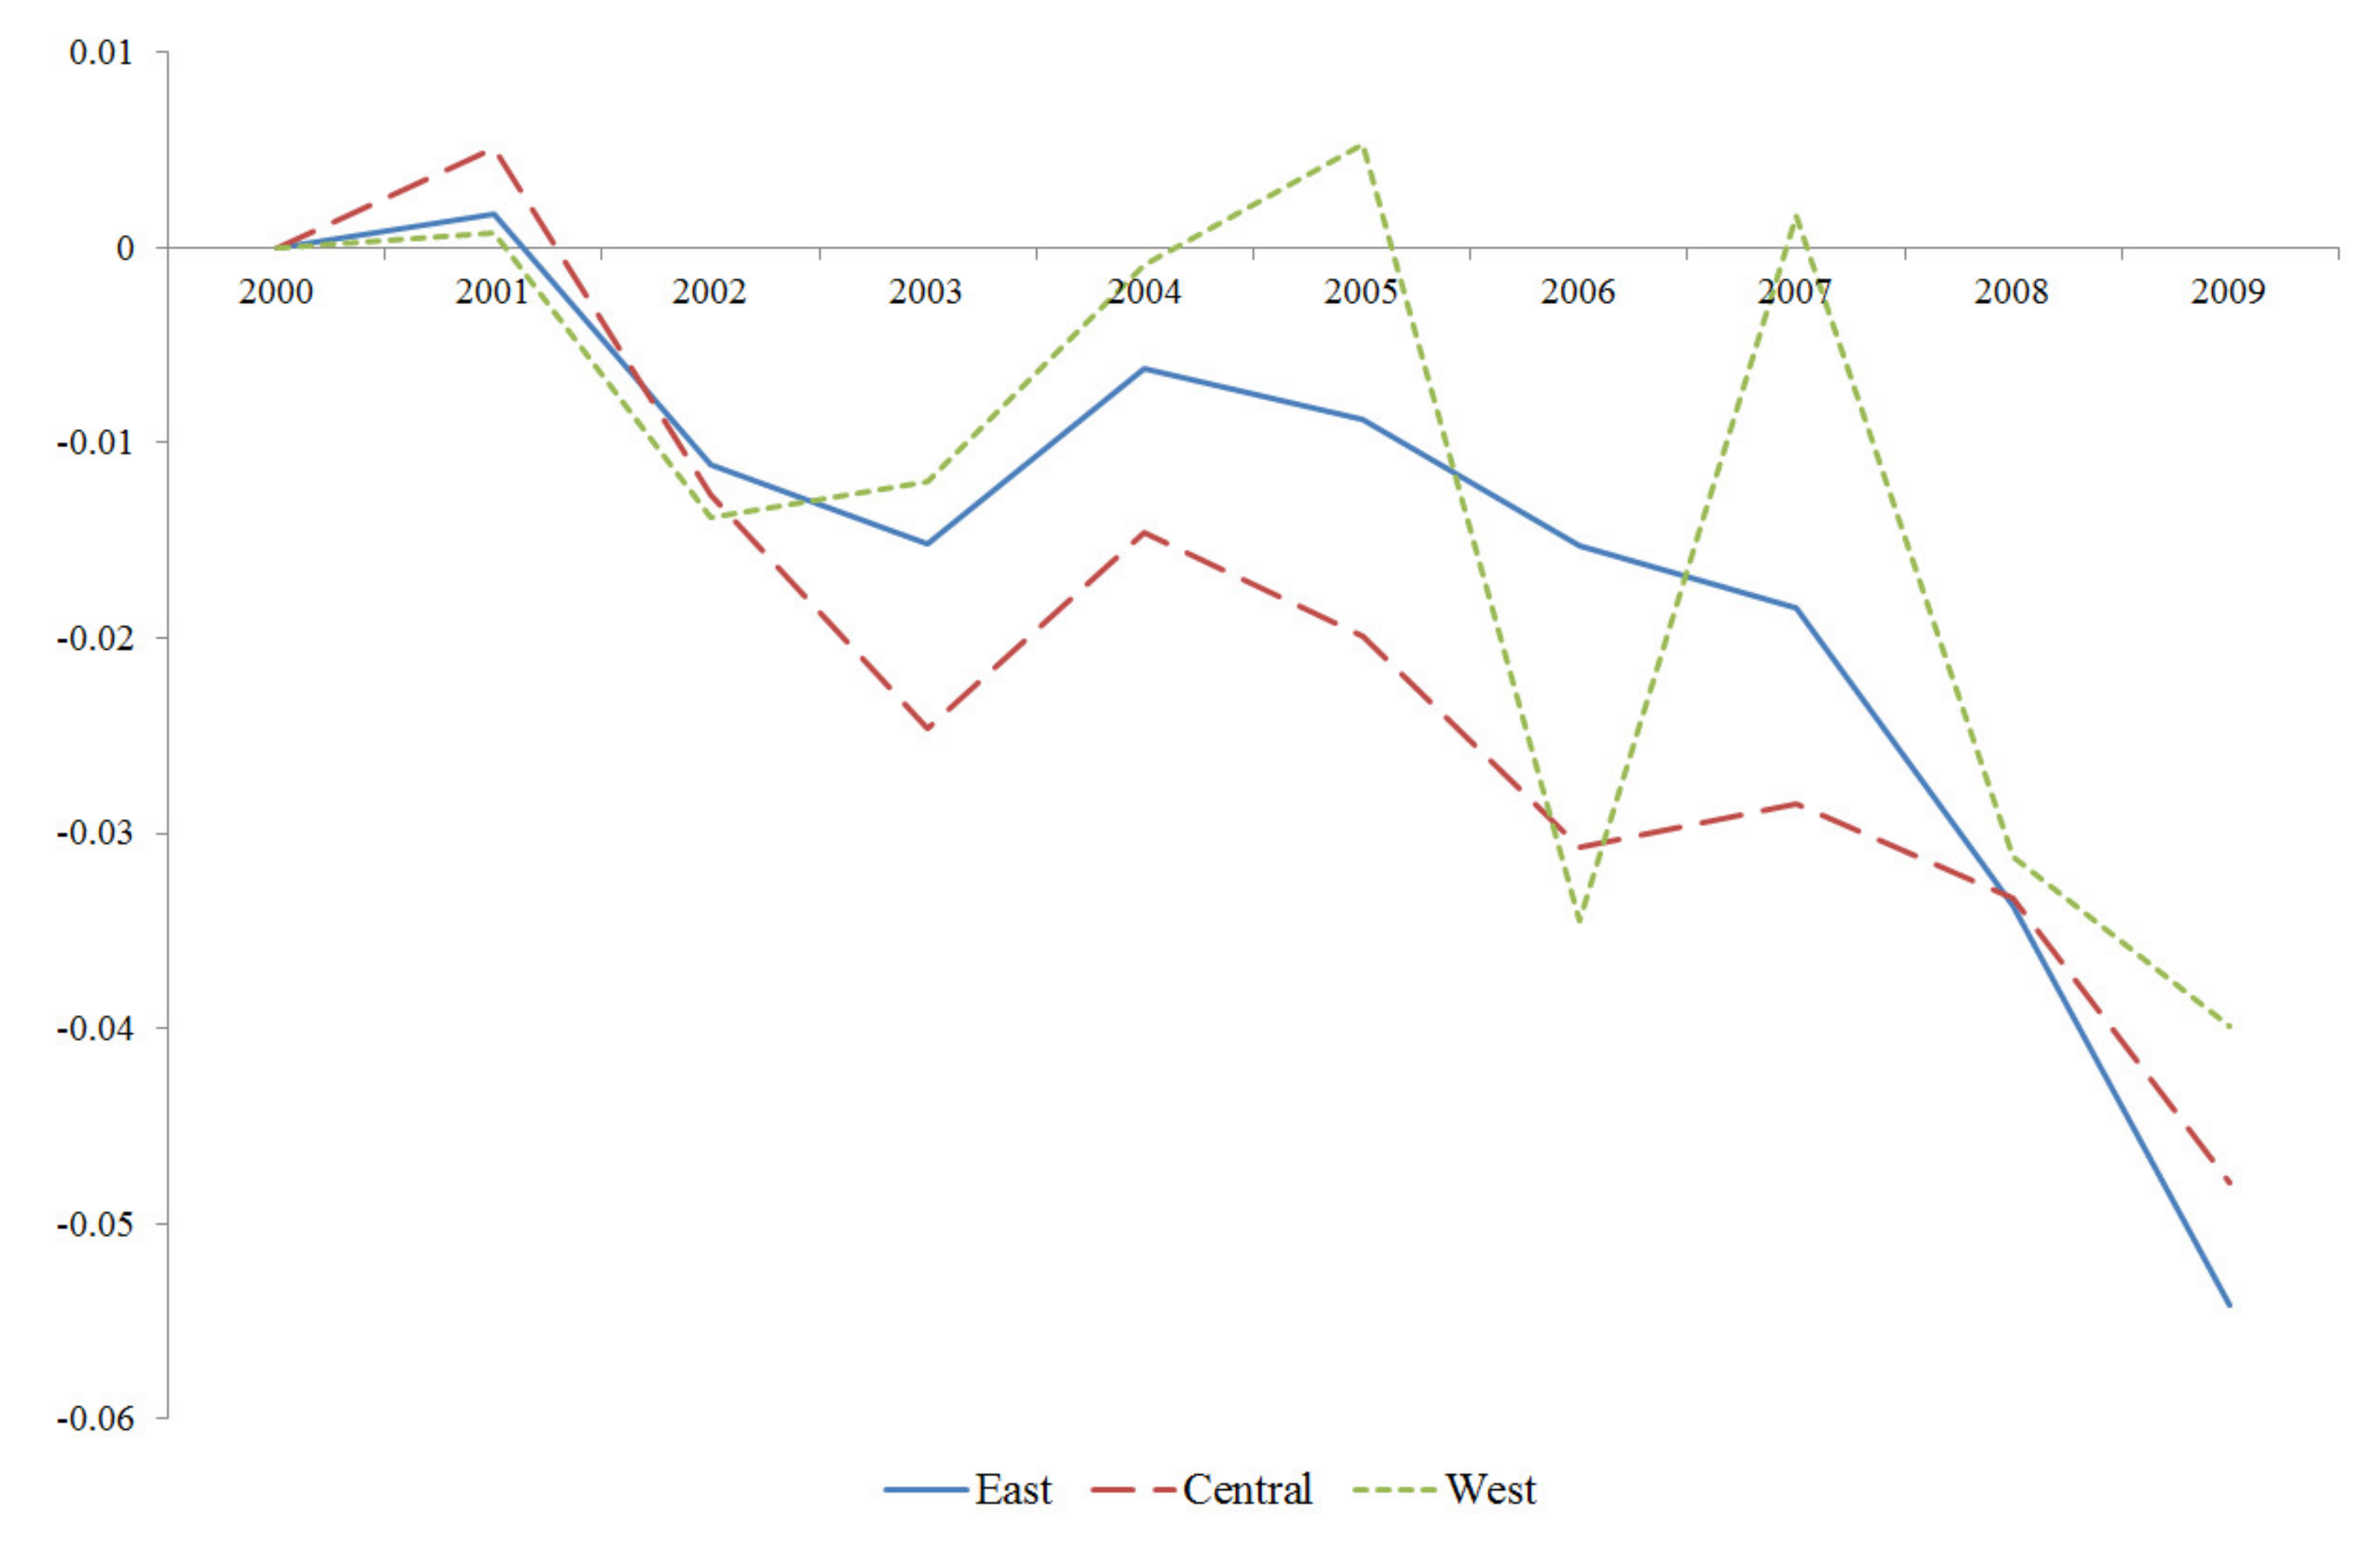
3.2. TFPG at the Regional Level
3.3. TFPG at the Provincial Level
3.4. A Rising Concern about Labor Efficiency
4. Conclusions
Author Contributions
Funding
Conflicts of Interest
References
- Holz, C.A. China’s economic growth 1978–2025: What we know today about China’s economic growth tomorrow. World Dev. 2008, 36, 1665–1691. [Google Scholar] [CrossRef]
- Chow, G.C.; Li, K. China’s economic growth: 1952–2010. Econ. Dev. Cult. Chang. 2002, 51, 247–256. [Google Scholar] [CrossRef]
- Islam, N.; Dai, E.; Sakamoto, H. Role of TFP in China’s growth. Asian Econ. J. 2006, 20, 127–159. [Google Scholar]
- Li, K.W.; Liu, T. Economic and productivity growth decomposition: An application to post-reform China. Econ. Model. 2011, 29, 366–373. [Google Scholar] [CrossRef]
- Chen, S.; Jefferson, G.H.; Zhang, J. Structural change, productivity growth and 24 industrial transformation in China. China Econ. Rev. 2011, 22, 133–150. [Google Scholar] [CrossRef]
- Shen, X.; Lin, B.; Wu, W. R&D efforts, total factor productivity, and the energy intensity in China. Emerg. Mark. Financ. Trade 2019, 55, 2566–2588. [Google Scholar]
- Tian, X.; Yu, X. The enigmas of TFP in China: A meta-analysis. China Econ. Rev. 2012, 23, 396–414. [Google Scholar] [CrossRef]
- You, K.; Sarantis, N. Structural breaks, rural transformation and total factor productivity growth in China. J. Prod. Anal. 2013, 39, 231–242. [Google Scholar] [CrossRef]
- Zheng, J.; Bigsten, A.; Hu, A. Can China’s growth be sustained? A productivity perspective. World Dev. 2009, 37, 874–888. [Google Scholar] [CrossRef]
- Bloom, D.E.; Williamson, J.G. Demographic transitions and economic miracles in emerging Asia. World Bank Econ. Rev. 1998, 12, 419–455. [Google Scholar] [CrossRef]
- Cai, F.; Lu, Y. Population change and resulting slowdown in potential GDP growth in China. China World Econ. 2013, 21, 1–14. [Google Scholar] [CrossRef]
- Ogawa, N.; Chen, Q. End of the first demographic dividend and possible labor market response in China and other Asian countries. China World Econ. 2013, 21, 78–96. [Google Scholar] [CrossRef]
- Wang, X.; Chen, K.Z.; Robinson, S.; Huang, Z. Will China’s demographic transition exacerbate its income inequality? CGE modeling with top-down microsimulation. J. Asia Pac. Econ. 2017, 22, 227–252. [Google Scholar] [CrossRef]
- Cai, F. Demographic transition, demographic dividend, and Lewis turning point in China. China Econ. J. 2010, 3, 107–119. [Google Scholar] [CrossRef]
- Ye, G.; Wang, Y.; Zhang, Y.; Wang, L.; Xie, H.; Fu, Y.; Zuo, J. Impact of Migrant Workers on Total Factor Productivity in Chinese Construction Industry. Sustainability 2019, 11, 926. [Google Scholar] [CrossRef]
- Chen, E.K.Y. The total factor productivity debates: Determinants of economic growth in East Asia. Asian-Pac. Econ. Lit. 1997, 11, 18–38. [Google Scholar] [CrossRef]
- Ten Raa, T.; Shestalova, V. The Solow residual, Domar aggregation, and inefficiency: A synthesis of TFP measures. J. Prod. Anal. 2011, 30, 191–199. [Google Scholar] [CrossRef]
- Kumbhaker, S.C.; Lovell, C.A.K. Stochastic Frontier Analysis; Cambridge University Press: New York, NY, USA, 2000. [Google Scholar]
- Guillaumont Jeanneney, S.; Hua, P.; Liang, Z. Financial development, economic efficiency, and productivity growth: Evidence from China. Dev. Econ. 2006, 44, 27–52. [Google Scholar] [CrossRef]
- Chang, T.-P.; Hu, J.L.; Chou, R.Y.; Sun, L. The sources of bank productivity growth in China during 2002–2009: A disaggregation view. J. Bank. Financ. 2012, 36, 1997–2006. [Google Scholar] [CrossRef]
- Chambers, R.G.; Chung, Y.; Färe, R. Benefit and distance functions. J. Econ. Theory 1996, 70, 407–419. [Google Scholar] [CrossRef]
- Boussemart, J.P.; Briec, W.; Kerstens, K.; Poutineau, J.C. Luenberger and Malmquist productivity indices: Theoretical comparisons and empirical illustration. Bull. Econ. Res. 2003, 55, 391–405. [Google Scholar] [CrossRef]
- Briec, W. An extended Färe-Lovell technical efficiency measure. Int. J. Prod. Econ. 2000, 65, 191–199. [Google Scholar] [CrossRef]
- Shan, H. Reestimating the Capital Stock of China: 1952–2006. J. Quant. Tech. Econ. 2008, 10, 17–31. (In Chinese) [Google Scholar]
- Wu, J.; Li, N.; Shi, P. Benchmark wealth capital stock estimations across China’s 344 prefectures: 1978 to 2012. China Econ. Rev. 2014, 31, 288–302. [Google Scholar] [CrossRef]
- Wu, Y. Has productivity contributed to China’s growth? Pac. Econ. Rev. 2003, 8, 15–33. [Google Scholar] [CrossRef]
- Yang, L.; Lahr, M.L. Labor productivity differences in China 1987–1997: An interregional decomposition analysis. Rev. Reg. Stud. 2008, 38, 319–341. [Google Scholar] [CrossRef]
- Zheng, J.; Hu, A. An empirical analysis of provincial productivity in China (1979–2001). J. Chin. Econ. Bus. Stud. 2006, 4, 221–239. [Google Scholar] [CrossRef][Green Version]
- Chen, K.H.; Huang, Y.J.; Yang, C.H. Analysis of regional productivity growth in China: A generalized metafrontier MPI approach. China Econ. Rev. 2009, 20, 777–792. [Google Scholar] [CrossRef]
- Chen, J.; Fleisher, B. Regional income inequality and economic growth in China. J. Comp. Econ. 1996, 22, 141–164. [Google Scholar] [CrossRef]
- Chen, M.; Zheng, Y. China’s regional disparity and its policy responses. China World Econ. 2008, 16, 16–32. [Google Scholar] [CrossRef]
- Fleisher, B.; Li, H.; Zhao, M.Q. Human capital, economic growth, and regional inequality in China. J. Dev. Econ. 2010, 92, 215–231. [Google Scholar] [CrossRef]
- Andersson, F.N.G.; Edgerton, D.L.; Opper, S. A matter of time: Revisiting growth convergence in China. World Dev. 2013, 45, 239–251. [Google Scholar] [CrossRef]
- Wei, Z.; Kwan, F. Revisit China’s Lewis turning point: An analysis from a regional perspective. Asian Econ. J. 2018, 32, 333–357. [Google Scholar] [CrossRef]
- Yu, H.; Liu, Y.; Zhao, J.; Li, G. Urban total factor productivity: Does urban Spatial structure matter in China? Sustainability 2019, 12, 214. [Google Scholar] [CrossRef]
- Wei, Z.; Hao, R. The role of human capital in China’s total factor productivity growth: A cross-province analysis. Dev. Econ. 2011, 49, 1–35. [Google Scholar] [CrossRef]
- Yang, L.; Lahr, M.L. Sources of Chinese labor productivity growth: A structural decomposition analysis, 1987–2005. China Econ. Rev. 2010, 21, 557–570. [Google Scholar] [CrossRef]
- Färe, R.; Grosskopf, S.; Norris, M.; Zhang, Z. Productivity growth, technical progress, and efficiency change in industrialized countries. Am. Econ. Rev. 1994, 84, 66–83. [Google Scholar]
- Li, S.S.; Fu, L.; Ma, Y. Higher education and productivity in China. Educ. Sci. Theory Pract. 2018, 18, 1863–1875. [Google Scholar]
- Huang, J.; Cai, X.; Huang, S.; Tian, S.; Lei, H. Technological factors and total factor productivity in China: Evidence based on a panel threshold model. China Econ. Rev. 2019, 54, 271–285. [Google Scholar] [CrossRef]
- Liu, J.; Bi, C. Effects of higher education levels on total factor productivity growth. Sustainability 2019, 11, 1790. [Google Scholar] [CrossRef]
- Ho, C.C.; Lin, H.L.; Yang, C.H.; Lyu, Y.P. Productivity catch-up between Chinese and Taiwanese electronics firms. Pac. Econ. Rev. 2017, 22, 533–553. [Google Scholar] [CrossRef]


| Components | 1985–1993 | 1993–2009 | 1985–2009 |
|---|---|---|---|
| Average growth rate (%) | |||
| TFP | 3.86 | 3.33 | 3.50 |
| KPG | 3.81 | 0.95 | 1.90 |
| LPG | 3.91 | 5.71 | 5.11 |
| GDP growth | 9.62 | 10.11 | 9.95 |
| Contribution (%) | |||
| TFPG | 40.08 | 32.94 | 35.24 |
| KPG | 19.77 | 4.68 | 9.55 |
| LPG | 20.31 | 28.26 | 25.69 |
| Years | TFPG | KPG | LPG | |||
|---|---|---|---|---|---|---|
| EFFCH | TECHCH | EFFCHK | TECHCHK | EFFCHL | TECHCHL | |
| 85/86 | −0.0084 | 0.0224 | −0.0268 | 0.0279 | 0.0100 | 0.0169 |
| 86/87 | −0.0063 | 0.0372 | −0.0106 | 0.0522 | −0.0020 | 0.0223 |
| 87/88 | 0.0036 | 0.0512 | 0.0182 | 0.0650 | −0.0110 | 0.0373 |
| 88/89 | 0.0121 | −0.0025 | 0.0227 | −0.0121 | 0.0014 | 0.0070 |
| 89/90 | 0.0162 | −0.0047 | 0.0127 | −0.0068 | 0.0198 | −0.0026 |
| 90/91 | 0.0041 | 0.0335 | −0.0200 | 0.0420 | 0.0283 | 0.0251 |
| 91/92 | 0.0061 | 0.0616 | 0.0022 | 0.0539 | 0.0099 | 0.0692 |
| 92/93 | −0.0302 | 0.1127 | −0.0294 | 0.1133 | −0.0309 | 0.1122 |
| 93/94 | 0.0129 | 0.0400 | 0.0266 | 0.0095 | −0.0008 | 0.0705 |
| 94/95 | 0.0274 | 0.0208 | 0.0437 | −0.0052 | 0.0112 | 0.0469 |
| 95/96 | 0.0042 | 0.0313 | −0.0053 | 0.0306 | 0.0137 | 0.0319 |
| 96/97 | −0.0118 | 0.0414 | −0.0088 | 0.0150 | −0.0147 | 0.0679 |
| 97/98 | −0.0009 | 0.0264 | −0.0068 | 0.0037 | 0.0050 | 0.0490 |
| 98/99 | −0.0070 | 0.0246 | −0.0224 | 0.0124 | 0.0084 | 0.0368 |
| 99/00 | −0.0016 | 0.0302 | −0.0133 | 0.0258 | 0.0102 | 0.0346 |
| 00/01 | −0.0026 | 0.0308 | −0.0076 | 0.0027 | 0.0023 | 0.0589 |
| 01/02 | −0.0106 | 0.0410 | −0.0063 | 0.0150 | −0.0148 | 0.0670 |
| 02/03 | −0.0099 | 0.0468 | −0.0155 | 0.0301 | −0.0042 | 0.0636 |
| 03/04 | 0.0022 | 0.0369 | −0.0058 | 0.0183 | 0.0102 | 0.0555 |
| 04/05 | −0.0024 | 0.0345 | −0.0045 | 0.0039 | −0.0003 | 0.0651 |
| 05/06 | −0.0036 | 0.0366 | 0.0119 | −0.0074 | −0.0191 | 0.0806 |
| 06/07 | 0.0065 | 0.0343 | 0.0007 | 0.0091 | 0.0123 | 0.0594 |
| 07/08 | 0.0058 | 0.0342 | 0.0302 | −0.0050 | −0.0186 | 0.0733 |
| 08/09 | −0.0087 | 0.0228 | −0.0022 | −0.0217 | −0.0153 | 0.0673 |
| Average | −0.0001 | 0.0352 | −0.0007 | 0.0197 | 0.0004 | 0.0507 |
| A: 1985–2009 | TFPG | Contribution from KPG | Contribution from LPG | ||||
|---|---|---|---|---|---|---|---|
| KPG | EFFCHK | TECHCHK | LPG | EFFCHL | TECHCHL | ||
| East | 0.0490 | 29.74% | −1.67% | 31.41% | 70.26% | 5.88% | 64.38% |
| Central | 0.0274 | 20.20% | −2.32% | 22.52% | 79.80% | −3.44% | 83.23% |
| West | 0.0258 | 27.44% | 1.65% | 25.79% | 72.56% | −6.84% | 79.40% |
| B: 2000–2009 | |||||||
| East | 0.0463 | 6.26% | −4.50% | 10.75% | 93.74% | −6.61% | 100.36% |
| Central | 0.0251 | 0.04% | 6.15% | −6.10% | 99.96% | −10.74% | 110.70% |
| West | 0.0238 | 17.62% | 5.14% | 12.48% | 82.38% | −8.96% | 91.34% |
| C: 2006–2009 | |||||||
| East | 0.0437 | 0.99% | 15.22% | −14.23% | 99.01% | −15.25% | 114.25% |
| Central | 0.0235 | −10.97% | 19.60% | −30.57% | 110.97% | −12.64% | 123.61% |
| West | 0.0248 | 28.08% | 11.81% | 16.28% | 71.92% | −2.94% | 74.85% |
| TFP | Capital Productivity | Labor Productivity | |||||||
|---|---|---|---|---|---|---|---|---|---|
| TFPG | EFFCH | TECHCH | KPG | EFFCHK | TECHCHK | LPG | EFFCHL | TECHCHL | |
| Beijing | 0.0470 | −0.0048 | 0.0517 | 0.0664 | −0.0123 | 0.0788 | 0.0275 | 0.0028 | 0.0247 |
| Tianjin | 0.0713 | 0.0120 | 0.0592 | 0.0265 | 0.0102 | 0.0163 | 0.1160 | 0.0139 | 0.1022 |
| Hebei | 0.0304 | −0.0023 | 0.0327 | 0.0070 | −0.0064 | 0.0134 | 0.0537 | 0.0018 | 0.0519 |
| Shanxi | 0.0292 | 0.0000 | 0.0292 | 0.0134 | 0.0042 | 0.0092 | 0.0449 | −0.0043 | 0.0492 |
| Inner Mongolia | 0.0353 | 0.0011 | 0.0342 | 0.0400 | 0.0000 | 0.0400 | 0.0306 | 0.0022 | 0.0284 |
| Liaoning | 0.0612 | 0.0000 | 0.0612 | 0.0357 | 0.0000 | 0.0357 | 0.0867 | 0.0000 | 0.0867 |
| Jilin | 0.0326 | −0.0025 | 0.0351 | 0.0071 | −0.0051 | 0.0122 | 0.0580 | 0.0000 | 0.0580 |
| Heilongjiang | 0.0399 | −0.0029 | 0.0428 | 0.0193 | −0.0131 | 0.0324 | 0.0605 | 0.0073 | 0.0532 |
| Shanghai | 0.0558 | 0.0000 | 0.0558 | 0.1044 | 0.0000 | 0.1044 | 0.0071 | 0.0000 | 0.0071 |
| Jiangsu | 0.0425 | 0.0011 | 0.0413 | 0.0001 | −0.0127 | 0.0128 | 0.0848 | 0.0150 | 0.0699 |
| Zhejiang | 0.0482 | 0.0029 | 0.0453 | 0.0106 | −0.0043 | 0.0149 | 0.0857 | 0.0102 | 0.0756 |
| Anhui | 0.0263 | 0.0030 | 0.0232 | 0.0016 | 0.0100 | −0.0083 | 0.0509 | −0.0039 | 0.0548 |
| Fujian | 0.0559 | 0.0057 | 0.0502 | 0.0310 | 0.0061 | 0.0249 | 0.0808 | 0.0053 | 0.0755 |
| Jiangxi | 0.0179 | −0.0043 | 0.0222 | 0.0026 | −0.0049 | 0.0074 | 0.0333 | −0.0037 | 0.0370 |
| Shandong | 0.0357 | 0.0016 | 0.0341 | 0.0103 | −0.0007 | 0.0109 | 0.0612 | 0.0039 | 0.0573 |
| Henan | 0.0203 | −0.0035 | 0.0239 | 0.0061 | −0.0054 | 0.0116 | 0.0346 | −0.0016 | 0.0362 |
| Hubei | 0.0229 | −0.0065 | 0.0295 | 0.0117 | −0.0075 | 0.0192 | 0.0342 | −0.0056 | 0.0397 |
| Hunan | 0.0303 | 0.0041 | 0.0262 | 0.0268 | 0.0116 | 0.0152 | 0.0338 | −0.0033 | 0.0371 |
| Guangdong | 0.0551 | 0.0034 | 0.0517 | 0.0114 | −0.0039 | 0.0152 | 0.0988 | 0.0106 | 0.0882 |
| Guangxi | 0.0225 | −0.0017 | 0.0242 | 0.0071 | −0.0020 | 0.0092 | 0.0380 | −0.0013 | 0.0393 |
| Hainan | 0.0361 | 0.0031 | 0.0330 | 0.0172 | 0.0060 | 0.0112 | 0.0550 | 0.0001 | 0.0549 |
| Sichuan | 0.0299 | 0.0052 | 0.0246 | 0.0251 | 0.0095 | 0.0156 | 0.0347 | 0.0010 | 0.0336 |
| Guizhou | 0.0147 | −0.0005 | 0.0152 | 0.0145 | 0.0047 | 0.0098 | 0.0149 | −0.0058 | 0.0206 |
| Yunnan | 0.0461 | 0.0000 | 0.0461 | 0.0192 | 0.0000 | 0.0192 | 0.0731 | 0.0000 | 0.0731 |
| Shaanxi | 0.0221 | 0.0007 | 0.0214 | 0.0083 | 0.0019 | 0.0063 | 0.0360 | −0.0005 | 0.0365 |
| Gansu | 0.0156 | −0.0012 | 0.0168 | 0.0046 | −0.0015 | 0.0061 | 0.0265 | −0.0009 | 0.0275 |
| Qinghai | 0.0167 | −0.0081 | 0.0247 | 0.0065 | −0.0033 | 0.0098 | 0.0268 | −0.0128 | 0.0397 |
| Ningxia | 0.0213 | −0.0047 | 0.0260 | 0.0095 | 0.0013 | 0.0083 | 0.0331 | −0.0107 | 0.0438 |
| Xinjiang | 0.0339 | −0.0042 | 0.0381 | 0.0069 | −0.0020 | 0.0089 | 0.0609 | −0.0065 | 0.0674 |
| Years | Innovators | Years | Innovators |
|---|---|---|---|
| 2000–2001 | Beijing, Tianjin, Liaoning, Shanghai, Fujian, Guangdong, Yunnan | 2005–2006 | Tianjin, Liaoning, Shanghai, Guangdong, Yunnan |
| 2001–2002 | Beijing, Tianjin, Liaoning, Guangdong, Yunnan | 2006–2007 | Beijing, Tianjin, Liaoning, Shanghai, Guangdong, Yunnan |
| 2002–2003 | Beijing, Tianjin, Liaoning, Guangdong, Yunnan | 2007–2008 | Tianjin, Liaoning, Shanghai, Yunnan |
| 2003–2004 | Beijing, Tianjin, Liaoning, Shanghai, Zhejiang, Guangdong, Yunnan | 2008–2009 | Tianjin, Liaoning, Shanghai, Yunnan |
| 2004–2005 | Beijing, Tianjin, Liaoning, Shanghai, Guangdong, Yunnan |
© 2020 by the authors. Licensee MDPI, Basel, Switzerland. This article is an open access article distributed under the terms and conditions of the Creative Commons Attribution (CC BY) license (http://creativecommons.org/licenses/by/4.0/).
Share and Cite
Zhang, S.; Chang, T.-P.; Liao, L.-C. A Dual Challenge in China’s Sustainable Total Factor Productivity Growth. Sustainability 2020, 12, 5342. https://doi.org/10.3390/su12135342
Zhang S, Chang T-P, Liao L-C. A Dual Challenge in China’s Sustainable Total Factor Productivity Growth. Sustainability. 2020; 12(13):5342. https://doi.org/10.3390/su12135342
Chicago/Turabian StyleZhang, Shaohua, Tzu-Pu Chang, and Li-Chuan Liao. 2020. "A Dual Challenge in China’s Sustainable Total Factor Productivity Growth" Sustainability 12, no. 13: 5342. https://doi.org/10.3390/su12135342
APA StyleZhang, S., Chang, T.-P., & Liao, L.-C. (2020). A Dual Challenge in China’s Sustainable Total Factor Productivity Growth. Sustainability, 12(13), 5342. https://doi.org/10.3390/su12135342


