Article

Land–Sea Interaction: Integrating Climate Adaptation Planning and Maritime Spatial Planning in the North Adriatic Basin

by
Denis Maragno
1,2,
Carlo Federico dall’Omo
1,2,*,
Gianfranco Pozzer
1,
Niccolò Bassan
1 and
Francesco Musco
1,2
1
Department of Architecture and Arts, University Iuav of Venice, 30315 Venezia, Italy
2
Department EPiC (Earth and Polis Research Centre), Fondazione Eni Enrico Mattei, 30315 Venezia, Italy
*
Author to whom correspondence should be addressed.
Sustainability 2020, 12(13), 5319; https://doi.org/10.3390/su12135319
Submission received: 15 May 2020 / Revised: 27 June 2020 / Accepted: 29 June 2020 / Published: 1 July 2020
(This article belongs to the Special Issue Sustainable Urban Planning Techniques)

Abstract

:
Land–sea interaction dynamics are physiologically regulated by an exchange of matter (and energy) between the anthropic system and the natural environment. Therefore, the appropriate management of land–sea interaction (LSI)contexts should base on those planning approaches which can holistically support coastal development, such as Maritime Spatial Planning (MSP) and Climate Adaptation Planning (CAP). One of the main limiting factors for this integration is the fragmentation of existing databases and information sources, which compose the territorial knowledge framework. Investigations have sought to address the representation and assessment of “wicked” and interconnected coastal problems. The present research focuses on the production of the necessary information to fill sectorial knowledge gaps and to merge the available data into a single framework. The research methodology is based on remote sensing assessment techniques and is designed to be replicated in other coastal areas to integrate CAP and MSP. The output maps are a result of the empirical application of the integration of the assessment techniques and are meant to support local decision-making processes. The result aims at illustrating and highlighting the relationships between climate change impact vulnerabilities their spatial relation to marine resources and maritime activities. This can support effective actions aimed at environmental and urban protection, the organization of the uses of the sea and adaptation to climate impacts. The application of the assessment techniques is developed on a case study in the north Adriatic Basin. The Gulf of Trieste constitutes a representative case study for the Mediterranean Basin due to its transboundary nature. The relationship and the ongoing projects between Slovenia and Italy make the case study an interesting context in which to test and train the proposed integrated planning approach. Therefore, the study investigates local vulnerability to climate impacts, i.e., Urban Heat Island (UHI) and urban runoff, and the existing relationship between the urban fabrics and the marine environment.

1. Introduction

Coastal management is a complex matter assessed through territorial planning disciplines [1]. This paper presents an innovative and integrated approach developed to address two of the primary issues which affect Mediterranean coasts: climate change impacts and anthropic pressures on the marine environment [2,3,4]. This study aims to demonstrate that the overlapping of sectoral assessment techniques can lead to integrated knowledge, which can effectively support different planning approaches. The research methodology design combines Maritime Spatial Planning (MSP) and Climate Adaptation Planning (CAP) knowledge framework development into a single planning approach. The efficacy of this theory is empirically deployed on the Gulf of Trieste case study, located in the northern Adriatic Basin.

1.1. Sea and Maritime Overview

Marine environments and coastal settlements are fundamental components of the European geopolitical context. The EU has 68,000 km of coastline, spanning more than 20 Member States and half of the total continental population [5]. With more than 1000 ports and shipyards, the maritime sector is a strategic economic asset. In this context, economic growth and related social wellbeing have environmental costs, while being dependent on the health of the coastal ecosystem [6]. This study focuses on land–sea interaction (LSI) areas and the required consciousness to sustainably act on these contexts, anticipating the interconnected consequences that a non-holistic approach might generate [7,8,9]. While the LSI approach is capable to recognize the interdependency between land and sea systems, it is not implemented into the established planning models [10,11,12]. To support a retrofit of actual sectoral governance systems and to sustainably perform territorial management strategies, this research combines separate approaches into an integrated framework [13]. At present, the current paucity of integrated strategies between land and sea management and holistic management practices are hindered by the following barriers:
  • Lack of comparable local information systems;
  • Extensive and inaccurate forecasting systems;
  • Lack of integrated governance between the land and sea systems;
  • Multilevel governance organization;
  • Inertia of public administrations in the adoption of medium- to long-term knowledge systems;
  • Absence of guiding regulations.
Maritime Spatial Planning (MSP) is a relatively new planning approach which aims at analyzing and organizing human activities in the sea space to achieve ecological, economic, and social objectives. The growth of the pressures induced by anthropic activities on the global marine environment urgently requires more sustainable coastal and maritime management [3]. The adoption of the MSP approach enriched, in the marine spatial dimension, coastal territorial planning, with the possibility of combining different necessities and solutions. At the EU planning level, the intensification of maritime activities and the exploitation of marine and coastal resources within the “blue economy” framework [14] became key elements in understanding the geopolitical panorama. In this context, the Integrated Maritime Policy of the European Union (IMP) [1,15] was adopted to provide a more coherent approach to maritime issues, calling for an increased coordination between different policy areas under a comprehensive policy “umbrella”. The backbone of the environmental aspect of the IMP is the Marine Strategy Framework Directive (MSFD), regulated by European Directive 2008/56/EC [16], which considers the marine environment from an integrated perspective. Specifically, the directive requires each coastal EU Member State to develop a strategy to prevent and restore damaged ecosystems to Good Environmental Status (GES) [2]. The MSP pillar of the EU’s IMP is regulated by European Directive 2014/89/EU [17], and makes MSP mandatory in planning policies of all coastal Member States [18]. The MSP Directive requires the EU Member States to develop a national maritime spatial plan by 31 March 2021 [19,20], with a minimum review period of 10 years, and establishes an MSP framework, aimed at i) promoting the sustainable growth of maritime economies; ii) the sustainable development of marine areas; iii) the sustainable use of marine resources. Moreover, the Directive states that the minimum requirements for maritime spatial plans must include land–sea interactions, an ecosystem-based approach, coherence between MSP and other processes such as integrated coastal management, the involvement of stakeholders, the use of the best available data, transboundary cooperation between Member States, and cooperation with third countries [21,22]. Therefore, initiatives aiming at integrating land-based and maritime spatial planning are clearly promoted by the Directive.
In Italy, the MSP Directive was implemented via the Italian Legislative Decree 17 October 2016, n. 201 [23], together with the recommendations adopted by the Decree of the President of the Council of Ministers of 1 December 2017 [24]. The Ministry of Transport and Infrastructure was appointed to implement MSP in Italy, and an Inter-Ministerial Coordination Committee (ICC) was established. The ICC identified the maritime areas where specific maritime plans should be implemented; these correspond to three sub-regions referenced within the Marine Strategy Framework Directive (Article 4 of Directive 2008/56/EU): the western Mediterranean Sea, the Adriatic Sea, the Ionian Sea and the central Mediterranean Sea. The need for climate change adaptation in coastal areas is particularly evident and are predicted to become progressively more significant over time due to the long-term forecasts of climate variables and sea level changes [25].
Different research argues that reactive and spatially isolated efforts are less effective than proactive and integrated coastal management. For example, European and international policy strategies [26,27] recognize the central role of Integrated Coastal Zone Management (ICZM), which is considered the most appropriate process to deal with climate change impacts, such as sea-level rises. Integration refers to measures which combine adaptation with various planning sectors and multi-scalar policies.

1.2. Coastal Territories and Climate Change Impacts

In general, climate impacts are linked to the physical shape of coastal regions. Local characteristics can amplify the effect of single impacts or can trigger chained ones. In Europe, there is approximately 140,000 km2 of land located 1 meter below mean sea level [28]. Therefore, it is crucial to address the climate-related coastal vulnerabilities to avoid damage to the economy, society, and the environment. These regions are often characterized by strategic socio-economic assets (i.e., those linked to tourism, fishing, harbours, and shipyards). This makes coasts particularly sensitive to climate change impacts, which primarily expose infrastructure and the local populations. Human activities are also responsible for additional pressures on coastal ecosystems. These activities often generate more immediate impacts than those expected from climate change and aggravate existing vulnerabilities. Therefore, the definition of Climate Adaptation Planning (CAP) must take specific local socio-economic contexts into consideration. International scientific communities [26,27,29,30,31] state that coastal area adaptation should be iterative and dynamic, in recognition of the continuously evolving dynamics present in coastal territorial systems. Furthermore, adaptation measures should consider the local ecology, economy, society, politics and technology [26,32,33,34,35].
The Urban Heat Island (UHI) effect and urban runoff are among the more relevant impacts because of their capability to represent the more common and widespread effects of climate change on cities [36]. UHI is a micro-climatic alteration which determines an additional risk for the health of urban populations. It is relevant to consider that even a modest climatic event can significantly impact many people and areas with a high concentration of strategic infrastructure. Besides the high exposure of these assets, urban infrastructural networks tend to amplify these phenomena [37]. Therefore, the overlap of climatic events and anthropic stresses can impact both the environment and human activities.

1.3. Framing the Problem

What emerges from this overview is an articulated set of wicked problems and interconnected dangers which afflict the same territorial context. From this perspective, the current system is ineffectively defended due to the isolated nature of planning models and the (over) simplification of complex problems. One possible approach to address these challenges is the integration between Maritime Spatial Planning (MSP) and Climate Adaptation Planning (CAP) [38,39,40] (Figure 1).
Territorial planning and, in general, the territorial governance culture, tend to limit and separate actions, strategies, and knowledge frameworks. Figure 1 describes the current separated nature of coastal planning workflows. The Land and Urban Approach on the left refers to the spatial mapping of climate-triggered relationships and impacts in the built and natural environment. The Sea and Maritime Approach on the right describes the general method for maritime environmental assessment and planning. It is based on the evaluation of sea uses and the identification of marine ecosystems. Although the two macro-environments have distinct and non-complementary governance strategies, environmental issues related to climate change are critical to both planning approaches.
The authors recognize, in this methodological separation (Figure 2), both a problem and an opportunity for action. On the one hand, it is possible to recognize a lack of dialogue between planning models and on the other hand, it is, however, possible to recognize that the objective of these processes is the management of the same territory. Even if the oversimplification of “wicked” problems is ineffective due to criticalities which are intrinsically connected, it is possible to develop spatial knowledge, which allows for aware territorial management. The fact that this knowledge already exists, even if stored in separate databases, leads us to suppose that the core of the problem is the will and interest to implement an integration by decision makers. From this perspective, the threat of climate change, recent disasters and ongoing international projects could generate the necessary interest and give rightful priority to a holistic coastal planning approach [41].

1.4. Research Questions

This study aims at demonstrating that the integration of sectoral planning approaches would be a viable first step to generate proactive and responsive territorial governance models. Furthermore, it could lead to an effective and sustainable management of complex phenomena, such as the interrelated dynamics of climate change and human pressures on ecosystems. This research is structured around the following research questions (RQ):
  • RQ1. How can climate change adaptation trigger and support a successful convergence between “Land and Urban” and “Sea and Maritime” planning approaches in an LSI context?
  • RQ2. How can terrestrial vulnerability assessments, marine and maritime knowledge frameworks converge to define a multisystemic vision of the territorial priorities?
  • RQ 3. Does the result between the integration between MSP and CAP in an LSI context favour and generate trans-sectoral strategic action?
  • RQ 4. Can the ongoing urban and regional planning processes be effectively enriched by the integration of the cognitive frameworks of CAP and MSP?

2. Research Methodology

The research methodology is organized into four sections aimed at answering the research questions and to support the development of the initial hypothesis. The Research Methodology Chapter is organized into four paragraphs: Research Design, Planning Approach, Assessment Techniques and Empirical Research.

2.1. Research Design

The initial phase of the research consists of developing the design of the investigation process. Figure 3 presents the workflow through which the research is structured. Research questions RQ1, RQ2, RQ3 and RQ4 are integrated into the three operational steps of the research methodology and support the chosen operational decisions.
Step 1 defines the planning approach adopted, and the integration between MSP and CAP in an LSI context, to support its implementation. Step 2 presents the investigation techniques for the development of land and sea knowledge frameworks, to produce an integrated and replicable investigation methodology. Step 3 applies the investigation techniques for climate change impacts and marine pressures on the Gulf of Trieste case study. The three-step approach proposes an integration process at different levels, which can be replicated in other coastal contexts.

2.2. Planning Approach

The authors propose a planning approach which integrates Climate Adaptation Planning and Maritime Spatial Planning. This combination aims at giving support to local authorities in managing wicked and overlapping issues. The approach provides a single, shared management framework for land and sea, designed to address climate change adaptation measures through monitoring and analysis of both local and regional vulnerabilities and impacts.
The integration of these two systems requires shared geospatial information, relevant to multi-temporal, multi-scalar, and multi-disciplinary assessments. Land-based information is processed by computational and data analysis technologies (vector and raster) from both local geodatabases and raw satellite data. The methodology is based on theoretical and procedural frameworks, tested and validated in scientific literature [42,43,44,45,46]. The approach considers the vegetational, thermal and urban parameters. These parameters can be used to describe urban spatial structures and their vulnerability level. Sea-based information considers the variable impacts of natural events (i.e., extreme storm surges), and anthropogenic environmental disturbances. The maritime approach is based on ecological, environmental, and socio-cultural information, and maps economic and territorial assets (see dataset of the Adriplan.eu portal) [47]. This approach does include some hybrid computational methods, similar to those used by the Land and Urban Approach, for calculations such as the estimate of the Sea Surface Temperature (SST).
The knowledge framework developed through this planning approach aims at allowing a technical comparison between land and sea, which can help spatial planning to recognize existing interactions. This integrated representation of information can trigger sustainable governance actions and support decision makers in undertaking multilevel territorial strategies. A cooperative territorial planning process is a conceptual approach which combines theoretical investigation with operational management. This is achieved through merging two parallel datasets:
(1)
Heatwaves and flood impact analysis (land-based).
(2)
Analysis of SST and multilevel evaluation of environmental components, uses, conflicts and synergies in the maritime space.

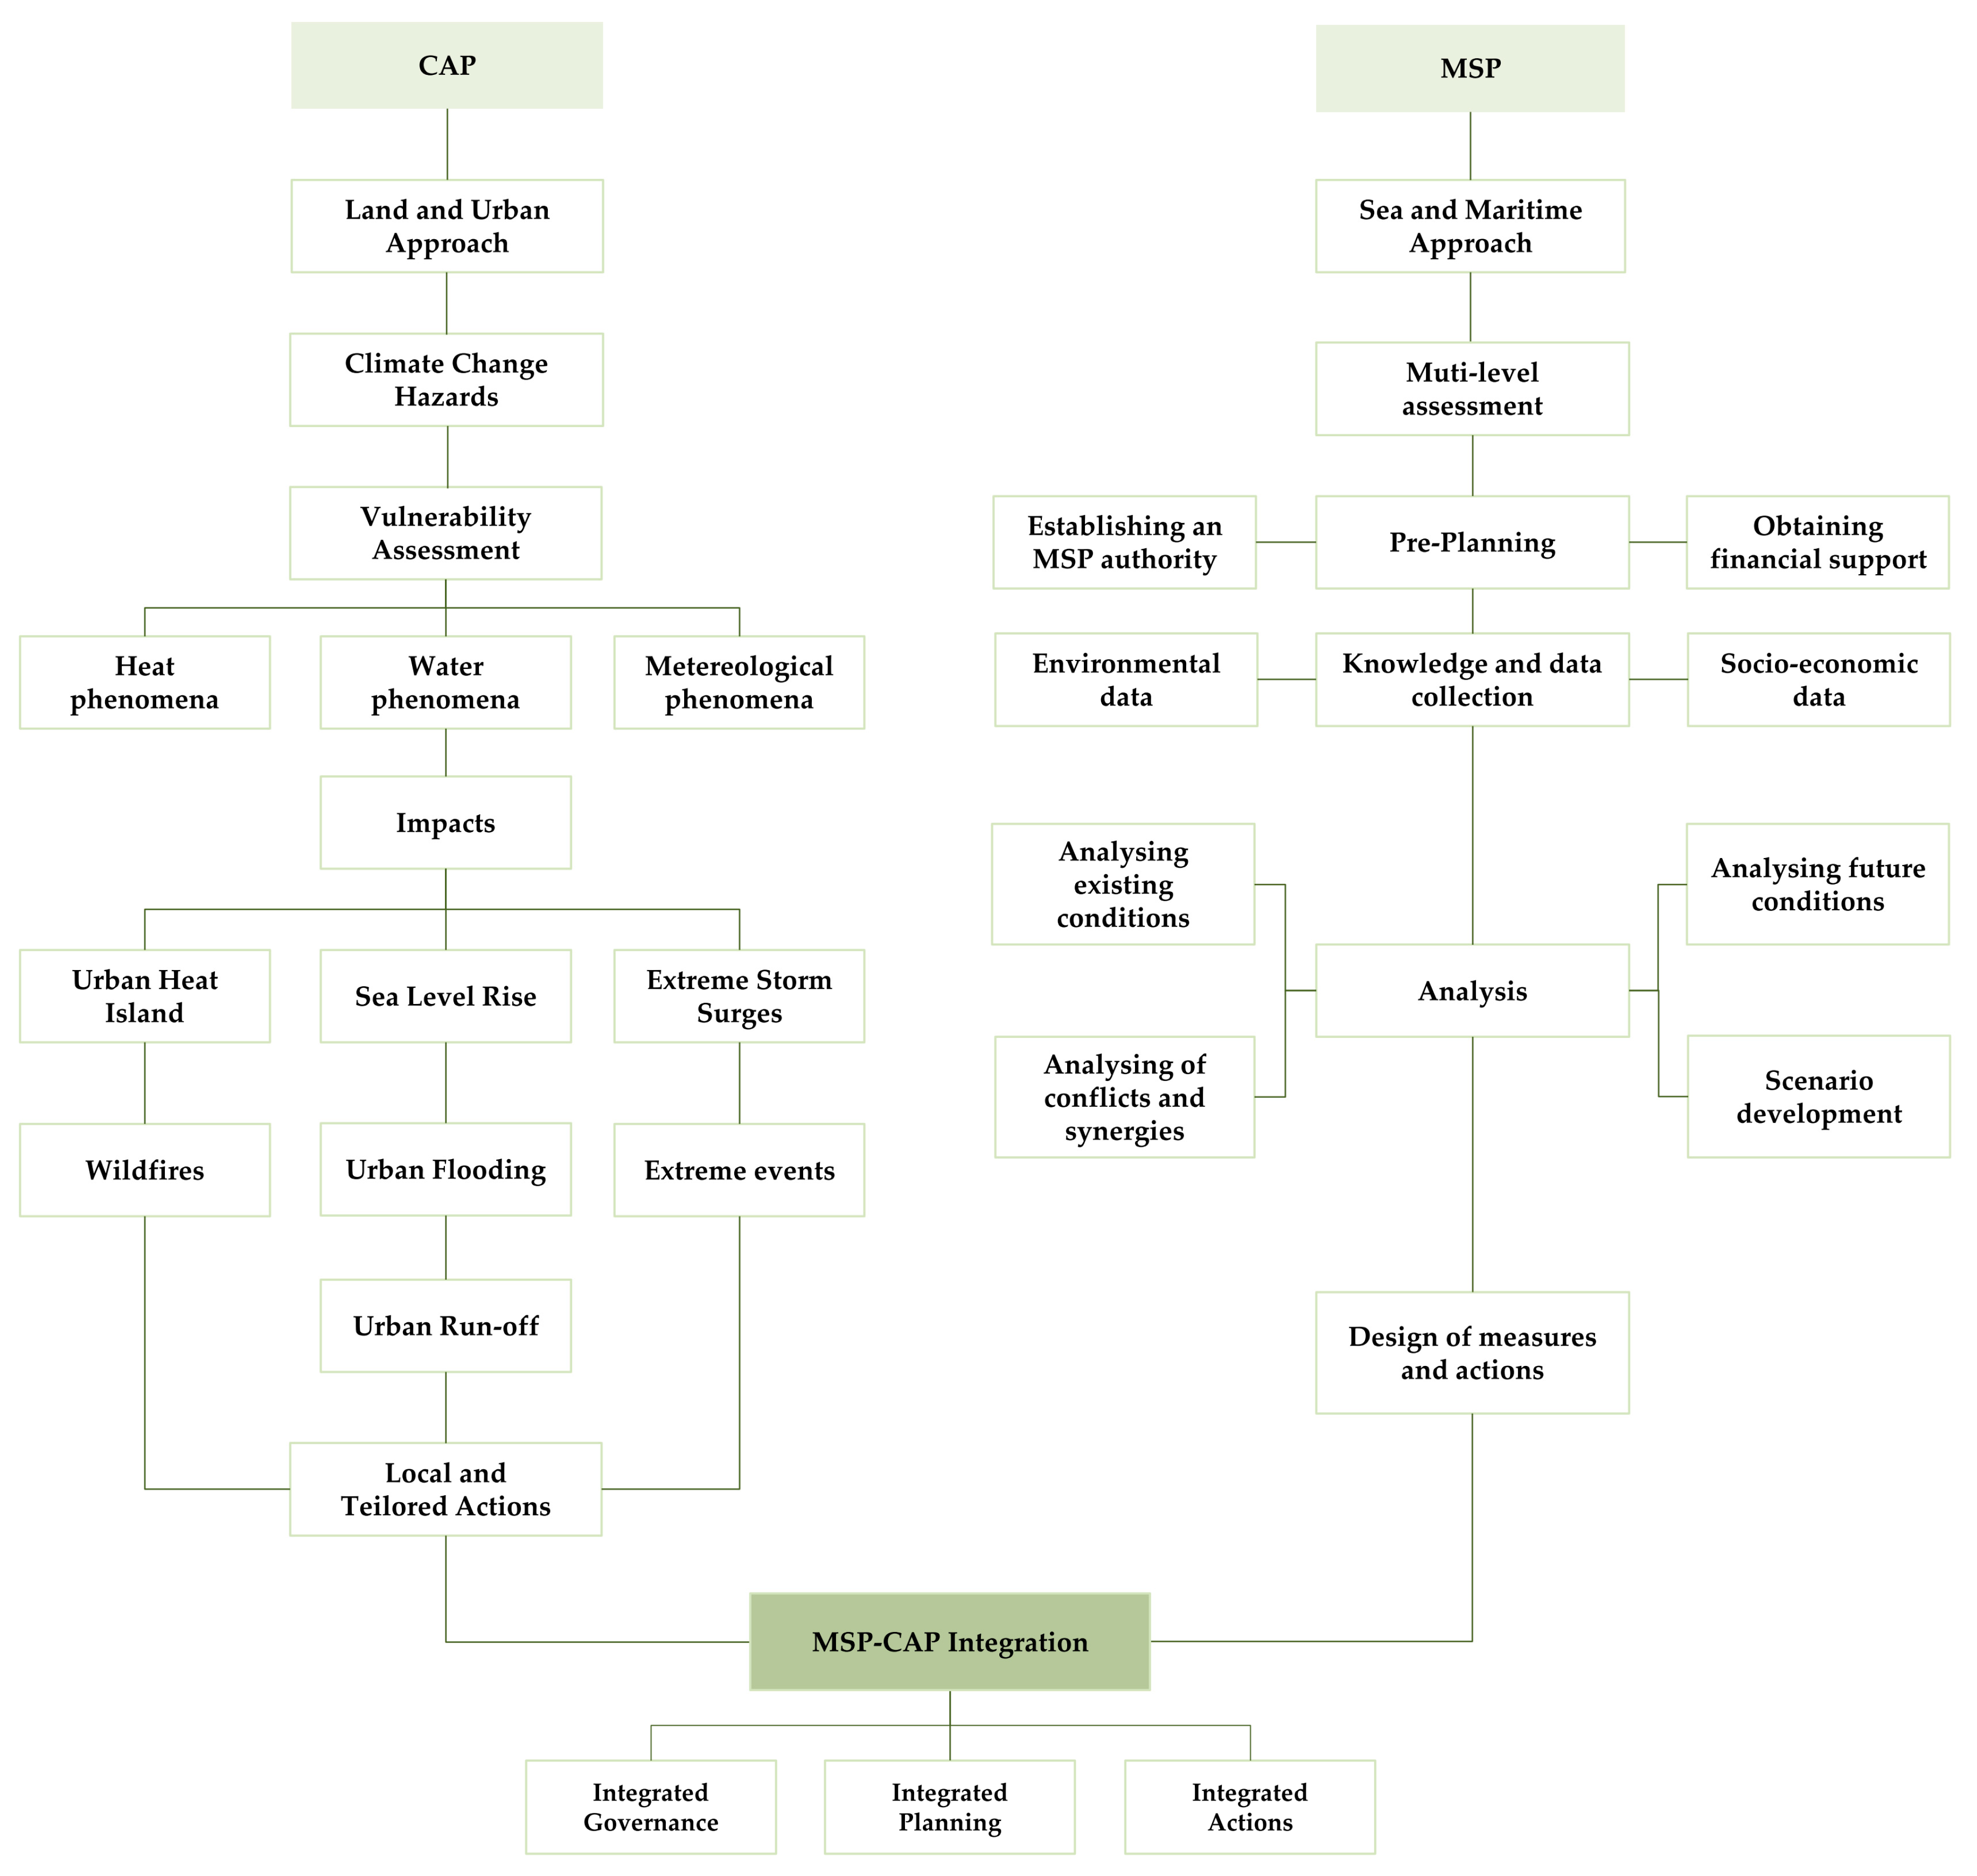
2.2.1. The Development of the Integrated Approach

The Land and Urban Approach uses two parallel assessment processes: the first is the definition of a set of parameters derived from the urban shape; the second uses satellite images to identify the principal groundcovers (water, artificial soil, surface temperature and vegetation). The set of indicators is divided into:
  • Normalized Difference Vegetation Index (NDVI).
  • Normalized Difference Moisture Index (NDMI).
  • Land Surface Temperature (LST).
  • Surface runoff (φ).
The Sea and Maritime Approach instead tests the level of integration of maritime planning systems with opportunities, practices and territorial conflicts triggered by the use and the unsustainable exploitation of natural resources. It uses two distinct but integrable methods: the estimation of the SST and the assessment of climatic and anthropic impacts linked to the coastal area (e.g., urban runoff).
In particular, the assessment that refers to the maritime environment is composed of the following elements:
  • Environmental data;
  • Socio-economic information.
The integration between the Land and Urban Approach, and the Sea and Maritime Approach creates a “multi-objective” spatial information system, which is able to represent landscape/seascape patterns of change, induced by the interaction between anthropic and ecosystem processes (e.g., protection of the coasts or protection of the marine ecosystem). This integration generates new knowledge/action systems, with significant implications in terms of our ability to analyze climate impacts. The process is described in Figure 4.
This supports two investigation phases:
(1)
The construction of a theoretical–operational frame through which to interpret and assess the land–sea context.
(2)
The identification of criteria and analysis models relevant to the integrated management between coastal and terrestrial planning.

2.2.2. Vulnerability Approach Definition

The proposed planning approach bases on the definition of vulnerability introduced by the Interoperative Panel on Climate Change (IPCC) in 2014 [27]. It uses two analytical variables, namely:
  • Sensitivity: “in the IPCC approach, determines the degree to which a system is adversely affected by a given exposure”.
  • Adaptive capacity: the ability of a natural or a built system to adapt to climate change.
These variables allow for a replicable comparison at both urban and regional scales, based on the following equation:
V = S AC = ( ( S 1 + S 2 + + S n ) / n )     ( ( AC 1 + AC 2 + + AC 3 ) / n )
where
  • V = vulnerability;
  • S = sensitivity;
  • AC = adaptive capacity;
  • n = number of used indicators.
Concerning the Sea and Maritime context, there emerged a strong interconnection among land-based vulnerabilities and the territorial characteristics that trigger climatic impacts. An example is the interrelated actions and distribution of temperatures between coastal infrastructure and the sea surface, and the related phenomena of heating associated with rivers and infrastructure behavior.

2.2.3. Data Sources

The study uses a set of territorial data sources (Table 1): a combination of geodatabases produced by public bodies and remote-sensed surveys produced by the authors. The database structure is designed according to the interpretative framework.

2.2.4. Integrated Geodatabase Preparation

The preparation of the geodatabase can be generally divided into six distinct operations:
(1)
The construction of the information system structure to support climate adaptation actions.
(2)
The processing of satellite images to provide NDVI, NDMI, LST and SST spatial distribution values.
(3)
The modelling of surface water outflows (φ).
(4)
The selection of variables to calculate and spatially identify the effects of climate change on natural and built systems.
(5)
The synthesis of comparable data values.
(6)
The normalization of the sensitivity, adaptive capacity, and vulnerability indicators.
(7)
Overlapping Sea and Maritime spatial knowledge frameworks.
The geodatabase considers, in its preliminary setting, the climatic vulnerabilities and ecosystem pressures. Vulnerability considers the relationship between land sensitivity and maritime adaptive capacity. In the Land and Urban Approach, a vulnerability assessment of the urbanized (or natural) environment requires adequate knowledge of territorial landcover and urban shapes. Moreover, it requires an interpretation of the environmental complexity within its ecosystem services.

2.3. Assessment Techniques

As Figure 4 presents, the assessment techniques necessary to effectively describe coastal behaviors and characteristics, both from a terrestrial and a marine perspective, require a combination of information and geospatial processing. Therefore, this research presents the generic operative processes that can support knowledge framework development to assess the main issues related to LSI contexts. The “Land and Urban” approach is oriented to assess UHI and urban runoff phenomena, due to their relevance both for the extension of their impacts and the interest in these issues with ongoing projects. Specifically, the IPCC and the EU community recognize the importance of these climate change effects and the necessity to support local-to-regional Climate Adaptation Planning processes. Moreover, their nature is deeply linked to coastal urban areas’ morphological characteristics and their effects consequently impact marine ecosystems and maritime activities. To prove this relationship, the “Sea and Maritime” approach spatializes the available information about sea uses and correlates the overheating of land through a Sea Surface Temperature (SST) assessment. These techniques are presented in their abstracted form and empirically implemented in the Gulf of Trieste case study to demonstrate their tailored replicability.

2.3.1. Land and Urban Approach

The Land and Urban Approach copes with the following issues:
(1)
Urban Heat Island phenomenon effects.
(2)
Urban Flooding effects (surface runoff).
To assess the first phenomenon, the technique is based on satellite data analysis. The assessment of the first phenomenon bases on satellite data analysis. The second issue assessment requires a morpho-dynamic model of runoff coefficients developed in a GIS (Geographic Information System) environment through a Digital Terrain Model elaboration (DTM 25 m). Although the objectives of these two techniques are different, both contribute to defining local vulnerabilities. Since each system uses different data and analytical criteria, the use of the additive function (1) is weighted based on the necessity of the proposed planning approach (Figure 4). Furthermore, Table 2 illustrates, in detail, the different parameters used to spatialize, assess sensitivity and adaptive capacity. The vulnerability assessment uses GIS to spatially represent the output elaborations. The process illustrates the relation between sensitivity and adaptive capacity, and these ratios correspond to the characteristics of the single climatic impact.

Urban Heat Island Assessment

The UHI assessment process uses remote sensing techniques, which calculate the NDVI and LST values based on satellite multispectral images. The NDVI parameter quantifies the vegetation groundcover, while the LST represents surface temperature and allows us to understand the thermal relation between surfaces (i.e., artificial and natural). NDVI monitors the living state of plant organisms according to their chlorophyll activity. The theoretical threshold values are between -1 and +1: normally the presence of vegetation is indicated by values greater than 0.2, while values close to zero or lower are, in general, anthropic elements. NDVI is calculated according to Equation (2), with the reflectance measured by near-infrared (RNIR) and red (RRED).
NDVI = R NIR R RED R NIR + R RED
The LST estimation is based on the NDVI index and the thermal IR spectral region, using band 10 (10.60 ÷ 11.19 μm). The LST definition requires us to convert the radiance to the numerical output of band 10 using expression (3):
L λ = M L Q cal + A L
where
  • Lλ = Spectral radiance on the top of atmosphere (TOA): (Watts/ (m2 × sr × μm));
  • ML = band-specific multiplicative rescaling factor from the metadata (0.0003342);
  • AL = band-specific additive rescaling factor from the metadata (0.1);
  • Qcal = quantized and calibrated standard product pixel values (DN).
After the transformation of DN into radiance, the radiance is converted into Brightness Temperature (BT10). BT is a parameter which expresses the rate of energy radiated, in terms of temperature, by a hypothetical black body that emits the same amount of radiation observed. This is calculated through the thermal constants of the MTL (Landsat Metadata File) and a Kelvin temperature value is obtained. The equation for calculating the BT10 is as follows:
BT = K 2 ln   ( K 1 L λ + 1 )  
where
  • BT = top of atmosphere brightness temperature (K);
  • Lλ = TOA spectral radiance (Watts/(m2 × srad × μm));
  • K1 = band-specific thermal conversion constant from the metadata (K1_CONSTANT_BAND_774.8853);
  • K2 = band-specific thermal conversion constant from the metadata (K2_CONSTANT_BAND_1321.0789).
The LSI calculation also requires a surface emissivity (LSE) value. To obtain this data, a proportional coefficient of vegetation presence (PV) is applied, as defined by the NDVI variation.
PV = ( NDVI NDVI min NDVI max NDVI min ) 2
LSE = 0 . 004 × PV + 0 . 986
Once all the variables are known, the LST raster can be calculated, using the central value from the thermal spectral band (w) and the parameter (p), defined according to the Planck constant (h), the Boltzmann constant (σ) and the speed of light (c).
p = h × c σ
LST = BT 1 + w × ( BT p ) × lnLSE
where,
  • BT = brightness temperature;
  • W = 10.895;
  • p = (h × c / σ) = 1.438 × 10 − 2 mK;
  • LSE = spectral emissivity.
For common use, LST values can be converted to degrees Celsius.
° C = ° K 273 . 15
The result is a raster map, which represents the terrestrial thermal behavior of the assessed territory.
The calculation uses the NDMI parameter to assess the impact of the UHI phenomenon and the relation to the urban fabrics’ shapes. The NDMI estimation indicates the soil moisture as a ratio between the difference and the sum of the radiation reflected in the near-infrared and SWIR, i.e., as (NIR-SWIR) / (NIR+SWIR). NDMI values range from +1 to −1: (+1) indicates a high humidity condition, while (-1) low humidity (or dryness).
Equation (10) illustrates the relationship between the thermal behavior of the land’s surface and the characteristics of land use:
V = S AC = ( LST ) S ( ( NDVI + NDMI ) / 2 ) ) AC
A core element of this technique is the adoption of a hexagonal grind used to homogenize the collected data. This element collects the results of satellite data elaboration and geographical information. The hexagons which compose the grid have an area of 500 square meters. The following variables/indicators are associated with each statistical unit (hexagonal cell) (Table 3).
The indicators range from a scale of values between zero and one. This distribution allows us to represent and compare values with different characteristics. The overall vulnerability is measured by a synthetic index: the difference between the sensitivity and adaptive capacity parameter (Table 4).
Vulnerability values range between −1 and one. Negative values correspond to good adaptive performances, while positive values correspond to critical conditions.
This geodatabase represents graphical data and interrelated indices at the same time. It links different phenomena within each hexagonal cell, defining a territorial spatial unit of vulnerability. This vector matrix provides the calculation base to test and represent the capabilities of the proposed planning approach, which could serve the following uses:
  • Spatial statistics development and neighbourhood-scale analysis techniques implementation.
  • Design of complex computational calculations.
  • Assessment of precise spatial relationships.
  • Clear and concise graphical data representation.

Surface Runoff Assessment

The estimation of territorial hydraulic performance is often developed with specific simulation models for “inflow–outflow” dynamics [48,49,50,51,52,53]. The assessment technique deployed in this paper uses an algorithm to spatially estimate the surface runoff derived by land uses [44]. The algorithm, executed in the GIS environment, allows for the simultaneous representation of surface runoff dynamics [45]. It uses specific land use classifications (i.e., agricultural, urban residential and industrial, wooded, wet and semi-natural). The direction and accumulation functions are calculated at a hydrogeological basin scale. The data required for hydrological modelling are:
  • DTM with 25-m pitch with Geotif extension;
  • Land uses (CLC 2018, Copernicus Program);
  • Administrative boundaries in shapefiles of water management consortia.
The equation for estimating the surface runoff is:
φ i = { [ P · F U + P ° · ( F F U ) ] F } i
where
  • P = runoff coefficient associated with impermeable areas,
  • P = runoff coefficient associated with permeable areas,
  • F = flow accumulation calculated on DTM,
  • FU = accumulation of flow related to land cover,
  • U = land use in i.
The function allows us to associate the flow accumulation F with P and provides the hydraulic impacts φİ. The result is expressed as the percentage (%) of rain that turns into the surface runoff, and its values range from 0.2 to 0.9.
The result is a 25-meter resolution raster map, which considers the water accumulation within the hydrogeological basin. The processing returns a graphic index capable of assessing the different hydraulic performances of an area, in terms of ecosystem services. In this case, vulnerability is measured as the surface water runoff coefficient. The sensitivity and adaptive capacity indicators are embedded in the prosses as shown below (Table 5):
The runoff vulnerability assessment is spatially calculated, as is the UHI one, and this set of information can be integrated into the same geodatabase.

2.3.2. Sea and Maritime Approach: Conflicts and Synergies

The Sea and Maritime Approach is based on two assessment techniques:
(1)
The SST estimation.
(2)
The Maritime uses/activities and environmental components maps.
The combination of these analytical tools provides an understanding of the relationships between uses and natural components, and how these correspond with SST variability. SST can be based on multispectral satellite images; otherwise, maritime and marine mapping can be based on existing geodatabases or specific and tailored analyses about environmental components and sea uses. Moreover, the output of this approach can also be integrated into the hexagonal grind used for the land-based assessments. The interpretation of these layers’ integration within the same vector-unit allows us to evaluate the overall sea-based context and its spatial characteristics, connecting the Sea and Maritime Approach with the Land and Urban Approach.

Sea Surface Temperature Estimation

SST assessment is based on thermal infrared images from different satellite sources, including the Advanced Very High Resolution Radiometer (AVHRR) aboard National Oceanic and Atmospheric Administration (NOAA), Moderate Resolution Imaging Spectroradiometer (MODIS) aboard the Terra (originally known as EOS AM-1) and Thermal Infrared Sensor (TIRS) onboard the Landsat 8 satellite (NASA-USGS). The estimation requires two data control phases: (a) calibration of the SST calculation coefficients and (b) validation of the calculation algorithm. The conventional approach to validate the SST calculation algorithms is the comparison with onsite temperature measurements. This method introduces four specific processing algorithms: (1) Planck [54]; (2) Mono-Window Algorithm (MWA) [54]; (3) Syariz [55]; (4) Split Window Algorithm (SWA) [56]. These methodologies have been largely tested in China and Southeast Asia seas, and in areas with vast databases collected using simple linear regression statistics. The tests describe the degree of correlation between the infrared bands, Enhanced Thematic Mapper (ETM) and Thermal Infra-Red (TIR) radiance and onsite collected data.
The scientific literature on SST recognizes the SWA algorithm as the most accurate to support water body thermal analysis [57,58,59,60].
The SWA model uses the BT10 and BT11 spectral signatures from a satellite multispectral image; frequencies with an interval between 10.60 μm and 12.51 μm. BT10 and BT11 are subject to various atmospheric absorption contributions. Therefore, SST is calculated through Equation (12):
TS = BT 10 + ( 2 . 946 ( BT 10 BT 11 ) ) 0 . 038
where Ts = Sea Surface Temperature (°C), while 2.946 and 0.038 = values extracted with linear regression (regression conducted on a sample of values containing the temperature data collected onsite and the thermal values calibrated according to the atmospheric conditions that influence the radiation and thermal transmittance of the channel).
The result is a raster map of the sea surface temperature spatial distribution, with a 30-meter resolution.

Uses and Environmental Components

The approach considers different anthropic and natural components of the maritime context through the spatial relationships between maritime uses and environmental elements. This typology of assessment is based on geodatabases such as the one indicated in Table 1, which are the result of sectoral studies developed to support both the environmental protection and sustainable resource exploitation. This phase of the integrated planning approach focuses on providing a coherent and logical integration between aspects of the Land and Urban Approach and the objectives of MSP. Through the interpretation of the layer overlapping output, it is possible to identify those characteristic “land impacts” that can trigger the extension of impact effects on the marine environment and maritime activities.

2.4. Empirical Research

Empirical research is the third step of the research methodology presented in Figure 4. This chapter presents the application of the assessment techniques developed to illustrate the general knowledge framework elaboration for the MSP and the CAP approaches (Figure 4). Presenting the assessment results, the authors aim to present the possible potentiality of the proposed planning approach and to highlight the opportunities that this knowledge integration can generate in managing an LSI context. As the empirical elaboration has the objective to answer different RQs, the case study choice considers the opportunity to test the possible implementation of the planning approach within ongoing projects aimed at MSP and CAP. Two of the more relevant ongoing projects with a strong connection to LSI planning in the Mediterranean region are the Interreg Italy–Slovenia project “Supporting Energy and Climate Adaptation Policies” (SECAP) and the European Maritime and Fisheries Fund (EMFF) “Towards the operational implementation of MSP in our common Mediterranean Sea” (MSP-MED). The Gulf of Trieste is a study area in both these projects, so the authors’ choice is connected to the opportunity of implementing the proposed integrated planning approach within these ongoing activities. Moreover, SECAP is oriented to develop a transboundary adaptation strategy and represent a strong and innovative example of CAP in coastal areas. Alternatively, MSP-MED is a project that has the challenging objective of developing shared Mediterranean guidelines for Maritime Spatial Planning based on the concept of Integrated Coastal Zone Management (ICZM). From this perspective, the Gulf of Trieste case study can be considered one of the best options to immediately implement an integrated knowledge framework and can be considered as the appropriate context in which to undertake an integrated planning approach using MSP and CAP.

2.4.1. Case Study

The study area is located in the northeast of Italy, at the border with Slovenia and Croatia, and covers the entire Gulf of Trieste (Figure 5). The selected area is representative of Adriatic and Mediterranean general LSI contexts. The research uses mapping techniques to understand regional criticalities and opportunities and present different administrative regions and maritime spaces [61]. The urban areas have a high built-up index, with a high proportion of residential fabric [62,63].
The Adriatic Sea and the Gulf of Trieste support three primary economic sectors: maritime trade, tourism, and fishing. The port of Trieste is one of the most developed shipyards and commercial harbours in the Mediterranean, with national and international trade flows. The gulf coastline is attractive for tourism due to the quality of the water (for swimming), local gastronomy, and the natural, aesthetic value of the landscape. The Karst plateau is an environmental protected area due to its fauna, biodiversity and its heritage value [64]. From a transboundary perspective, this is a highly representative region of the eastern Mediterranean, and its characteristics are highly relevant to an LSI planning perspective. This study examines Italian and Slovenian municipalities within the Gulf of Trieste. The Italian area considers the Friuli Venezia–Giulia Region, with the coastal (and inland) provinces of Trieste, Gorizia and Udine. The Slovenian area assesses the Littoral–Karst census region (Obalno–Kraška statistična Regija), with the municipalities of Ankaran, Koper, Izola and Piran.
To aid the LSI approach, the framework considers the necessary physical and spatial characteristics needed to develop an integrated, transboundary planning approach. The land-based analysis focuses on the morphological characteristics of a coastal buffer, according to coastal adaptation concepts [33,65]. This is useful to recognize and quantify different settlement typologies. Land use data, provided by Corine Land Cover 2018 (CLC 2018) and integrated with Normalized Difference Vegetation Index (NDVI) values, is used to characterize the land–sea coastal buffer. The NDVI value criteria are set to a threshold of lower than or equal to 0.4 (data updated in July 2017). Two groups of criteria were selected to illustrate positive relationships within the CLC variations of non-permeable surfaces. In this way, an indirect assessment of the effects of urbanization on the vegetation system in the buffer zone can be obtained. It should be noted that, in this analysis model, the NDVI values are particularly sensitive to three specific conditions: (a) characteristics of the climatic zone; (b) geomorphological and orographic aspects; (c) climatic conditions and angle of incidence of sunlight.
The calculations graphically illustrate a buffer zone with a depth of about 3.5 km (measured from the coastline); the two variables influence the delineation of the buffer zone. The selected criteria support both the study of the relationship between the natural and anthropic environment and the relationship between the maritime space and the effects of climate change [66,67]. Three primary landscapes represent the urbanized character of the buffer zone and are defined by land use. The three configurations are based on the first level of CLC 2018 and on the following classes: (a) agricultural areas, (b) forest (c) water bodies. The second level is also used to define (a) artificial surfaces and (b) wetlands.
The selected configurations are:
(1)
Areas with high urban density, where artificial surface (1.1; 1.2; 1.3; 1.4) values are higher than 25%;
(2)
Areas with medium urban density, with values between 15–25%;
(3)
Mainly natural areas with a low urban density, with values between 0–14%.
Table 6 illustrates an area characterized by a large concentration of rural and forestry land (approximately 68% of the total area of the buffer zone), with a lower percentage of residential and industrial uses (about 25%). Artificial surfaces are common in the Monfalcone area and the coastal areas of Trieste–Muggia and Ankaran–Koper. In these cases, the data for each municipality highlights the following distribution: Monfalcone 55%; Trieste 65%; San Dorligo della Valle 36%; Cow 44%; Ankaran 28%; Koper 25%.
The expansion of industrial and residential areas tends to amplify the pressure of climate-triggered impacts. This indicates a relationship between MSP and land-based planning.

2.4.2. Climate Change Impacts and Maritime Pressures

The investigation examines the Gulf of Trieste from an LSI perspective, considering local climate change impacts [68] and anthropic pressures. The interpretation of the maritime space is based on maps of the Gulf’s ecological characteristics. The study aims to determine a multidisciplinary knowledge database to aid a new, integrated planning methodology for maritime and terrestrial areas and dynamics [3]. The analysis also aims to detect and define the variety of stresses and effects generated by the anthropic use of the sea.
In the Gulf of Trieste, climatic impacts affect both environmental and human activities, such as sea biodiversity and coastal economies. Understanding, quantifying, and placing these phenomena within the spatial realm is necessary to define both local and regional policies. This set of possible mitigation and adaptation measures has to consider a wide scenario of possible risks [69]. Ecosystem services play a central role in both approaches, as green and blue infrastructures can enhance the adaptive capacity of territories and mitigate greenhouse gas (GHG) emissions. Adaptation measures tend to be more complex in urbanized areas, due to the varying characteristics of human settlements.

2.4.3. Assessment Results

Part of the research methodology consists of the application of the assessment techniques on the case study to test their capability to effectively highlight and quantify the overlapping of information aimed at CAP and MSP. The results of the application are presented to describe the double nature of LSI contexts, so the Assessment Results are divided into land-based approach results and sea-based approach results.

Land-Based Assessment Results

The UHI assessment is based on a multispectral image from the Landsat 8 sensor, evaluating the extension and the intensity of the phenomenon on the study area. The assessment technique implementation is based on the image LC08_L1TP_191028_20170706-USGS acquired on 6 July 2017. The UHI vulnerability assessment returned several impact responses; Figure 6 shows the relationship between the thermal behavior of the land’s surface and the characteristics of land use, according to Formula 10. The relationship is illustrated graphically, matching the four CLC classes, based on the Natural Breaks (Jenks) algorithm (vulnerability between −0.60 to + 0.62). The results of the analysis visually illustrate UHI stresses presented by the area’s densely urbanized territories. The UHI effect is particularly prominent in the urban areas of Trieste, Monfalcone and Capodistria, where vulnerability levels reach the maximum limit of +0.62. The territories highlighted by this analysis are generally of historical–residential, industrial, and port matrix types.
The runoff assessment simulates the behavior of surface waters by the modelling flow and outflow areas (Figure 7). The method provides a map of hydraulic criticality (see Equation (11) and Table 5). The hydraulic criticality gradient is calculated and weighted according to the topography (sensitivity) and the hydraulic response to the land uses (adaptive capacity). The hydraulic response is measured according to the rainfall absorption capacity. The study allows for (a) the quantification of runoff coefficients at the basin scale and (b) the recognition of the mainland uses that affect territorial hydraulic performances in terms of exposure and vulnerability. DTM hydrological modelling illustrates a significant increase in the runoff coefficient for areas with intensive and complex urbanisation. In residential and industrial areas, the runoff coefficient varies between 0.6 and 0.8. These are important geographic territorial areas that are especially vulnerable to flooding. Figure 7 highlights three inter-municipal areas which are more prone to high surface runoff: (1) Monfalcone–Staranzano–Duino; (2) Trieste–Muggia; (3) Ankarari–Koper. The residential and neighbouring industrial areas of Monfalcone–Staranzano–Duino constitute a particularly critical flood risk zone. Trieste–Muggia has two sub-areas with significant flood hazards. The first area is within the historical core of the city, while the second is located within the industrial port area between the two municipal boundaries. In the port of Trieste, the surface runoff is equal to 0.64. Ankarari–Koper presents hydraulic pressures localized in industrial areas and areas of recent urban expansion. In rural or sparsely urbanized areas, surface runoff tends to decrease significantly, with values lower than 0.46.
The final comparison between the results obtained by the Land and Urban Approach provides an analytical framework for both physical management and climate adaptation planning. Table 7 illustrates the comparison between the average UHI values and runoff, correlating them to the effects on the urbanized buffer zone. UHI and surface runoff are phenomena attributable, in part, to the progressive and complex soil-sealing of the area. Complex urban systems tend to compromize the ecological balance of the territory, increasing the vulnerability of coastal areas to climate change impacts.
A statistical analysis of the study area suggests the presence of some environmental areas with weakened ecological systems.

Sea-Based Assessment Results

The “Sea and Maritime Approach” examines the interaction between natural and human environmental components. The SST assessment describes air–sea interaction and the thermal state of superficial water. This thermic evaluation is important for its possible applications, i.e., the monitoring of climate change effects on hydric resources, oceanographic and coastal water observations, and ecological and microclimatic analyses.
Gulf of Trieste’s sea surface manifests considerable surface thermal variations, particularly in the central marine areas, near the coasts and river estuaries (see Figure 8). Some of these variations can be attributed to the following dynamics: i) vertical water currents; ii) mix of different water densities; iii) salinity variations; iv) seabed depth; v) land proximity; vi) climatic conditions.
In the case study area, various important environmental components are impacted by land and sea-based anthropic activities. The main pressure comparisons identified using the SST distribution help us to understand the relationship between rising temperatures and environmental degradation. This could also help to distinguish the main pressures derived from land-based activities. What has emerged from this preliminary analysis is the interrelation between water circulation and surface runoff, which indirectly affects the distribution of the main pressures, contaminants and nutrients [70]. The thermal structure of the Gulf of Trieste is fed by an anti-clockwise thermohaline circulation, which flows from Trieste–Koper to the regional margins of the Isonzo and Timavo estuary (Grado-Monfalcone locality). This cooling circuit transports energy and materials (dissolved particles and solids), significantly influencing the coastal climate and marine biology of the area.
From this perspective, integrated planning should consider a transboundary dimension to achieve a strategic framework that is aware of the highly dynamic nature of this marine environment. Moreover, the climatic impacts, anthropic pressures, and use conflicts of the inland will not remain isolated, but territorial characteristics will extend their effects on the maritime space, and vice versa.

3. Discussion

This study is based on the ADRiatic Ionian maritime spatial PLANning (ADRIPLAN) project’s database, which allowed us to integrate information about the ecological and biological interconnections of the area into the planning approach knowledge framework. Terrestrial and marine dynamics, analyzed through the obtained maps, allowed for the consideration of the relationships between these two systems, increasing the understanding of the LSI context from a planning perspective.
The proposed integrated planning approach knowledge framework plays a fundamental role in understanding the complexity of the connections between land and maritime contexts. Merging different information allows for the implementation of multi-disciplinary and multi-systemic perspectives. Figure 9 represents the results of overlapping the empirical research, overlaid to provide an integrated, holistic re-examination of the relationships between the maritime and terrestrial environments of the case study area.
Planning the maritime space begins on the coastline, but it should also consider the dynamics of landward areas (for example, the climatic effects of agriculture, urban areas and human wellbeing). The proposed integration between CAP and MSP highlights the connection between UHI and SST, and between runoff and SST. The spatial relationship between UHI and SST is clearly represented in Figure 10: the presence of a considerable number of SST anomalies (hot spots) correspond with high UHI vulnerability values (see Figure 10a). The logical connection between SST and surface runoff can be seen as a consequence of terrestrial soil-sealing on the quality of marine waters and the associated levels of toxicity [22,71,72,73].
The clear relationship identified between these factors justifies the recommendation of the integration of the scientific disciplinary approaches of CAP, MSP and LSI planning requirements.
The assessment techniques presented in Chapter 2.3 could be updated using local micro-climate indicators and considering climatic trends [74,75,76]. Therefore, the test could be used to provide a more detailed definition of vulnerability and consequent adaptation actions. Local planning authorities should consider, as a priority, the integration of this approach in their databases. Furthermore, a loss of information with different origins and natures could lead to the misunderstanding of territorial criticalities in such complex environments as coastal ones.
The research methodology, presented in Chapter 2, is designed to support decision makers with the identification of the more efficient strategies to cope with climate change challenges and maritime space management. The stresses related to heat and urban flooding assessed in the study could also be applied and adapted to other impacts, (such as wildfires, droughts, coastal erosion, and the impact of sea level rises).
The opportunity to capitalize on and exploit existing databases can represent an economic saving for public bodies, avoiding the duplication of existing assessments. In this sense, one of the most relevant conclusions emerging from this research is its possible applications in ongoing projects and strategic funding opportunities. As anticipated in the Empirical Research chapter, the present study is partially based on data sets produced within the Adriatic Ionian Maritime Spatial Planning project, started in 2013 and completed in 2015 and financed by the program “DG MARE/ 2012/25 - Project on Maritime Spatial Planning in the Mediterranean Sea and/or the Black Sea”. This project, like others developed at the Euro-Mediterranean level and for the European coastal context in general (see SUPREME project [77]), was limited by the segregated assessment of land and sea. One of the more interesting opportunities to test the model presented by this paper is cross-border cooperation projects in the Mediterranean area. This model has already been included within the strategic definition of the Interreg Italy–Slovenia project, financed by the European community “Supporting Energy and Climate Adaptation Policies” and in the European Maritime and Fisheries Fund (EMFF): MSP-MED.

4. Conclusions

Responding to the RQs highlighted, the opportunities and the implications of an integrated planning approach for coastal areas, climate change constitutes an environmental condition that impacts the whole coastal ecosystem and requires the appropriate tools to holistically plan these contexts’ transformations. Through the implementation of our three-step research methodology, the authors proposed three different levels of merging between CAP and MSP. This union of different knowledge frames can support the retrofitting of ongoing processes or the gradual transition of sectoral planning. The answer developed for RQs 1 and 2 consists of the development of a territorial unit—the hexagonal grid—which can contain information with different natures and origins. From this perspective, the authors define a tool through which we can integrate information that already exists and finalize its output readings. Nevertheless, the necessary condition to implement this approach is the will to use the already available tools and to share information among public authorities. Furthermore, this process generates the opportunity to systematically analyze the responses of the marine coastal environment to the pressures produced by human-driven processes and climate change. The planning approach is based on three elements, (Figure 3): (1) the theoretical–methodological framework, which composes a system that allows for interoperability between spatial information; (2) a scientific approach, which uses investigation techniques for the analysis of climatic impacts and the systemic representation of sea components; (3) an empirical application, which allows for the strategic contextualization of the integrated planning approach. The integration process between CAP and MSP (Figure 9) demonstrates the need and the opportunity for the holistic management of LSI dynamics. This study is considered as a first step to lead to a general transformation of sectoral planning approaches. The present research is designed to provide an overview of the possible analytical tools that can integrate land and sea planning. However, further and multi-disciplinary studies are required to fully implement this approach within local regulations without generating further conflicts and misunderstandings. Because of this, the conclusion of this study remains open to new research and the urgency of a pragmatic understanding of the ongoing processes remains strong. Chapter 2.3 (Empirical Research) confirms the strategic nature of the work, answering RQs 1 and 3, and presents a tool which can be scaled and replicated in other coastal contexts. This assessment, developed based on the Gulf of Trieste case study, synergistically considers land and sea components. This combination relates different territorial information levels to a specific area and can be updated and modified over time with new technological skills and knowledge. The result achieved by the study can support an integrated coastal planning approach, where local planning processes are supported by summary maps that characterize and facilitate the choice of intervention measures (RQ4). The proposed framework for a new LSI planning model could support i) guidelines to monitor the performance of planning outcomes; ii) methodologies to support environmental protection and the sustainable development of coastal areas; iii) spatial modelling algorithms and remote sensing analysis techniques to support the implementation of cognitive frameworks concerning urban and territorial planning.

Author Contributions

Conceptualization, D.M., G.P. and C.F.d.; methodology, D.M., G.P. and C.F.d.; software, D.M. and G.P.; validation, F.M. and D.M.; formal analysis, D.M. and G.P.; investigation, D.M., G.P. and C.F.d.; resources, D.M., G.P., C.F. d.O., F.M. and N.B.; data curation, D.M., G.P. and C.F.d.; writing—original draft preparation, D.M., G.P. and C.F.d.; writing—review and editing, D.M. and F.M.; visualization, D.M., G.P. and C.F.d.; supervision, D.M. and F.M.; project administration, D.M. and F.M.; funding acquisition, F.M. All authors have read and agreed to the published version of the manuscript. Please turn to the CRediT taxonomy for the term explanation.

Funding

European Commission-EASME-European Maritime and Fisheries Fund (EMFF): MSP-MED Towards the operational implementation of MSP in our common Mediterranean Sea, scientific coordinator prof. Francesco Musco.

Conflicts of Interest

The authors declare no conflict of interest.

References

  1. Meiner, A. Integrated maritime policy for the European Union—consolidating coastal and marine information to support maritime spatial planning. J. Coast. Conserv. 2010, 14, 1–11. [Google Scholar] [CrossRef]
  2. Borja, A.; Elliott, M.; Andersen, J.H.; Cardoso, A.C.; Carstensen, J.; Ferreira, J.G.; Heiskanen, A.S.; Marques, J.C.; Neto, J.M.; Teixeira, H.; et al. Good Environmental Status of marine ecosystems: What is it and how do we know when we have attained it? Mar. Pollut. Bull. 2013, 76, 16–27. [Google Scholar] [CrossRef] [PubMed] [Green Version]
  3. United Nations Development Programme. 2030 Agenda for Sustainable Development Goals. Available online: https://sustainabledevelopment.un.org/sdg14 (accessed on 30 April 2020).
  4. Rojas, R.; Feyen, L.; Watkiss, P. Climate change and river floods in the European Union: Socio-economic consequences and the costs and benefits of adaptation. Glob. Environ. Chang. 2013, 23, 1737–1751. [Google Scholar] [CrossRef]
  5. Fiorini, M.; Capata, A.; Bloisi, D.D. AIS Data Visualization for Maritime Spatial Planning (MSP). Int. J. e-Navi. Marit. Econ. 2016, 5, 45–60. [Google Scholar] [CrossRef]
  6. Pedersen, S.; Gangås, K.E.; Chetri, M.; Andreassen, H.P. Economic Gain vs. Ecological Pain—Environmental Sustainability in Economies Based on Renewable Biological Resources. Sustainability 2020, 12, 3557. [Google Scholar] [CrossRef]
  7. Suárez de Vivero, J.L.; Rodríguez Mateos, J.C. The Spanish approach to marine spatial planning. Marine Strategy Framework Directive vs. EU Integrated Maritime Policy. Mar. Policy 2012, 36, 18–27. [Google Scholar] [CrossRef]
  8. Qiu, W.; Jones, P.J.S. The emerging policy landscape for marine spatial planning in Europe. Mar. Policy 2013, 39, 182–190. [Google Scholar] [CrossRef]
  9. Schlüter, A.; Van Assche, K.; Hornidge, A.K.; Văidianu, N. Land-sea interactions and coastal development: An evolutionary governance perspective. Mar. Policy 2020, 112, 103801. [Google Scholar] [CrossRef]
  10. Stancheva, M.; Stanchev, H.; Palazov, A.; Krastev, A. Natural and human land-sea interactions: Burgas Case Study. In Proceedings of the 19th EGU General Assembly, Vienna, Austria, 23–28 April 2017; p. 6896. [Google Scholar]
  11. Álvarez-Romero, J.G.; Pressey, R.L.; Ban, N.C.; Vance-Borland, K.; Willer, C.; Klein, C.J.; Gaines, S.D. Integrated Land-Sea Conservation Planning: The Missing Links. Annu. Rev. Ecol. Evol. Syst. 2011, 42, 381–409. [Google Scholar] [CrossRef] [Green Version]
  12. Stoms, D.M.; Davis, F.W.; Andelman, S.J.; Carr, M.H.; Gaines, S.D.; Halpern, B.S.; Hoenicke, R.; Leibowitz, S.G.; Leydecker, A.; Madin, E.M.P.; et al. Integrated Coastal Reserve Planning: Making the Land-Sea Connection. Front. Ecol. Environ. 2005, 3, 429. [Google Scholar]
  13. Blečić, A. Cecchini. Antifragile planning. Plan. Theory 2019. [Google Scholar] [CrossRef]
  14. European Commission. Blue Growth Study—Scenarios and drivers for Sustainable Growth from the Oceans, Seas and Coasts. Available online: https://webgate.ec.europa.eu/maritimeforum/content/2946 (accessed on 30 April 2020).
  15. European Comission. The European Parliament, the Council, the European Economic and Social Committee and the Committee of the Regions, An Integrated Maritime Policy. 2007. Available online: https://eur-lex.europa.eu/LexUriServ/LexUriServ.do?uri=COM:2007:0575:FIN:EN:PDF (accessed on 30 April 2020).
  16. European Parliament and European Council. Directive 2008/56/EC of the European Parliament and of the Council of 17 June 2008 establishing a framework for community action in the field of marine environmental policy (Marine Strategy Framework Directive). Available online: https://eur-lex.europa.eu/legal-content/EN/TXT/?uri=CELEX:32008L0056 (accessed on 30 April 2020).
  17. European Union. Directive 2014/89/EU of the European Parliment and of the Council of 23 July 2014 establishing a framework for maritime spatial planning. Available online: https://eur-lex.europa.eu/legal-content/EN/TXT/?uri=uriserv:OJ.L_.2014.257.01.0135.01.ENG%20 (accessed on 30 April 2020).
  18. Ban, N.C.; Klein, C.J. Spatial socioeconomic data as a cost in systematic marine conservation planning. Conserv. Lett. 2009, 2, 206–215. [Google Scholar] [CrossRef]
  19. Barbanti, A.; Campostrini, P.; Musco, F.; Sarretta, A.; Gissi, E. Developing a Maritime Spatial Plan for the Adriatic Ionian Region. Available online: https://zenodo.org/record/48231#.Xvm5F74zbIU (accessed on 29 June 2020).
  20. Johnson, D.; Barrio Froján, C.; Bax, N.; Dunstan, P.; Woolley, S.; Halpin, P.; Dunn, D.; Hazin, C.; Dias, M.; Davies, T.; et al. The Global Ocean Biodiversity Initiative: Promoting scientific support for global ocean governance. Aquat. Conserv. Mar. Freshw. Ecosyst. 2019, 29, 162–169. [Google Scholar] [CrossRef] [Green Version]
  21. Jay, S.; Alves, F.L.; O’Mahony, C.; Gomez, M.; Rooney, A.; Almodovar, M.; Gee, K.; de Vivero, J.L.S.; Gonçalves, J.M.S.; da Luz Fernandes, M.; et al. Transboundary dimensions of marine spatial planning: Fostering inter-jurisdictional relations and governance. Mar. Policy 2016, 65, 85–96. [Google Scholar] [CrossRef]
  22. Menegon, S.; Depellegrin, D.; Farella, G.; Gissi, E.; Ghezzo, M.; Sarretta, A.; Venier, C.; Barbanti, A. A modelling framework for MSP-oriented cumulative effects assessment. Ecol. Indic. 2018, 91, 171–181. [Google Scholar] [CrossRef] [Green Version]
  23. Italian Government. Decreto Legislativo 17 ottobre 2016, n. 201. Attuazione della direttiva 2014/89/UE che istituisce un quadro per la pianificazione dello spazio marittimo. 2016. Available online: https://www.gazzettaufficiale.it/eli/id/2016/11/07/16G00215/sg (accessed on 30 April 2020).
  24. Presidente del Consiglio dei Ministri, Decreto del Presidente del Consiglio dei Ministri 1° dicembre 2017. Approvazione delle linee guida contenenti gli indirizzi e i criteri per la predisposizione dei piani di gestione dello spazio marittimo. 2018. Available online: https://www.gazzettaufficiale.it/atto/serie_generale/caricaDettaglioAtto/originario?atto.dataPubblicazioneGazzetta=2018-01-24&atto.codiceRedazionale=18A00392 (accessed on 30 April 2020).
  25. Nicholls, R.J.; Marinova, N.; Lowe, J.A.; Brown, S.; Vellinga, P.; de Gusmão, D.; Hinkel, J.; Tol, R.S.J. Sea-level rise and its possible impacts given a “beyond 4 °C world” in the twenty-first century. Philos. Trans. R. Soc. A Math. Phys. Eng. Sci. R. Soc. 2011, 161–181. [Google Scholar] [CrossRef] [Green Version]
  26. European Comission. COMMISSION STAFF WORKING DOCUMENT accompanying the WHITE PAPER Adapting to climate change: Towards a European framework for action Climate Change and Water, Coasts and Marine Issues.\nEuropean Commission. 2009. Available online: http://ec.europa.eu/environment/climat/adaptation/pdf/sec_2009_386.pdf (accessed on 1 May 2020).
  27. IPCC. Climate Change 2014—Impacts, Adaptation and Vulnerability: Part A: Global and Sectoral Aspects: Working Group II Contribution to the Fifth Assessment Report of the Intergovernmental Panel on Climate Change; Cambridge University Press: Cambridge, UK, 2014. [Google Scholar]
  28. European Environment Agency. The European Environment—State and Outlook 2020: Knowledge for Transition to A Sustainable Europe; European Environment Agency: Copenhagen, Denmark, 2019. [Google Scholar]
  29. Preston, B.; Dow, K.; Berkhout, F. The Climate Adaptation Frontier. Sustainability 2013, 5, 1011–1035. [Google Scholar] [CrossRef] [Green Version]
  30. Wang, Y.; Shen, X.; Jiang, M.; Lu, X. Vegetation Change and Its Response to Climate Change between 2000 and 2016 in Marshes of the Songnen Plain, Northeast China. Sustainability 2020, 12, 3569. [Google Scholar] [CrossRef]
  31. Wilson, G.T.; Bhamra, T. Design for Sustainability: The Need for a New Agenda. Sustainability 2020, 12, 3615. [Google Scholar] [CrossRef]
  32. Nicholls, R.J.; Wong, P.P.; Burkett, V.; Woodroffe, C.D.; Hay, J. Climate change and coastal vulnerability assessment: Scenarios for integrated assessment. Sustain. Sci. 2008, 3, 89–102. [Google Scholar] [CrossRef]
  33. IPCC. Strategies for Adaptation to Sea Level Rise. 1990. Available online: http://papers.risingsea.net/IPCC-1990-Strategies-for-Adaption-to-Sea-Level-Rise.html (accessed on 1 May 2020).
  34. Wei, Y.M.; Han, R.; Wang, C.; Yu, B.; Liang, Q.M.; Yuan, X.C.; Chang, J.; Zhao, Q.; Liao, H.; Tang, B.; et al. Self-preservation strategy for approaching global warming targets in the post-Paris Agreement era. Nat. Commun. 2020, 11, 1624. [Google Scholar] [CrossRef] [PubMed] [Green Version]
  35. Dietzenbacher, E.; Cazcarro, I.; Arto, I. Towards a more effective climate policy on international trade. Nat. Commun. 2020, 11. [Google Scholar] [CrossRef] [PubMed] [Green Version]
  36. The Environmental Protection Agency. Draft Guidelines on the information to be contained in Environmental Impact Assessment Reports (EIAR). 2017. Available online: https://www.epa.ie/pubs/advice/ea/EPA%20EIAR%20Guidelines.pdf (accessed on 29 June 2020).
  37. Musco, F. Counteracting Urban Heat Island Effects in a Global Climate Change Scenario; Springer Nature: Berlin, Germany, 2016. [Google Scholar] [CrossRef]
  38. Frazão Santos, C.; Agardy, T.; Andrade, F.; Calado, H.; Crowder, L.B.; Ehler, C.N.; García-Morales, S.; Gissi, E.; Halpern, B.S.; Orbach, M.K. Integrating climate change in ocean planning. Nat. Sustain. 2020, 1–12. [Google Scholar] [CrossRef]
  39. Menegon, S.; Sarretta, A.; Barbanti, A.; Gissi, E.; Venier, C. Open source tools to support Integrated Coastal Management and Maritime Spatial Planning. PeerJ Preprints 2016, 4, 2245. [Google Scholar] [CrossRef]
  40. Abramic, A.; Bigagli, E.; Barale, V.; Assouline, M.; Lorenzo-Alonso, A.; Norton, C. Maritime spatial planning supported by infrastructure for spatial information in Europe (INSPIRE). Ocean Coast. Manag. 2018, 152, 23–36. [Google Scholar] [CrossRef] [Green Version]
  41. Walsh, C. Transcending land–sea dichotomies through strategic spatial planning. Reg. Stud. 2020, 1–13. [Google Scholar] [CrossRef]
  42. Maragno, D. Ict. Resilienza e Pianificazione Urbanistica. per Adattare Le Città Al Clima; Franco Angeli Edizioni: Milan, Italy, 2018. [Google Scholar]
  43. Maragno, D.; Fontana, M.D.; Musco, F. Mapping heat stress vulnerability and risk assessment at the neighborhood scale to drive Urban adaptation planning. Sustainability 2020, 12, 1056. [Google Scholar] [CrossRef] [Green Version]
  44. Pistocchi, A. La valutazione idrologica dei piani urbanistici–Un metodo semplificato per l’invarianza idraulica dei piani regolatori generali. Ing. Ambient 2001, 3, 407–413. [Google Scholar]
  45. Pozzer, G. Consumo di suolo e gestione del rischio idraulico: test per linvarianza idraulica nella pianificazione territoriale. In Recuper. Terreno Anal. e Prospett. per La Gest. Sostenibile Della Risorsa Suolo; Franco Angeli Edizioni: Milan, Italy, 2015; pp. 165–177. [Google Scholar]
  46. Maragno, D.; Dall’Omo, C.F.; Ruzzante, F.; Musco, F. Toward a trans-regional vulnerability assessment for Alps. A methodological approach to land cover changes over alpine landscapes, supporting urban adaptation. Urban Clim. 2020, 32, 100622. [Google Scholar]
  47. Adriplan. Welcome To Adriplan. 2015. Available online: http://adriplan.eu/ (accessed on 27 April 2020).
  48. Gardi, C. Urban Expansion, Land Cover and Soil Ecosystem Services; Taylor and Francis: Oxfordshire, UK, 2017. [Google Scholar]
  49. Walsh, C.J.; Fletcher, T.D.; Burns, M.J. Urban Stormwater Runoff: A New Class of Environmental Flow Problem. PLoS ONE 2012, 7, 45814. [Google Scholar] [CrossRef] [Green Version]
  50. Ungaro, F.; Calzolari, C.; Pistocchi, A.; Malucelli, F. Modelling the impact of increasing soil sealing on runoff coefficients at regional scale: A hydropedological approach. J. Hydrol. Hydromech. 2014, 62, 33–42. [Google Scholar] [CrossRef] [Green Version]
  51. Pistocchi, A.; Calzolari, C.; Malucelli, F.; Ungaro, F. Soil sealing and flood risks in the plains of Emilia-Romagna. Italy J. Hydrol. Reg. Stud 2015, 4, 398–409. [Google Scholar] [CrossRef]
  52. Sofia, G.; Tarolli, P. Hydrological response to ~30 years of agricultural surface water management. Land 2017, 6, 3. [Google Scholar] [CrossRef] [Green Version]
  53. Pistocchi, A. Hydrological impact of soil sealing and urban land take. In Urban Expansion, Land Cover and Soil Ecosystem Services; Routledge: London, UK, 2018; pp. 157–168. [Google Scholar]
  54. Ndossi, M.I.; Avdan, U. Application of open source coding technologies in the production of Land Surface Temperature (LST) maps from Landsat: A PyQGIS plugin. Remote Sens. 2016, 8, 413. [Google Scholar] [CrossRef] [Green Version]
  55. Syariz, M.A.; Jaelani, L.M.; Subehi, L.; Pamungkas, A.; Koenhardono, E.S.; Sulisetyono, A. Retrieval of sea surface temperature over Poteran Island water of Indonesia with Landsat 8 TIRS image: A preliminary algorithm. Available online: https://doi.org/10.5194/isprsarchives-XL-2-W4-87-2015 (accessed on 29 June 2020).
  56. Cahyono, A.B.; Saptarini, D.; Pribadi, C.B.; Armono, H.D. Estimation of Sea Surface Temperature (SST) Using Split Window Methods for Monitoring Industrial Activity in Coastal Area. Appl. Mech. Mater. 2017, 862, 90–95. [Google Scholar] [CrossRef]
  57. Xing, X.; Liu, Y.; Dong, W.; Wang, Z.; Zhang, L.; . Sun, Z.; Huang, M. An algorithm to inverse sea surface temperatures at offshore water by employing Landsat 8/TIRS data. In Proceedings of the 36th Asian Conference on Remote Sensing 2015 (ACRS 2015): Foster. Resilient Growth in Asia, Quezon, Philippines, 24–28 October 2015. [Google Scholar]
  58. Fu, J.; Chen, C.; Ren, H.; Zhang, Y.; Chu, Y. Sea surface temperature retrieval from landsat8 thermal infrared remote sensing data in coastal waters. In Proceedings of the IOP Conference Series: Earth and Environmental Science, Basel, Switzerland, 22 March 2020; p. 32067. [Google Scholar] [CrossRef]
  59. Saptarini, D.; Cahyono, A.B.; Pribadi, C.B.; Mukhtasor, H.D. Armono. Landsat 8 Imagery Data Utilization for Mapping the Dynamics of Cooling Water Distribution Based on Changes in SST in the Coastal Waters. Appl. Mech. Mater. 2017, 862, 78–82. [Google Scholar] [CrossRef]
  60. Jang, J.C.; Park, K.A. High-resolution sea surface temperature retrieval from Landsat 8 OLI/TIRS data at coastal regions. Remote Sens. 2019, 11, 2687. [Google Scholar] [CrossRef] [Green Version]
  61. Menegon, S.; Depellegrin, D.; Farella, G.; Sarretta, A.; Venier, C.; Barbanti, A. Addressing cumulative effects, maritime conflicts and ecosystem services threats through MSP-oriented geospatial webtools. Ocean Coast. Manag 2018, 163, 417–436. [Google Scholar] [CrossRef] [Green Version]
  62. Morino, M. Trieste. Porto.di. maxi hub ferroviario tra Europa e Far East, Sole 24 Ore. 2019, 5. Available online: https://www.ilsole24ore.com/art/porto-trieste-maxi-hub-ferroviario-europa-e-far-east-ACufI34 (accessed on 28 April 2020).
  63. Picciulin, M.; Codarin, A.; Malavasi, S.; Fiorin, R.; Colla, S.; Rako-Gospic, N. The noisy coastal areas of the transboundary Northern Adriatic Sea. In Proceedings of the 5th International Conference on the Effects of Noise on Aquatic Life, Den Haag, The Netherlands, 7–12 July 2019; p. 070002. [Google Scholar]
  64. Buzan, E.; Pallavicini, A.; Glasnović, P.; Tout, P. Biodiversity and Conservation of Karst Ecosystems; Padova University Press: Padova, Italy, 2014. [Google Scholar]
  65. Sánchez-Arcilla, A.; Lin-Ye, J.; García-León, M.; Gràcia, V.; Pallarès, E. The land-sea coastal border: A quantitative definition by considering the wind and wave conditions in a wave-dominated, micro-Tidal environment. Ocean Sci. 2019, 15, 113–126. [Google Scholar] [CrossRef] [Green Version]
  66. O’Hagan, A.M.; Paterson, S.; Le Tissier, M. Addressing the tangled web of governance mechanisms for land-sea interactions: Assessing implementation challenges across scales. Mar. Policy 2020, 112, 103715. [Google Scholar] [CrossRef]
  67. Zaucha, J.; Gee, K. Maritime Spatial Planning: Past, Present, Future; Springer International Publishing: Berlin, Germany, 2019. [Google Scholar]
  68. ARPAFVG. Studio conoscitivo dei cambiamenti climatici e di alcuni loro impatti in Friuli Venezia Giulia. 2018. Available online: http://www.arpa.fvg.it/cms/tema/osmer/approfondimenti/cambiamenti-climatici.html (accessed on 9 May 2020).
  69. Halpern, B.S.; Selkoe, K.A.; Micheli, F.; Kappel, C.V. Evaluating and ranking the vulnerability of global marine ecosystems to anthropogenic threats. Conserv. Biol. 2007, 21, 1301–1315. [Google Scholar] [CrossRef] [PubMed]
  70. ARPA, FVG, RAPPORTO SULLO STATO DELL’AMBIENTE IN FRIULI VENEZIA GIULIA. 2018. Available online: https://pixabay.com/ (accessed on 18 June 2020).
  71. Salerno, F.; Gaetano, V.; Gianni, T. Urbanization and climate change impacts on surface water quality: Enhancing the resilience by reducing impervious surfaces. Water Res. 2018, 144, 491–502. [Google Scholar] [CrossRef] [PubMed]
  72. Srinivasan, V.; Seto, K.C.; Emerson, R.; Gorelick, S.M. The impact of urbanization on water vulnerability: A coupled human–environment system approach for Chennai, India. Glob. Environ. Chang. 2013, 23, 229–239. [Google Scholar] [CrossRef]
  73. Depellegrin, D.; Menegon, S.; Farella, G.; Ghezzo, M.; Gissi, E.; Sarretta, A.; Venier, C.; Barbanti, A. Multi-objective spatial tools to inform maritime spatial planning in the Adriatic Sea. Sci. Total Environ. 2017, 609, 1627–1639. [Google Scholar] [CrossRef] [PubMed] [Green Version]
  74. Calado, H.; Ng, K.; Johnson, D.; Sousa, L.; Phillips, M.; Alves, F. Marine spatial planning: Lessons learned from the Portuguese debate. Mar. Policy 2010, 34, 1341–1349. [Google Scholar] [CrossRef]
  75. Wilson, K.; Cabeza, M.; Klein, K.J. Fundamental concepts of spatial conservation prioritisation. In Spatial Conservation Prioritisation: Quantitative Method and Computational Tools; Oxford University Press: Oxford, UK, 2009. [Google Scholar]
  76. Nhancale, B.A.; Smith, R.J. The influence of planning unit characteristics on the efficiency and spatial pattern of systematic conservation planning assessments. Biodivers. Conserv. 2011, 20, 1821–1835. [Google Scholar] [CrossRef]
  77. SUPREME Supporting Maritime Spatial Planning in the Eastern Mediterranean CASE STUDY FRAMEWORK Addressing MSP Implementation in Case Study Areas (C.1.3.8.) Co-funded. 2017. Available online: http://www.msp-supreme.eu/files/c-1-3-8-north-adriatic.pdf (accessed on 30 April 2020).
Figure 1. Graphical Abstract of Maritime Spatial Planning (MSP) and Climate Adaptation Planning (CAP) integration.
Sustainability 12 05319 g001
Figure 2. CAP and MSP combination workflow (source: authors’ elaboration).
Sustainability 12 05319 g002
Figure 3. Research design organization.
Sustainability 12 05319 g003
Figure 4. Schematic integration of the assessment workflows (source: authors’ elaboration).
Sustainability 12 05319 g004
Figure 5. Gulf of Trieste study area.
Sustainability 12 05319 g005
Figure 6. Map of vulnerability to Urban Heat Island (UHI).
Sustainability 12 05319 g006
Figure 7. Map of surface runoff.
Sustainability 12 05319 g007
Figure 8. Sea assessment: (a) map of sea surface temperature; (b) map of environmental components (source: authors’ elaboration based on Table 1—Sea and Maritime Approach).
Sustainability 12 05319 g008
Figure 9. Land–sea interaction (LSI) area: systemic analytical map.
Sustainability 12 05319 g009
Figure 10. Maritime and coastal area of Trieste–Koper: (a) UHI and Sea Surface Temperature (SST); (b) runoff and SST.
Sustainability 12 05319 g010
Table 1. Data sources.
ApproachCategoryDescriptionTypology and ResolutionSource
Land and urban approachBasic MapDigital Terrain ModelRaster 25 × 25mCopernicus Program
Basic MapPrimary watercoursesVectorCCM2
Thematic MapCorine Land-Cover 2018 Photo-interpreted satellite survey of European land cover.Vector/Raster The production of CLC data returns digital cartography at a scale of 1: 100,000.Copernicus Program
Remote sensingMultispectral Satellite Image: LC08_L1TP_191028_20170706Raster-Geotif-16 bits, 30m Landsat 8 (United States Geological Survey – USGS)
Morphological parameters and indicesLST; NDVI; NDMIRaster-Geotif-16 bits, 30mData derived from Landsat 8 image (USGS)
Sea and maritime approachBasic MapAdriatic-Ionian Macro-regionVectorAdriplan project
Maritime transport and tourismPorts and harboursVectorShape Adriatic Atlas
Basic MapArtificial reef (Veneto-Friuli-Venezia Giulia)VectorISMAR (Venezia)
Coastal defence and sand extractionOffshore sand depositsVectorCNR-ISMAR (Venezia)
Coastal defence and sand extractionArtificial coastlineVectorAdriplan project
Maritime transport and tourismFerry routesVectorShape Adriatic Atlas
Maritime transport and tourismMarine traffic corridorVectorShape Adriatic Atlas
Environment and ecosystemsNatura 2000VectorEEA (European Environment Agency)
Environment and ecosystemsCoralligenous communities (model) VectorMEDISEH-MAREA project
Environment and ecosystemsCoralligenous outcropsVectorMEDISEH-MAREA project
Environment and ecosystemsPosidonia oceanica distributionVectorMEDISEH-MAREA project
Environment and ecosystemsMarine mammals’ sightingsVectorEuropean Marine Observation and Data Network (EMODne)
Table 2. Land and urban vulnerability processing techniques.
ImpactStatistical UnitData, Indicators, IndexesVulnerabilityProcess
SensitivityAdaptive Capacity
Urban Heat IslandsHexagonal CellLSTLST (average value)NDVI (average value)Sensitivity (–) Adaptive Capacity
NDVINDMI (average value)
NDMI
Urban FloodingPixelDigital Terrain Model (DTM)0.9 no permeable areas0.1 permeable areasSensitivity and adaptive capacity relationship illustrated using a GIS spatial association algorithm
Land Cover
Surface Outflow Index
Table 3. Matrix attributes.
Statistical UnitLSTNDVINDMI
Hexagonal cellAverage valueAverage valueAverage value
Table 4. Vulnerability attributes.
LSTNDVINDMI
SensitivityAdaptive capacityAdaptive capacity
Table 5. Vulnerability attributes.
Statistical UnitDTMLand UseRunoff Coefficient
0.9 Impermeable Areas (Worse Condition)0.1 Permeable Areas (Best Condition)
PixelSensitivitySensitivityAdaptive capacityAdaptive capacity
Table 6. Distribution of land use in the municipalities of the buffer area.
1.11.21.31.4234.25
MunicipalityBuffer * Area for Municipal Partition (sq Km)Urban Fabric %Industrial, Commercial and Transport Units %Mine, Dump and Construction Sites%Artificial, Non-Agricultural Vegetated Areas %Agricultural Areas (2.1; 2.2; 2.4) %Forest and Semi Natural Areas (3.1; 3.2; 3.3) %Maritime Wetlands %Water Bodies (5.1; 5.2) %
Grado (GO) **45.675.96001.8464.393.3713.7310.71
San Canzian d’Isonzo (GO)7.44000081.918.8509.24
Aquileia (UD)12.04000092.764.52.20.55
Fiumicello (UD)3.120000100000
Staranzano (GO)15.567.81.630054.9321.7310.133.78
Monfalcone (GO)20.3127.0227.77004.8732.767.420.16
Ronchi dei Legionari (GO)1.74000011.0188.9900
Doberdò del Lago (GO)3.9500000.6699.3400
Duino-Aurisina (TS)38.0210.192.741.06012.75730.130.14
Sgonico (TS)14.64.331.330021.2573.0900
Trieste52.7450.2913.9700.595.6728.9900.48
San Dorligo della Valle (TS)9.2810.3125.880037.5126.3100
Muggia (TS)13.5119.3323.420030.9925.800.46
Koper41.529.8314.880.030.7657.2313.990.932.35
Ankaran7.966.7817.115.12052.7714.2803.94
Izola25.259.624.040058.8426.7800.71
Piran29.5211.832.630049.4412.8521.791.45
Overall profile342.2515.948.590.240.4339.6127.874.822.49
Note: * The choice of a depth of 3.5 km is also attributable to a steep strip of coast, whose urbanization depth (of about 2/4 km) is largely influenced by the morphological conditions of the karst plateau. ** For the Grado area, a part of the water body values was excluded from the buffer zone count, as it is a marine transition lagoon element.
Table 7. Average UHI and runoff values in relation to the soil-sealing of the buffer zone.
Corine Landcover 2018—I and II Level Classification
Municipality1.11.21.31.4Urban Heat Island (UHI)Urban Runoff
Urban Fabric %Industria, Commercial and Transport Units %Mine, Dump and Construction Sites%Artificial, Non-Agricultural Vegetated Areas%Average Value Range from −0.16 (Low Vulnerability) to 0, 0, (High Vulnerability)Value Range from 0.55 (Low Impact) to 0.70 (High Impact)
Grado (GO)5.96001.840.120.55
Staranzano (GO)7.81.63000.130.64
Monfalcone (GO)27.0227.77000.300.70
Duino-Aurisina (TS)10.192.741.060−0.040.59
Sgonico (TS)4.331.3300−0.160.58
Trieste50.2913.9700.590.230.66
San Dorligo della Valle (TS)10.3125.88000.130.70
Muggia (TS)19.3323.42000.130.66
Koper9.8314.880.030.760.260.70
Ankaran6.7817.115.1200.300.68
Izola9.624.04000.150.66
Piran11.832.63000.130.65

