Parametric Study of Local Site Response for Bedrock Ground Motion to Earthquake in Phuentsholing, Bhutan

 , ,
, ,  ,
,
Abstract
1. Introduction
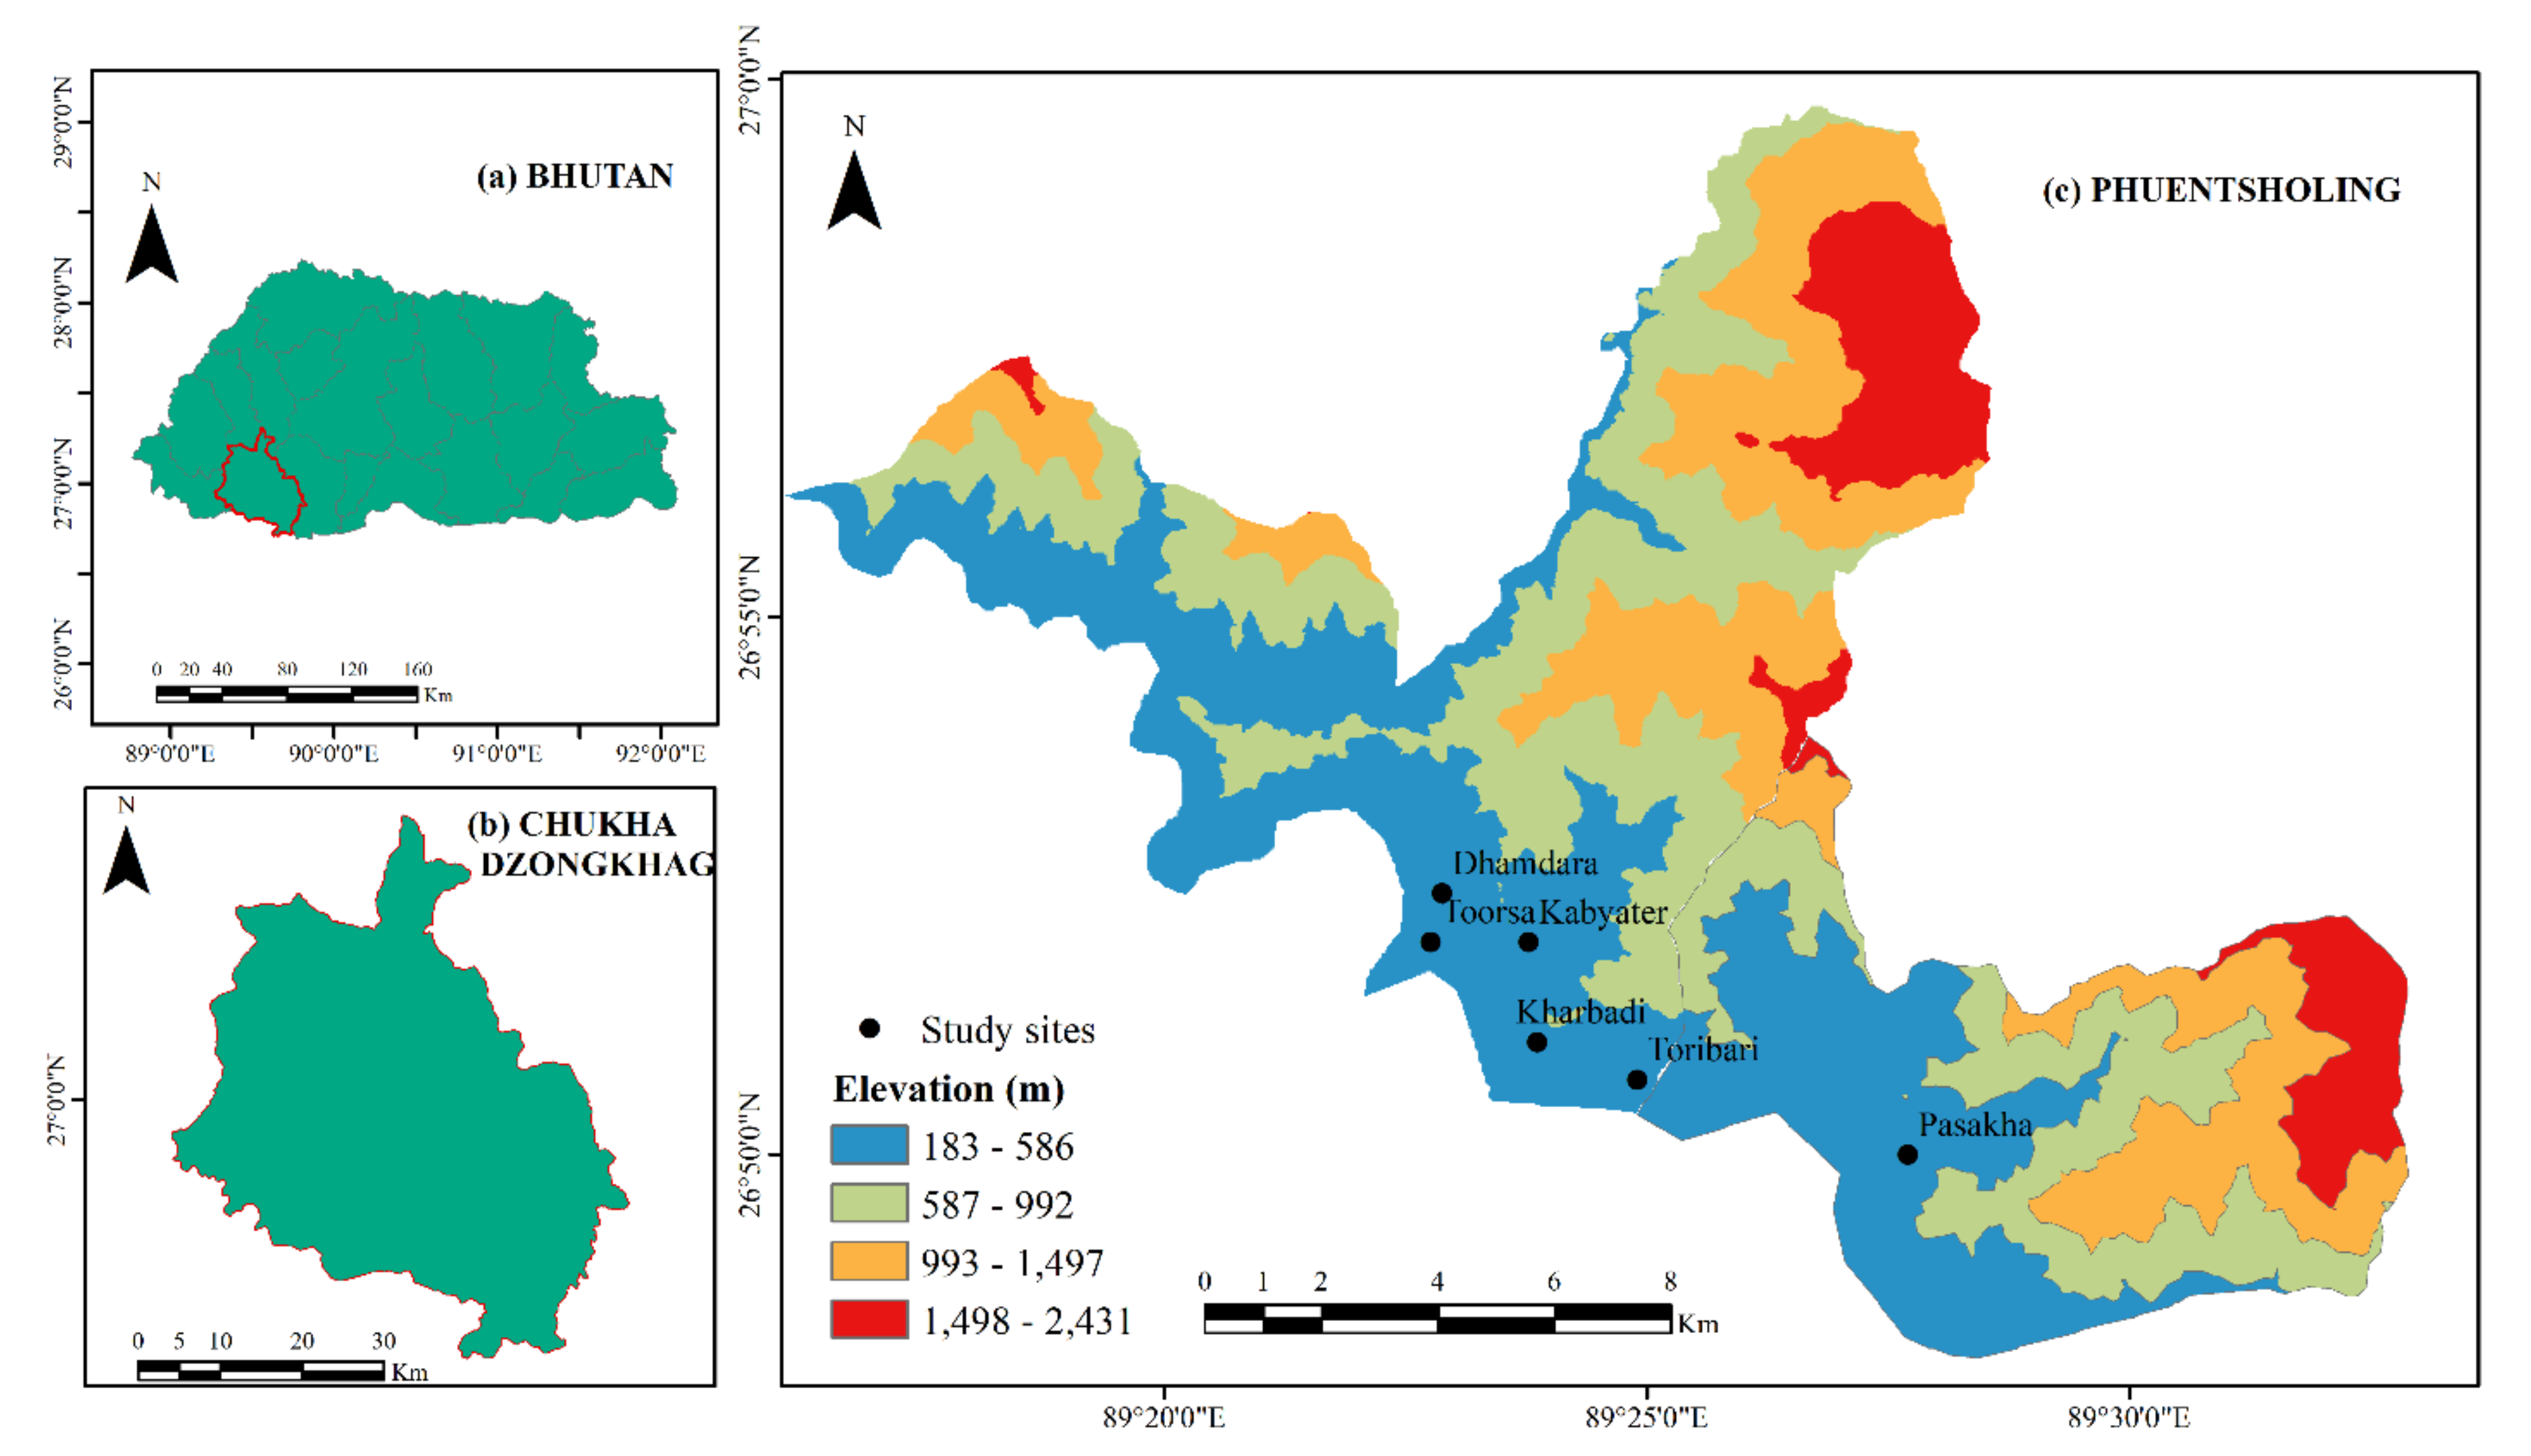
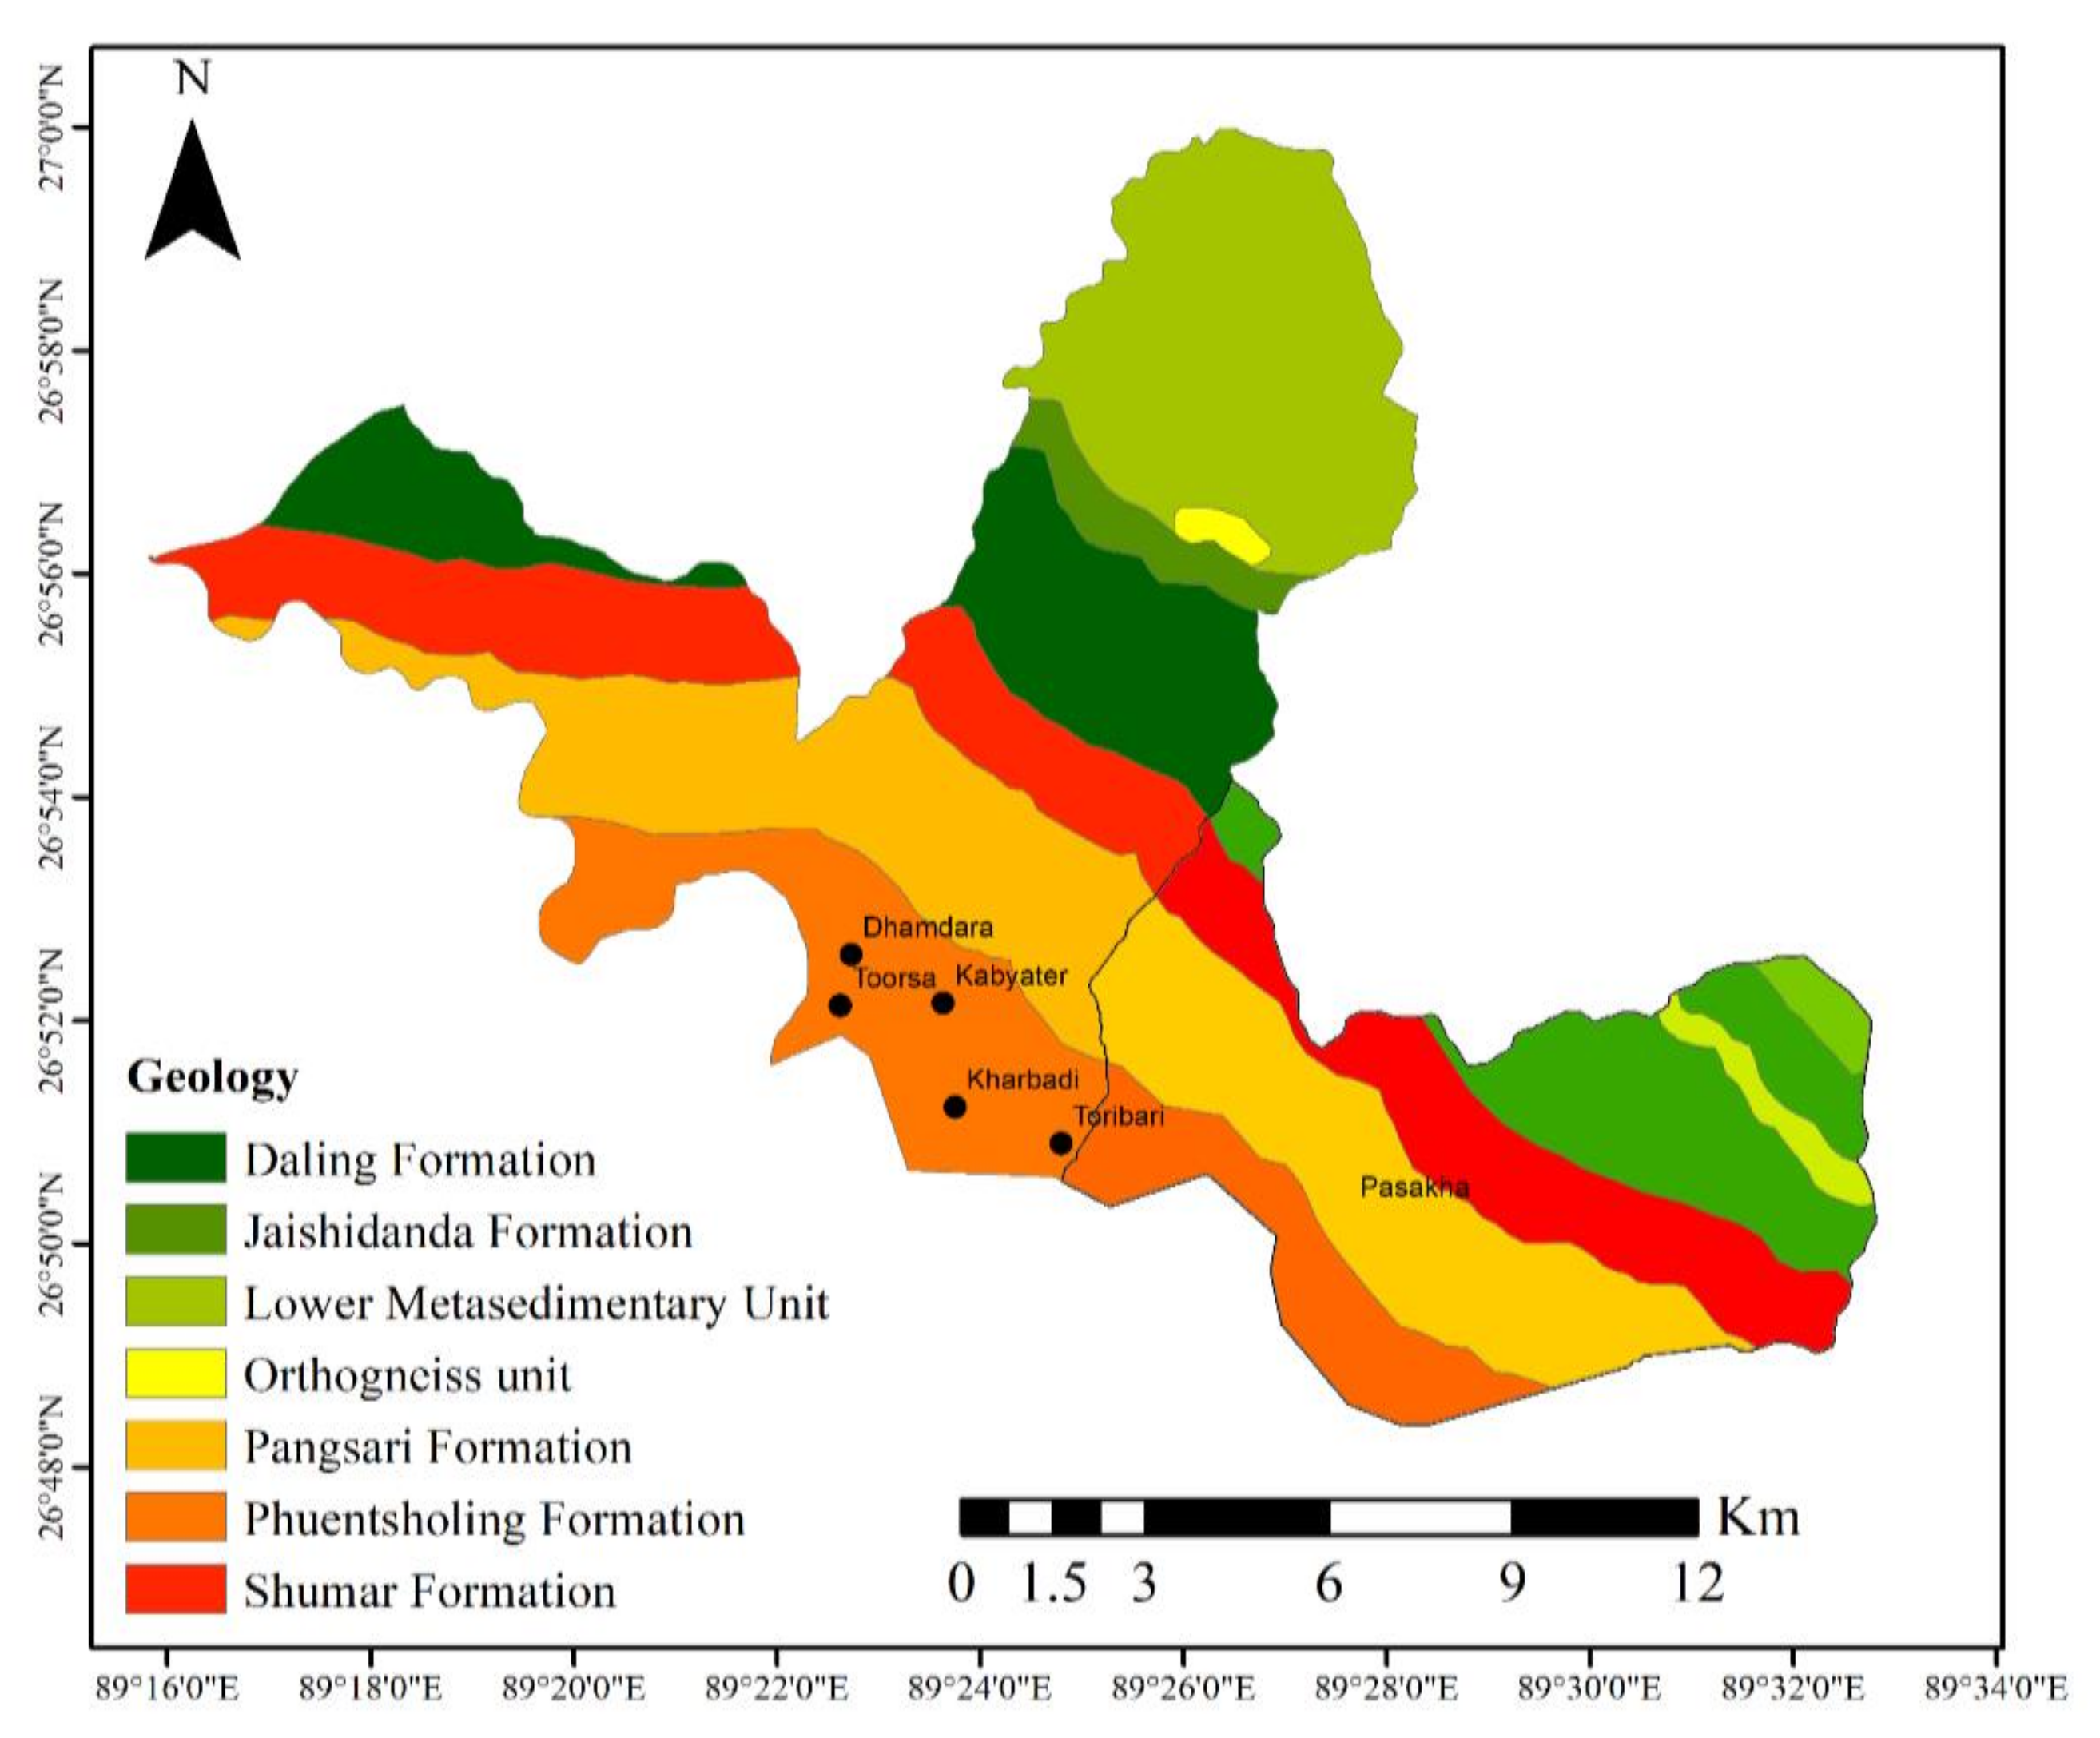
2. Study Area
3. Methodology
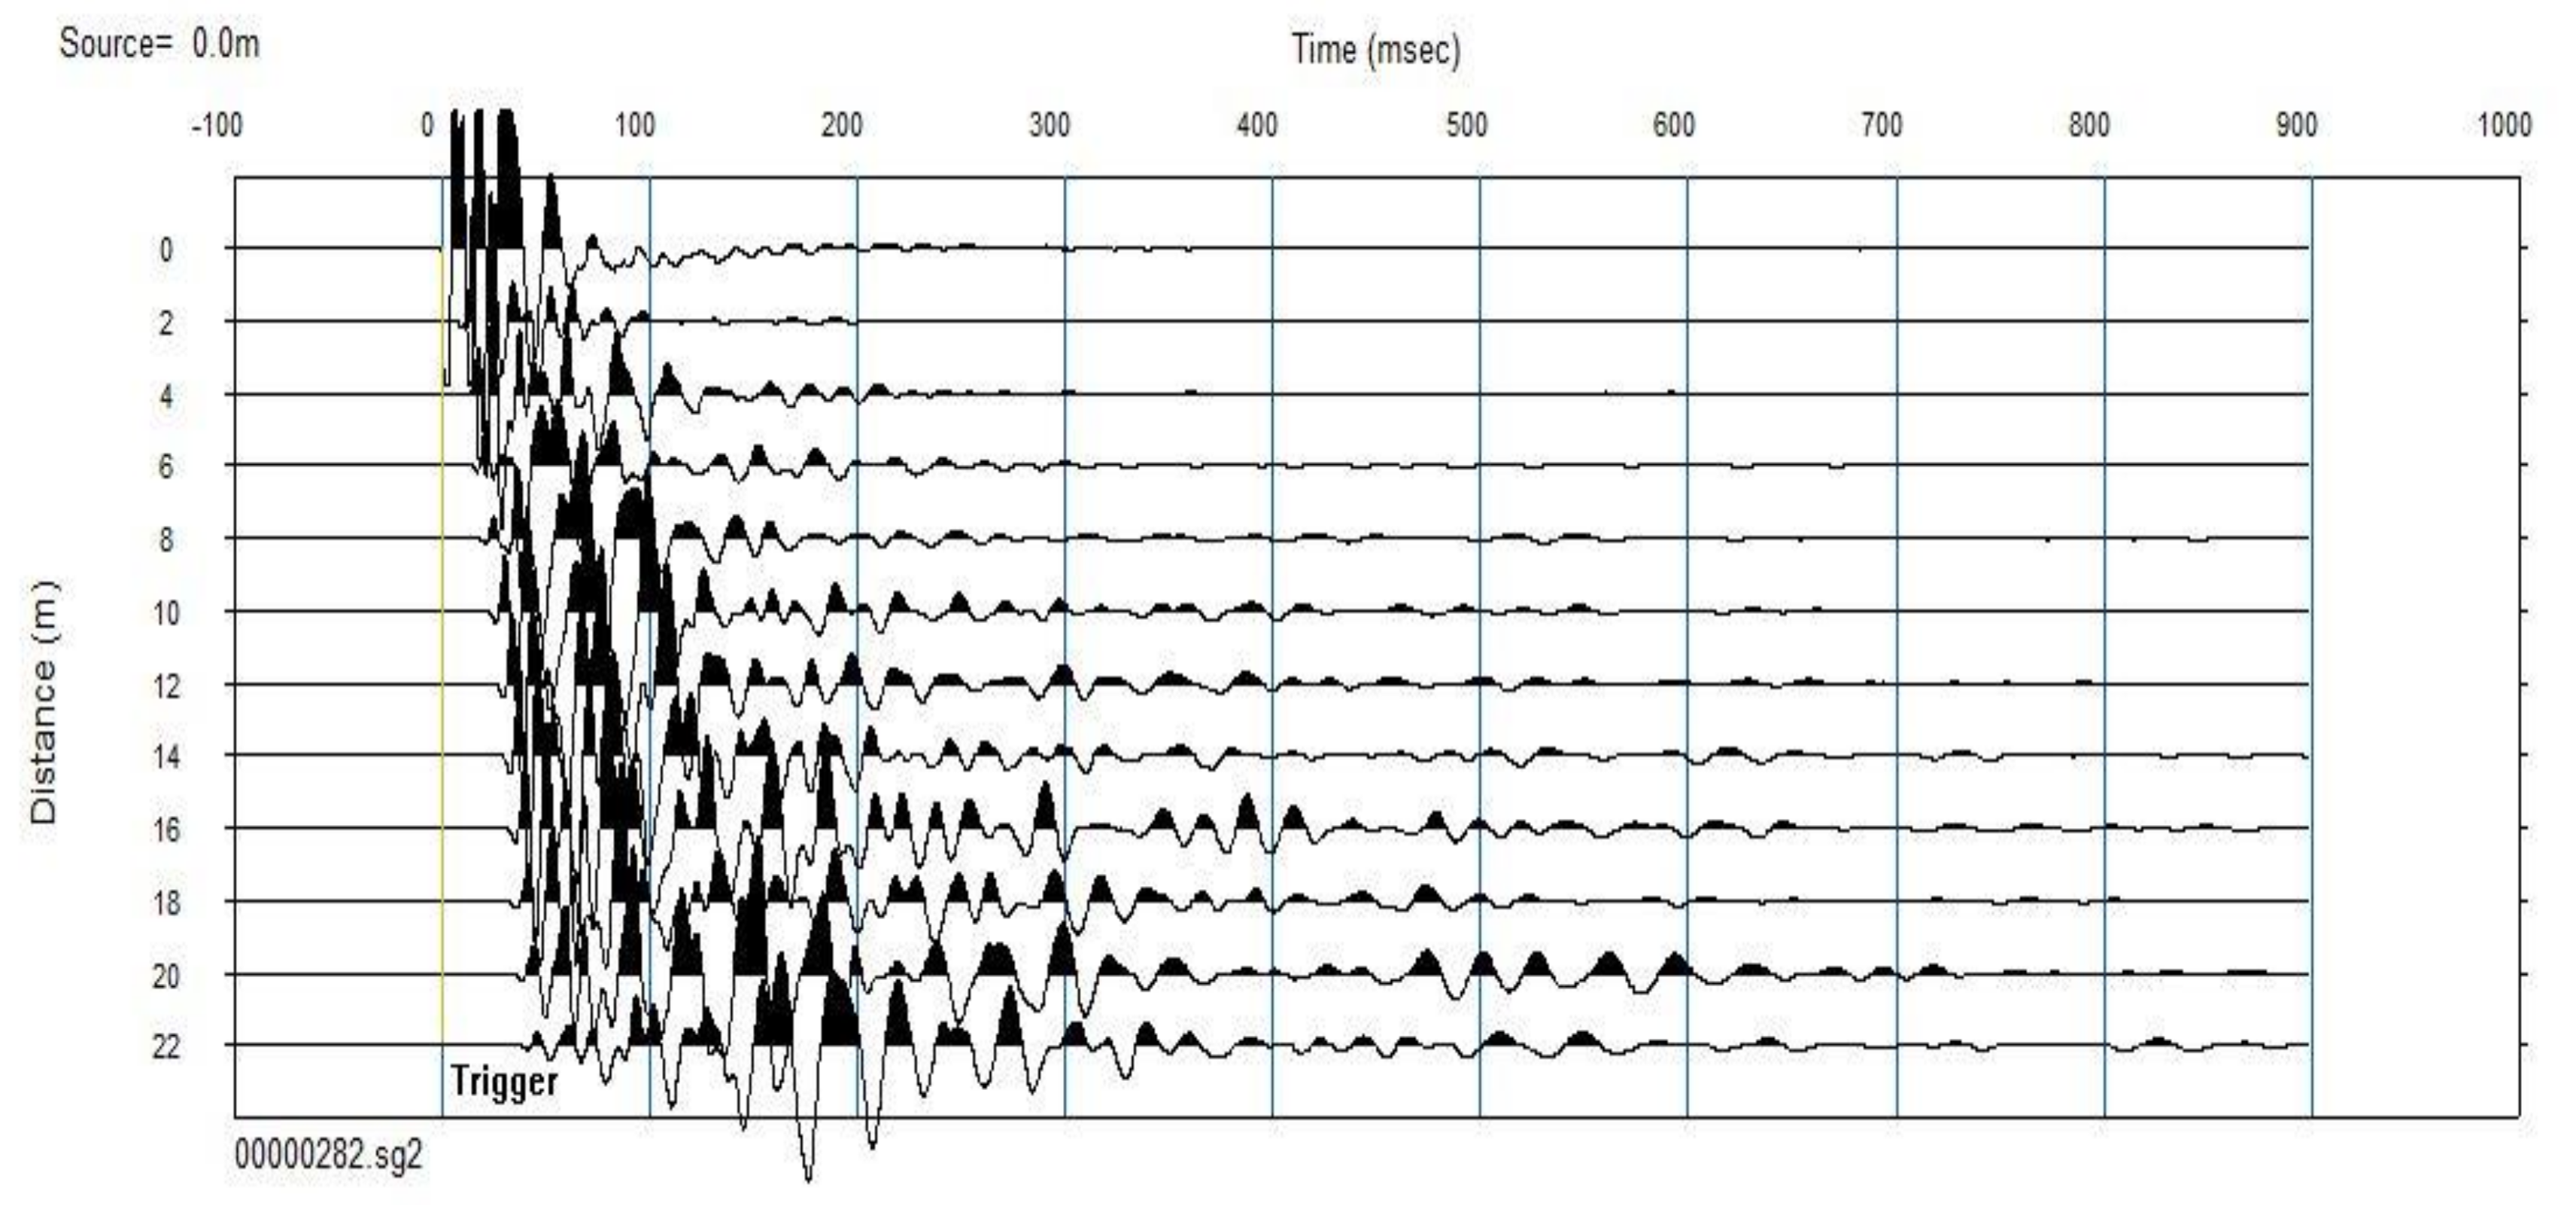
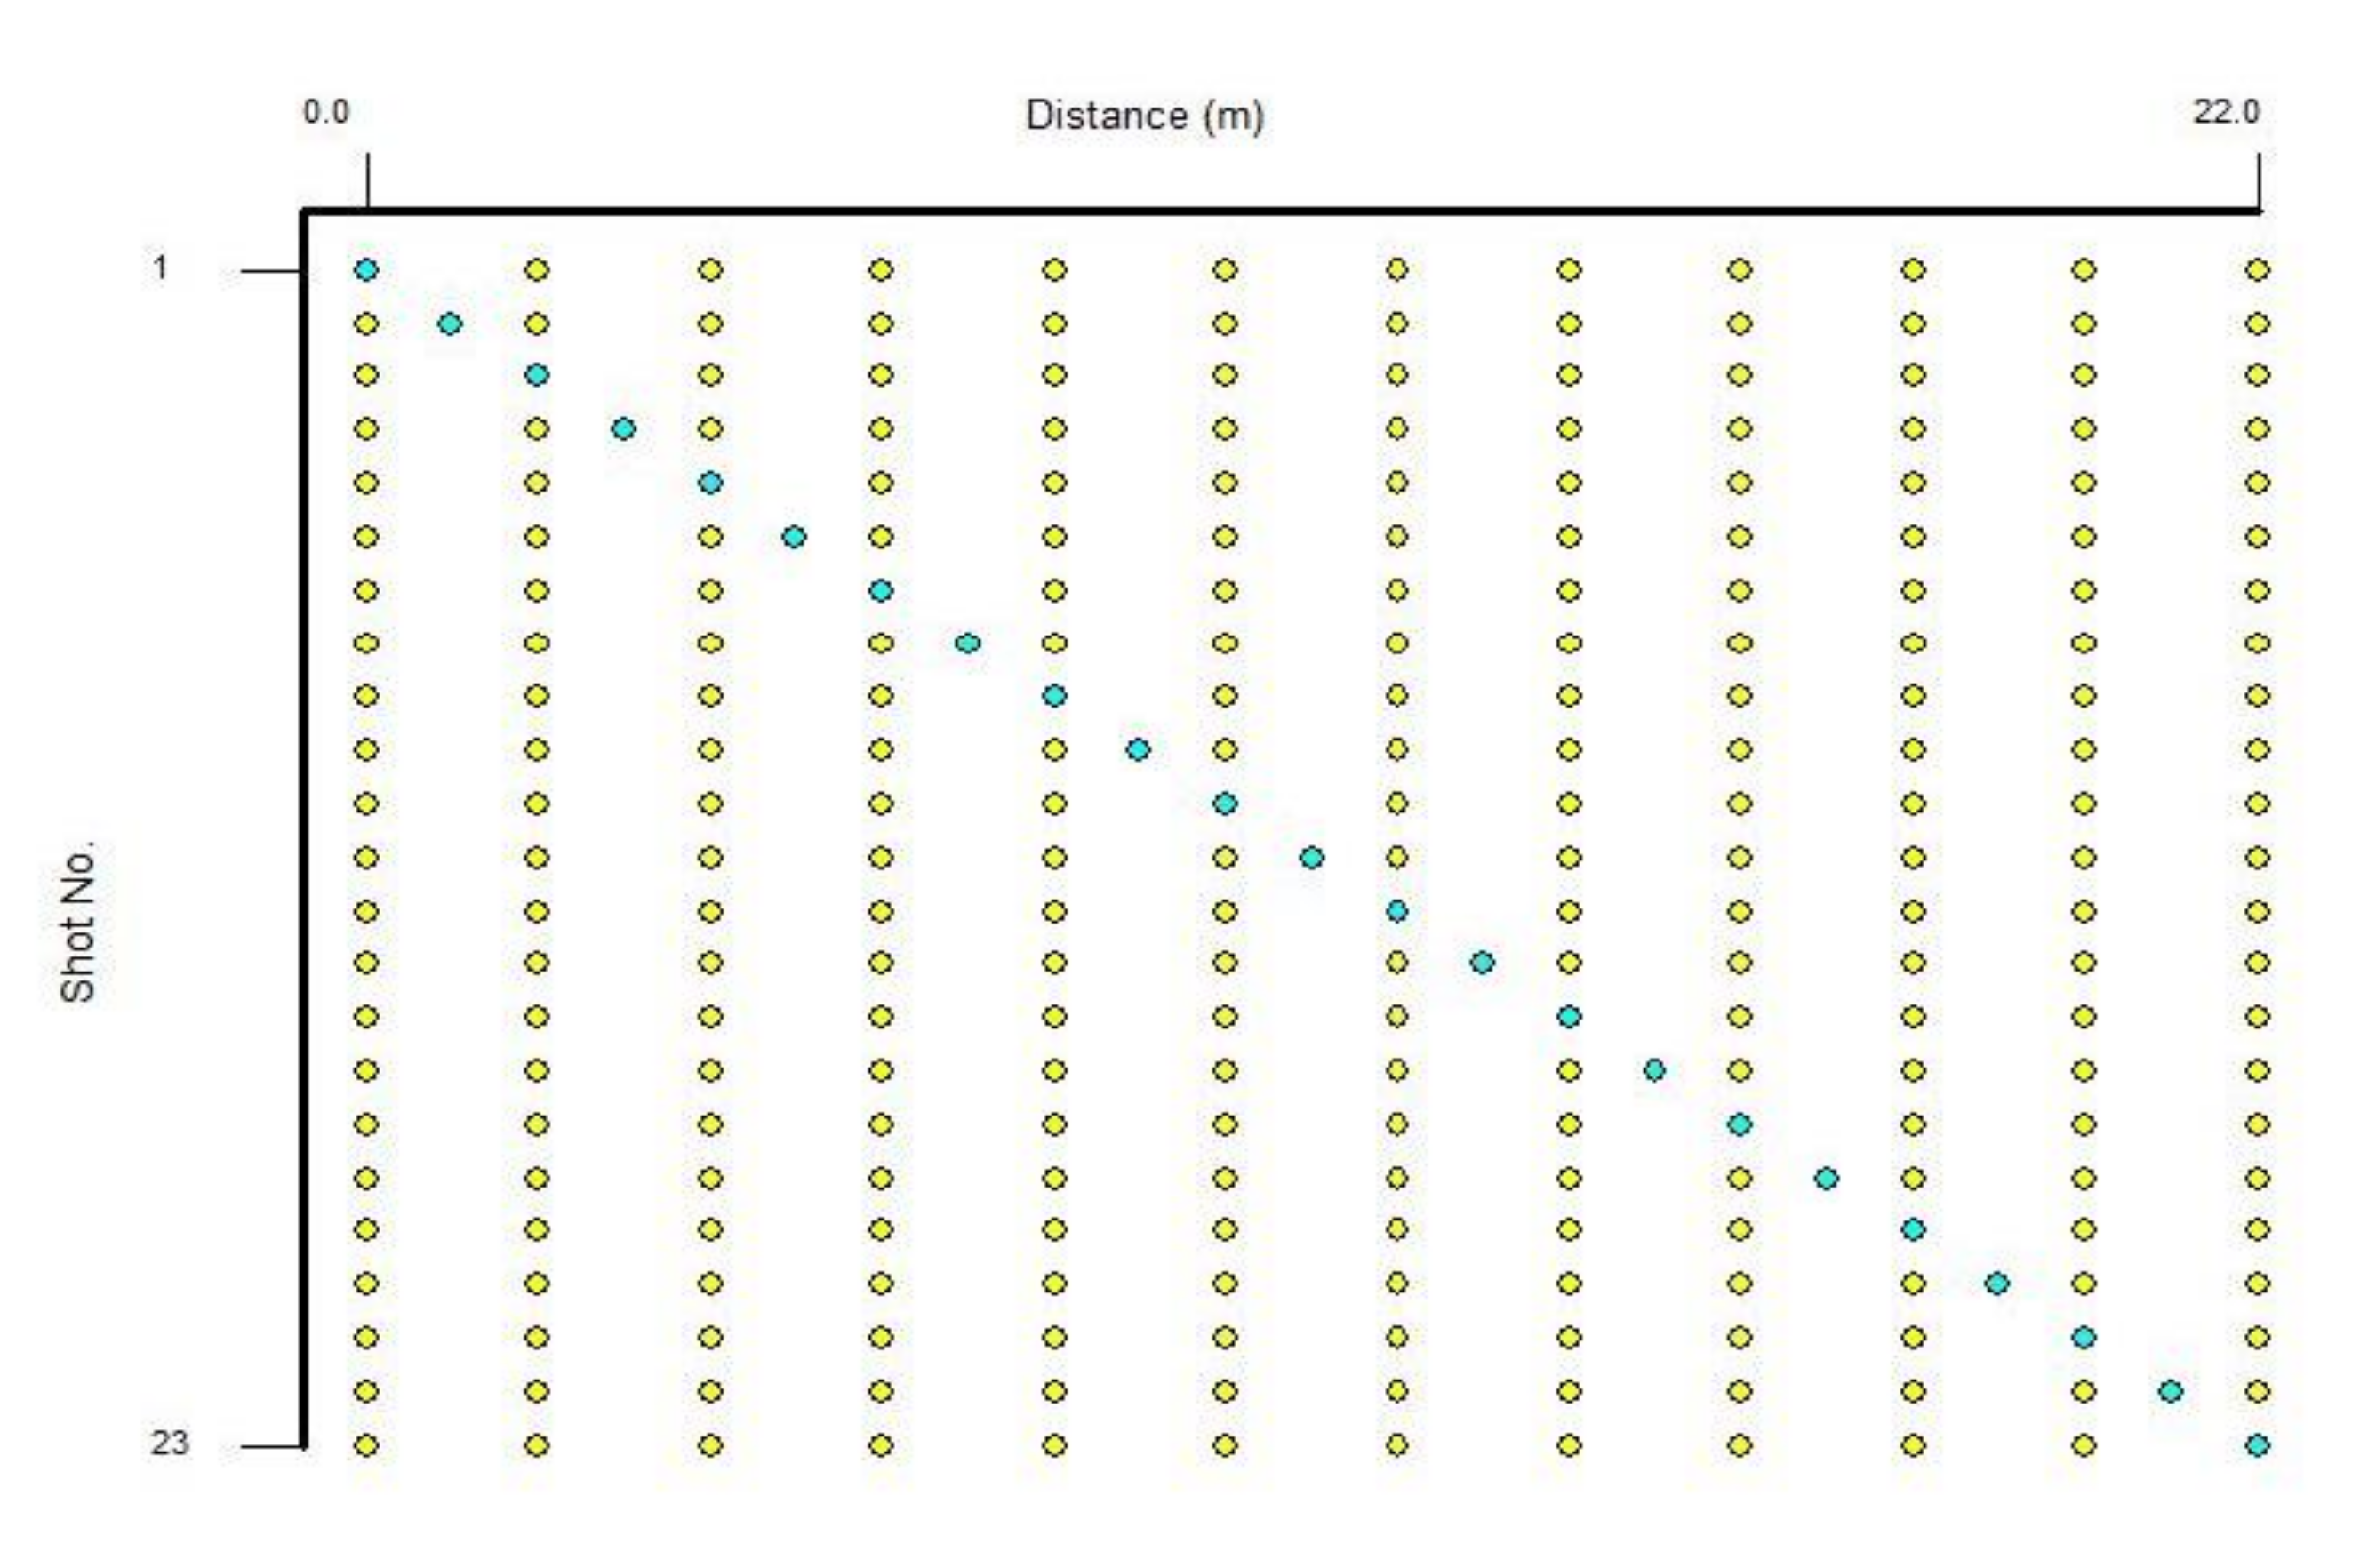
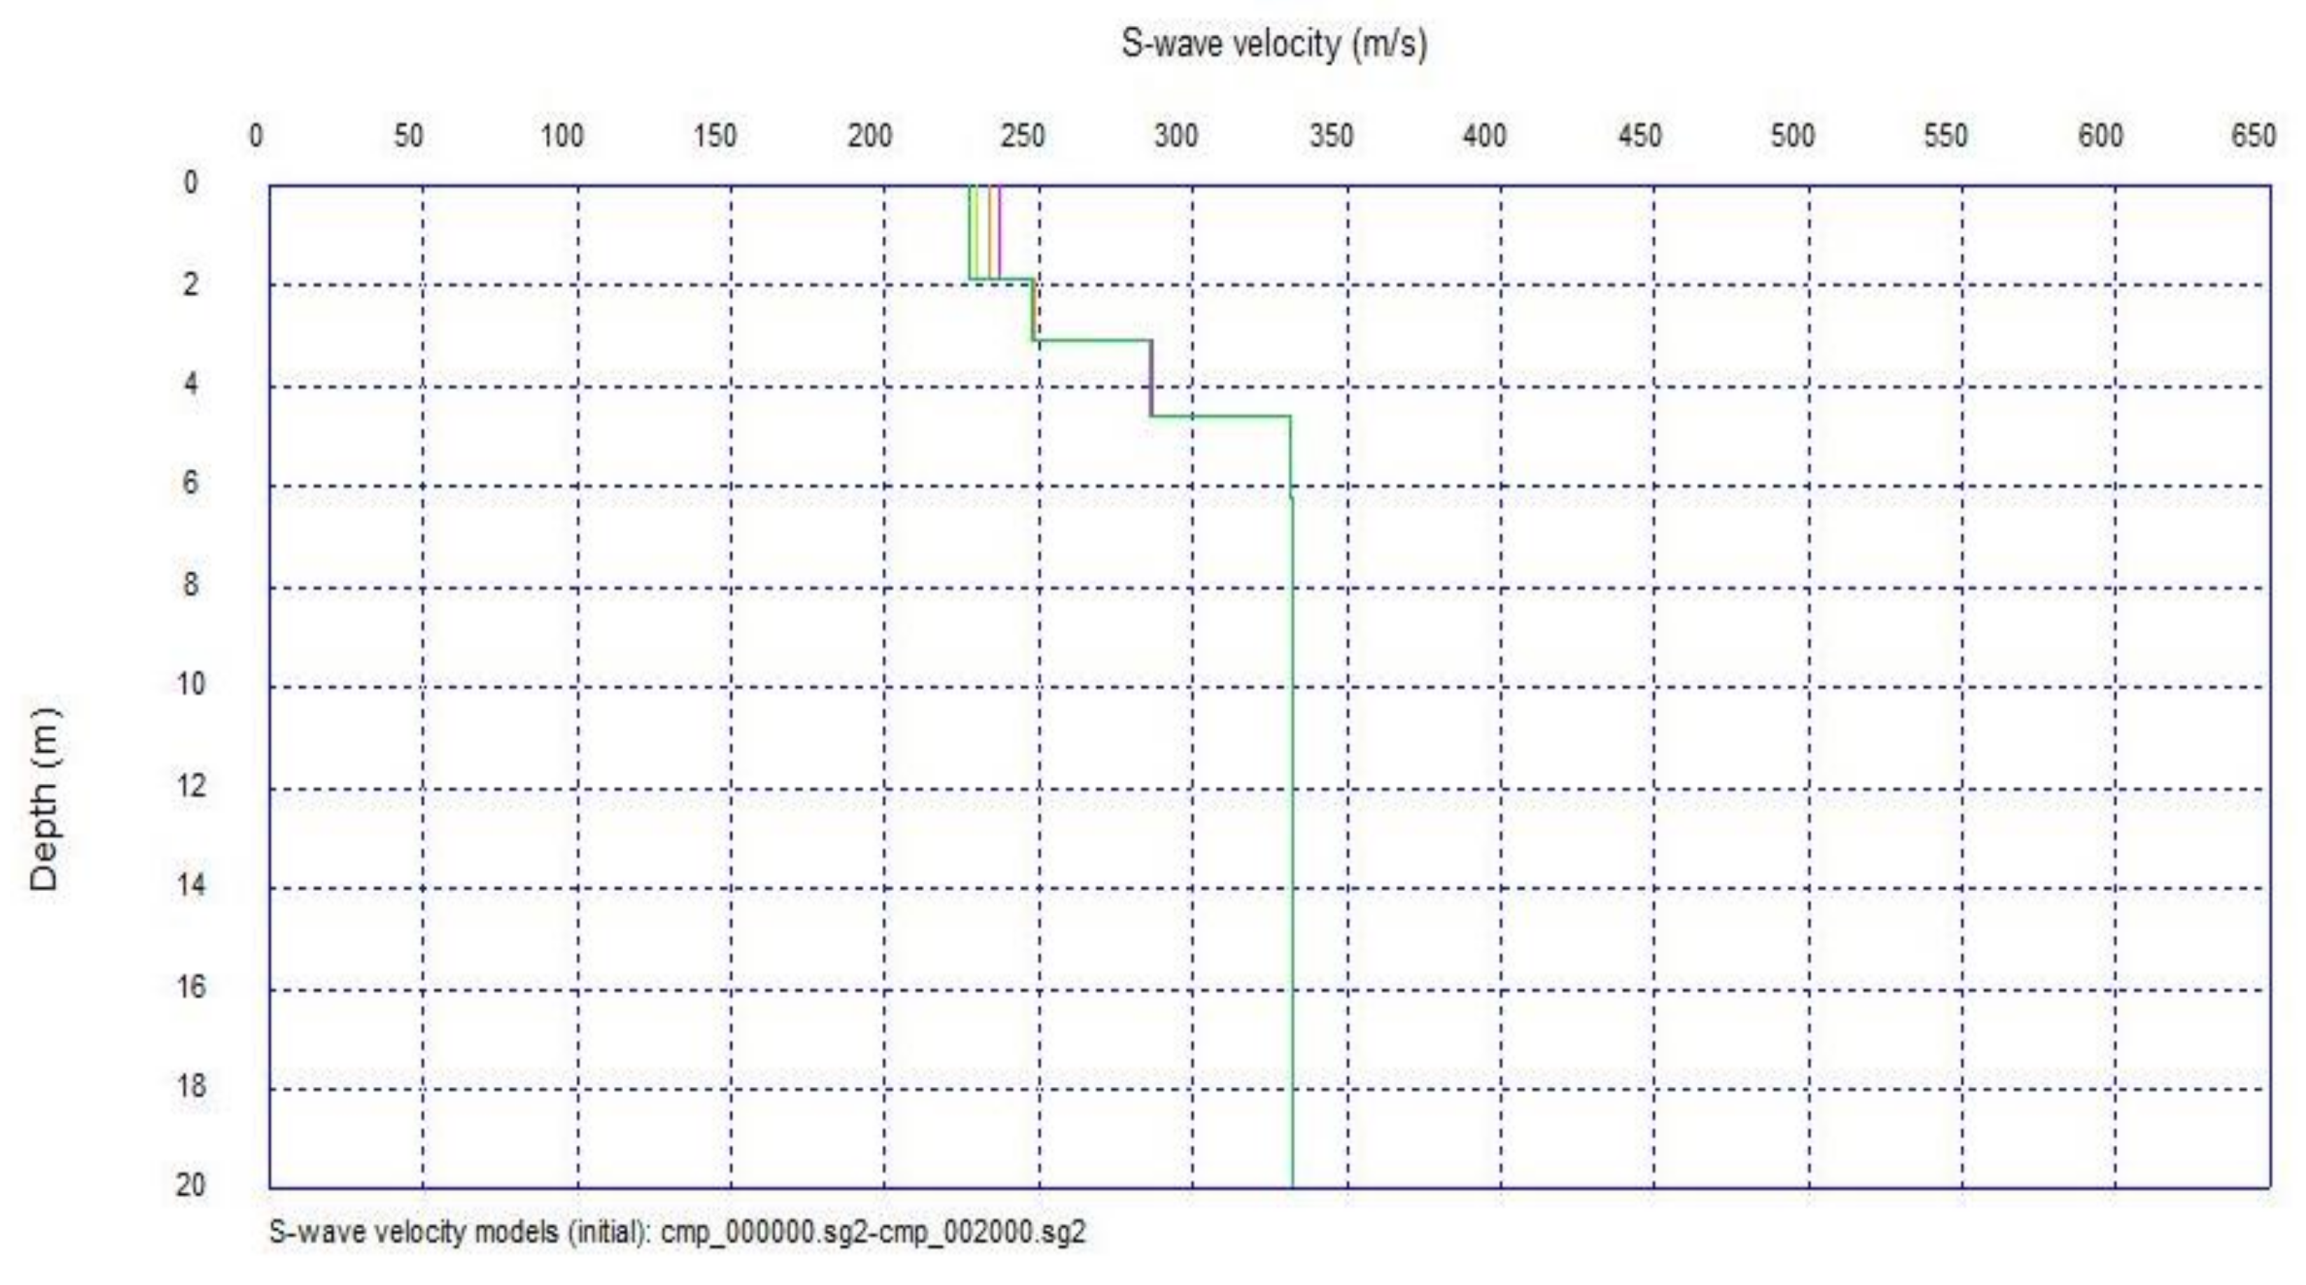
3.1. Geophysical Site Exploration
3.2. Ground Response Analysis
4. Data Used
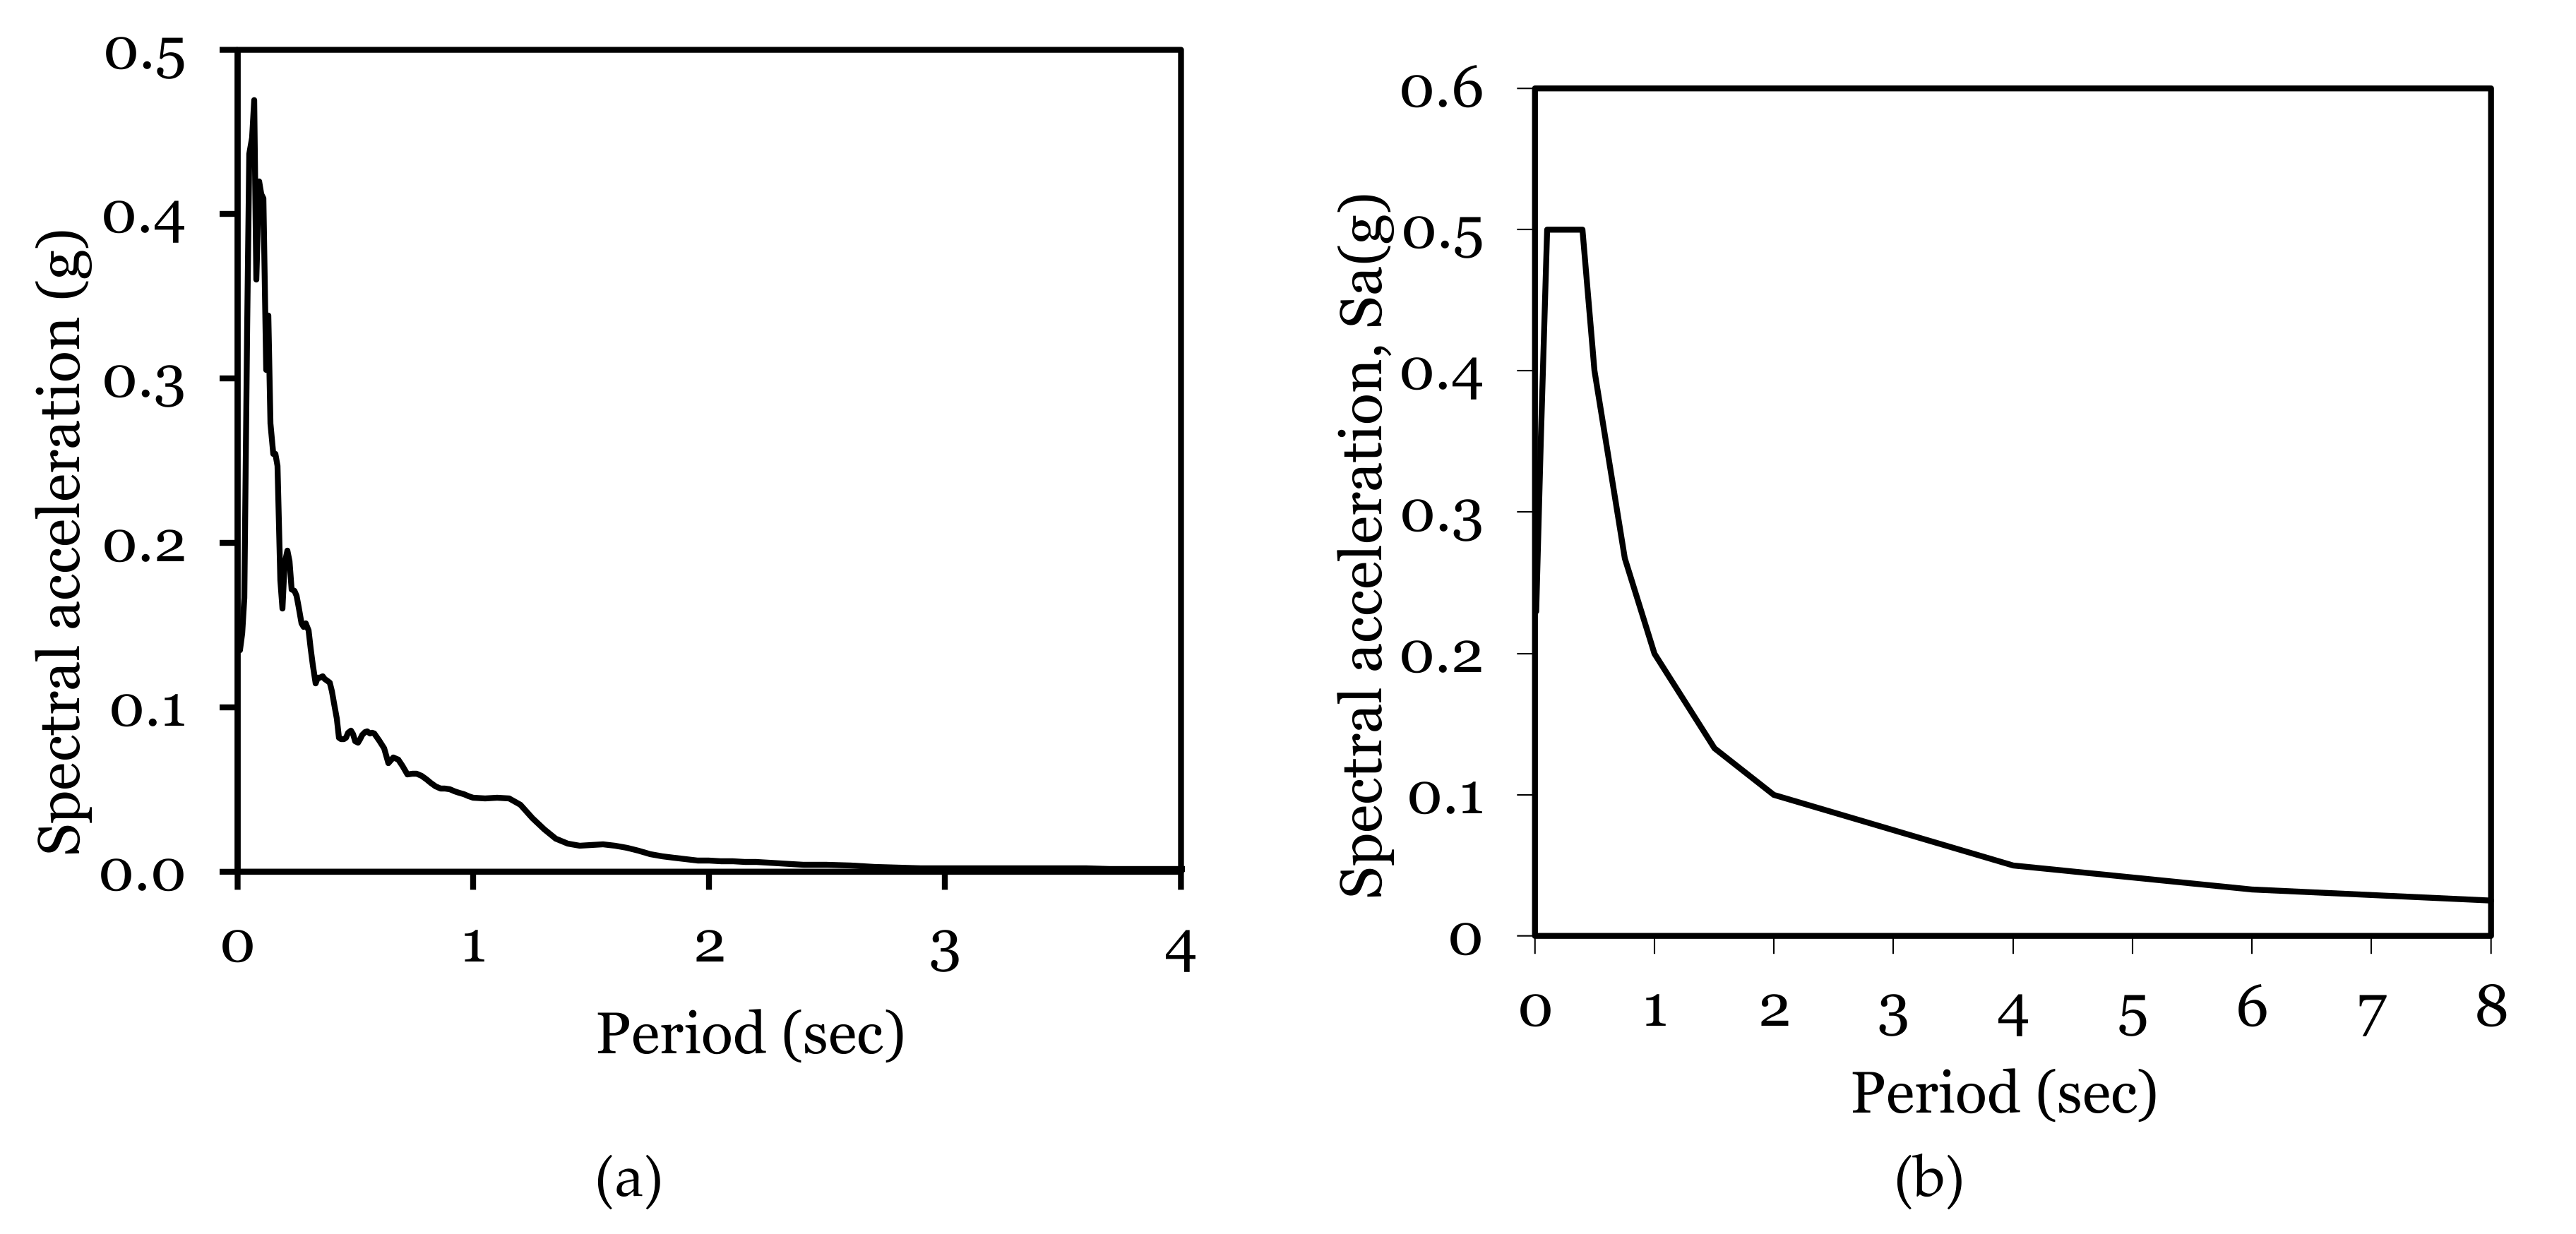
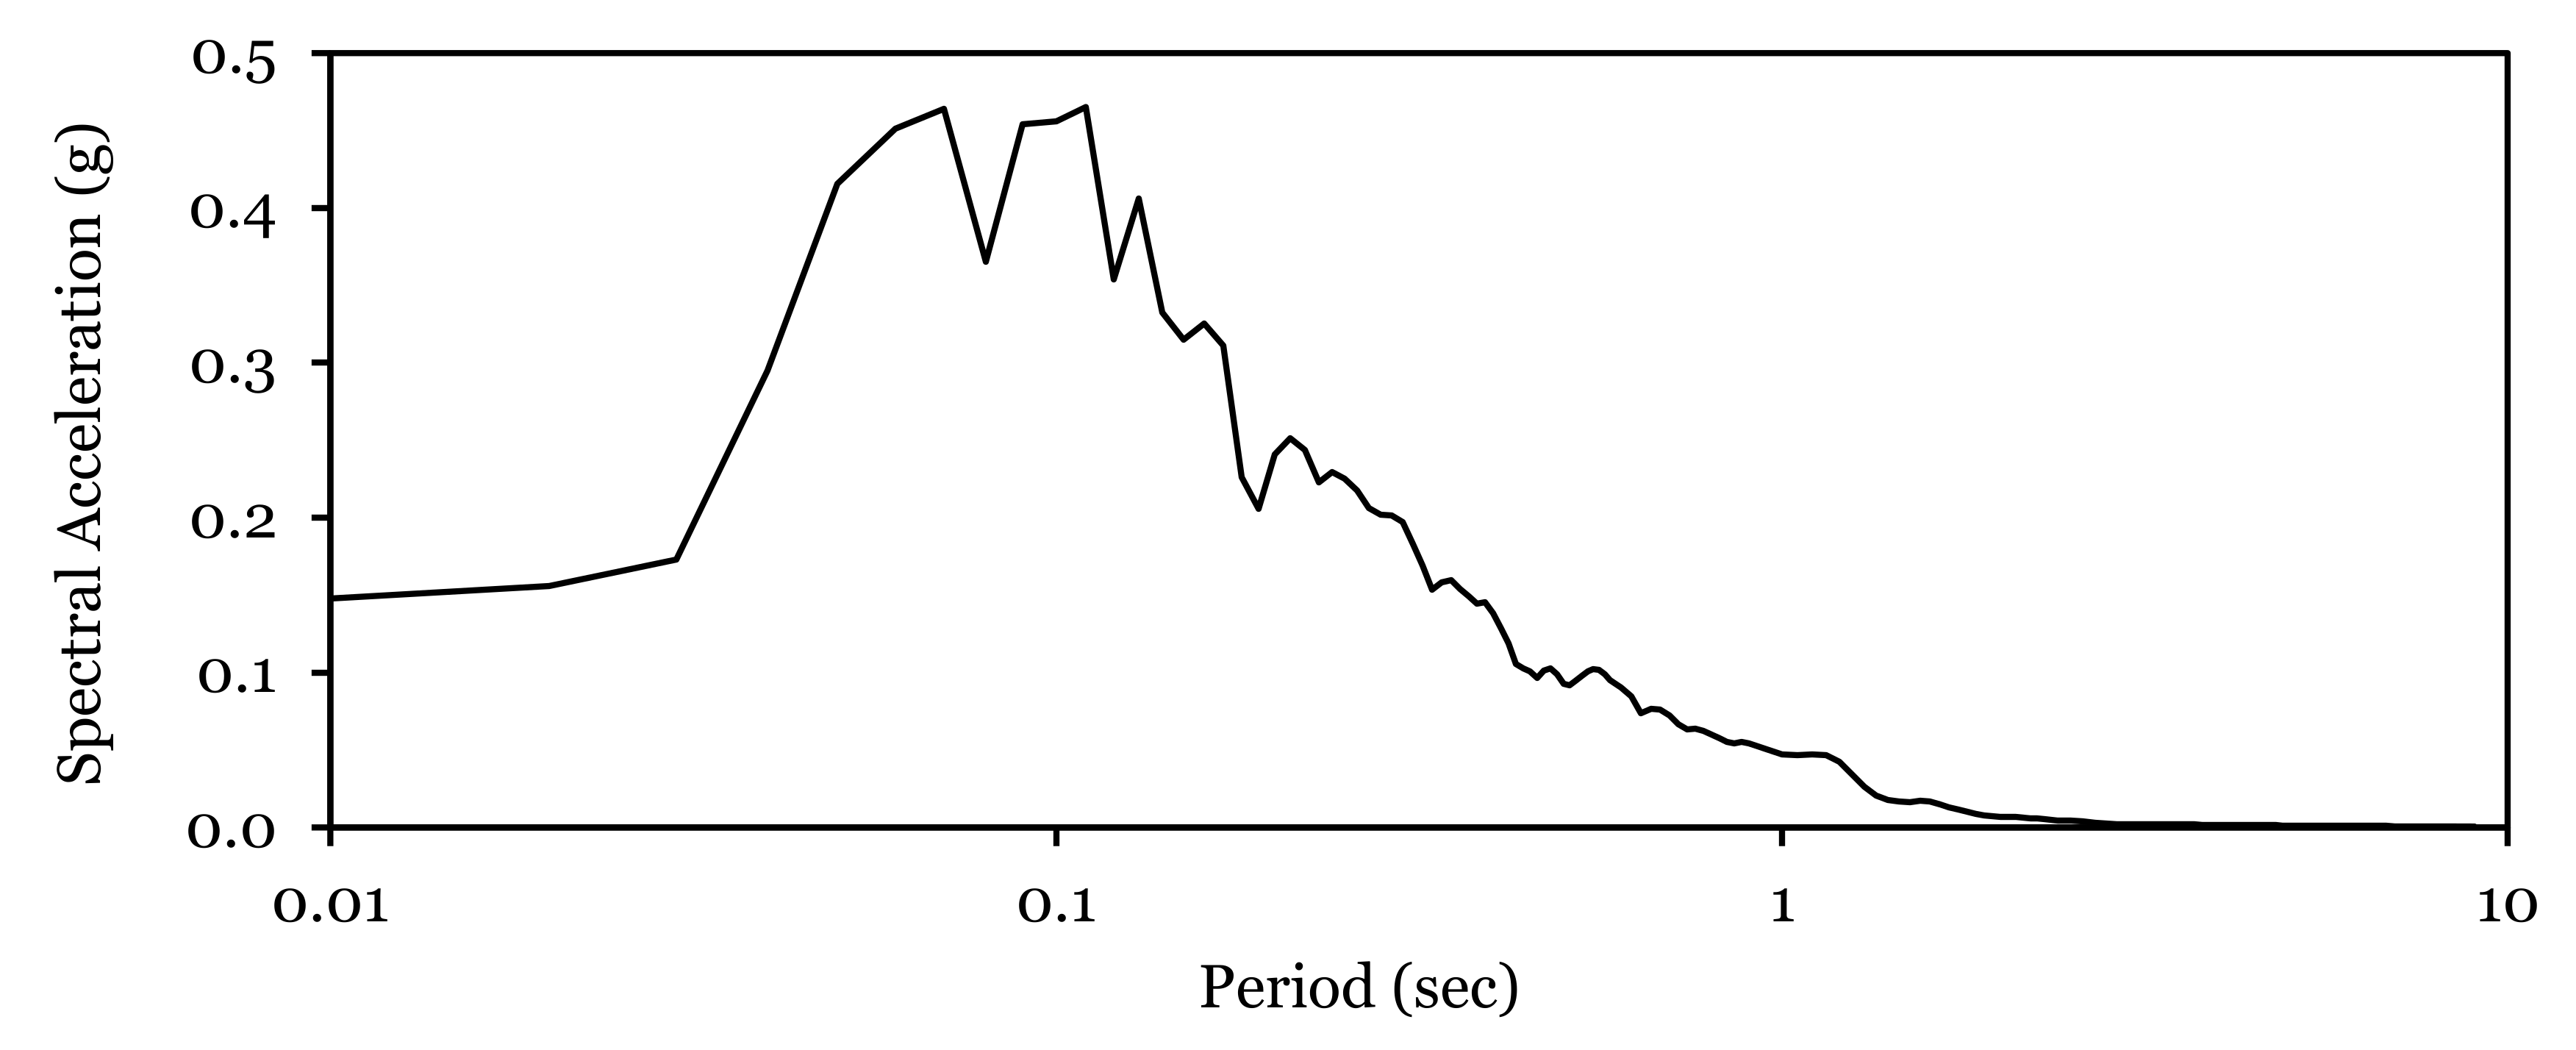
4.1. Input Motion and Bedrock
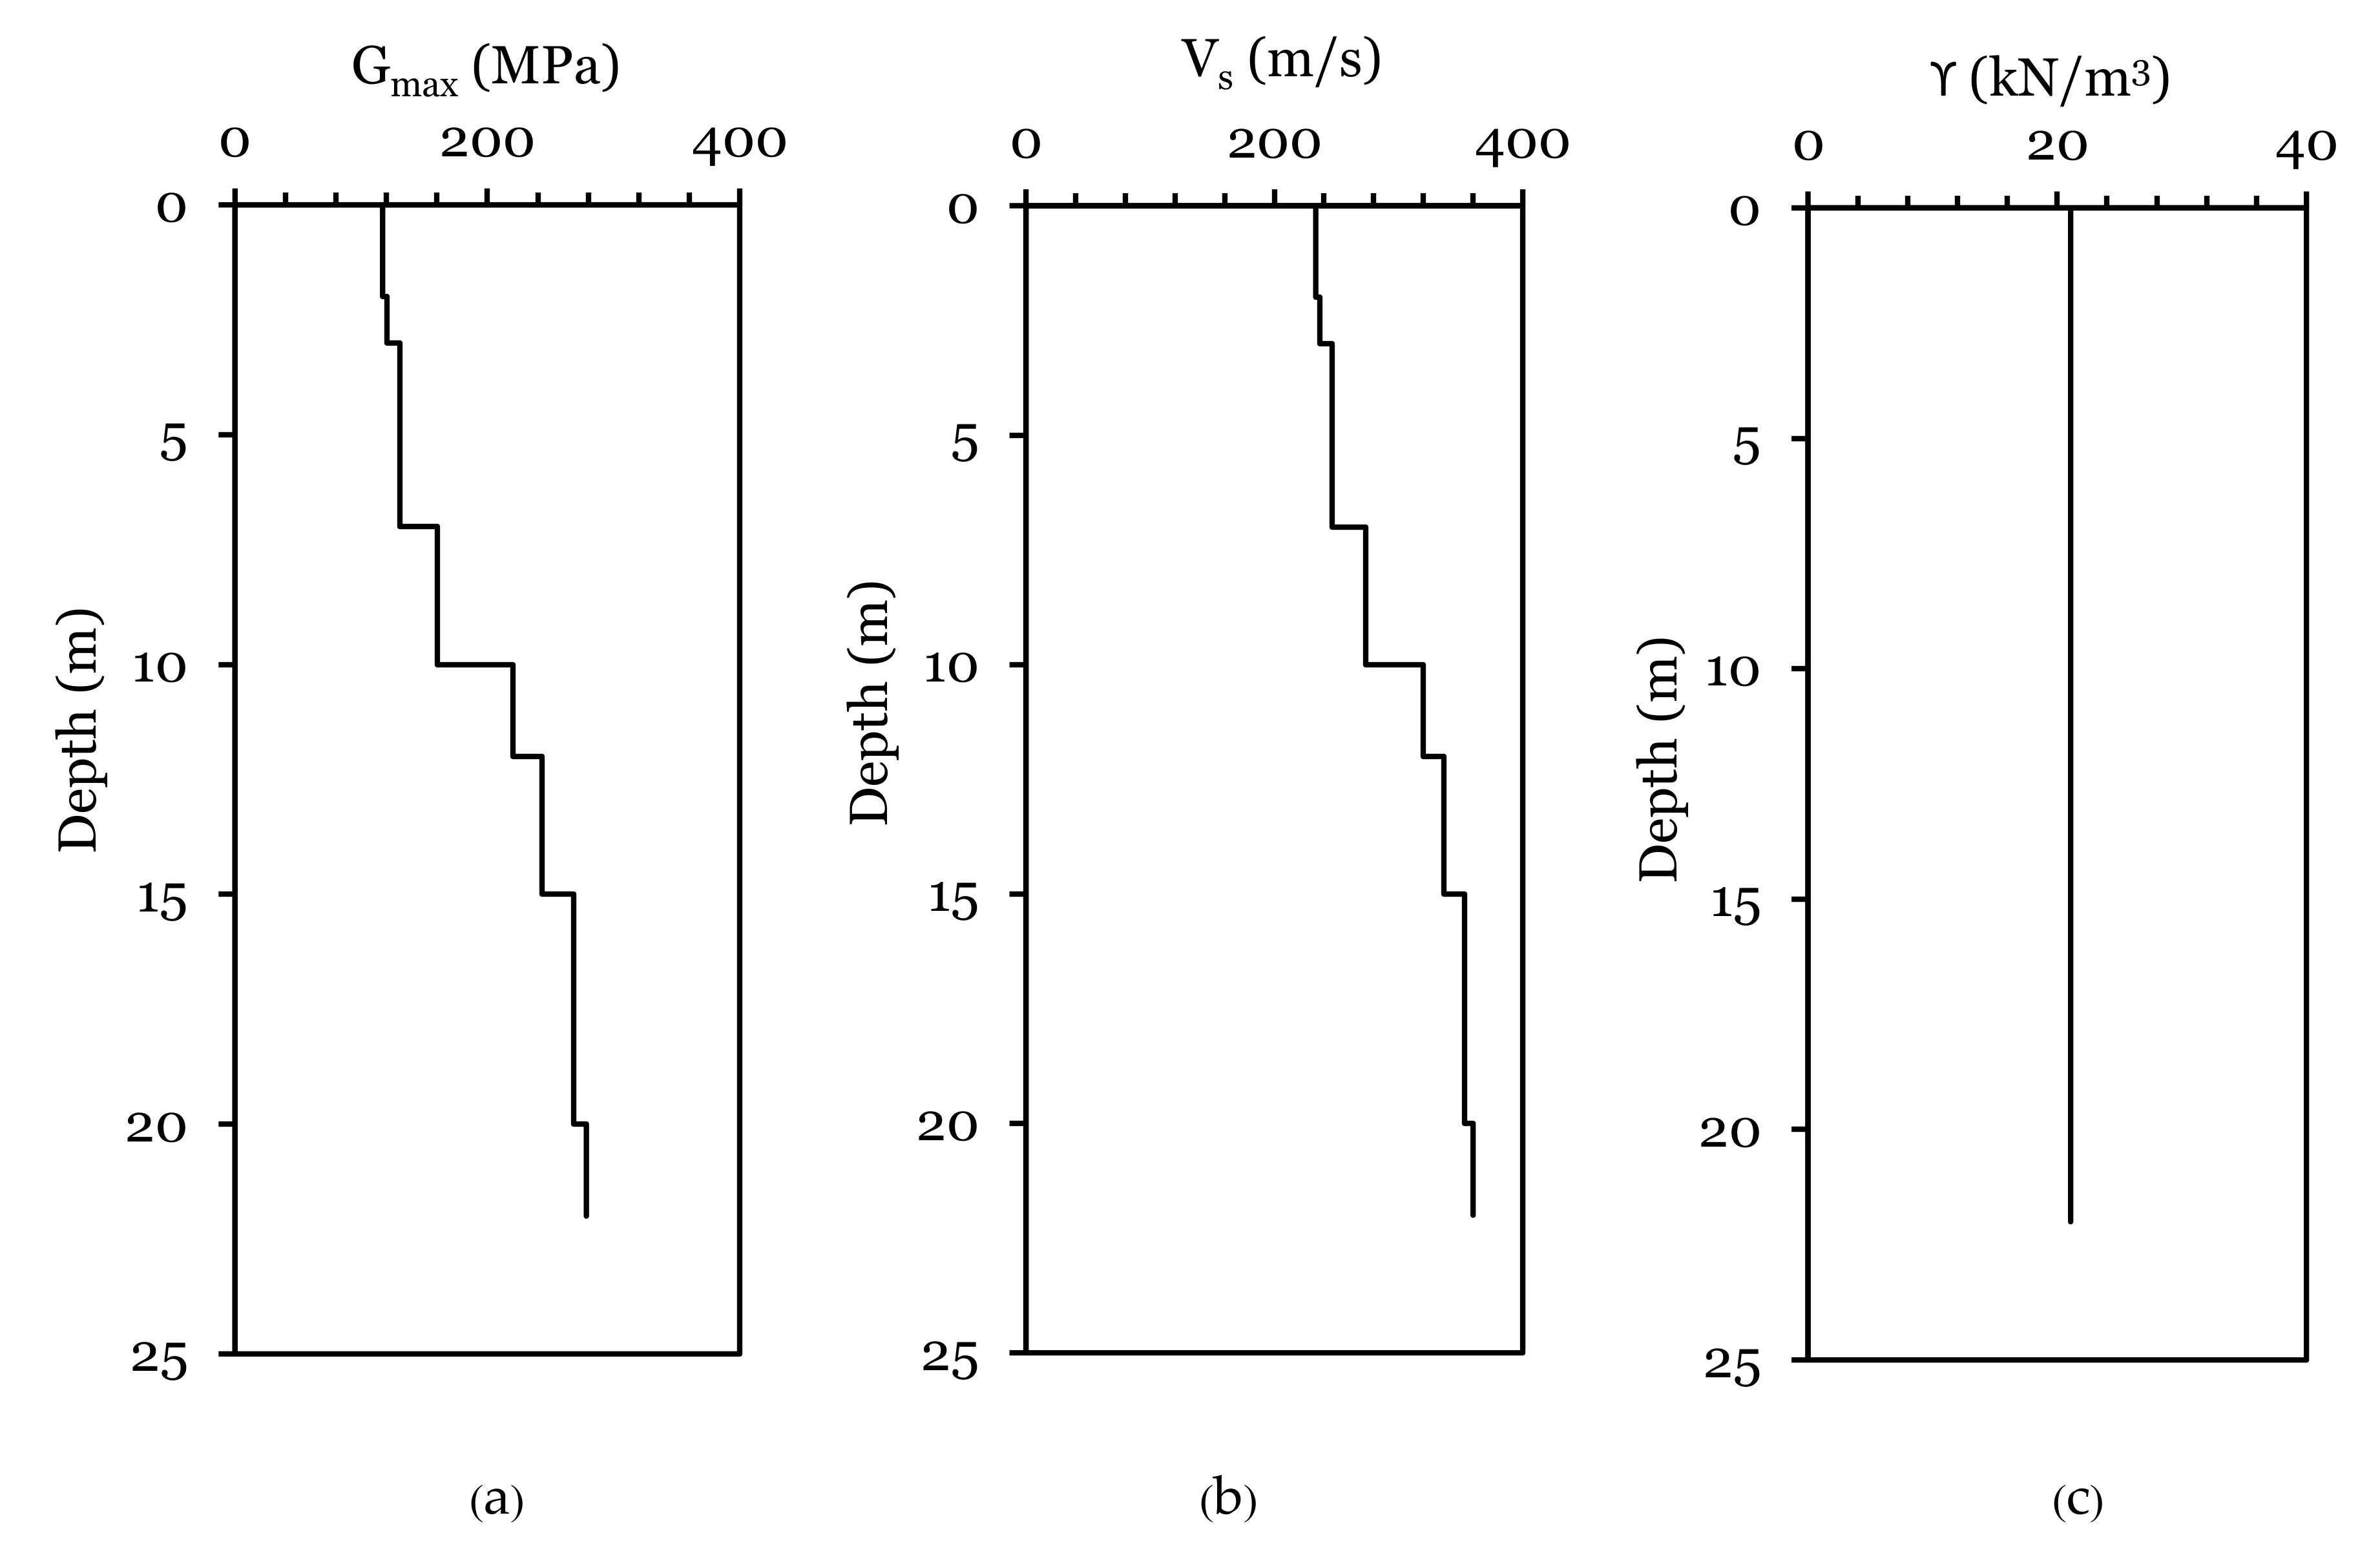
4.2. Soil Properties
4.2.1. Static Properties
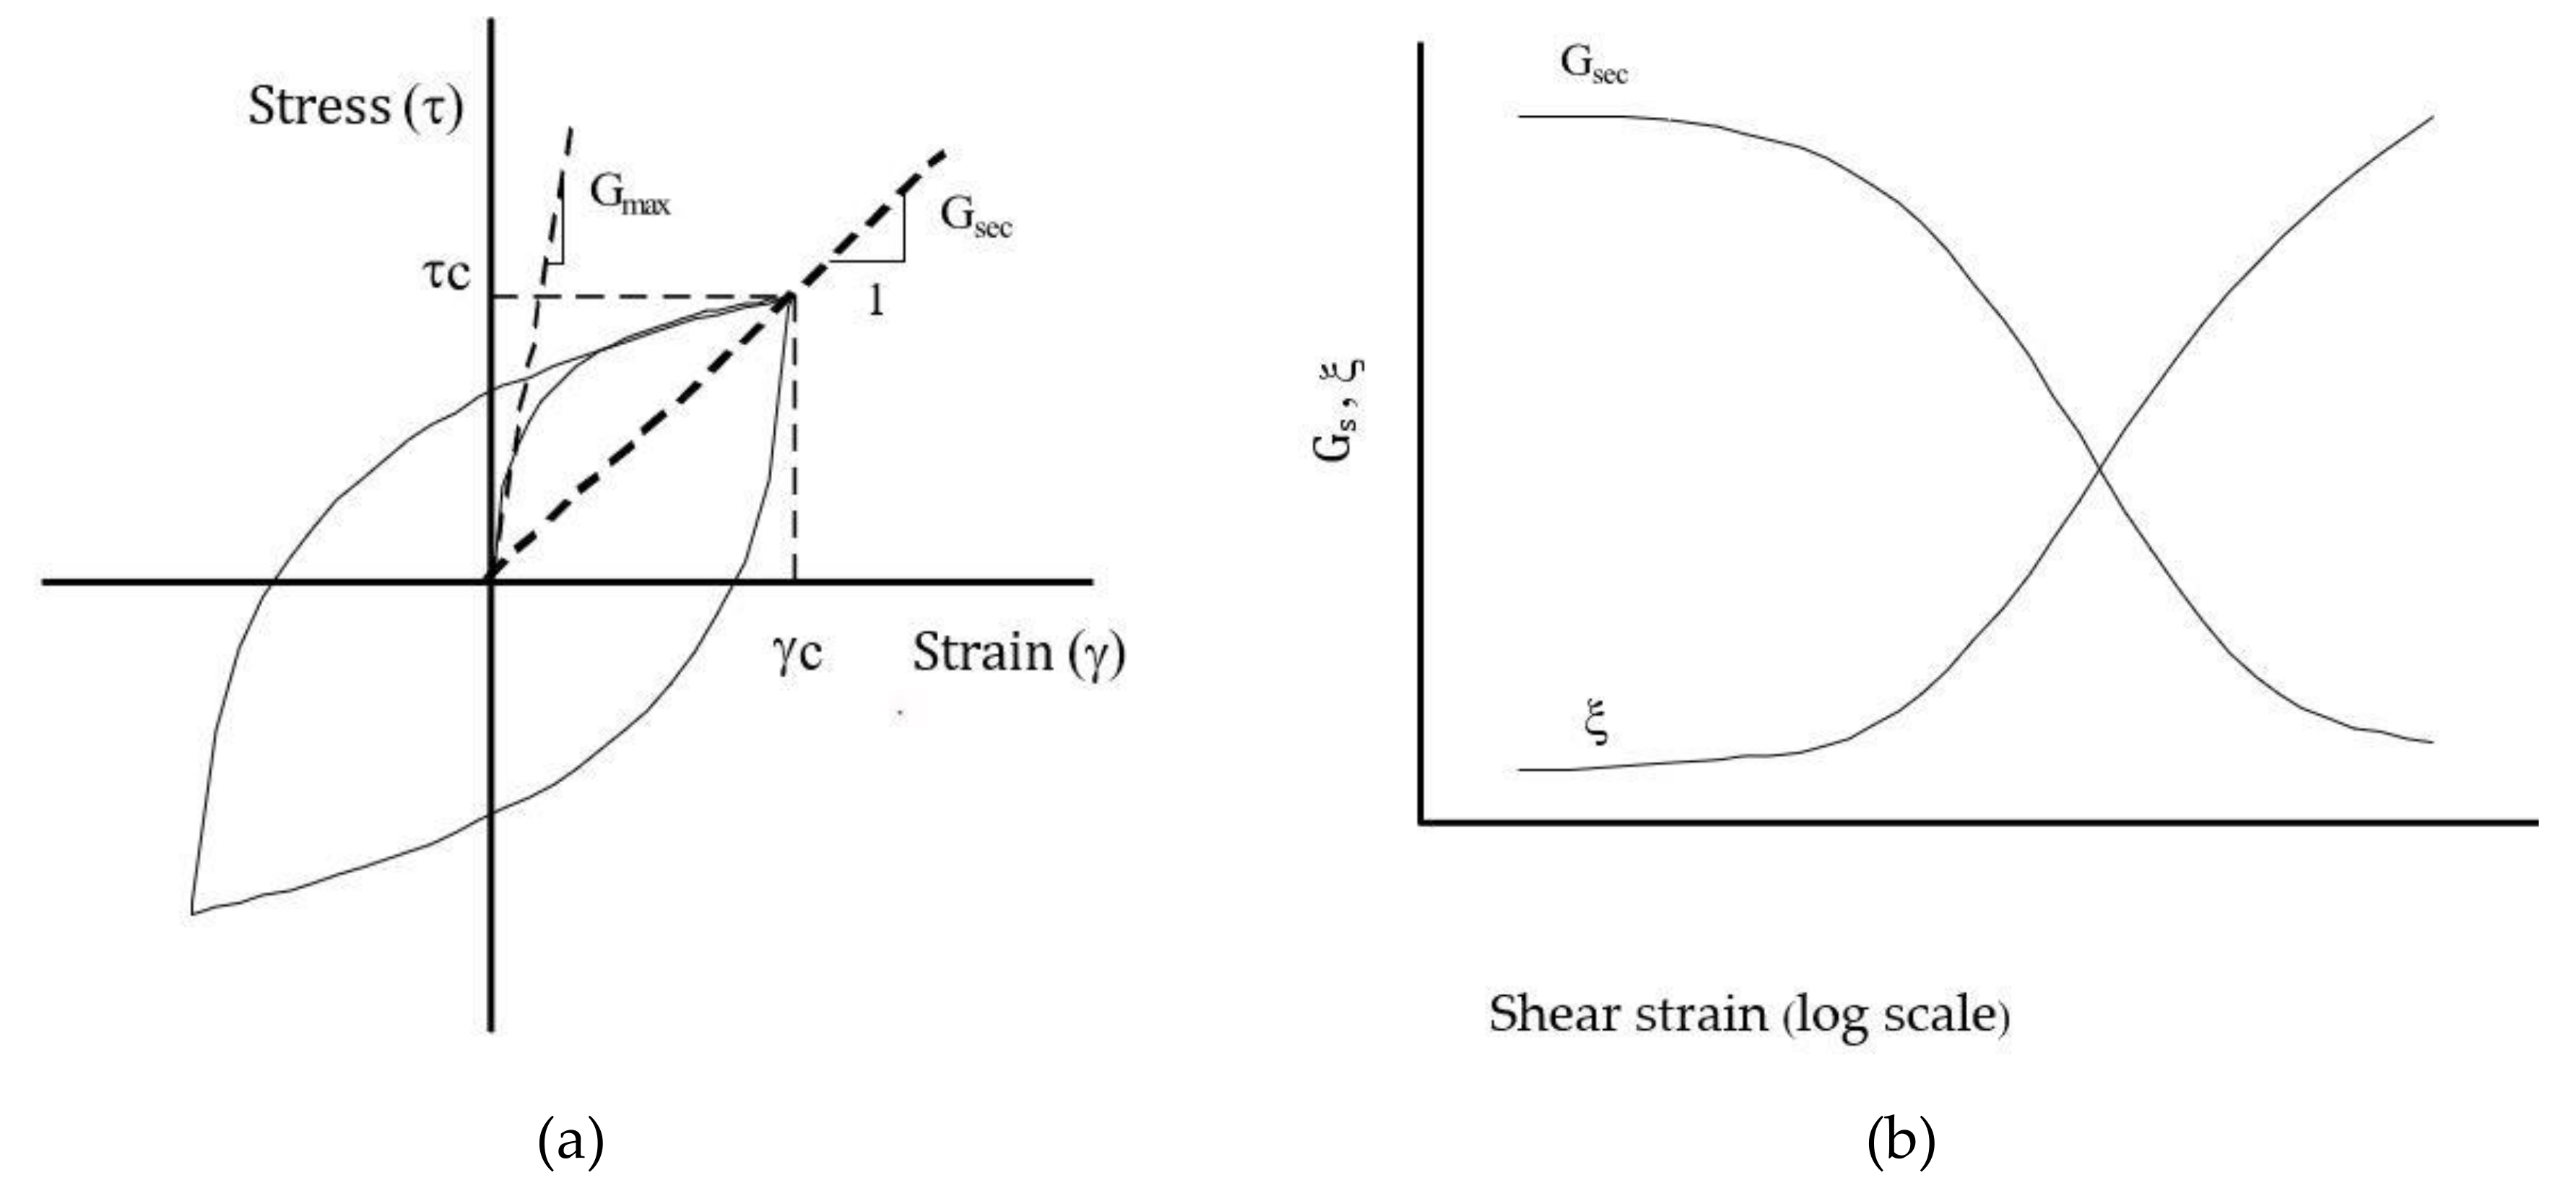
4.2.2. Dynamic Properties
5. Results and Discussion
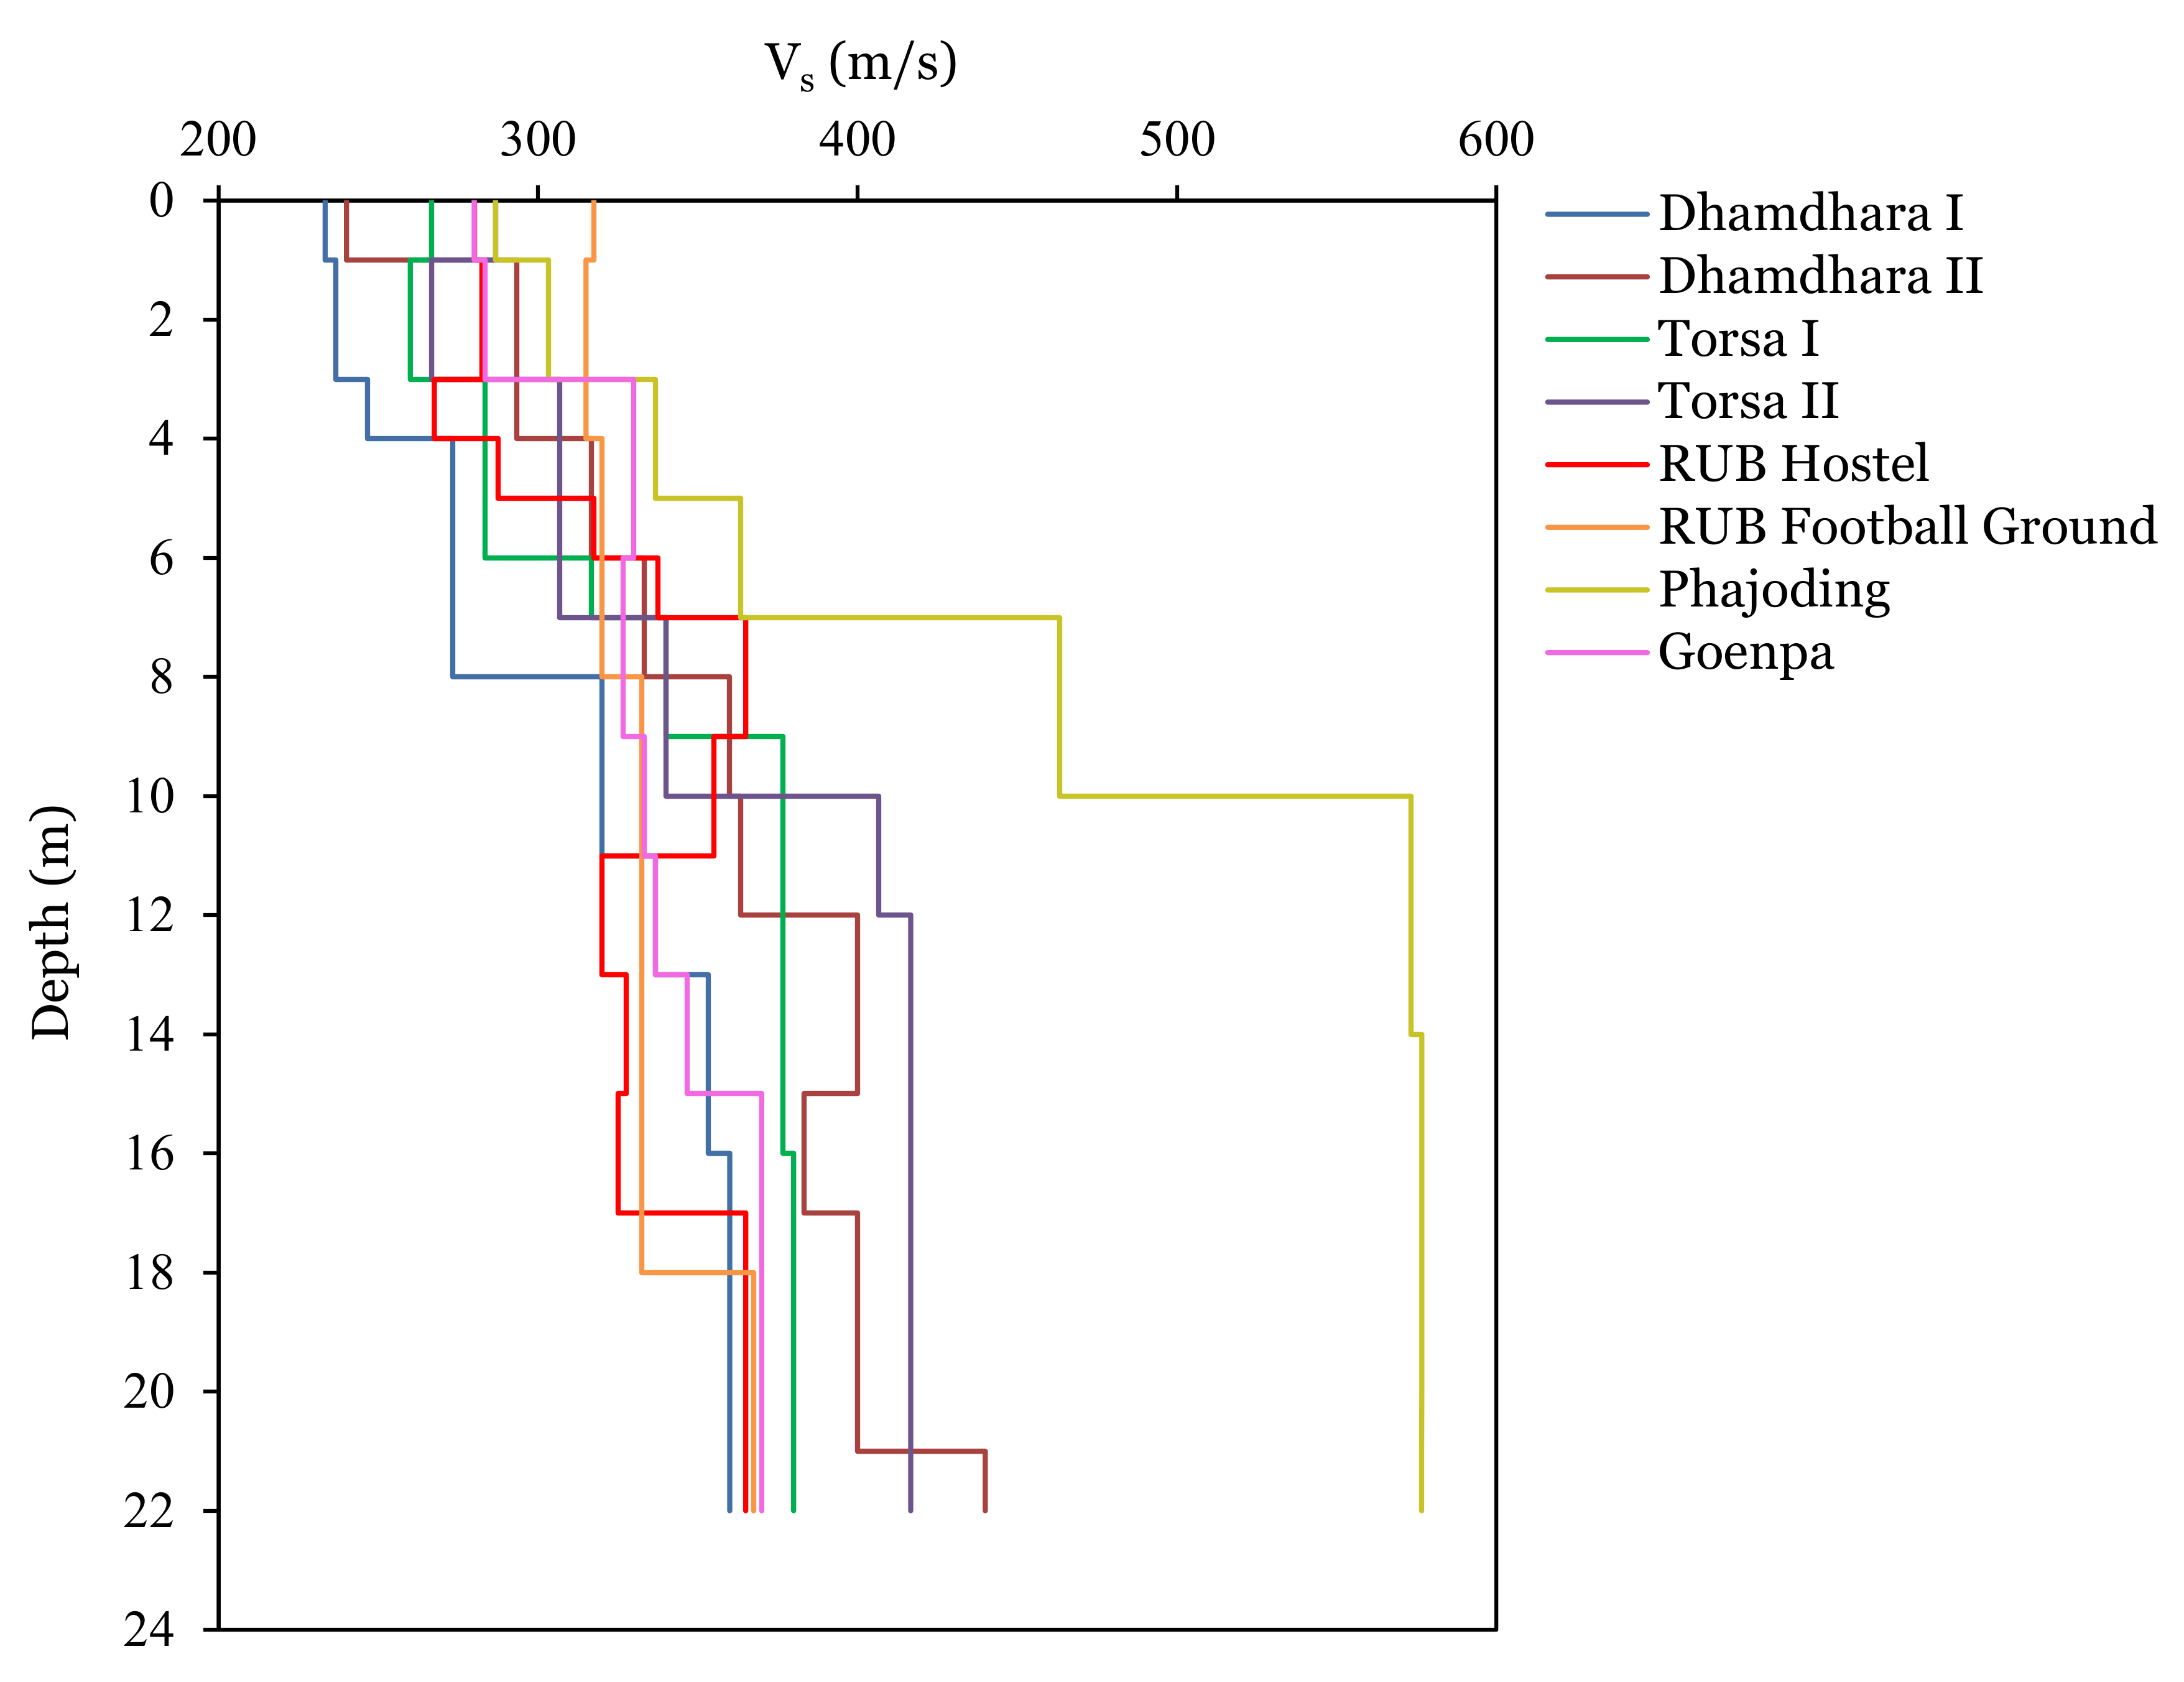
5.1. Geophysical Site Exploration
5.2. Ground Response Analysis
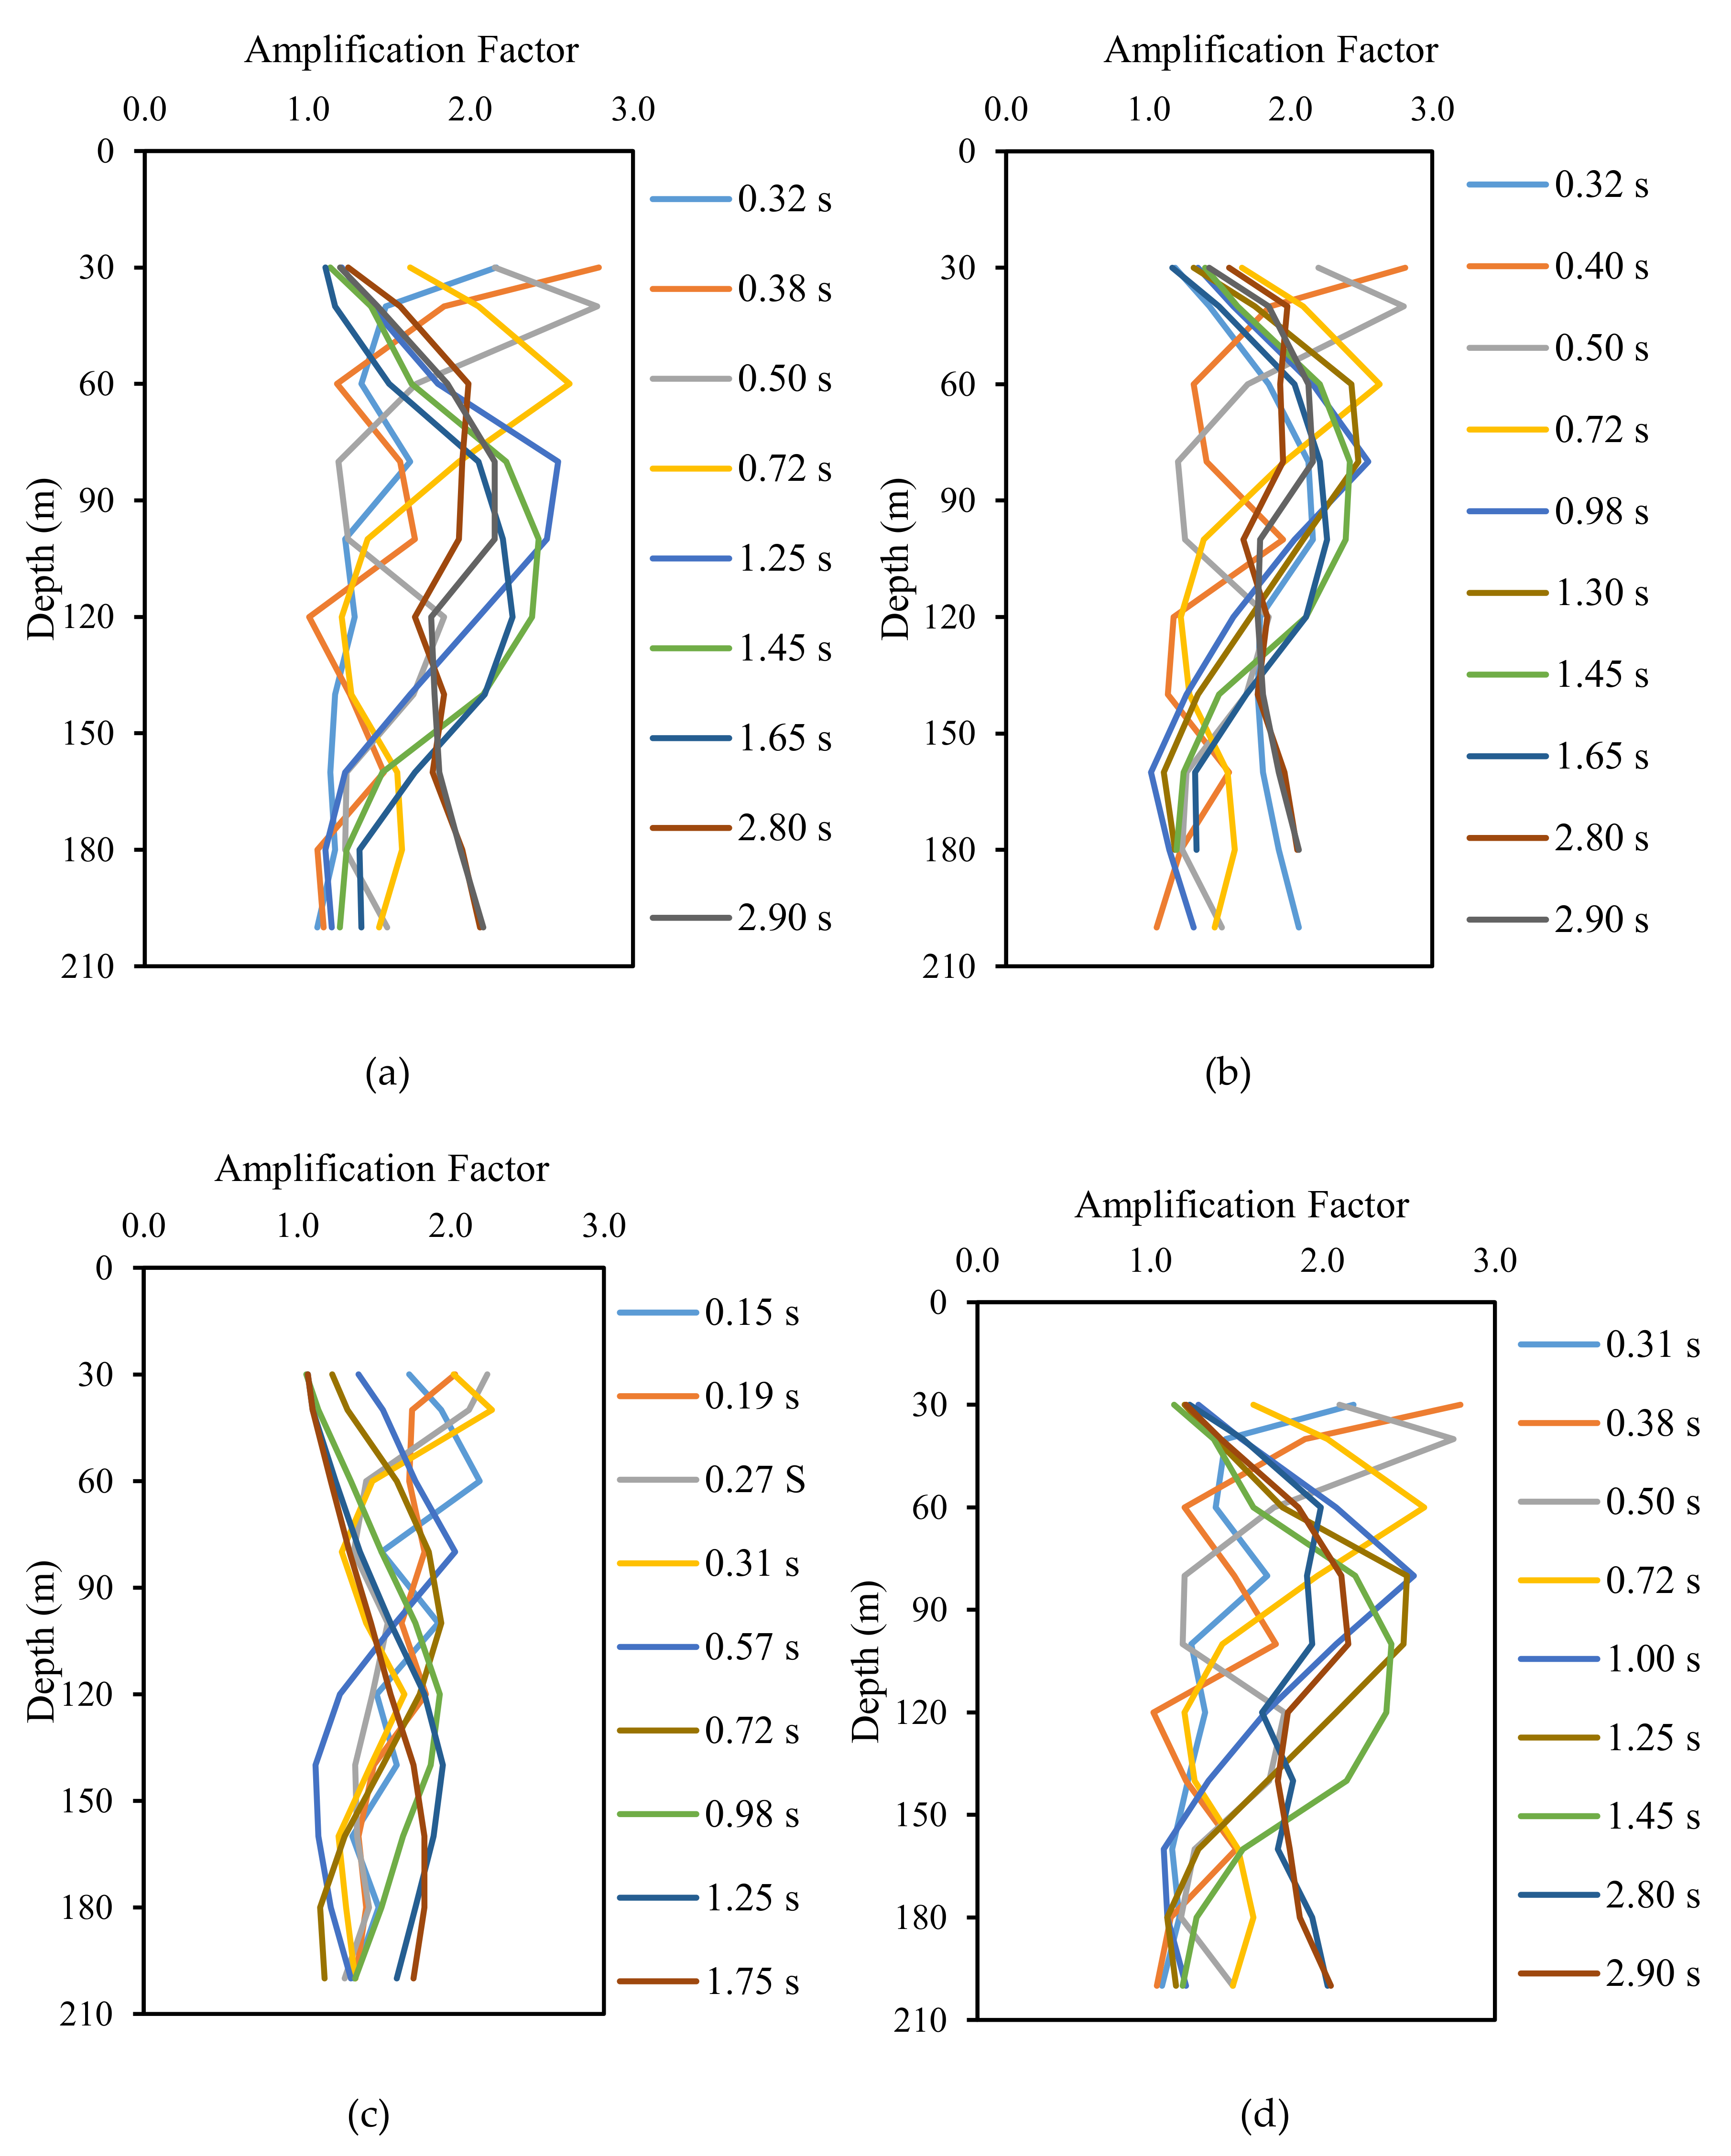
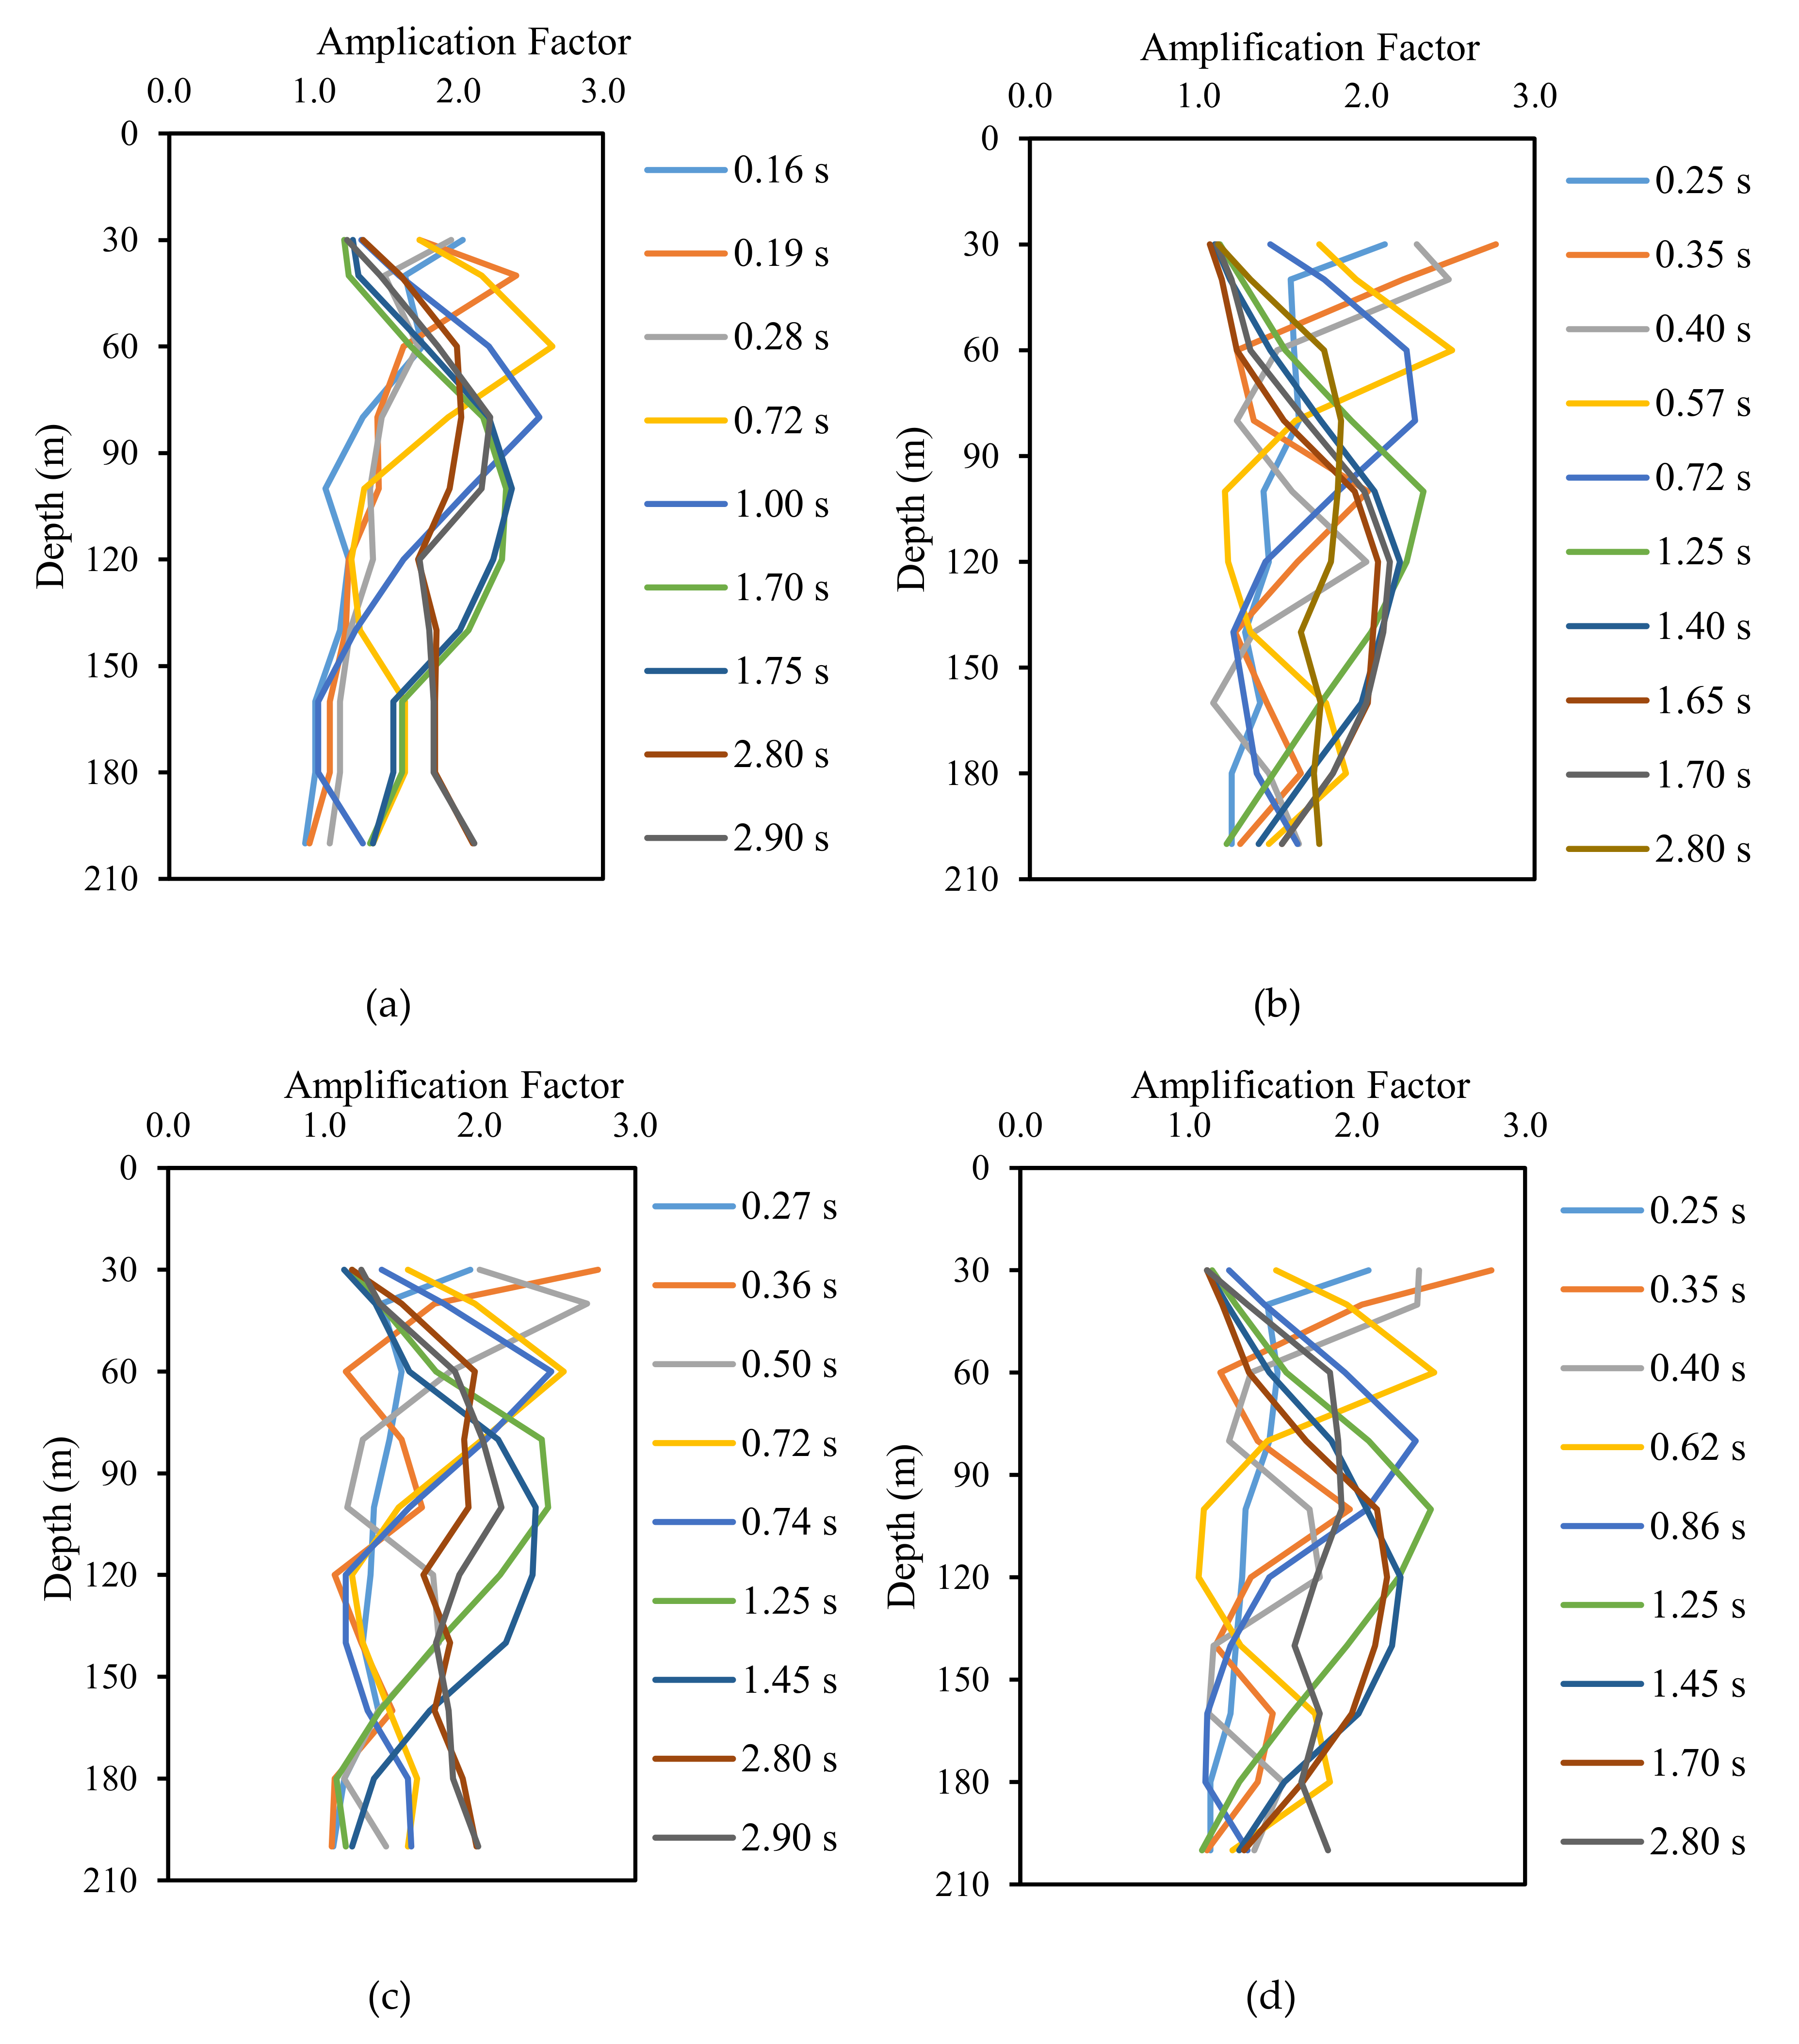
5.3. Parametric Study
6. Conclusions
- The present study is a parametric ground response study for bedrock characteristics using the geophysical data and laboratory experiments on soil collected from the sites.
- The N-value and ultimate bearing capacity values are calculated on the basis of the shear wave velocity of a soil profile.
- Average shear wave velocity indicates soil in each site broadly exhibits similar properties with a majority of Vs,30 ranging between 360–800 m/s which according to the Euro Code EC08, 2003 falls in soil type B, which means the soil is very dense sand or gravel.
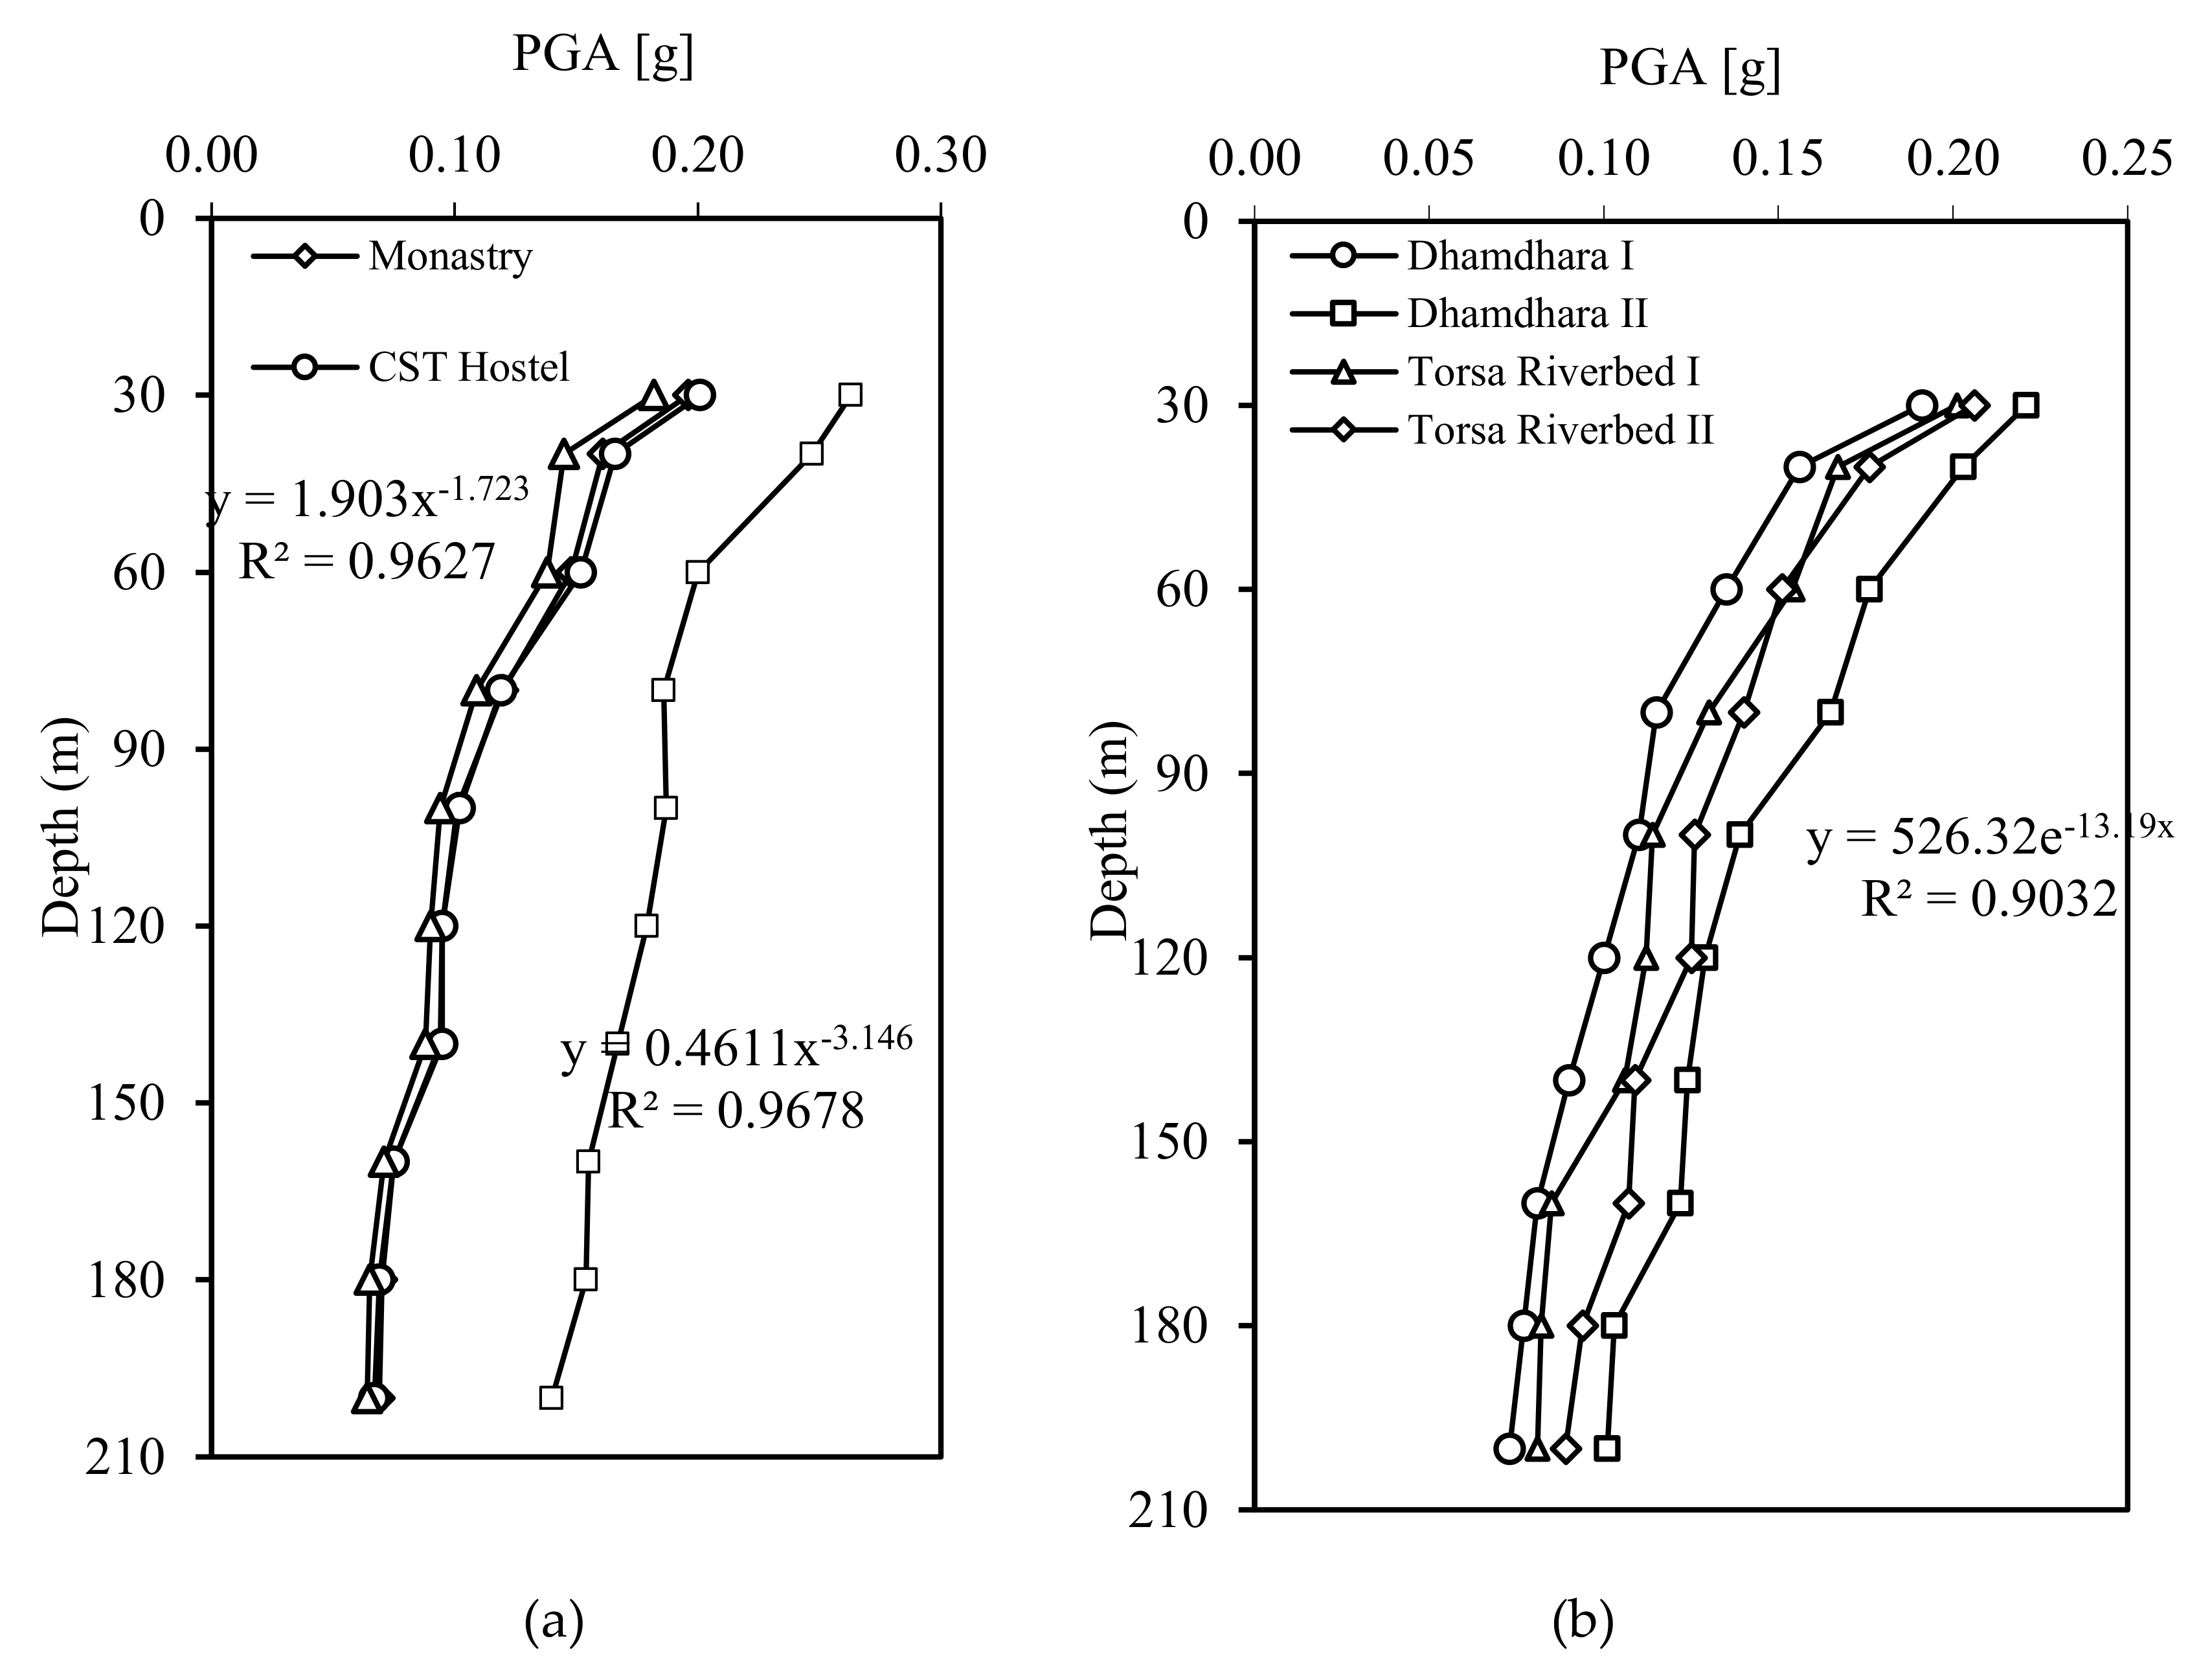
- In the present study, no amplification due to the site-specific response analysis concerning the specific site in the study shows that PGA near ground surface ranges from 0.191 to 0.221 g for all the study locations at 30 m depth of bedrock.
- At bedrock depth of 30 m with amplification factor 2.81 between 0.35 to 0.38 s generally holds good for two- to eight-story buildings based on Indian standard IS 1893:2002.
- Topographical features are considered. So, during the construction of building in the study area, the designer should consider other cataclysmic events which are regular features in Bhutan due to its orography, like landslides, slope instability near the slope edges, etc. This section is not mandatory, but may be added if there are patents resulting from the work reported in this manuscript.
Author Contributions
Funding
Acknowledgments
Conflicts of Interest
References
- Drukpa, D.; Velasco, A.A.; Doser, D.I. Seismicity in the Kingdom of Bhutan (1937–2003): Evidence for crustal transcurrent deformation. J. Geophys. Res. Solid Earth 2006, 111. [Google Scholar] [CrossRef]
- Dikshit, A.; Sarkar, R.; Pradhan, B.; Acharya, S.; Alamri, A.M. Spatial Landslide Risk Assessment at Phuentsholing, Bhutan. Geosciences 2020, 10, 131. [Google Scholar] [CrossRef]
- Hetényi, G.; Drukpa, D.; Cattin, F. What We Have Learnt about Bhutan Earthquakes in Recent Years. Available online: https://kuenselonline.com/what-we-have-learnt-about-bhutan-earthquakes-in-recent-years/ (accessed on 20 April 2020).
- Khalil, M.H.; Hanafy, S.M. Geotechnical Parameters from Seismic Measurements: Two Field Examples from Egypt and Saudi ArabiaKhalil and Hanafy: Geotechnical Parameters from Seismic Measurements. J. Environ. Eng. Geophys. 2016, 21, 13–28. [Google Scholar] [CrossRef]
- Gören, S.; Gelisli, K. Determination of engineering properties of soil on railway track routes (An example of Turkey between the cities of Sivas and Erzincan). Eurasian J. Soil Sci. 2017, 6, 337–349. [Google Scholar] [CrossRef][Green Version]
- Ward, S.H. Geotechnical and Environmental Geophysics: Volume II, Environmental and Groundwater: Volume II, Environmental and Groundwater; Society of Exploration Geophysicists: Tulsa, OK, USA, 1990. [Google Scholar]
- Lippincott, T.; Cardimona, S.; Anderson, N.; Hickman, S.; Newton, T. Geophysical Site Characterization In Support Of Highway Expansion Project. In Proceedings of the 13th EEGS Symposium on the Application of Geophysics to Engineering and Environmental Problems, Keystone, CO, USA, 11–15 April 2010; p. cp-200-00066. [Google Scholar]
- Adiat, K.; Akinlalu, A.; Adegoroye, A. Evaluation of road failure vulnerability section through integrated geophysical and geotechnical studies. Nriag J. Astron. Geophys. 2017, 6, 244–255. [Google Scholar] [CrossRef]
- Adenika, C.I.; Ariyibi, E.A.; Awoyemi, M.O.; Adebayo, A.S.; Dasho, O.A.; Olagunju, E.O. Application of geophysical approach to highway pavement failure: A case study from basement complex terrain southwestern Nigeria. Int. J. Geo-Eng. 2018, 9, 8. [Google Scholar] [CrossRef]
- Naeini, S.; Zarincheh, A. Site effect microzonation and seismic hazard analysis of Kermanshah region in Iran. J. Appl. Sci. (Faisalabad) 2010, 10, 2231–2240. [Google Scholar] [CrossRef]
- Kramer, S.L. Geotechnical Earthquake Engineering; Pearson Education India: New Delhi, India, 1996. [Google Scholar]
- Green, R.; Cameron, W. The influence of ground motion characteristics on site response coefficients. In Proceedings of the Pacific Conference on Earthquake Engineering, Christchurch, New Zealand, 13–15 February 2003; p. 19. [Google Scholar]
- Sas, W.; Gabryś, K.; Sobol, E.; Szymański, A. Dynamic characterization of cohesive material based on wave velocity measurements. Appl. Sci. 2016, 6, 49. [Google Scholar] [CrossRef]
- McGuire, R.; Toro, G. Site-specific seismic hazard analysis. In Proceedings of the 14th World Conference on Earthquake Engineering, Beijing, China, 12–17 October 2008; pp. 12–17. [Google Scholar]
- Bala, A.; Balan, S.; Ritter, J.; Hannich, D. Modeling of seismic site amplification based on in situ borehole measurements in Bucharest, Romania. Rom. Rep. Phys. 2013, 65, 495–511. [Google Scholar]
- Bala, A.; Balan, S.; Ritter, J.; Hannich, D.; Huber, G.; Rohn, J. Seismic site effects based on in situ borehole measurements in Bucharest, Romania. In Proceedings of the International Symposium on Strong Vrancea Earthquakes and Risk Mitigation, Bucharest, Romania, 4–6 October 2007. [Google Scholar]
- Scott, J.B.; Rasmussen, T.; Luke, B.; Taylor, W.J.; Wagoner, J.; Smith, S.B.; Louie, J.N. Shallow shear velocity and seismic microzonation of the urban Las Vegas, Nevada, basin. Bull. Seismol. Soc. Am. 2006, 96, 1068–1077. [Google Scholar] [CrossRef]
- Işık, E.; Kutanis, M. Determination of local site-specific spectra using probabilistic seismic hazard analysis for Bitlis Province, Turkey. Earth Sci. Res. J. 2015, 19, 129–134. [Google Scholar] [CrossRef]
- Mobarki, M.; Hamdache, M.; Talbi, A. Site response analysis models: Case study from sites near Algiers city. In Proceedings of the Second European Conference on Earthquake Engineering and Seismology, Istanbul, Turkey, 25–29 August 2014. [Google Scholar]
- Dikshit, A.; Sarkar, R.; Pradhan, B.; Jena, R.; Drukpa, D.; Alamri, A.M. Temporal Probability Assessment and Its Use in Landslide Susceptibility Mapping for Eastern Bhutan. Water 2020, 12, 267. [Google Scholar] [CrossRef]
- Gariano, S.L.; Sarkar, R.; Dikshit, A.; Dorji, K.; Brunetti, M.T.; Peruccacci, S.; Melillo, M. Automatic calculation of rainfall thresholds for landslide occurrence in Chukha Dzongkhag, Bhutan. Bull. Eng. Geol. Environ. 2019, 78, 4325–4332. [Google Scholar] [CrossRef]
- Sarkar, R.; Dorji, K. Determination of the Probabilities of Landslide Events—A Case Study of Bhutan. Hydrology 2019, 6, 52. [Google Scholar] [CrossRef]
- John, B. Importance of geological studies in earthquake hazard assessment. In Integrating Disaster Science and Management; Elsevier: Amsterdam, The Netherlands, 2018; pp. 27–40. [Google Scholar]
- Dikshit, A.; Sarkar, R.; Pradhan, B.; Acharya, S.; Dorji, K. Estimating rainfall thresholds for landslide occurrence in the Bhutan Himalayas. Water 2019, 11, 1616. [Google Scholar] [CrossRef]
- McQuarrie, N.; Long, S.; Tobgay, T.; Nesbit, J.; Gehrels, G.; Ducea, M.N. Documenting basin scale, geometry and provenance through detrital geochemical data: Lessons from the Neoproterozoic to Ordovician Lesser, Greater, and Tethyan Himalayan strata of Bhutan. Gondwana Res. 2013, 23, 1491–1510. [Google Scholar] [CrossRef]
- Anbazhagan, P.; Sitharam, T. Site characterization and site response studies using shear wave velocity. J. Seismol. Earthq. Eng. 2008, 10, 53–67. [Google Scholar]
- Imai, T.; Yoshimura, M. The Relation of Mechanical Properties of Soils to P and S Wave Velocities for Soil Ground in Japan; Urana Research Institute, OYO Corporation: Tokyo, Japan, 1976. [Google Scholar]
- Haase, J.S.; Choi, Y.S.; Bowling, T.; Nowack, R.L. Probabilistic Seismic-Hazard Assessment Including Site Effects for Evansville, Indiana, and the Surrounding RegionProbabilistic Seismic-Hazard Assessment Including Site Effects for Evansville, Indiana. Bull. Seismol. Soc. Am. 2011, 101, 1039–1054. [Google Scholar] [CrossRef]
- Bardet, J.; Ichii, K.; Lin, C. EERA: A Computer Program for Equivalent-Linear Earthquake Site Response Analyses of Layered Soil Deposits; University of Southern California, Department of Civil Engineering: Los Angeles, CA, USA, 2000. [Google Scholar]
- Chatterjee, K.; Choudhury, D. Variations in shear wave velocity and soil site class in Kolkata city using regression and sensitivity analysis. Nat. Hazards 2013, 69, 2057–2082. [Google Scholar] [CrossRef]
- Nandy, D. Need for seismic microzonation of Kolkata megacity. In Proceedings of the Workshop on Microzonation, Indian Institute of Science, Bangalore, India, 26–27 June 2007. [Google Scholar]
- Seed, H.B. Soil moduli and damping factors for dynamic response analysis. EERC 1970. [Google Scholar] [CrossRef]
- Seed, H.B.; Sun, J. Implication of Site Effects in the Mexico City Earthquake of September 19, 1985 for Earthquake-Resistance-Design Criteria in the San Francisco Bay Area of California; University of California: Berkeley, CA, USA, 1989. [Google Scholar]
- Seed, H.B.; Wong, R.T.; Idriss, I.; Tokimatsu, K. Moduli and damping factors for dynamic analyses of cohesionless soils. J. Geotech. Eng. 1986, 112, 1016–1032. [Google Scholar] [CrossRef]
- Vucetic, M. Soil properties and seismic response. In Proceedings of the 10th World Conference on Earthquake Engineering, Madrid, Spain, 19–24 July 1992; pp. 1199–1204. [Google Scholar]


| Site No | Site Name | Coordinates | Elevation | Remarks |
|---|---|---|---|---|
| 1 | Dhamdhara I | N 26 52 15.1 E 89 23 8.1 | 371 m | Profile NS Direction, 48 m |
| 2 | Dhamdhara II | N 26 52 29.8 E 89 23 01.4 | 309 m | Profile N 30 E Direction, 48 m |
| 3,4 | Toorsa riverbed (I & II) (Toorsa, Kabyetar) | N 26 52 33.1 E 89 22 45.0 | 192 m | Two Profile NS Direction, 96 m each |
| 5 | CST* hostel (Toribari) | N 26 50 57.8 E 89 23 42.1 | 439 m | Profile NE –SW Direction, 48 m |
| 6 | CST* football ground (Kharbandi) | N 26 51 01.3 E 89 23 35.8 | 423 m | Profile NS Direction, 96 m |
| 7 | Phajoding school (Pasakha) | N 26 51 4.7 E 89 23 50.1 | 406 m | Profile NS Direction, 48 m |
| 8 | Kharbandi monastry/Goenpa | N 26 50 57.0 E 89 23 22.7 | 378 m | Profile NS Direction, 48 m |
| Site No. | No. of Shots | No. of Geophones Used | Spacing between Geophones (m) | Remarks |
|---|---|---|---|---|
| 1, 2, 5, 6, 7 and 8 | 25 | 24 | 2 | Restrictions in space |
| 3 and 4 | 25 | 24 | 4 | Flat surface, more spacing will give information of soil profile up to deeper depth |
| Site No | Site Name | VS,30 (m/s) | Ground Type | N Value | qult (kN/m2) |
|---|---|---|---|---|---|
| 1 | Dhamdhara I | 386.43 | B | 38 | 1017.6 |
| 2 | Dhamdhara II | 435.92 | B | 50 | 1358.9 |
| 3 | Toorsa riverbed I | 439.54 | B | 51 | 1386.1 |
| 4 | Toorsa riverbed II | 464.30 | B | 57 | 1581.0 |
| 5 | CST Hotel | 426.76 | B | 48 | 1291.3 |
| 6 | CST Football Ground | 426.61 | B | 47 | 1290.3 |
| 7 | Phajoding School | 584.76 | B | 96 | 2750.1 |
| 8 | Monastry/Goenpa | 446.20 | B | 53 | 1437.1 |
| Site No. | Sites | PGA at Surface Level (g) | Maximum Strain (%) | Maximum Stress (kPa) | Amplication Factor | Frequency at Amplication (Hz) | Maximum Spectral Acceleration (g) |
|---|---|---|---|---|---|---|---|
| 1 | Dhamdhara I | 0.158 | 0.0014 | 1.553 | 1.38 | 3.8 | 0.469 |
| 2 | Dhamdhara II | 0.181 | 0.0016 | 1.866 | 1.50 | 10.0 | 0.596 |
| 3 | Toorsa riverbed I | 0.172 | 0.0012 | 1.734 | 1.38 | 4.0 | 0.534 |
| 4 | Toorsa riverbed II | 0.171 | 0.0010 | 1.735 | 1.35 | 4.8 | 0.525 |
| 5 | CST hostel | 0.159 | 0.0010 | 1.620 | 2.46 | 2.8 | 0.562 |
| 6 | CST football ground | 0.126 | 0.0006 | 1.200 | 1.26 | 1.8 | 0.366 |
| 7 | Phajoding school | 0.212 | 0.0013 | 2.211 | 1.74 | 6.8 | 0.666 |
| 8 | Monastry/Goenpa | 0.128 | 0.0007 | 1.220 | 1.06 | 1.8 | 0.388 |
© 2020 by the authors. Licensee MDPI, Basel, Switzerland. This article is an open access article distributed under the terms and conditions of the Creative Commons Attribution (CC BY) license (http://creativecommons.org/licenses/by/4.0/).
Share and Cite
Tempa, K.; Sarkar, R.; Dikshit, A.; Pradhan, B.; Simonelli, A.L.; Acharya, S.; Alamri, A.M. Parametric Study of Local Site Response for Bedrock Ground Motion to Earthquake in Phuentsholing, Bhutan. Sustainability 2020, 12, 5273. https://doi.org/10.3390/su12135273
Tempa K, Sarkar R, Dikshit A, Pradhan B, Simonelli AL, Acharya S, Alamri AM. Parametric Study of Local Site Response for Bedrock Ground Motion to Earthquake in Phuentsholing, Bhutan. Sustainability. 2020; 12(13):5273. https://doi.org/10.3390/su12135273
Chicago/Turabian StyleTempa, Karma, Raju Sarkar, Abhirup Dikshit, Biswajeet Pradhan, Armando Lucio Simonelli, Saroj Acharya, and Abdullah M. Alamri. 2020. "Parametric Study of Local Site Response for Bedrock Ground Motion to Earthquake in Phuentsholing, Bhutan" Sustainability 12, no. 13: 5273. https://doi.org/10.3390/su12135273
APA StyleTempa, K., Sarkar, R., Dikshit, A., Pradhan, B., Simonelli, A. L., Acharya, S., & Alamri, A. M. (2020). Parametric Study of Local Site Response for Bedrock Ground Motion to Earthquake in Phuentsholing, Bhutan. Sustainability, 12(13), 5273. https://doi.org/10.3390/su12135273