Article

Simulating Historical Earthquakes in Existing Cities for Fostering Design of Resilient and Sustainable Communities: The Ljubljana Case

Faculty of Civil and Geodetic Engineering, University of Ljubljana, 1000 Ljubljana, Slovenia
*
Author to whom correspondence should be addressed.
Sustainability 2021, 13(14), 7624; https://doi.org/10.3390/su13147624
Submission received: 31 May 2021 / Revised: 29 June 2021 / Accepted: 2 July 2021 / Published: 8 July 2021
(This article belongs to the Special Issue Resilience to Earthquake Hazard: Assessments and Frameworks)

Abstract

:
The seismic exposure of urban areas today is much higher than centuries ago. The 2020 Zagreb earthquake demonstrated that European cities are vulnerable even to moderate earthquakes, a fact that has been known to earthquake-engineering experts for decades. However, alerting decision-makers to the seismic risk issue is very challenging, even when they are aware of historical earthquakes that caused natural catastrophes in the areas of their jurisdiction. To help solve the issue, we introduce a scenario-based risk assessment methodology and demonstrate the consequences of the 1895 Ljubljana earthquake on the existing building stock. We show that a 6.2 magnitude earthquake with an epicentre 5 km north of Ljubljana would cause many deaths and severe damage to the building stock, which would likely lead to direct economic losses higher than 15% of the GDP of the Republic of Slovenia. Such an event would be catastrophic not only for the community directly affected by the earthquake but for the entire country. We have disseminated this information over the course of a year together in addition to formulating a plan for enhancing the community seismic resilience in Slovenia. Hopefully, local decision-makers will act according to their jurisdiction in Slovenia and persuade decision-makers across Europe to update the built environment renovation policy at the European level.

1. Introduction

Historically, earthquakes have caused many natural disasters (e.g., [1,2,3]). In Europe, the Great Lisbon earthquake and the Great Messina earthquake are probably the deadliest events of this nature to have happened in the modern era. The Great Lisbon earthquake affected about 800,000 km2 of land and killed up to 100,000 people (e.g., [1]), while the number of fatalities in the Great Messina earthquake may have been even higher [3]. It is thus very well known that very strong earthquakes can occur in Europe. However, the 2009 L’Aquila earthquake and the 2020 Zagreb earthquake showed that the existing built environment in Europe is not immune to strong or even moderate earthquakes [4,5]. Although the seismic resistance of new buildings and other types of new facilities is not problematic, the exposure of urban areas today is much higher than centuries ago. Therefore, strong earthquakes can still have a disastrous impact on today’s built environment and societal wellbeing if their epicentre occurs near urban areas. Even though these facts are well known to experts in earthquake engineering, it is extremely difficult to establish governmental plans and actions to enhance seismic resilience prior to such events. The issue cannot be solved by learning from past events because learning from rare events is statistically unusual [6]. Therefore, it makes sense to develop physics-based methods and tools that can provide realistic information about the effects of strong earthquakes and seismic risk to stakeholders. Such information may help establish an unbiased perception of seismic risk, which is needed to react before a strong earthquake occurs.
Seismic risk assessments of the built environment have already been performed, and software for seismic risk assessment has also been developed and is freely available to some extent. The OpenQuake engine is commonly used for the computation of seismic risk [7,8], and can produce various outputs to support the development of seismic risk reduction or mitigation measures. Another widely used tool for seismic risk assessment is HAZUS-MH, which was developed with the support of the US Federal Emergency Management Agency in association with the National Institute for Building Sciences [9]. HAZUS-MH is freely available and primarily intended for local, state, and regional officials in the US. It is based on a multi-hazard loss estimation methodology, which decomposes problems into the following steps: hazard identification, inventory collections, natural hazards impact assessment, risk evaluation and engineering assessment, and risk mitigation. HAZUS methodology has been recently used in Iran [10,11], Israel [12], and India [13] for different purposes related to seismic hazard and risk.
Software, such as OpenQuake and HAZUS-MH, can be used for scenario-based seismic risk assessment, in which the impact of a selected earthquake scenario is estimated. Pavel and Vacareanu [14] performed a scenario-based risk assessment of the building stock in Bucharest. The results of the study showed that the projected losses incurred due to strong earthquakes in Bucharest would be expected to amount to up to 12.7 billion EUR. Stasser et al. [15] investigated the impact of a strong earthquake in Istanbul. It was found that up to 7.8% of the total building stock could be damaged beyond repair in an earthquake with the moment magnitude of 7.5 occurring in a nearby Main Marmara Fault. Moreover, Pitilakis et al. [16] applied the concept of a seismic stress test [17] to evaluate the seismic risk in the Thessaloniki port in Greece. As part of the stress test, a scenario-based assessment was performed, in which it was found that the Thessaloniki port could withstand an earthquake with a 4975-year return period without significant performance loss.
An alternative to scenario-based seismic risk assessment is time-based risk assessment (e.g., [18,19]), which is needed for the well-informed planning of seismic risk reduction. However, scenario-based risk assessment has other advantages. It simulates the consequences of an earthquake, which can be better understood by all stakeholders, and can raise awareness of potential losses due to rare earthquake events. The estimated losses of rare earthquakes, especially if such events have already occurred in the past, can be used to teach stakeholders about potential losses in the case of strong or major earthquakes. Such a demonstration is made in this paper.
The existing seismic risk studies in Slovenia are briefly summarised. Then we describe the building stock and the seismic hazard in Slovenia. This is followed by a presentation of the methodology for scenario-based risk assessment. The methodology is then used to simulate the impact of the Ljubljana earthquake from 1895 if it were to occur in 2020. The seismic scenario is characterised by the magnitude and hypocentre, which were estimated by seismologists [2]. Finally, the results of the risk assessment in terms of economic losses, number of collapsed buildings, and fatalities are discussed.

2. Seismic Risk in Slovenia from the Perspective of the National Disaster Risk Assessment

Sustainable management of seismic risk requires the active involvement of the government, which has the ability to establish effective and rational seismic risk mitigation measures. However, for well-informed decision making, an unbiased assessment of seismic risk as well as other competing risks, which also require the government’s attention, is needed. In Slovenia, the assessment of multi-hazard disaster risks was required by the Government with the Decree implementing the Decision on the Union Civil Protection Mechanism [20,21]. The Administration of the Republic of Slovenia for Protection and Disaster Relief prepared and issued the report on the National Disaster Risk Assessment (NDRA) [22,23], which was then adopted by the Government of the Republic of Slovenia. The NDRA accounts for fifteen different hazards including natural hazards (e.g., seismic and flood hazard) as well as man-made hazards (e.g., terrorism). In the following, the NDRA methodology [23] and the estimation and evaluation of seismic risk is briefly summarised.

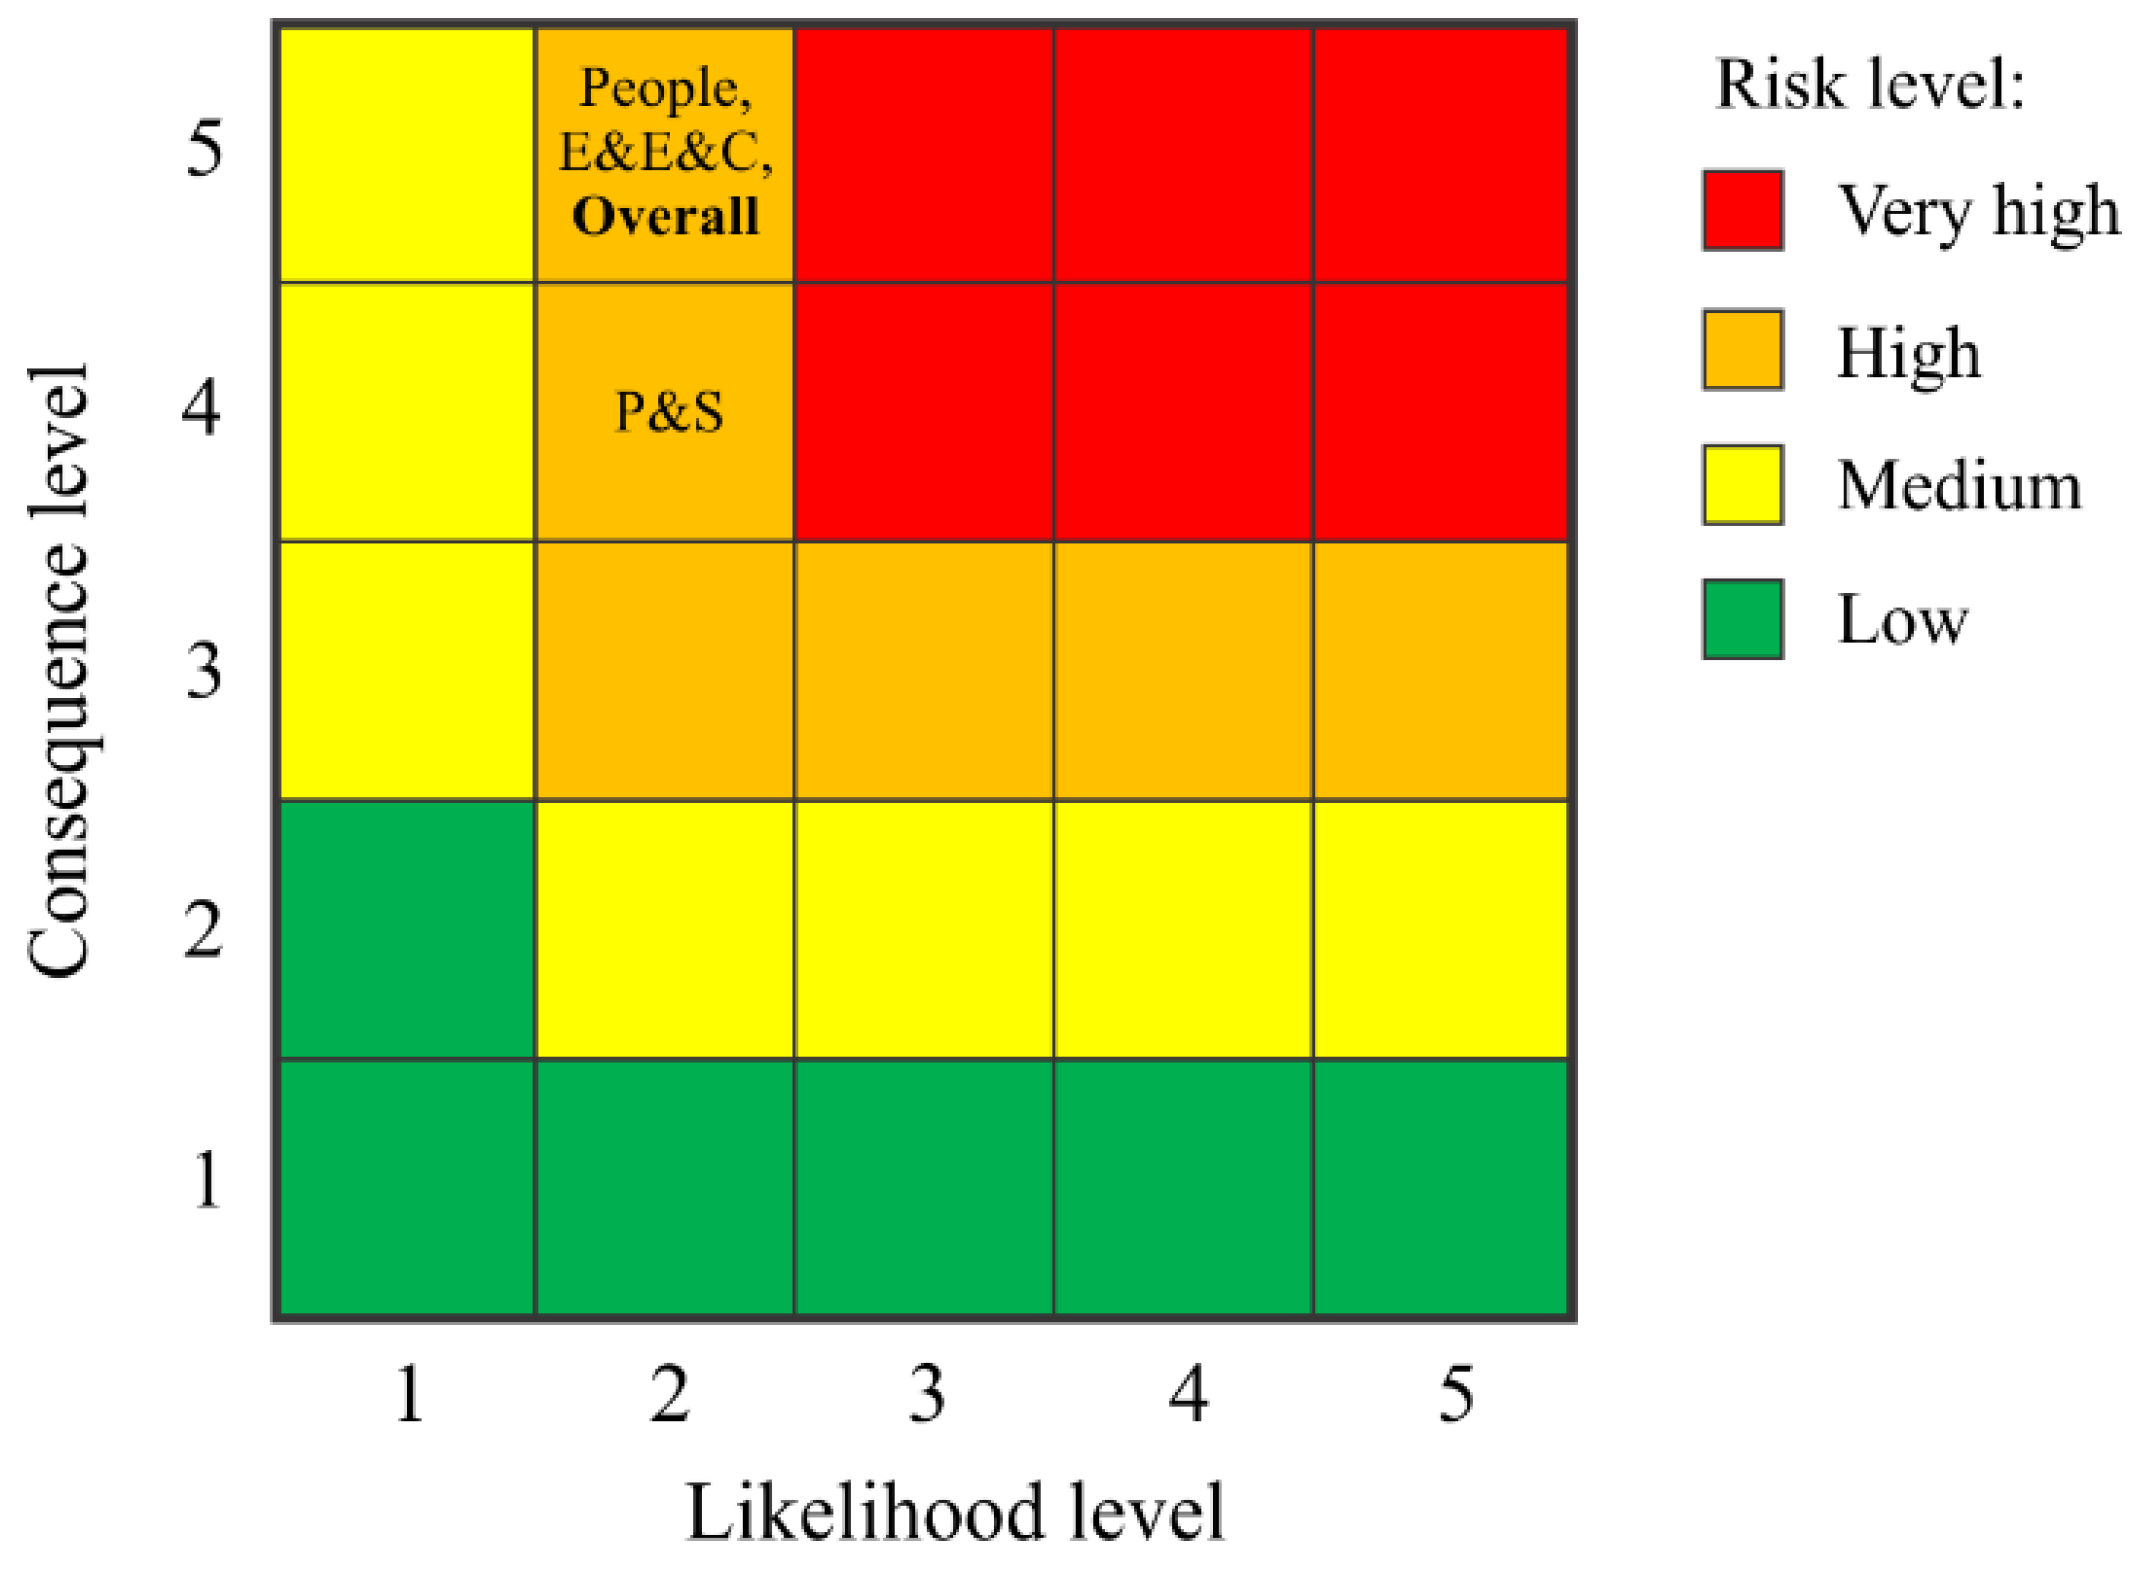
2.1. The National Disaster Risk Assessment Methodology

The National Disaster Risk Assessment considers different hazards [23]. For each hazard, two or three adverse events, which are also called hazard scenarios [23], are defined based on an arbitrarily selected level of likelihood. Then, the consequences of the defined hazard scenarios are estimated. The likelihood and the consequences of the hazard scenario are used to define the risk. For this purpose, the risk matrix is defined (Figure 1). Hazard scenarios of the same hazard enable a within-hazard risk comparison. However, the between-hazard risk comparison is made for only one hazard scenario (i.e., the so-called representative hazard scenario). The representative hazard scenario is considered to be “the reasonable worst-case scenario”, whereby the term “reasonable” implies that the scenario is not related to very long return periods. Namely, the return period of the representative scenario is limited to 500 years. Consequently, catastrophic events with longer return periods, which could also occur in Slovenia, are excluded from the risk assessment by definition.
The consequence and likelihood levels of a hazard scenario are characterised by a number from one to five. In particular, the consequence level increases with the increase of severity of consequences, while the likelihood level increases with the decrease of the return period (i.e., lower return periods represent a higher probability of occurrence). The consequence level is estimated by considering the impact on (i) people, (ii) economy, environment, and cultural heritage, and (iii) politics and society. Each consequence level is defined by the loss interval. For example, consequence level one corresponds to not more than five fatalities and 20 evacuated people, and economic losses lower than 100 million EUR (about 0.25% of the GDP). However, consequence level five corresponds to equal to or more than 200 fatalities or 500 evacuated people, and economic losses higher than 2.4% of the GDP. Analogously, each likelihood level is defined by the interval of the return period. For example, likelihood level one represents events with a return period of 250 years or more, while likelihood level five corresponds to events with a return period of only five years or less.
The estimated risk for each considered hazard is communicated by the risk matrix (Figure 1). The highest risk level is characterised by high likelihood and high consequence. However, risk level (low, medium, high, or very high) is assigned to each component of the risk matrix, which sets the basis for the within-hazard and between-hazard risk communication and comparison.
It is obvious that such risk evaluation is extremely sensitive to the definition of the hazard scenarios. As the scenarios are selected based on expert opinion, rare events can be overlooked. This can be especially problematic in the case of earthquake events because the potential of earthquake consequence rapidly increases with return periods greater than 250 years. Neglecting low-probability, high-consequence events in disaster risk assessments can quickly lead to bias. The issue can be solved by including all events in the risk assessment and estimating their average impact in a selected period. The time-based risk assessment is the established norm in the field of seismic risk assessment. However, it may not be suitable for a comparative risk assessment, because the models and methods needed in that approach have not yet been developed for all the hazards. An alternative way to address this problem is to expand the domain of likelihood and consequence level of the risk matrix, which would enable the inclusion of low-probability, high-consequence events into the risk assessment.

2.2. The Assessment of Seismic Risk

The National Disaster Risk Assessment [23] considered three earthquake scenarios. Earthquakes were simulated in Bovec (north-western Slovenia), Ljubljana (central Slovenia), and Brežice (south-eastern Slovenia). The Ljubljana earthquake was considered the representative scenario [23,24].
The three earthquake scenarios were defined by the epicentral seismic intensity VII-VIII according to the European macro-seismic scale (EMS) [25]. Based on the selected seismic intensity, the return periods of the earthquakes were estimated. For all three scenarios, the return period was between 150 and 250 years, which corresponded to likelihood level two in the risk matrix.
The most severe consequences were estimated for the Ljubljana earthquake scenario. The consequence level was first estimated for each type of impact separately. The impact on people was characterised by consequence level five, because it was realised that the earthquake would cause a high number of evacuated people (5200). It is interesting to note that the consequence level would have been equal to four had the impact on people only depended on the number of fatalities (60). In terms of impact on the economy, environment, and cultural heritage, consequence level five was assigned. In this case, the high consequence level was determined due to the high valuation of the buildings that were estimated to be damaged (about 3 billion EUR or 8.2% of GDP). It should be noted that the valuation of the damaged buildings is not equal to the economic losses caused by the earthquake. In terms of impact on politics and society, the consequence level was equal to four, which was due to the expected psychosocial effects (e.g., increased fear in people) and political consequences (e.g., the need to request international aid) of the earthquake. By considering the consequence levels for all three types of impact, the overall consequence level was estimated to be five. Finally, based on the consequence levels estimated for different types of impact and by also considering the estimated likelihood level, the risk associated with the Ljubljana earthquake scenario was evaluated. It was concluded that the level of risk was high, regardless of the type of impact (Figure 1).
In the case of the other two scenarios, which were not considered representative of the seismic hazard, the consequence was lower. This was mainly because the urban areas in Bovec and Brežice are much smaller than that in Ljubljana. The consequence level in these cases varied between one and three. Thus, the risk was evaluated as low, medium, and high depending on the type of consequence.

3. Building Stock and Seismic Hazard in Slovenia

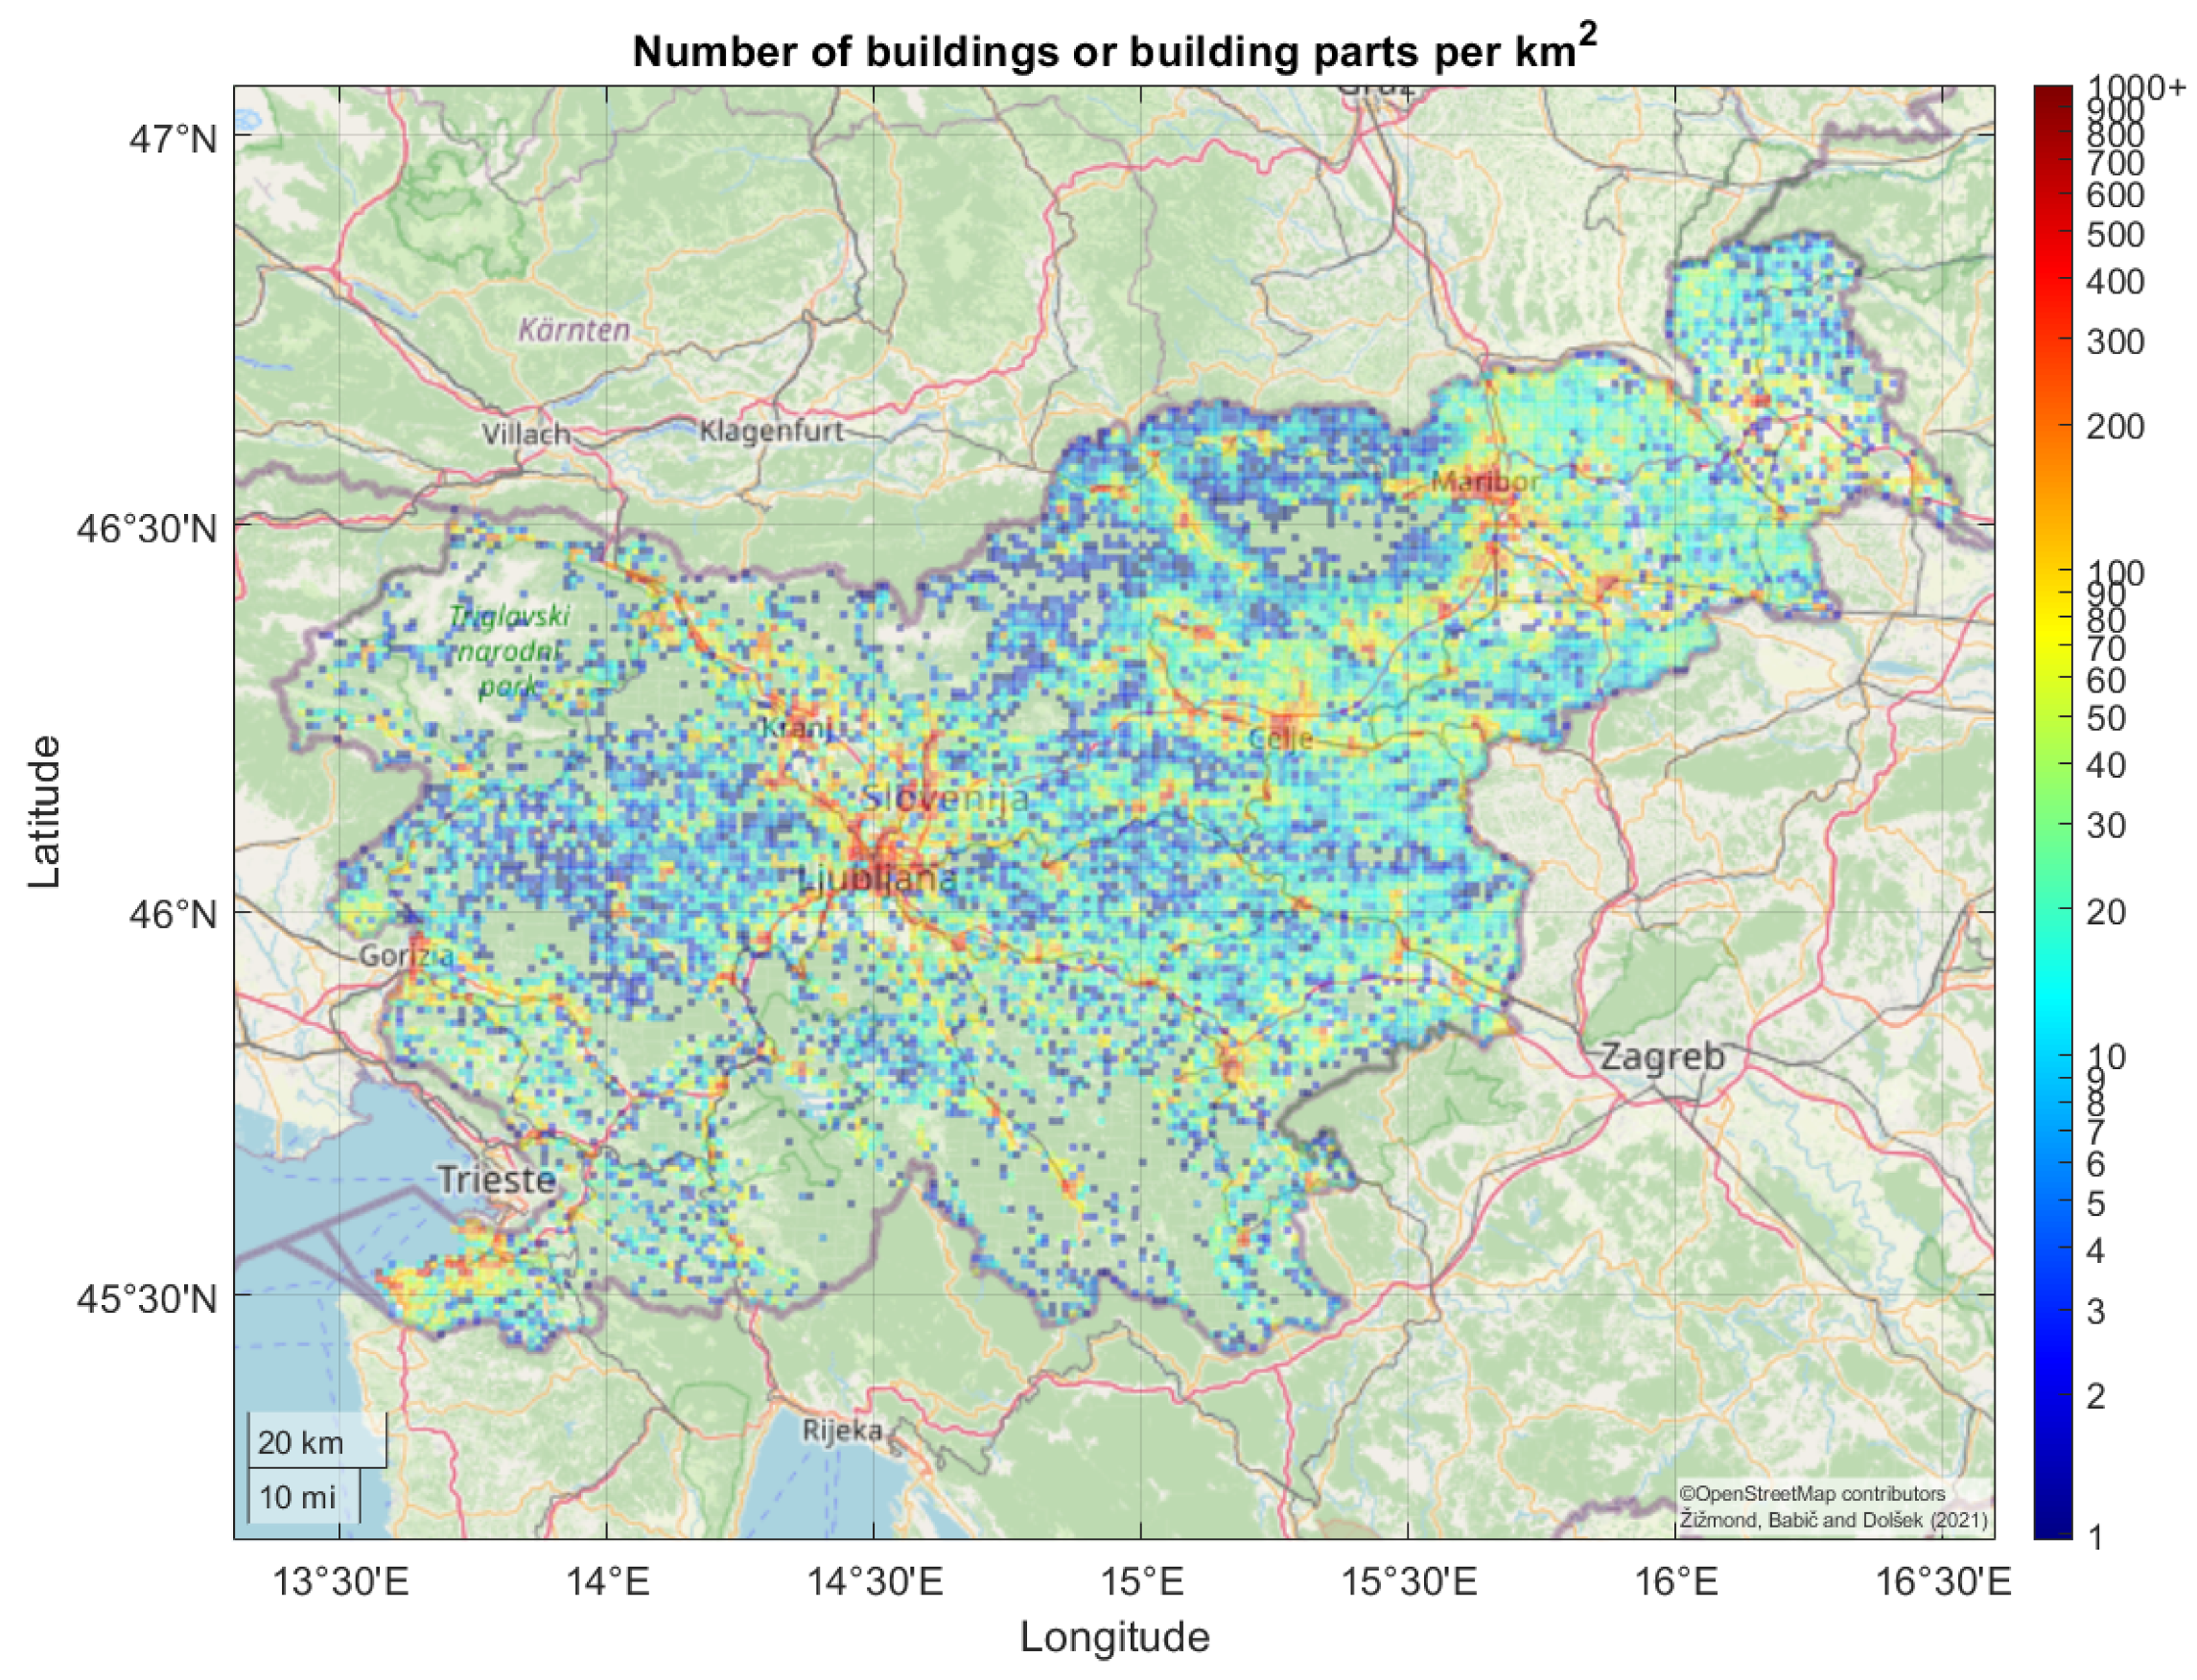
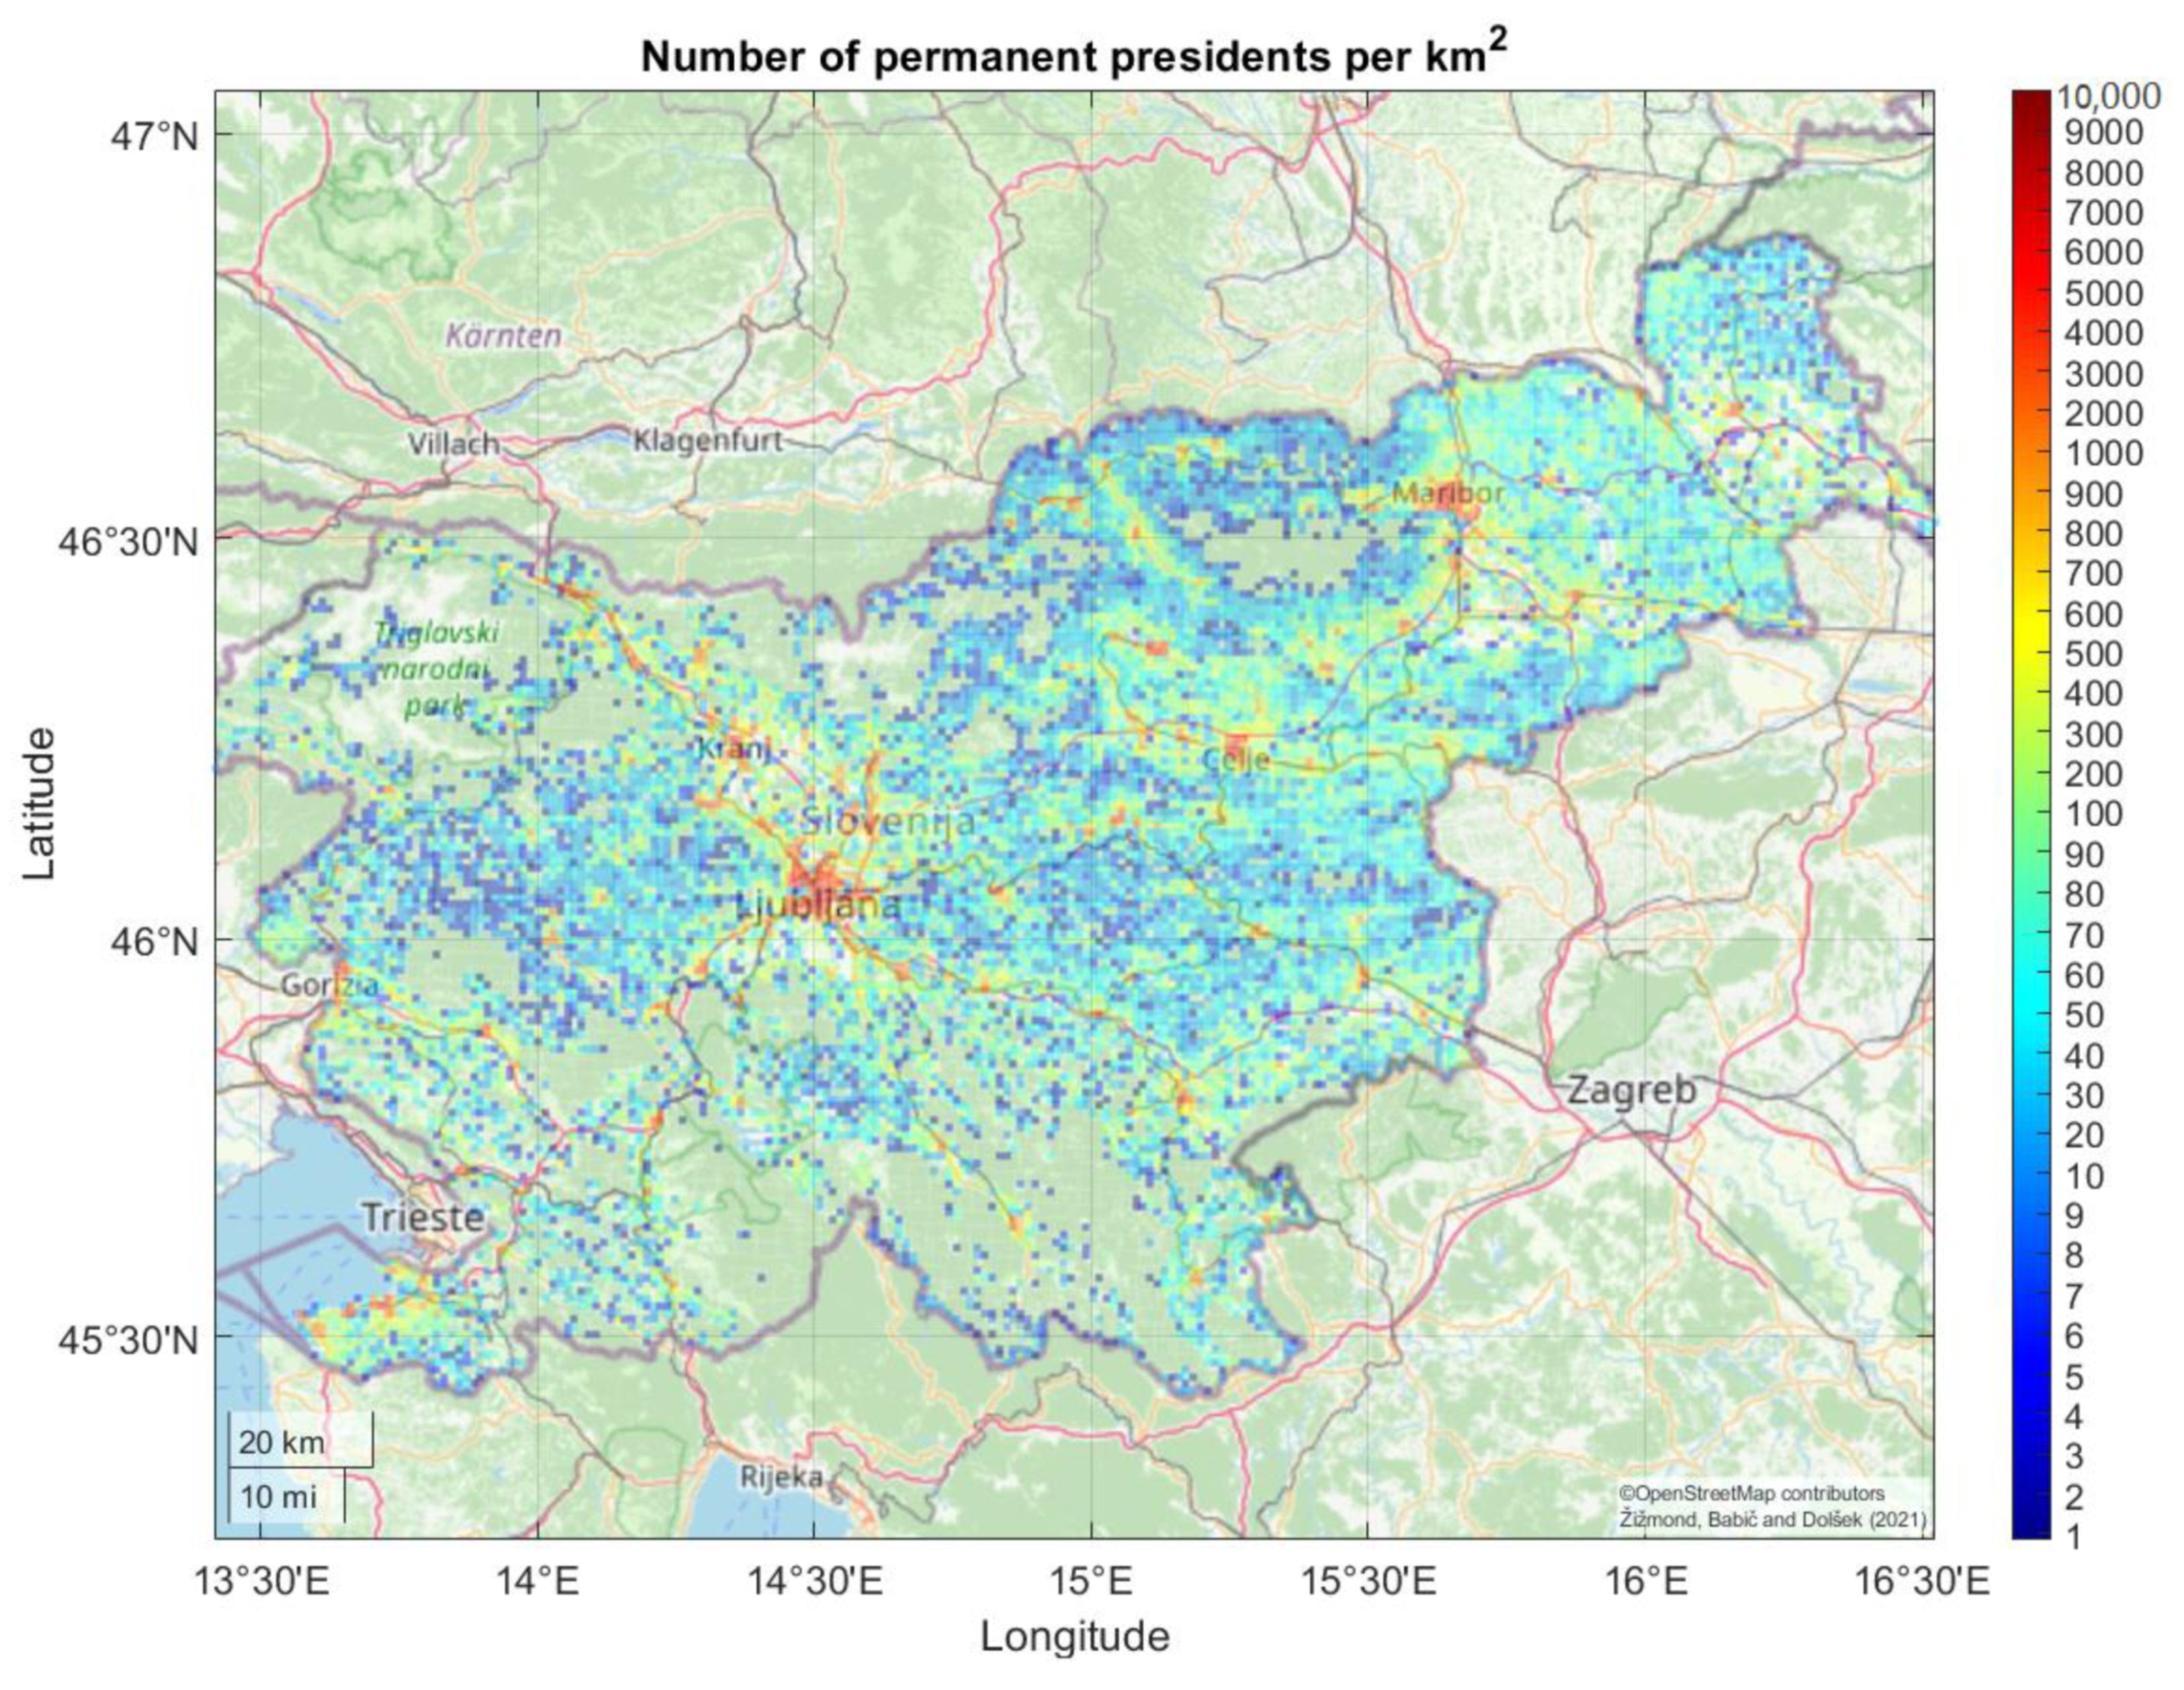
3.1. The Building Stock in the Republic of Slovenia

The sources of building stock data and population data were, respectively, the Real Estate Register [26] and the Central Population Register [27]. The Real Estate Register data refers to unique building units, which can be either entire buildings or parts of buildings in the case of large buildings. The distinction between the two is not evidenced in the register and is thus not considered in this study. For brevity, building units are hereinafter termed “buildings”.
Each building from the Real Estate Register is described with the following data: the centroid coordinates, year of construction, occupancy class, net floor area, predominant material of the load-bearing structure, building value based on a real estate mass appraisal procedure, number of storeys, and building height.
The Central Population Register includes the number of permanent and temporary residents in residential buildings. To avoid the double-counting of people, only permanent residents were considered. The building and population density are presented in Figure 2 and Figure 3, respectively. A concentration of buildings, as well as people, can be observed in urban areas of Ljubljana, Maribor, Celje, and Kranj.
Although the materials of the load-bearing structures are specified in the Real Estate Register, type of the structural system is unclear (e.g., reinforced concrete structures can have a wall system, a frame system, a dual system, etc.). In addition, the Real Estate Register does not contain information about the dimensions of the load-bearing structure elements, material properties, and the results of the structural design. However, building data were available for the total building stock and were considered sufficient for the development of a simplified building class fragility model, which is described in Section 4.2. Buildings were classified into 20 building classes (see Table 1). The simplified fragility model of each building class accounts for a specific predominant material of the load-bearing structure, the construction period, and the number of storeys.
The adopted fragility model is simplistic with respect to the number of parameters used to define building class fragility models. If the building stock data were more precise (e.g., [28]), other parameters of the buildings and other fragility models would be considered in the development of the building stock fragility models [29,30,31,32,33]. Nevertheless, engineering judgment would be needed to define other parameters that are not yet available [31]. However, it was proven before that pure empirical and heuristic-empirical models, developed by different authors, provided reasonably comparable risk results [30].
The vast majority of buildings in Slovenia are either brick or stone masonry buildings or reinforced concrete buildings. Buildings with masonry (brick or stone) and reinforced concrete structures were therefore treated as separate material classes. Steel and timber buildings, as well as all other buildings with a mixed or unspecified material of the load-bearing structure, were classified in the third material class (i.e., other or unspecified load-bearing structure material). It is worth emphasising that the buildings with steel and timber structures were not grouped into separate classes because the percentage of these buildings is very low. The majority of buildings from the third material class have a load-bearing structure that is made of a combination of masonry and reinforced concrete.
The distinction between the periods of construction is based on standards for earthquake-resistant design in Slovenia as well as in Yugoslavia, which extended to the area of today’s Slovenia until 1991 [34]. Buildings built up to 1964 were not designed for seismic actions. The first building code explicitly addressing seismic action and design came into force between 1964 to 1981. Construction based on the second generation of earthquake-resistant design started in Yugoslavia in 1982. These codes were valid until 2008 when Eurocodes become mandatory in Slovenia. However, no distinction is made between buildings built in the period from 1982 to 2008 and those built after 2008, because the number of buildings from the latest period is relatively low and buildings from the 1982–2008 period already have relatively high earthquake resistance.
The number of storeys also affects the building fragility model. Buildings with a maximum of three storeys are classified as low-rise buildings. Medium-rise buildings and high-rise buildings are those with four to six storeys and seven storeys or more, respectively. This classification is similar to that used in the literature (e.g., [9,35,36]).
Based on the building stock classification, 27 building classes could be defined, but some simplifications were made in order to make the population of buildings between building classes more uniform. Therefore, medium-rise and high-rise masonry buildings were represented by only one class. The same was done in the case of buildings made of materials other than masonry and reinforced concrete. Moreover, no distinction was made between medium-rise and high-rise buildings with reinforced concrete structures that were constructed before 1964.
In order to take into account only the most important buildings, the characteristic building stock of the Republic of Slovenia was defined, which includes buildings that have permanent residents or an estimated value of 50,000 EUR or more. Based on this constraint, the characteristic building stock includes about 520,000 buildings, the value of which was estimated to about 97% of the value of the total building stock. It is interesting that the characteristic building stock is approximately evenly distributed in all three construction periods (Table 1). It includes 332,000 masonry buildings (64% of all buildings in the characteristic building stock), with a value estimated to around 42% of the total value of the characteristic building stock. Almost 60% of residents of Slovenia are permanently registered in these buildings. The value of reinforced concrete buildings was estimated to be 31% of the total value of the characteristic building stock, while the value of buildings with structures made of other (or unspecified) materials represents 28% of the total market value. Most of the buildings have three storeys or less. The number of buildings with four or more storeys is approximately 17,200, which is only about 3% of all buildings in the characteristic building stock. However, the estimated market value of these buildings represents approximately one-third of the total value of the characteristic building stock, and almost half a million people live in these buildings.

3.2. The Seismic Hazard in Slovenia

In 2020, two seismic hazard models were available (i.e., [37,38]). Here we refer to the official seismic hazard model in the Republic of Slovenia which was introduced by Lapajne et al. [37]. According to that model, the highest seismic hazard is observed for the north-western, central, and south-eastern parts of Slovenia. These parts of Slovenia also coincide with the epicentres considered in the scenarios from the National Disaster Risk Assessment (Section 2). According to [37], the peak ground acceleration (PGA) for the return period of 475 years and the most hazardous regions was estimated to 0.25 g. By moving towards the north-east and south-west of Slovenia, the seismic hazard is reduced. The lowest PGA in these regions does not exceed 0.10 g, even for the case of a 1000-year return period.
The seismic hazard model [37] primarily depends on the catalogue of past earthquakes. The seismic hazard in the north-western part of Slovenia is influenced by the 1511 Idrija earthquake (magnitude 6.8), the 1976 Friuli earthquake (magnitude 6.5), and the 1998 and 2004 Posočje earthquakes (magnitudes 5.7 and 4.9). The seismic hazard model in central Slovenia is controlled mainly by weaker earthquakes, but also by some stronger earthquakes, such as the 1882 Vrhnika earthquake (magnitude 5.0), the 1895 Ljubljana earthquake (magnitude 6.1), and the 1926 Postojna earthquake (magnitude 5.6). In the south-eastern part of Slovenia, the seismic hazard model considers numerous earthquakes with relatively low magnitudes and few with moderate magnitudes. The 1917 Brežice earthquake (magnitude 5.7) is the strongest known earthquake to have occurred in this region.
A new official seismic hazard model is currently in preparation. However, its draft, unofficial version has already been presented [39]. The draft of the new model indicates that the regions with the highest seismic hazard in Slovenia are the same as in the case of the current official seismic hazard model (i.e., north-western, central, and south-eastern Slovenia). Based on this information and in consideration of the building stock’s exposure, which is the highest in the Ljubljana region, it was decided to simulate the consequences of the 1895 Ljubljana earthquake. The selected event is described in more detail in Section 5.1.

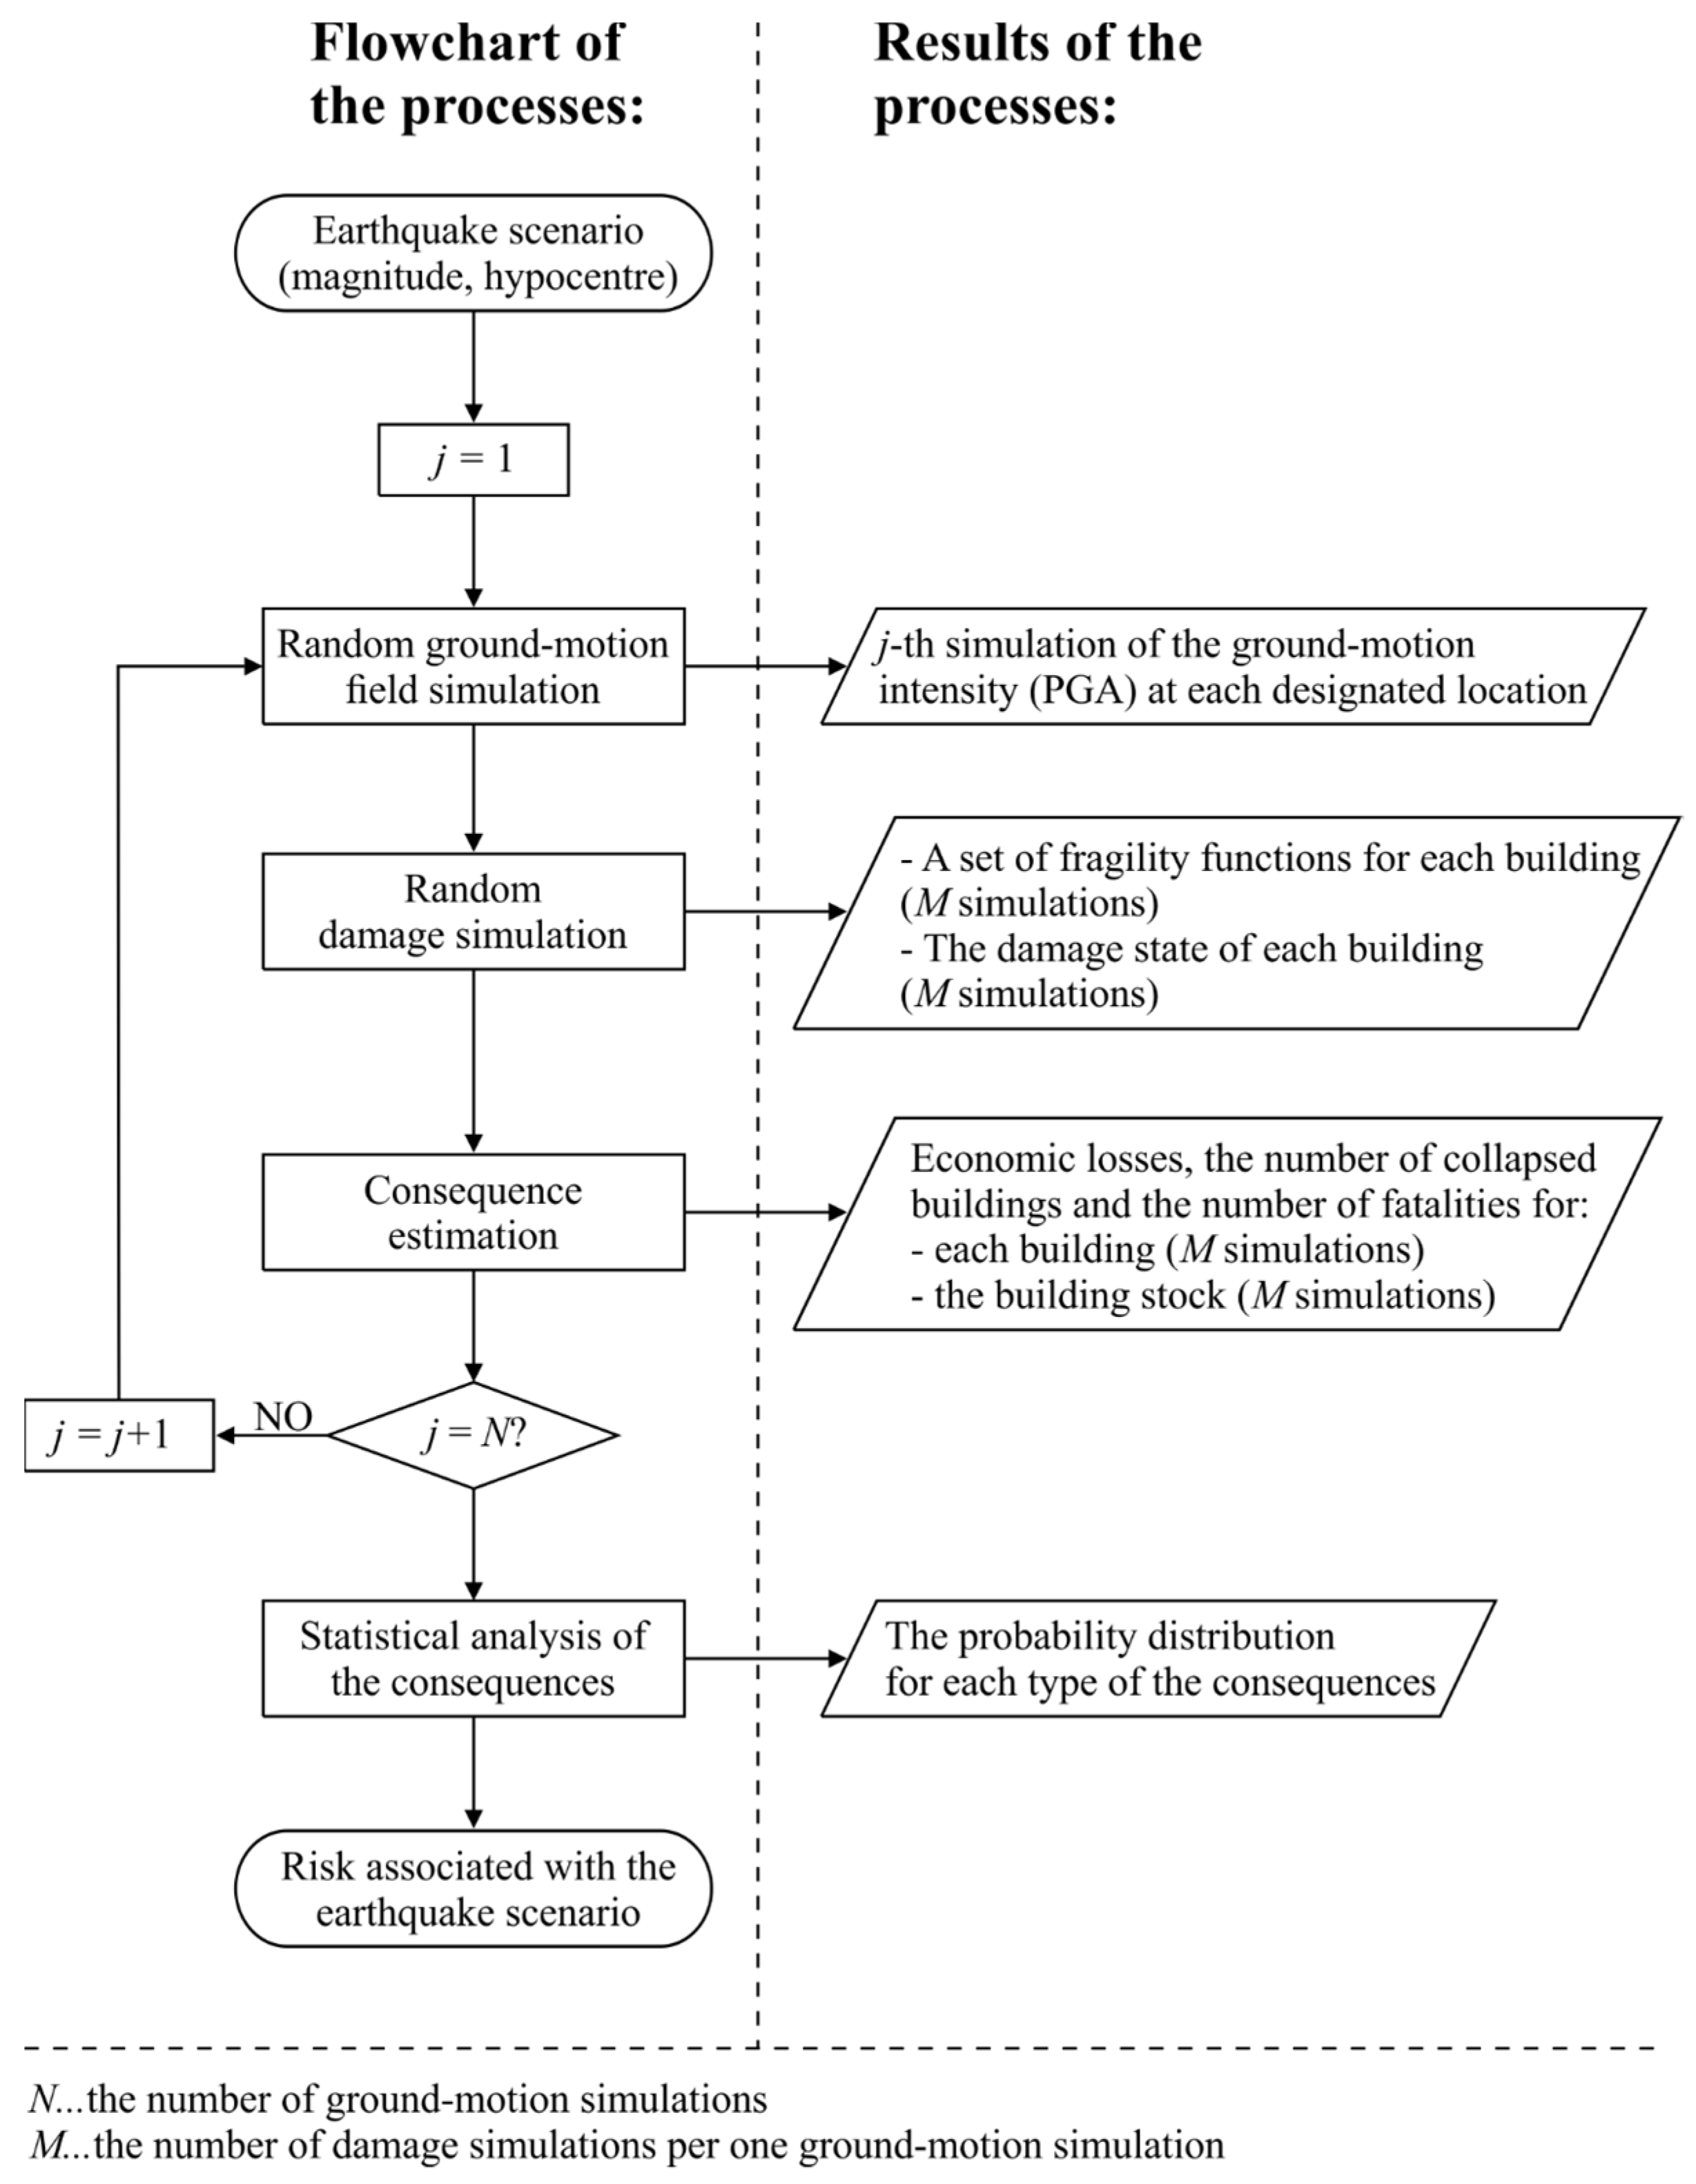
4. Scenario-Based Seismic Risk Assessment Methodology

The term “scenario-based” in this paper indicates that the methodology enables the assessment of seismic risk for a particular earthquake scenario that is defined by earthquake magnitude and hypocenter. Thus the “scenario-based methodology”, as used in this paper, has different meaning than in the case of a functional, probabilistic-based approach that is adopted from two-level factorial design [40].
The methodology for scenario-based seismic risk assessment of building stock, as considered in this paper (Figure 4), is consistent with general seismic risk assessment methodology [41], but the methodology was realised in a way that followed the course of events during an earthquake. The earthquake scenario was characterised by the earthquake magnitude and hypocenter. A spatial ground-motion model was then used to simulate the ground motions at the locations of buildings (Section 4.1). The ground-motion simulation was followed by the damage simulation. The damage of each building was characterised by a damage state starting from the state of minor to no damage to the state of complete damage. The building damage state was simulated based on the building stock fragility model (Section 4.2). Then, the consequences of the earthquake were determined for each separate building and at the level of the building stock (Section 4.3). The consequences were determined in terms of the direct economic losses, the number of collapsed buildings, and the number of fatalities. The ground-motion model and the damage model were considered uncertain. Thus, the ground motions and the damage states of the buildings were simulated many times, which then allowed for the quantification of the effects of uncertainties on the consequences.

4.1. The Ground-Motion Model

For the simulation of ground-motion fields, the framework introduced by Weatherill et al. [42] was used in conjunction with the Bindi et al. [43,44] ground-motion prediction equation, which is based on the moment magnitude, location of the hypocentre, and other fault parameters. The ground-motion model accounts for the between- and within-event variability of ground motions:
ln Y i , j = ln Y ¯ i + τ η j + σ ε i , j ,
where Y i , j is the ground-motion intensity simulated at location i for the j-th realisation of the earthquake scenario, Y ¯ i is the median ground motion at location i, τ η j represents the ratio between the median ground-motion intensity and the simulated ground-motion intensity for the j-th realisation of the earthquake (i.e., the between-event residual), and the term σ ε i , j is the ratio between the simulated ground motion at location i of the j-th earthquake realisation and the median ground motion at location i (i.e., the within-event residual). The between- and within-event residuals depend on the between- and within-event standard deviations τ and σ , which are multiplied to independent random variables with a standard normal distribution η j and ε i , j , respectively. The within-event residuals are affected by the spatial correlation between random variables ε i , j at different locations. This spatial correlation is incorporated into the model in order to account for the similarity of the ground motions at locations close to one another. In the past, many different models of spatial correlation between the ground motions have been developed. We used the model proposed by Jayaram in Baker [45].
The ground motions were simulated for the peak ground acceleration (PGA) at the rock level. The area was discretised into cells of 0.5 × 0.5 km. A constant value of the PGA at the rock level was assigned to all buildings within one cell for a given realisation of the ground-motion field, which was, in addition to the magnitude and hypocentre, affected by the length and area of the activated fault [46]. However, the PGA at the rock level was adjusted by the soil amplification factor based on the draft of the new Eurocode 8 [47]. For this purpose, a building-specific soil type map for the building stock was developed, as it has been shown that damage caused by earthquakes and soil amplification factors are correlated [48].

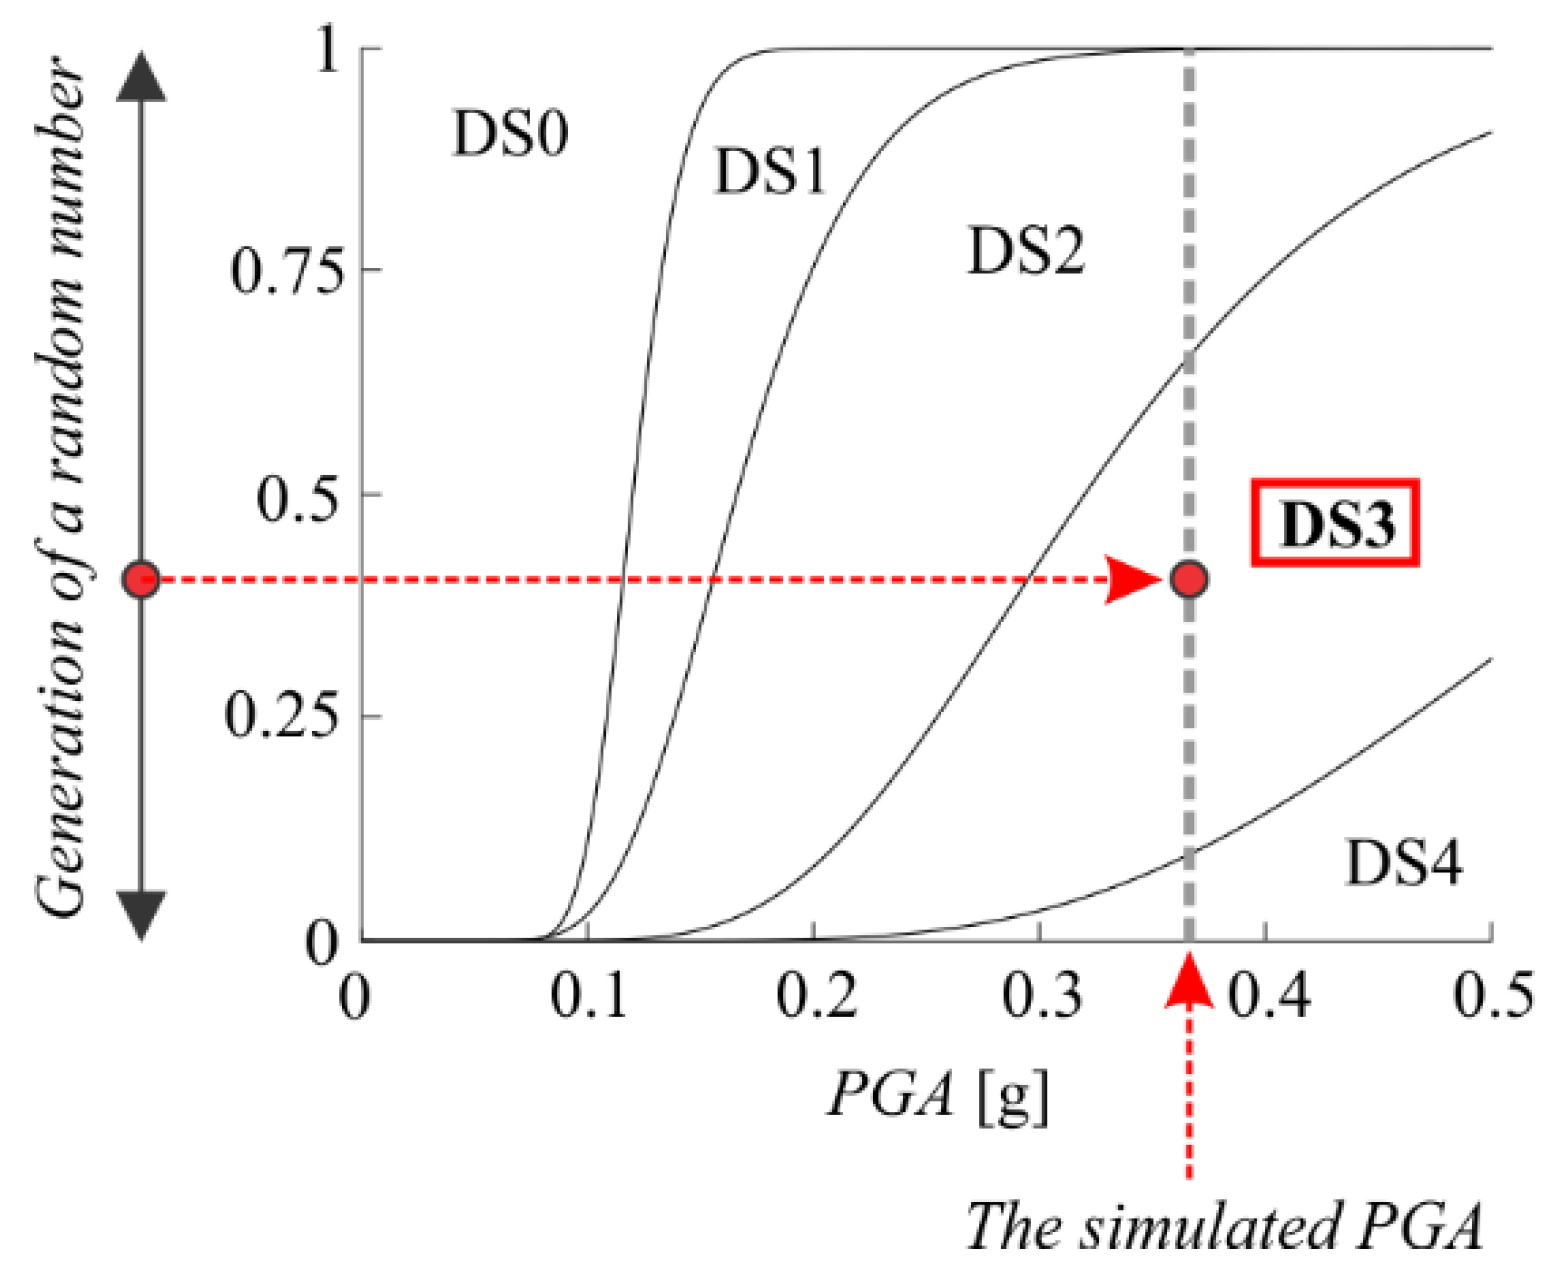
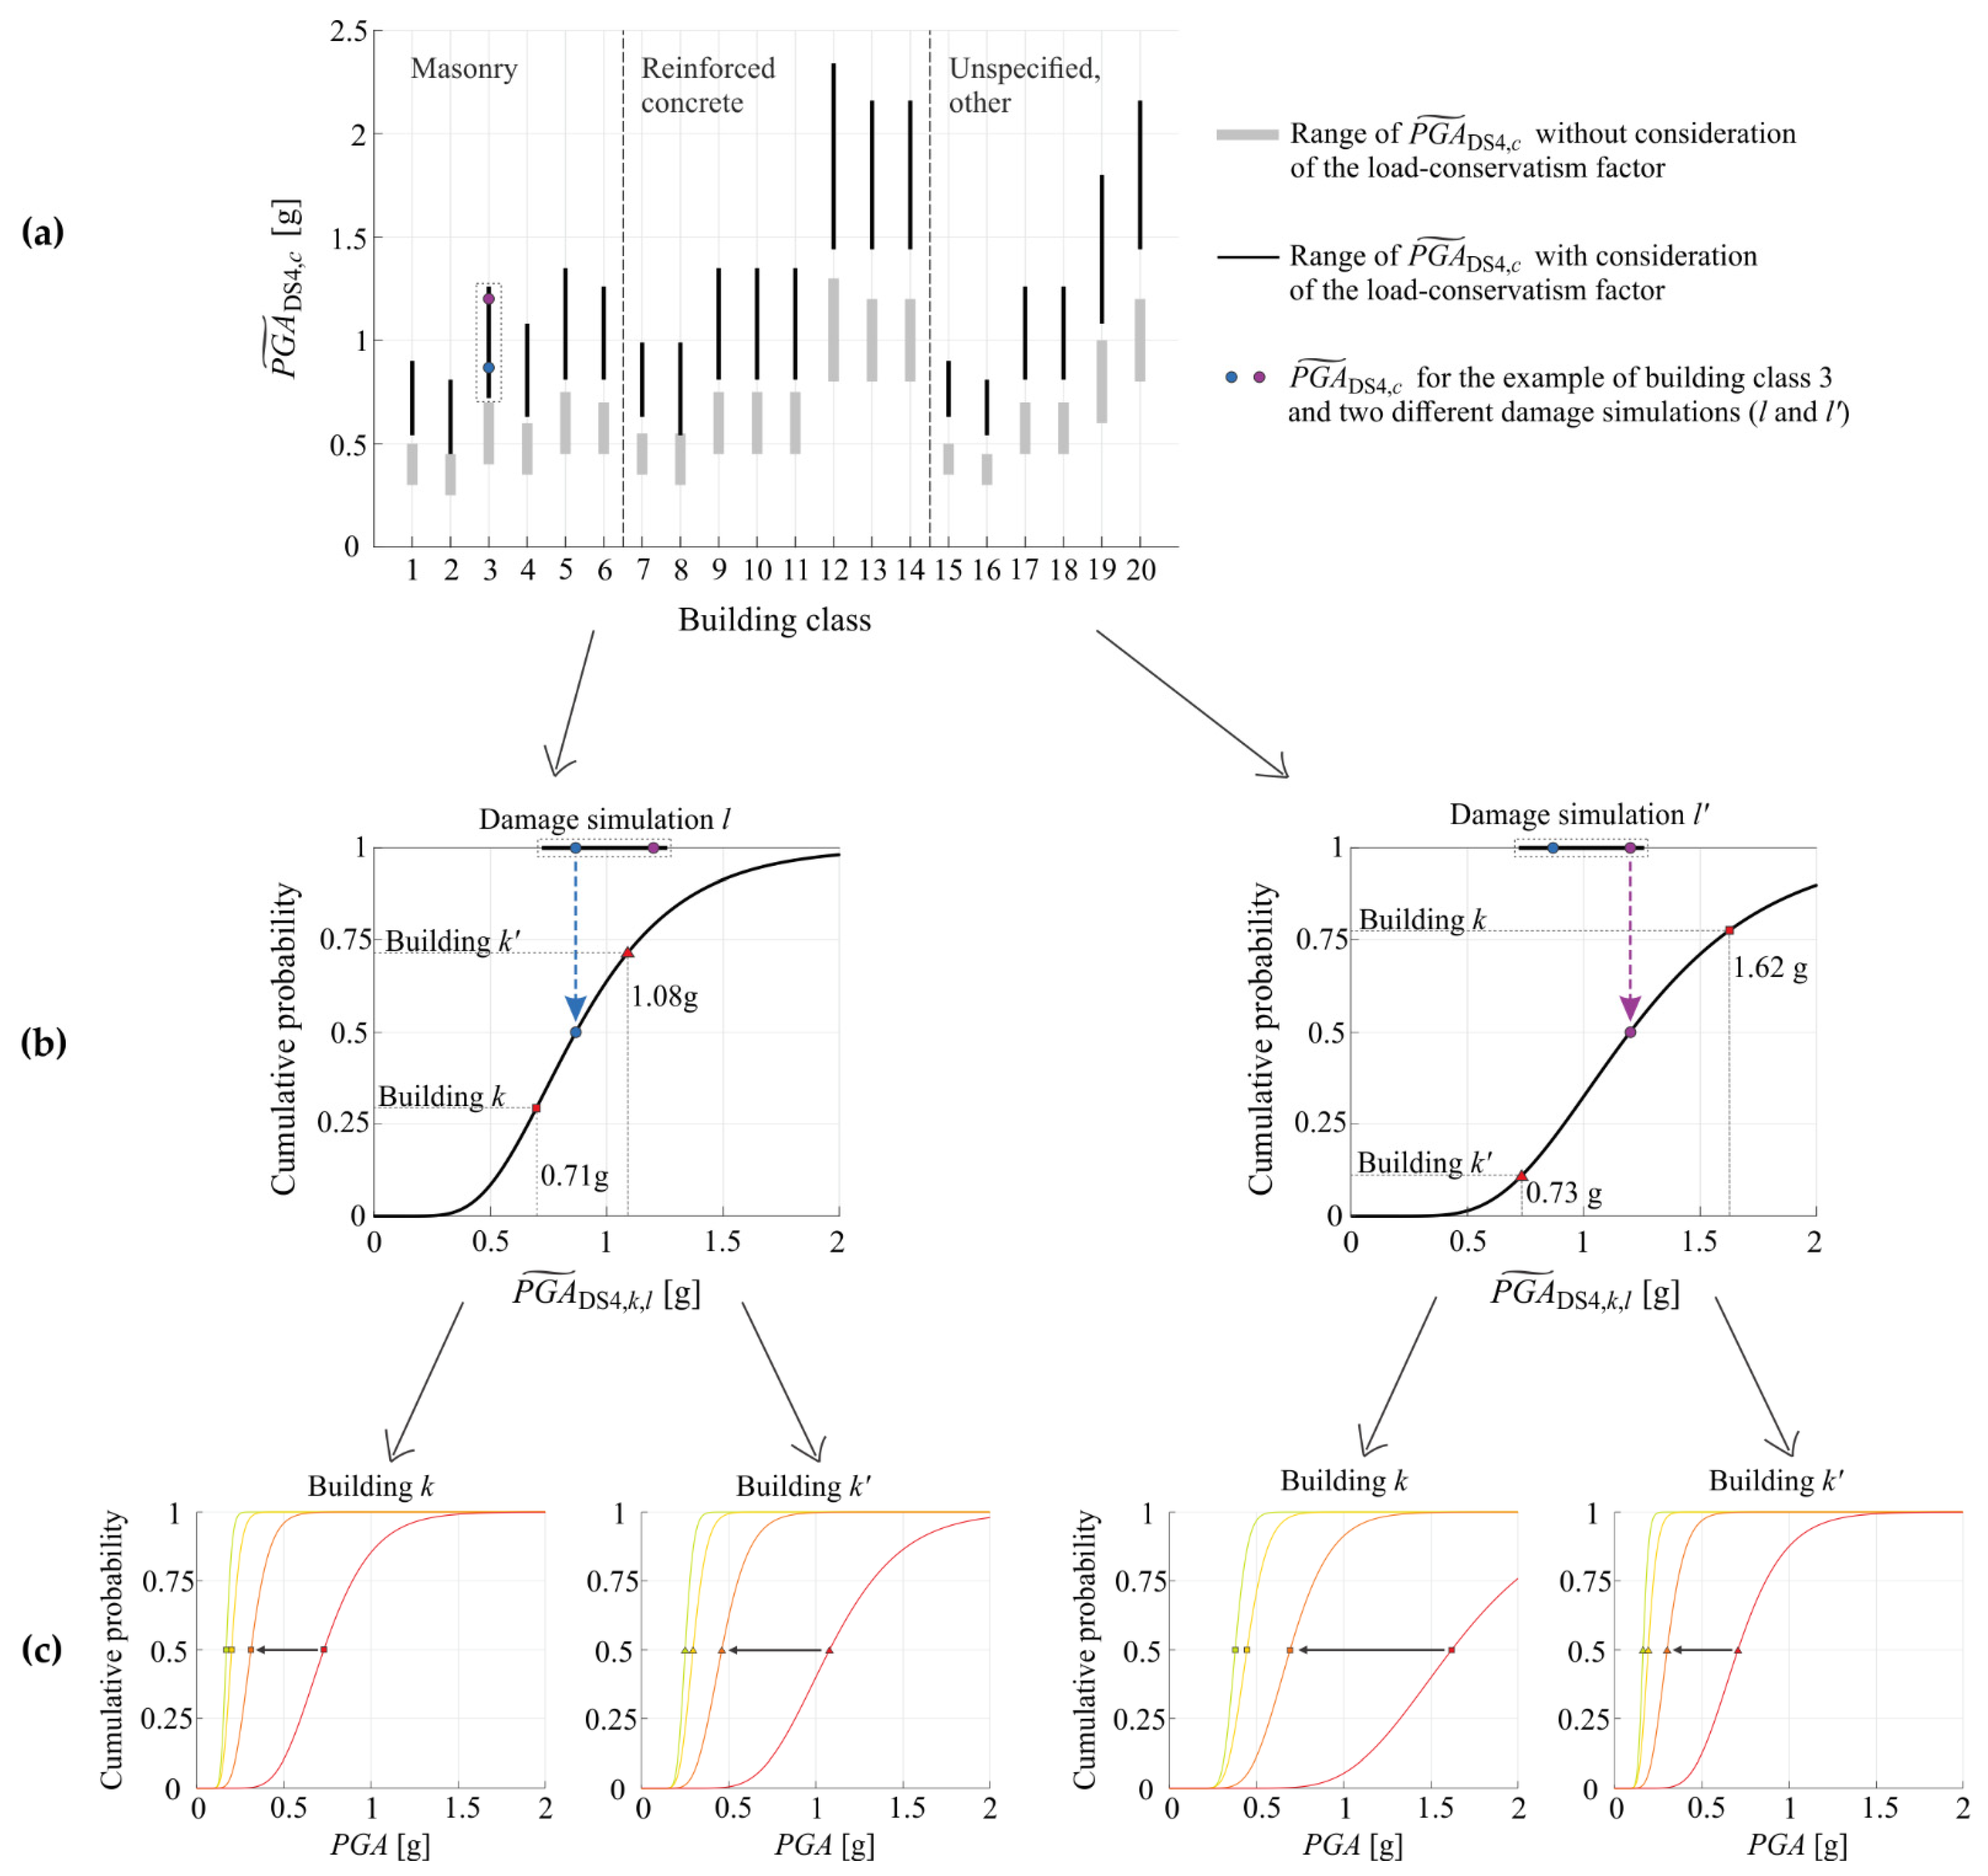
4.2. The Damage Model

The damage model depended on the stochastic building stock fragility model and the stochastic ground-motion model. The fragility functions were simulated at the building level with consideration of the effects of uncertainty of fragility at the level of the building class. Five damage states were considered, representing no to minor damage (DS0), slight damage (DS1), moderate damage (DS2), extensive damage (DS3), and complete damage (DS4). A detailed description of the damage associated with each damage state can be found elsewhere [9]. The fragility functions were defined for the PGA in the form of a lognormal cumulative distribution function which is typically assumed (e.g., [9,49]). Based on the simulated set of fragility functions, the damage state of a building in a given simulation of fragility function and a given ground-motion field was determined by generating a uniformly distributed random number from the interval [0,1] and then through assignation of the damage state, as shown in Figure 5.
The simulation of fragility functions of buildings was performed in two stages: at the level of building class and at the level of individual buildings. At the building class level, the uncertainty in the fragility functions was considered by randomly simulating the class-level median PGA causing DS4. This parameter is denoted as P G A ˜ DS 4 , c , l , where c represents the building class and l is the index of the damage simulation. Please note that the index of a damage simulation (l) is denoted differently than the index of a ground-motion simulation (j) (Section 4.1), because a given ground-motion simulation can be the basis for more than one damage simulation. In Figure 4, the number of ground-motion simulations is denoted as N and the number of damage simulations per one ground-motion simulation is denoted as M. Therefore, the total number of damage simulations is equal to N M.
Due to a lack of information, P G A ˜ DS 4 , c , l , was considered uniformly distributed within the bounds estimated from existing studies of similar buildings [9,49] (Figure 6a). Because of a certain level of conservatism in the fragility functions obtained from the literature, a correction factor called the load-conservatism factor was introduced and applied. It accounted for the impact of the code-based response spectrum and corresponding ground motions, which are often considered in the fragility analysis [18,19]. It was shown [50] that by using such ground motions, the median intensity causing a designated damage state can be underestimated significantly. This conservatism was eliminated approximately by the load-conservatism factor, which was estimated by means of nonlinear dynamic analyses of building-class equivalent single-degree-of-freedom (SDOF) models. The response of such SDOF models was simulated by code-consistent accelerograms [50] and hazard-consistent accelerograms that were selected from the NGA and RESORCE ground-motion databases [51,52]. The bounding values of P G A ˜ DS 4 , c , l adjusted by the load-conservatism factor are significantly increased (Figure 6a).
In the second stage, the fragility functions were fully defined at the level of individual buildings. This was done by considering the uncertainty in the fragility of buildings within the building class. First, the median PGA causing DS4 of a building ( P G A ˜ DS 4 , k , l ) was modelled by a lognormally distributed random variable centred around P G A ˜ DS 4 , c , l simulated in the first stage (Figure 6b). In P G A ˜ DS 4 , k , l , k and l are the index of the building and index of the damage simulation, respectively. The within-class uncertainty in the PGA causing DS4 was characterised by the lognormal standard deviation β DS 4 , c , which was considered equal to 0.40 [9] in the case of masonry and reinforced concrete buildings. However, for building classes 15–20 (Table 1), β DS 4 , c was increased, based on expert opinion, to 0.60 to account for the fact that the material of the load-bearing structure for most buildings in these classes is unknown. The median PGAs of fragility functions for other damage states P G A ˜ DS 1 , k , l , P G A ˜ DS 2 , k , l , and P G A ˜ DS 3 , k , l (Figure 6c) were estimated relative to P G A ˜ DS 4 , k , l with consideration of the damage-state PGA ratios from [9]. However, it was also considered that less severe damage states correspond to lower ductility demand and thus lower values of the load-conservatism factor. Lastly, the lognormal standard deviations of fragility functions defined at the building level were determined. For this purpose, the model developed in [53] was used to obtain the lognormal standard deviations of the DS4 fragility function ( β DS 4 , k ). The lognormal standard deviations for other damage states β DS 1 , k , β DS 2 , k , and β DS 3 , k were then calculated according to [54].

4.3. The Consequence Model

The consequence model supported the estimation of (direct) economic losses, number of collapsed buildings, and number of fatalities for each simulation of building damage. The direct economic losses for k-th building and l-th damage simulation L k , l were modelled as:
L k , l = c k , l · A k · C R ,
where A k is the net floor area of the k-th building and c k , l is the ratio between the DS-dependent repair/reconstruction cost and the estimated reconstruction cost per m2 of the net floor area, denoted as C R . The ratio c k , l depended on the damage state of the k-th building from the l-th damage simulation. This was equal to 0.02, 0.1, 0.4, and 1.0 for damage states from DS1 to DS4, as recommended in [9]. The net floor areas A k were obtained from the Real Estate Register [26] (Section 3.1). The average new construction cost 1100 EUR/m2 of the net floor area (inclusive of VAT) [55] was considered as the base cost to define C R . This cost was then increased to estimate the reconstruction cost C R = 1100 EUR/m2 of the net floor area (inclusive of VAT). A 13.5% cost increase was estimated from the literature [56,57,58]. The total direct economic losses for the l-th damage simulation were determined as the sum of L k , l over the entire building stock.
The number of collapsed buildings was determined as a portion of buildings reaching the complete damage state (DS4). The ratio between the number of collapsed buildings and buildings reaching DS4 was considered dependent on the material of the load-bearing structure and number of storeys, according to [9]. This varied from 5% to 15%. Therefore, the number of collapsed buildings in a given damage simulation was first determined for each building class. By summing up the numbers of collapsed buildings of all building classes, the number of collapsed buildings was then determined at the level of the building stock.
The number of fatalities F k , l in the k-th building and l-th damage simulation was determined as follows:
F k , l = O k , l · λ f , k · N P , k ,
where O k , l is the Boolean variable, which takes the value of 1 in the case of the building’s collapse and 0 otherwise, λ f , k is the fatality rate due to collapse of the k-th building, and N P , k is the number of people inside building k. The value of O k , l was determined by randomly generating a subset of collapsed buildings from all buildings reaching DS4 within a given building class. The size of the subset of collapsed buildings in the l-th damage simulation was equal to the number of collapsed buildings within the given building class determined in the l-th damage simulation. The fatality rate λ f , k in general depends on many parameters, such as the type of structural system, the material of the structure, and the building height [59]. However, in the case of conventional structural systems common for Slovenia, λ f , k is close to 0.10. Therefore, the value of 0.10 was considered in this study. The same value was assumed also in [18], where a simplified version of the fatality rate model by Zuccaro and Cacace [60] was applied. Moreover, N P , k was estimated by considering the equivalent annual occupancy model [61], which allows the obtaining of the yearly average number of people in a building based on the building’s purpose, surface area, and number of permanently registered residents [27]. Finally, the number of fatalities in the l-th damage simulation F l was determined as the sum of F k , l over all buildings.

5. Consequences of the 1895 Ljubljana Earthquake on the Current Building Stock

The 1895 Ljubljana earthquake occurred on Easter Sunday, 14 April, at 23:17 local time [2]. The magnitude of the earthquake was estimated to be ML = 6.1 [62] and the EMS intensity was estimated between VIII and IX. The epicentre was estimated at 46.1° N and 14.5° E, which is approximately 5 km north of Ljubljana downtown, at a depth of about 16 km [62]. The shock was reportedly felt in Vienna (Austria), Assisi and Florence (Italy), and Split (Croatia). The largest damage was caused within the radius of 18 km from the epicentre. At the end of 19th century, Ljubljana’s population was about 31,000, with around 1400 buildings. About ten percent of the buildings were damaged or destroyed and about 10 people died [63]. Since then, the building stock and the population around Ljubljana have increased substantially.

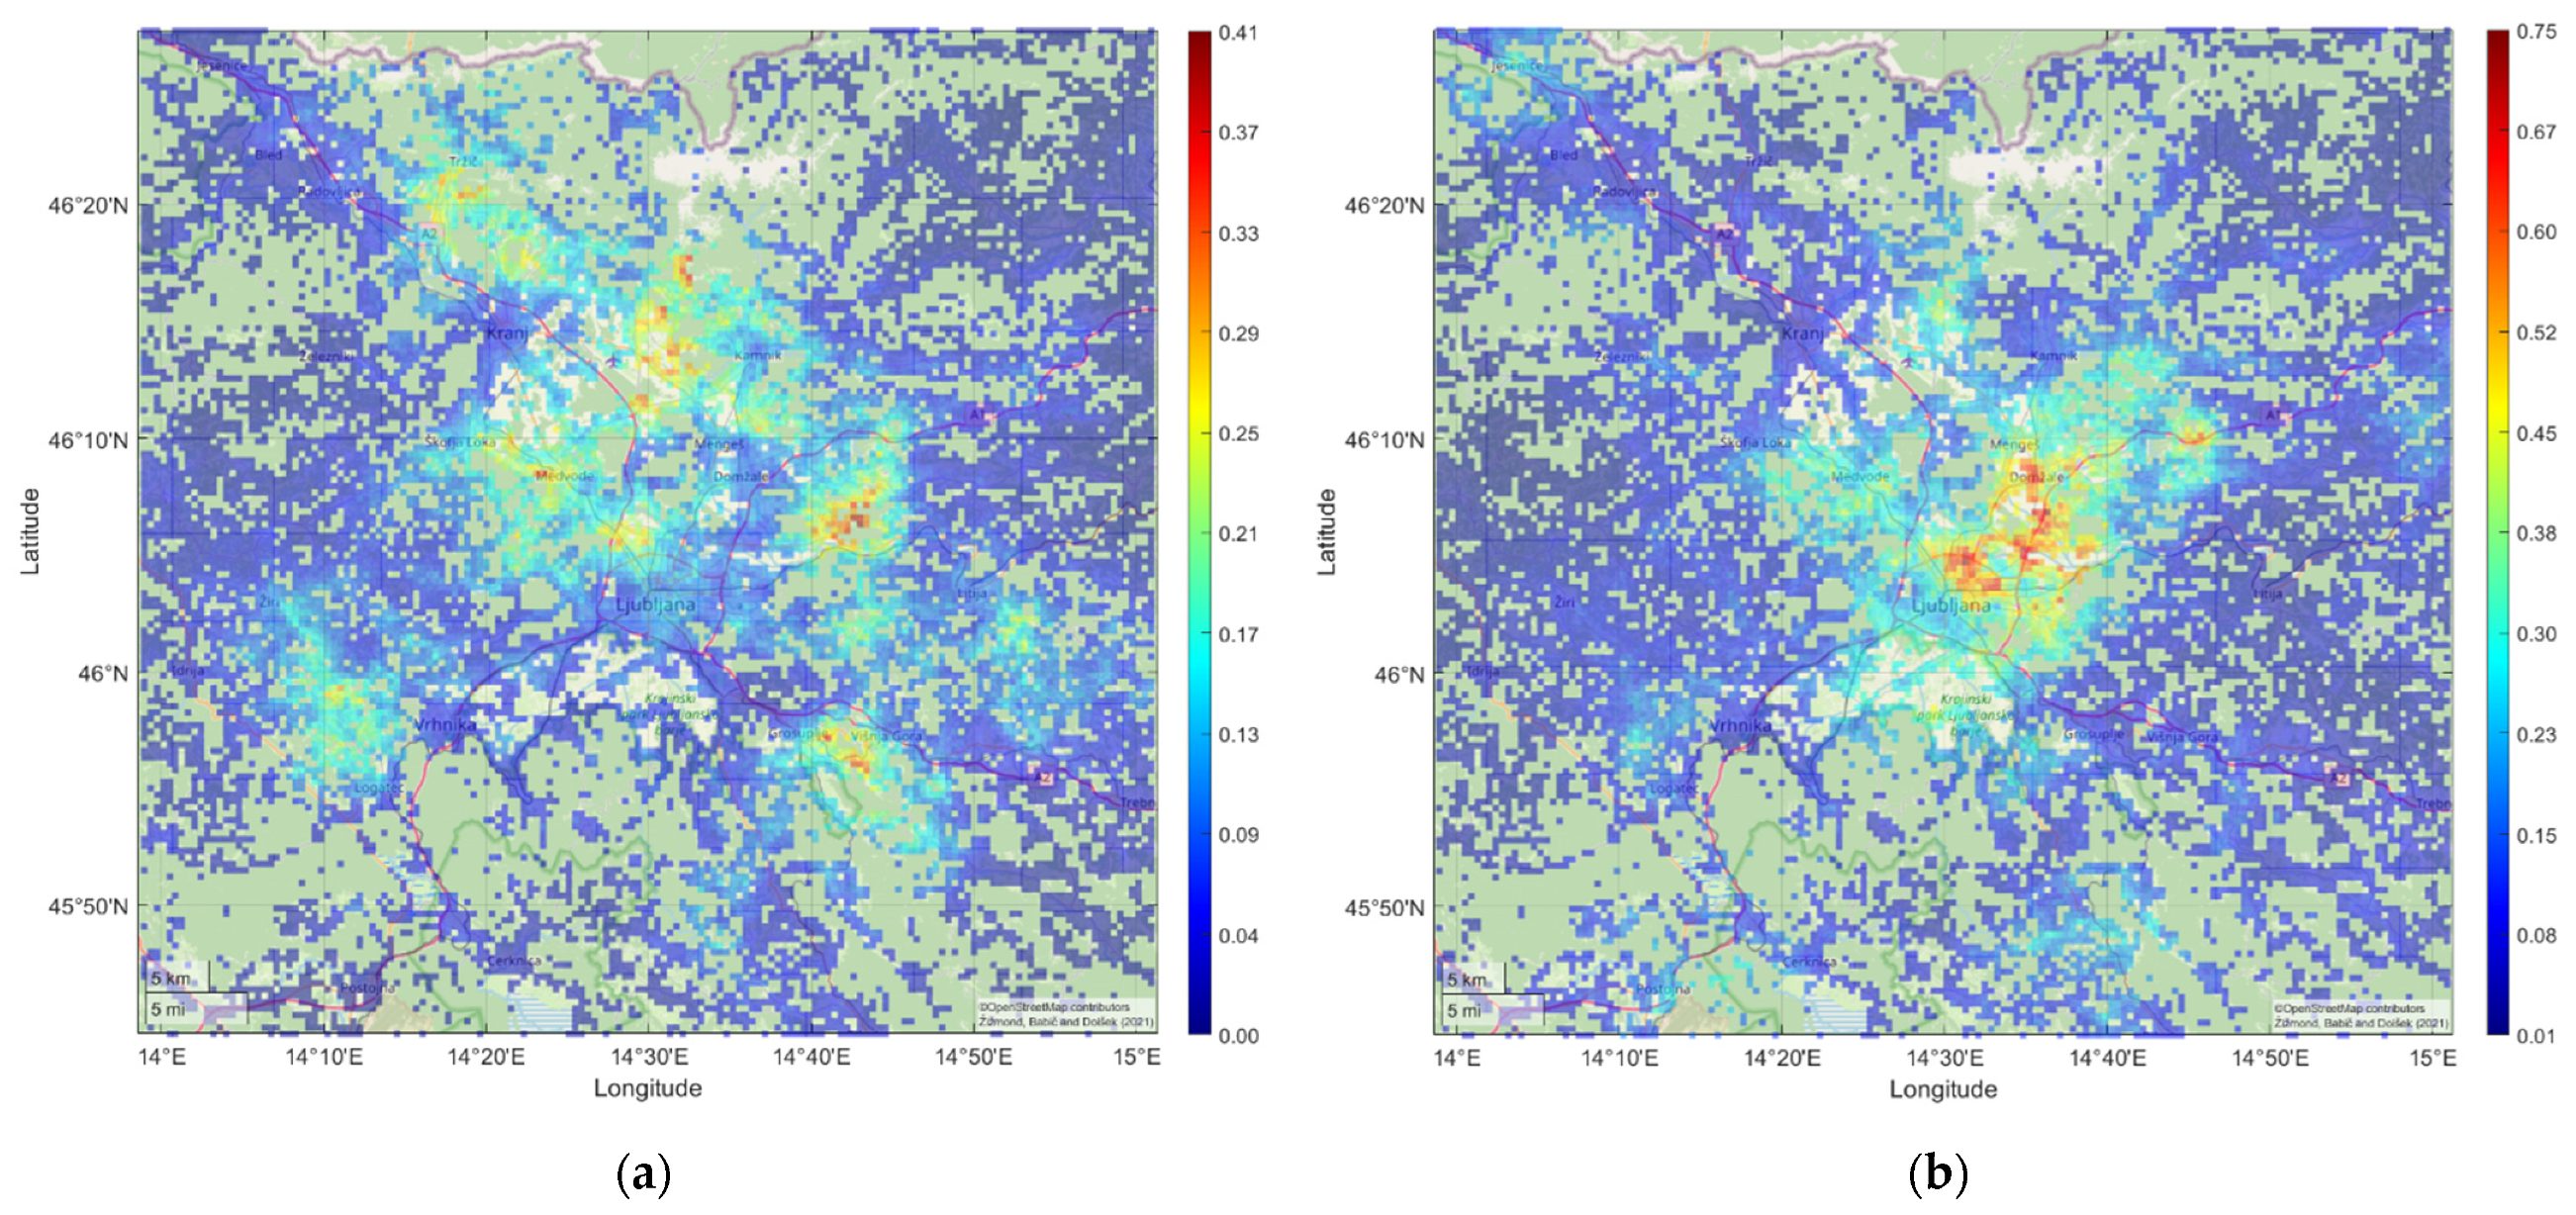
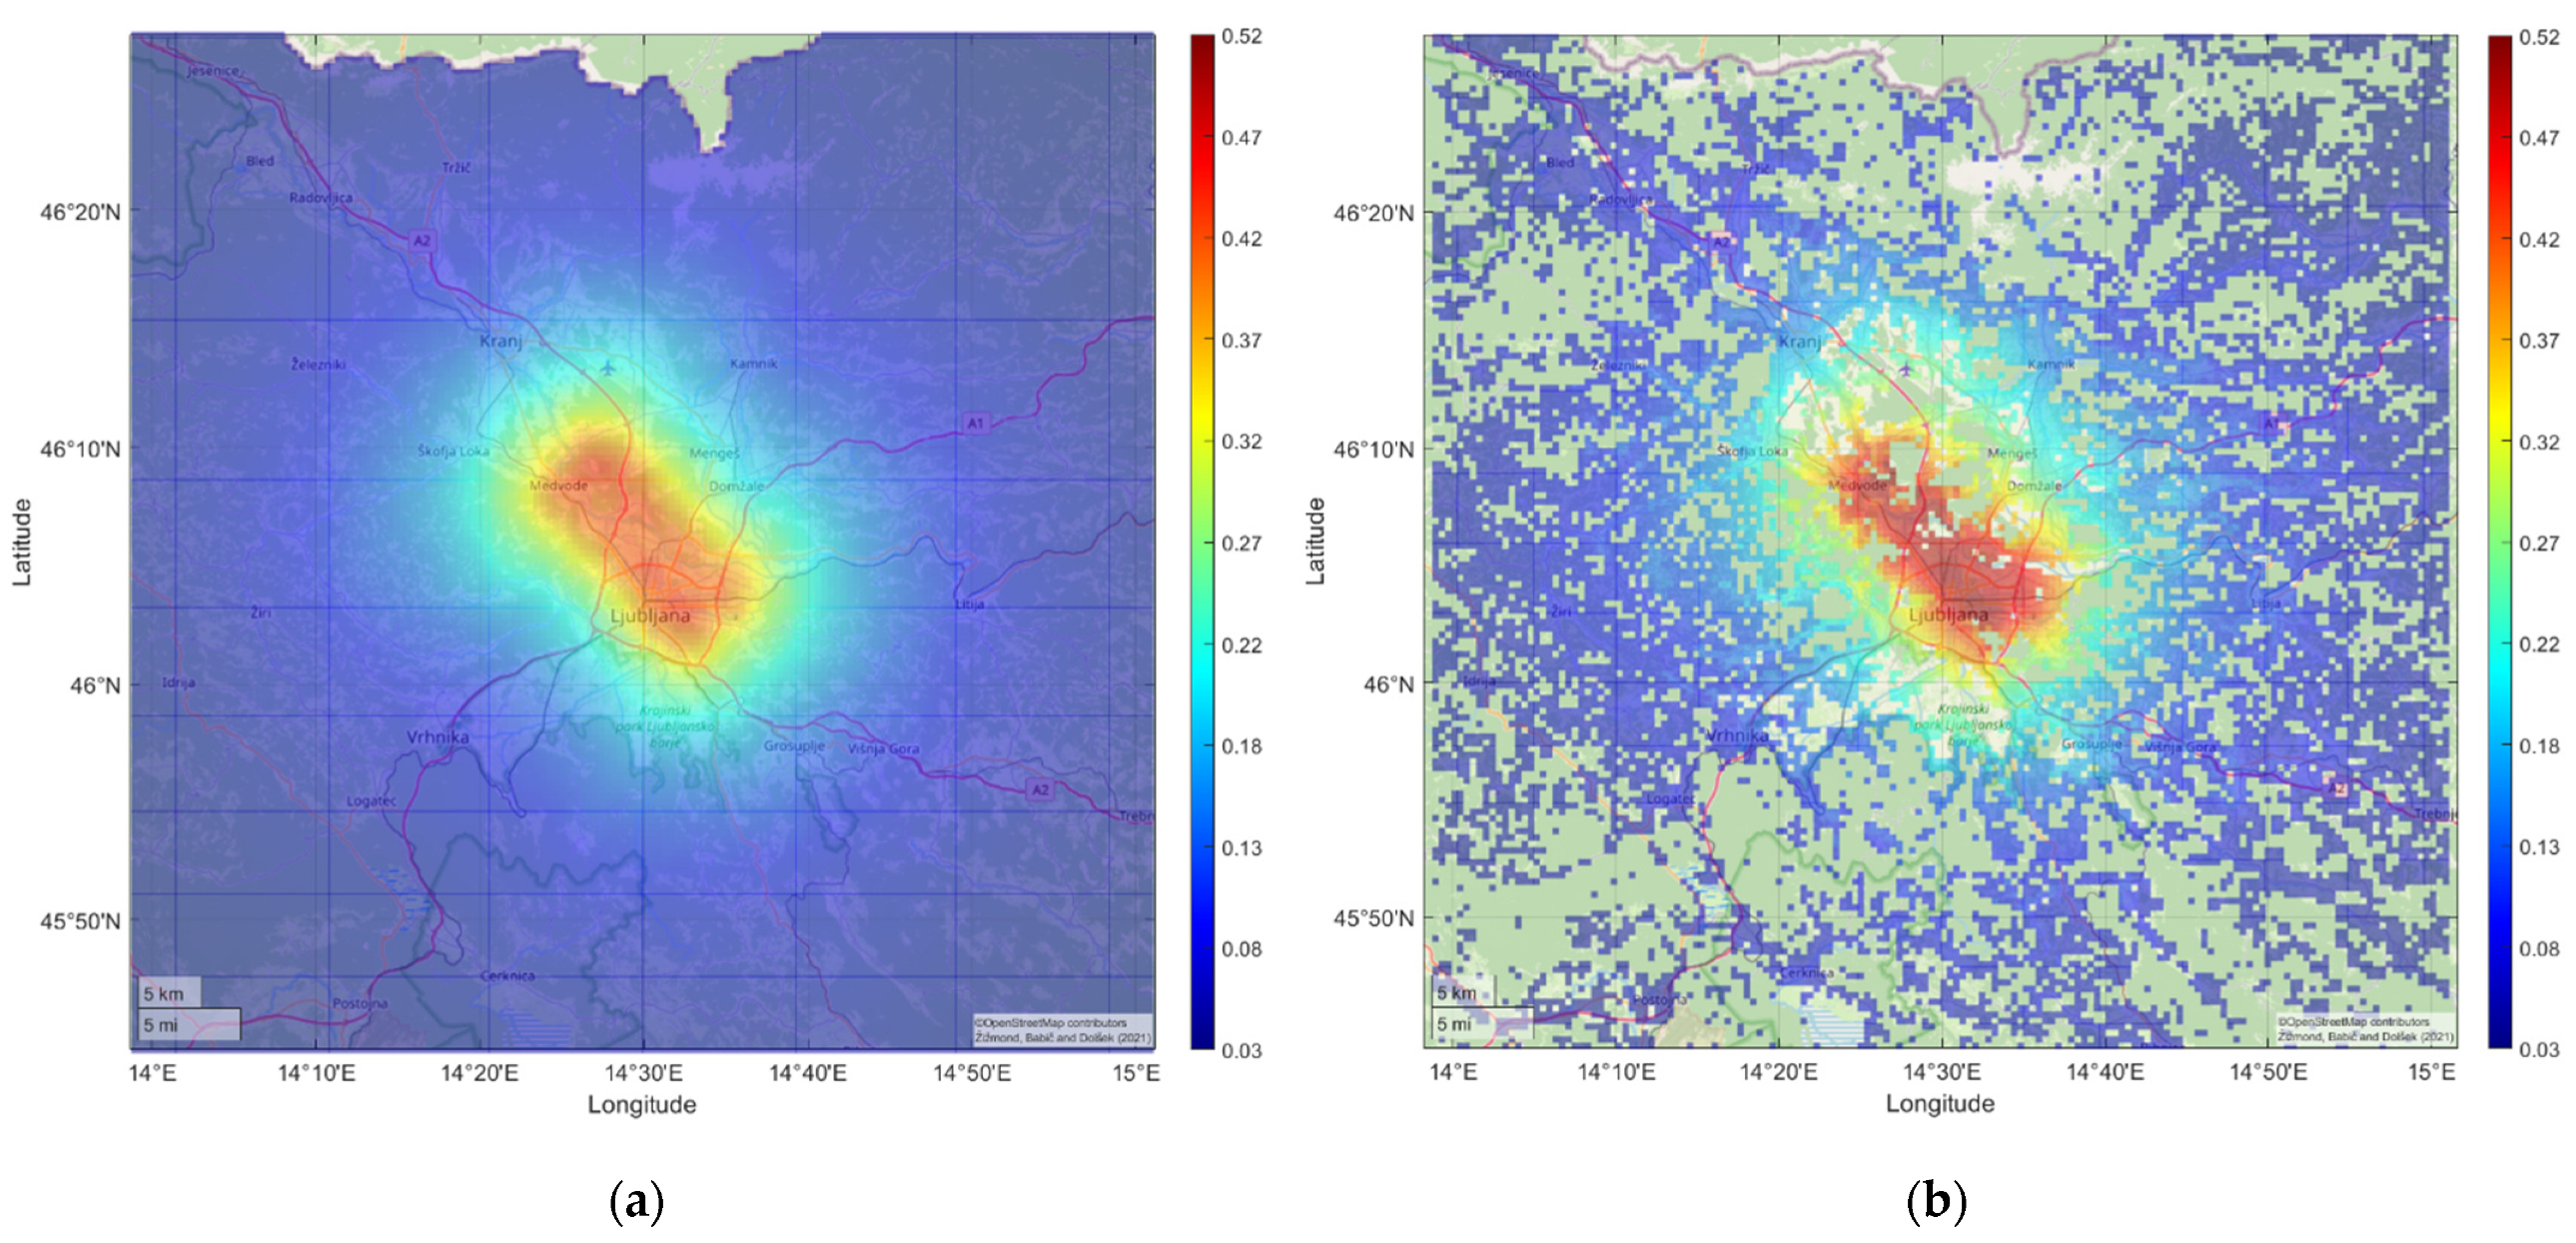
5.1. Simulation of Ground-Motion Fields in Terms of PGA

For the purpose of the ground-motion simulation based on [43,44], the local magnitude ML = 6.1 was converted to moment magnitude Mw = 6.2 according to [64]. The earthquake epicentre was set to 46.1° N and 14.5° N, and the hypocentral depth was considered equal to 16 km [2]. The best estimate of the Žužemberk fault parameters (strike = 315°, dip = 80°, rake = 160° [65]) was considered. It was assumed that the hypocenter is at the centroid of the fault surface, the length and area of which were estimated according to the model of Leonard et al. [46].
Ground-motion fields for PGA at the rock level were simulated 500 times, in order to account for ground-motion model uncertainties. In Figure 7, the realisation of two ground-motion fields is presented. The ground-motion fields in Figure 7a,b approximately correspond, respectively, to the 5th and 50th percentile of economic losses, which are presented later in Section 5.2. A large difference in the ground-motion fields can be observed, which implies that the uncertainties in the ground-motion intensities can greatly affect the variability of the consequences.
The average values of PGA at rock and surface level for all 500 simulations of ground-motion fields are presented in Figure 8. It can be seen that the average PGA at the rock level above the rupture area is approximately uniform. By moving away from the projection of the rupture area, the values of PGA decrease according to the ground-motion model. However, the local soil condition (Figure 8b) increases the average PGA at the surface of almost all the cells as there are only a few sites in the investigated area that are classified as rock or rock-like sites (soil type A, according to [66]).
The portion of the building stock exposed to the ground-motion effects is relatively large. About 30% of the characteristic building stock (165,000 buildings) is located within 35 km from the projection of the fault rupture area to the surface. In this area, the PGA is expected to exceed 0.05 g, which is about the threshold at which building damage starts to develop [58,67]. The real estate value of the exposed building stock is approximately 47 billion EUR. The exposed area is populated by 747,000 people, which is more than one-third of the population of Slovenia. About 31% of the exposed buildings were built before 1965, 29% between 1965 and 1981, and 40% after 1982. The population in these building classes is quite uniformly distributed. Buildings built before 1965, between 1965 and 1981, and after 1981, are occupied, respectively, by about 221,000, 252,000, and 274,000 people.

5.2. Simulation of Building Stock Damage and Consequences

For each of the 500 ground-motion fields, 20 sets of fragility functions for each building were simulated. Consequently, the size of the damage sample, as well as that of the consequence sample, of each building was equal to 10,000.
The spatial distribution of the building stock damage for the selected damage simulations is presented in Figure 9. Due to the resolution limitation, the damage state is not presented for each building separately. Rather, an average damage of the buildings for cells of 0.25 × 0.25 km is calculated and presented on the map. The damage maps presented in Figure 9a,b were obtained based on the ground-motion fields from Figure 7a,b and approximately correspond to the 5th and 50th percentile of economic losses, respectively. It can be observed that the damage maps based on the average building stock damage within cells are significantly different. In Figure 9a, the average damage exceeds DS3 for only a few cells, while the average damage presented in Figure 9b is close to DS4 for many cells in the north-east of Ljubljana downtown. It is interesting to note that the differences in damage and, consequently, the losses are due to the effect of both the between- and within-event ground-motion residuals. Due to the effect of the within-event residual, the highest values of PGA occur in different areas. In the case of the simulation corresponding to the 5th percentile of economic losses, PGA is the highest on the outskirts of Ljubljana (Figure 7a), where the building density is very low. However, in the simulation corresponding to median economic losses, the highest PGA can be observed in Ljubljana downtown (Figure 7b), where the exposure is much higher.
Due to the uncertainty of the ground-motion and damage models (see Section 4.1 and Section 4.2), the numbers of buildings in different damage states are presented (Table 2) for three percentile values (5th, 50th (median), and 95th percentile). Most of the buildings are expected to be in DS2 (i.e., between 17,000 to 48,000, with a median of about 34,000), whereas the number of buildings in DS4 is expected to be between 318 and 24,000 with the median of about 4700. The median number of collapsed buildings was estimated to be 674. The direct economic losses were estimated between 1.7 and 22.3 billion EUR, with a median loss of 7.9 billion EUR. The median number of fatalities was estimated to be 338, while the fatalities for a 90% confidence level were observed in the interval between 19 to 1820. Approximately 70% of fatalities and 50% of economic losses are expected to occur in buildings built before 1965.
The very large difference between the 5th and 95th percentile is mainly the consequence of uncertainties in the ground-motion field. In order to quantify the effect of these uncertainties, the analysis presented in Section 5.1 was re-performed by setting the within- and between-event residuals (see Equation (1)) to zero. Consequently, one ground-motion field instead of 500 was taken into account. It consisted of the ground-motion intensities obtained with the median ground-motion model ( Y ¯ j in Equation (1)). Note that the median ground-motion field is similar to that presented in Figure 8 but with slightly lower PGAs.
The results of the simulation are shown in Table 3. The median direct economic losses (6.6 billion EUR) are slightly lower than those obtained with consideration of the ground-motion uncertainties (Table 2), which is the expected result. The same trend can be observed for the number of fatalities and the number of buildings in damage states DS3 and DS4. On the other hand the number of buildings in DS1 and DS2 increased, which was also expected. However, more importantly, the dispersion of the consequences measured by the 90% confidence interval is significantly decreased. The 5th and 95th percentile values are much closer to the median values, which indicates that the greatest source of uncertainty of consequences corresponds to the ground-motion field uncertainty. However, because historical earthquakes cannot be defined precisely, the scenario-based seismic risk assessment should be assessed with consideration of between- and within-event residuals.

6. Discussion and Conclusions

The investigated region is particularly vulnerable because of the high concentration of buildings and people. In an earthquake with Mw = 6.2 and the epicentre at a critical location, 165,000 buildings and 747,000 people would be exposed to detrimental ground-motion effects if assuming that the latter can occur at the peak ground acceleration higher than 5% g. The consequences of the simulated earthquake event would be catastrophic for the Republic of Slovenia, due to the high expected number of fatalities and very high direct economic losses. Thus, the Republic of Slovenia is not resilient to strong earthquakes.
From an earthquake consequence point-of-view, Slovenia is very likely amongst the most exposed member states of the European Union. This conclusion is not the result of extremely strong historical earthquakes in Slovenia or an extremely fragile building stock, but rather the consequence of the limited resources of the Republic of Slovenia. A simple analysis of the results of the effects of the considered earthquake indicates that a strong earthquake could cause direct losses of more than 15% of the GDP of the Republic of Slovenia, if we take into account the median economic loss of 7.9 billion EUR and the GDP from 2019 according to the data of the Statistical Office of the Republic of Slovenia (48 billion EUR). Such losses would be without doubt catastrophic and probably associated with a very long recovery period. For a better understanding, the median losses can be compared to those observed in Italy after the 2009 L’Aquila earthquake. According to Wikipedia, the L’Aquila earthquake caused losses of 16 billion USD, however Italy’s GDP in 2019, according to Google, amounted to 2191 billion USD. The losses of the catastrophic L’Aquila earthquake, which had a slightly larger magnitude than that estimated for the 1895 Ljubljana earthquake, amounted to 0.7% of the GDP of the Republic of Italy. We can thus conclude that the earthquake consequence in terms of economic losses relative to the GDP of the Republic of Slovenia would be about 20 times greater than that based on the GDP of the Republic of Italy. However, Italy has not yet succeeded to fully recover the affected area hit by the 2009 L’Aquila earthquake. The recovery time in Slovenia would be significantly longer, not only due to limited financial resources but also due to other resources in Slovenia.
Fortunately, there have been no earthquakes in the Republic of Slovenia in the last seventeen years to cause such damage. However, due to the information provided by the seismic stress test of the building stock in Slovenia [19] and the recent catastrophic earthquakes in the vicinity of Slovenia (Italy, Croatia, Albania), the awareness about seismic risk is growing, and the community position for establishing preventive actions to enhance seismic resilience is strengthening too.
There are two fundamentally different approaches to addressing the problem. The first approach is to speculate and wait until the building stock is replaced naturally. Such an option is against sustainable development goal No. 11 of the United Nations, which foresees that we have to make cities and human settlements inclusive, safe, resilient, and sustainable. The unsustainability of inaction is also indicated by the seismic stress test of the building stock in Slovenia, which utilized time-based seismic risk assessment [19]. The seismic stress test outcome showed that about 90–230 thousand human lives in Slovenia are dangerously exposed to earthquakes in the long term. The second approach for addressing the problem is to act in agreement with the sustainable development goal, which means establishing and realising plans for enhancing community seismic resilience before a strong earthquake hits Slovenia. Triggering this process is very challenging, because the necessary condition for it is the community’s awareness of a too high seismic risk.
Currently, Slovenia has no law regulating the responsibility of owners for the seismic risk, which is largely related to rare earthquake events with catastrophic consequences for the owners and community. Most of the owners expect that the complete solidarity of the community will be established after a strong earthquake and that this is the optimal option to address the problem. Such a belief is false. It is based on the assumption that the government will take care of the renovation or replacement of damaged buildings with help from others. Even if the complete solidarity of the community is established after a strong earthquake, it can be argued that the recovery time will be far too long, and societal wellbeing will be insufficient for decades in the area affected by the strong earthquake. Another issue is that the complete solidarity of the community after a strong earthquake is not equitable to the owners who invested in new construction or building strengthening prior to the earthquake due to their awareness of seismic risk. Thus, the concept of the complete solidarity of the community after an adverse event is not the solution but the main obstacle that prevents the establishment of a value system in relation to seismic risk prior to a major earthquake. Without the value system of seismic risk, the owners’ interest in strengthening the seismic resistance of their buildings and consequently enhancing the community seismic resilience cannot be established.
The simulation of consequences of a rare earthquake event can thus present a key step to disseminate information about the outcomes of strong earthquakes within the community and establish risk awareness. We had the opportunity to present the results of this study to the Ministry for the Environment and Spatial Planning and in the Slovenian parliament at the 37th meeting of the Committee on Infrastructure, Environment, and Spatial Planning, and have disseminated it to other stakeholders and decision-makers in the past year. Based on the argument that we have to react prior to a strong earthquake, which some other invited experts also supported, the Committee on Infrastructure, Environment, and Spatial Planning of the National Assembly of the Republic of Slovenia unanimously decided that the Government of the Republic of Slovenia must prepare a resolution on enhancing the seismic resilience of Slovenia by the end of 2021. Hopefully, the resolution and other actions from the seismic stress test [19] suggested to the Government will provide enough information to realise that sustainable development in Slovenia is impossible without enhancing community seismic resilience.
It should be noted that the scenario-based seismic risk assessment methodology, as realised for the purpose of seismic stress test of building stock in Slovenia [19], can be further improved. The main limitations of the methodology are related to the lack of building stock data and the ground-motion model, which are affected by more parameters than those considered in the study. Thus, it was suggested that the Government establish a system for building stock data collection, which could in the future, for example, provide more data to develop a comprehensive building stock damage model. Because it is expected that the seismic stress test will be executed periodically, all other novelties developed between two consecutive tests will be automatically included in the seismic stress test.

Author Contributions

Conceptualization, A.B., M.D., and J.Ž.; methodology, A.B., M.D., and J.Ž.; software, A.B. and J.Ž.; validation, A.B., M.D., and J.Ž.; formal analysis, A.B. and J.Ž.; investigation, A.B., M.D., and J.Ž.; data curation, J.Ž. and M.D.; writing—original draft preparation, A.B., M.D., and J.Ž.; writing—review and editing, A.B., M.D., and J.Ž.; visualisation, A.B. and J.Ž.; supervision, M.D.; project administration, M.D.; funding acquisition, M.D. All authors have read and agreed to the published version of the manuscript.

Funding

This research was funded by the research project Seismic Stress Test of Built Environment (J2-8159) and the research program Earthquake Engineering (P2-0185) funded by the Slovenian Research Agency, and by the Ministry of the Environment and Spatial Planning of the Republic of Slovenia (GA 2550-20-530001).

Institutional Review Board Statement

Not applicable.

Informed Consent Statement

Not applicable.

Data Availability Statement

Not applicable.

Conflicts of Interest

The authors declare no conflict of interest.

References

  1. Chester, D.K. The 1755 Lisbon earthquake. Prog. Phys. Geogr. 2001, 25, 363–383. [Google Scholar] [CrossRef]
  2. Vidrih, R.; Godec, M. Ljubljanski potres leta 1895 in njegov vpliv na razvoj gradbeno-tehničnih predpisov. UJMA 1995, 231–237. Available online: http://www.sos112.si/slo/tdocs/ujma/1995/231_237.pdf (accessed on 21 May 2021).
  3. Santini, A.; Moraci, N. Seismic Engineering Conference: Commemorating the 1908 Messina and Reggio Calabria Earthquake (AIP Conference Proceedings 1020); American Institute of Physics: Melville, NY, USA, 2008; p. 2032. [Google Scholar]
  4. Di Ludovico, M.; Prota, A.; Moroni, C.; Manfredi, G.; Dolce, M. Reconstruction process of damaged residential buildings outside historical centres after the L’Aquila earthquake: Part II—“Heavy damage” reconstruction. Bull. Earthq. Eng. 2017, 15, 693–729. [Google Scholar] [CrossRef]
  5. Atalić, J.; Uroš, M.; Šavor, M.; Marija, N.; Miroslav, D. The Mw5.4 Zagreb (Croatia) earthquake of March 22, 2020: Impacts and response. Bull. Earthq. Eng. 2021. [Google Scholar] [CrossRef]
  6. Starbuck, W.H. Perspective—Cognitive Reactions to Rare Events: Perceptions, Uncertainty, and Learning. Organ. Sci. 2009, 20, 925–937. [Google Scholar] [CrossRef]
  7. Silva, V.; Crowley, H.; Pagani, M.; Monelli, D.; Pinho, R. Development of the OpenQuake engine, the Global Earthquake Model’s open-source software for seismic risk assessment. Nat. Hazards 2014, 72, 1409–1427. [Google Scholar] [CrossRef]
  8. Kohrangi, M.; Bazzurro, P.; Vamvatsikos, D. Seismic risk and loss estimation for the building stock in Isfahan: Part II—Hazard analysis and risk assessment. Bull. Earthq. Eng. 2021, 19, 1739–1763. [Google Scholar] [CrossRef]
  9. HAZUS MH 2.1. Technical Manual, Multi-Hazard Loss Assessment Methodology; Federal Emergency Management Agency: Washington, DC, USA, 2015.
  10. Farahani, S.; Behnam, B.; Tahershamsi, A. Macrozonation of seismic transient and permanent ground deformation of Iran. Nat. Hazards Earth Syst. Sci. 2020, 20, 2889–2903. [Google Scholar] [CrossRef]
  11. Farahani, S.; Tahershamsi, A.; Behnam, B. Earthquake and post-earthquake vulnerability assessment of urban gas pipelines network. Nat. Hazards 2020, 101, 327–347. [Google Scholar] [CrossRef]
  12. Felsenstein, D.; Elbaum, E.; Levi, T.; Calvo, R. Post-processing HAZUS earthquake damage and loss assessments for individual buildings. Nat. Hazards 2021, 105, 21–45. [Google Scholar] [CrossRef]
  13. Satish, D.; Prakash, E.L.; Anand, K.B. Earthquake vulnerability of city regions based on building typology: Rapid assessment survey. Asian J. Civ. Eng. 2021, 22, 677–687. [Google Scholar] [CrossRef]
  14. Pavel, F.; Vacareanu, R. Scenario-based earthquake risk assessment for Bucharest, Romania. Int. J. Disaster Risk Reduct. 2016, 20, 138–144. [Google Scholar] [CrossRef]
  15. Strasser, F.O.; Bommer, J.J.; Şeşetyan, K.; Erdik, M.; Çaǧnan, Z.; Irizarry, J.; Goula, X.; Lucantoni, A.; Sabetta, F.; Bal, I.E.; et al. A comparative study of European earthquake loss estimation tools for a scenario in Istanbul. J. Earthq. Eng. 2008, 12, 246–256. [Google Scholar] [CrossRef]
  16. Pitilakis, K.; Argyroudis, S.; Fotopoulou, S.; Karafagka, S.; Kakderi, K.; Selva, J. Application of stress test concepts for port infrastructures against natural hazards. The case of Thessaloniki port in Greece. Reliab. Eng. Syst. Saf. 2019, 184, 240–257. [Google Scholar] [CrossRef]
  17. Esposito, S.; Stojadinovic, B.; Babič, A.; Dolšek, M.; Iqbal, S.; Selva, J.; Broccardo, M.; Mignan, A.; Giardini, D. Risk-Based Multilevel Methodology to Stress Test Critical Infrastructure Systems. J. Infrastruct. Syst. 2020, 26, 04019035. [Google Scholar] [CrossRef]
  18. ICPD, Presidency of the Council of Ministers Italian Civil Protection Department. National Risk Assessment. Overview of the Potential Major Disasters in Italy: Seismic, Volcanic, Tsunami, Hydro-Geological/hydraulic and Extreme Weather, Droughts and Forest Fire Risks; ICPD: Rome, Italy, 2018. [Google Scholar]
  19. Dolšek, M.; Žižmond, J.; Babič, A.; Lazar Sinković, N.; Jamšek, A.; Gams, M.; Isaković, T. Seismic Stress Test of Building Stock in the Republic of Slovenia (2020–2050); University of Ljubljana, Faculty of Civil and Geodetic Engineering, Institute of Structural Engineering, Earthquake Engineering and Construction IT: Ljubljana, Slovenija, 2020. (In Slovenian) [Google Scholar]
  20. Official Gazette of the Republic of Slovenia, No 13/17. Decree Amending the Decree implementing the Decision on the Union Civil Protection Mechanism; The Government of the Republic of Slovenia: Ljubljana, Slovenia.
  21. Official Gazette of the Republic of Slovenia, No 62/14. Decree Implementing the Decision on the Union Civil Protection Mechanism; The Government of the Republic of Slovenia: Ljubljana, Slovenia.
  22. Government of the Republic of Slovenia, (GRS). National Disaster Risk Assessment, Version 2.0; The Government of the Republic of Slovenia: Ljubljana, Slovenia, 2018. (In Slovenian)
  23. Government of the Republic of Slovenia, (GRS). National Disaster Risk Assessment, Version 1.0; The Government of the Republic of Slovenia: Ljubljana, Slovenia, 2015. (In Slovenian)
  24. Lutman, M.; Klemenc, I.; Weiss, P.; Zupančič, P.; Šket Motnikar, B.; Banovec, P.; Cerk, M. POTROG—Seismic Risk in Slovenia for Civil Protection; Slovenian National Building And Civil Engineering Institute: Ljubljana, Slovenia, 2013. [Google Scholar]
  25. Grünthal, G. European Macroseismic Scale 1998; Centre Europèen de Géodynamique et de Séismologie, Musée National d’Histoire Naturelle, Section Astrophysique et Géophysique: Luxembourg, 1998. [Google Scholar]
  26. Government of the Republic of Slovenia, Surveying and Mapping Authority of the Republic of Slovenia. Real Estate Register. Available online: https://eprostor.gov.si/imps/srv/api/records/26252870-5100-4408-a3e0-54ea80eb3612 (accessed on 21 May 2021).
  27. Government of the Republic of Slovenia, Ministry of the Interior. Central Population Register. Available online: https://nio.gov.si/nio/asset/nio+centralni+register+prebivalstva+crp+vpogled+preko+emso?lang=en (accessed on 21 May 2021).
  28. Jiménez, B.; Pelà, L.; Hurtado, M. Building survey forms for heterogeneous urban areas in seismically hazardous zones. Application to the historical center of Valparaíso, Chile. Int. J. Archit. Herit. 2018, 12, 1076–1111. [Google Scholar] [CrossRef]
  29. Rapone, D.; Brando, G.; Spacone, E.; De Matteis, G. Seismic vulnerability assessment of historic centers: Description of a predictive method and application to the case study of scanno (Abruzzi, Italy). Int. J. Archit. Herit. 2018, 12, 1171–1195. [Google Scholar] [CrossRef]
  30. da Porto, F.; Donà, M.; Rosti, A.; Rota, M.; Lagomarsino, S.; Cattari, S.; Borzi, B.; Onida, M.; De Gregorio, D.; Perelli, F.L.; et al. Comparative analysis of the fragility curves for Italian residential masonry and RC buildings. Bull. Earthq. Eng. 2021, 19, 3209–3252. [Google Scholar] [CrossRef]
  31. Kohrangi, M.; Bazzurro, P.; Vamvatsikos, D. Seismic risk and loss estimation for the building stock in Isfahan. Part I: Exposure and vulnerability. Bull. Earthq. Eng. 2021, 19, 1709–1737. [Google Scholar] [CrossRef]
  32. Ruggieri, S.; Porco, F.; Uva, G.; Vamvatsikos, D. Two frugal options to assess class fragility and seismic safety for low-rise reinforced concrete school buildings in Southern Italy. Bull. Earthq. Eng. 2021, 19, 1415–1439. [Google Scholar] [CrossRef]
  33. Rota, M.; Penna, A.; Strobbia, C.L. Processing Italian damage data to derive typological fragility curves. Soil Dyn. Earthq. Eng. 2008, 28, 933–947. [Google Scholar] [CrossRef]
  34. Fajfar, P. Analysis in seismic provisions for buildings: Past, present and future. Bull. Earthq. Eng. 2018, 16, 2567–2608. [Google Scholar] [CrossRef] [Green Version]
  35. Kappos, A.J.; Panagopoulos, G.; Panagiotopoulos, C.; Penelis, G. A hybrid method for the vulnerability assessment of R/C and URM buildings. Bull. Earthq. Eng. 2006, 4, 391–413. [Google Scholar] [CrossRef]
  36. Pitilakis, K.; Argyroudis, S.; Kakderi, K.; Argyroudi, A. SYNER-G Project: Deliverable D8.20: Systemic Seismic Vulnerability and Risk Analysis for Buildings, Lifeline Networks and Infrastructures Safety Gain; Aristotle University of Thessaloniki & Commission of the European Communities—Directorate General Joint Research Centre: Ispra, Italy, 2013. [Google Scholar]
  37. Lapajne, J.; Šket Motnikar, B.; Zupančič, P. Probabilistic seismic hazard assessment methodology for distributed seismicity. Bull. Seismol. Soc. Am. 2003, 93, 2502–2515. [Google Scholar] [CrossRef]
  38. Woessner, J.; Laurentiu, D.; Giardini, D.; Crowley, H.; Cotton, F.; Grünthal, G.; Valensise, G.; Arvidsson, R.; Basili, R.; Demircioglu, M.B.; et al. The 2013 European Seismic Hazard Model: Key components and results. Bull. Earthq. Eng. 2015, 13, 3553–3596. [Google Scholar] [CrossRef] [Green Version]
  39. Šket Motnikar, B. The new seismic hazard map of Slovenia and the calculation methodology. In Proceedings of the Slovenian Engineering Day, Coexisting with Earthquakes and Other Natural Disasters (Web Conference), Ljubljana, Slovenia, 4 March 2021. [Google Scholar]
  40. Box, G.E.P.; Hunter, J.S.; Hunter, W.G. Statistics for Experimenters: Design, Innovation, and Discovery, 2nd ed.; Wiley-Interscience: New York, NY, USA, 2005; ISBN 978-0-471-71813-0. [Google Scholar]
  41. Cornell, C.A.; Krawinkler, H. Progress and Challenges in Seismic Performance Assessment; Pacific Earthquake Engineering Research: Berkeley, CA, USA, 2000. [Google Scholar]
  42. Weatherill, G.; Esposito, S.; Iervolino, I.; Franchin, P.; Cavalieri, F. Framework for Seismic Hazard Analysis of Spatially Distributed Systems. In SYNER-G: Systemic Seismic Vulnerability and Risk Assessment of Complex Urban, Utility, Lifeline Systems and Critical Facilities. Geotechnical, Geological and Earthquake Engineering; Pitilakis, K., Franchin, P., Khazai, B., Wenzel, H., Eds.; Springer: Dordrecht, The Netherlands, 2014; Volume 31. [Google Scholar] [CrossRef]
  43. Bindi, D.; Massa, M.; Luzi, L.; Ameri, G.; Pacor, F.; Puglia, R.; Augliera, P. Pan-European ground-motion prediction equations for the average horizontal component of PGA, PGV, and 5%-damped PSA at spectral periods up to 3.0 s using the RESORCE dataset. Bull. Earthq. Eng. 2014, 12, 391–430. [Google Scholar] [CrossRef] [Green Version]
  44. Bindi, D.; Massa, M.; Luzi, L.; Pacor, F.; Puglia, R.; Augliera, P.; Ameri, G. Erratum to: Pan-European ground-motion prediction equations for the average horizontal component of PGA, PGV, and 5%-damped PSA at spectral periods up to 3.0 s using the RESORCE dataset (Bull Earthquake Eng, 10.1007/s10518-013-9525-5). Bull. Earthq. Eng. 2014, 12, 431–448. [Google Scholar] [CrossRef] [Green Version]
  45. Jayaram, N.; Baker, J.W. Correlation model for spatially distributed ground-motion intensities. Earthq. Eng. Struct. Dyn. 2009, 38, 1687–1708. [Google Scholar] [CrossRef]
  46. Leonard, M. Self-Consistent Earthquake Fault-Scaling Relations: Update and Extension to Stable Continental Strike-Slip Faults. Bull. Seismol. Soc. Am. 2014, 104, 2953–2965. [Google Scholar] [CrossRef]
  47. CEN/TC 250/SC8. wdEN1998-1-1, Eurocode 8: Design of Structures for Earthquake Resistance—Part 1-1: General Rules and Seismic Action; CEN European Committee for Standardisation: Brussels, Belgium, 2020. [Google Scholar]
  48. Brando, G.; Pagliaroli, A.; Cocco, G.; Di Buccio, F. Site effects and damage scenarios: The case study of two historic centers following the 2016 Central Italy earthquake. Eng. Geol. 2020, 272, 105647. [Google Scholar] [CrossRef]
  49. Schäfer, D.; Scherer, R.; Pietsch, M.; Wenzel, H. SYNER-G Project: Deliverable D7.1: Systemic Seismic Vulnerability and Risk Analysis for Buildings, Lifeline Networks and Infrastructures Safety Gain, SYNER-G D7.1—Functional Fragility Curve Archive; Vienna Consulting Engineers: Vienna, Austria, 2011. [Google Scholar]
  50. Lazar Sinković, N.; Dolšek, M.; Žižmond, J. Impact of the type of the target response spectrum for ground motion selection and of the number of ground motions on the pushover-based seismic performance assessment of buildings. Eng. Struct. 2018, 175, 731–742. [Google Scholar] [CrossRef]
  51. Ancheta, T.D.; Darragh, R.B.; Stewart, J.P.; Seyhan, E.; Silva, W.J.; Chiou, B.S.J.; Wooddell, K.E.; Graves, R.W.; Kottke, A.R.; Boore, D.M.; et al. NGA-West2 database. Earthq. Spectra 2014, 30, 989–1005. [Google Scholar] [CrossRef]
  52. Akkar, S.; Sandikkaya, M.A.; Şenyurt, M.; Azari Sisi, A.; Ay, B.O.; Traversa, P.; Douglas, J.; Cotton, F.; Luzi, L.; Hernandez, B.; et al. Reference database for seismic ground-motion in Europe (RESORCE). Bull. Earthq. Eng. 2014, 12, 311–339. [Google Scholar] [CrossRef] [Green Version]
  53. Dolšek, M.; Lazar Sinković, N.; Žižmond, J. IM-based and EDP-based decision models for the verification of the seismic collapse safety of buildings. Earthq. Eng. Struct. Dyn. 2017, 46, 1–18. [Google Scholar] [CrossRef]
  54. Dolšek, M. Simplified method for seismic risk assessment of buildings with consideration of aleatory and epistemic uncertainty. Struct. Infrastruct. Eng. 2012, 8, 939–953. [Google Scholar] [CrossRef]
  55. PEG—Gradbeni Portal—Projektanske Ocene Investicij. Ljubljana. Available online: http://www.peg-online.net/ocene-investicij (accessed on 10 February 2020).
  56. Porter, K.A.; Kiremidjian, A.S. Assembly-Based Vulnerability of Buildings and Its Uses in Seismic Performance Evaluation and Risk Management Decision-Making; Stanford University, The John A. Blume Earthquake Engineering Center, Department of Civil and Environmental Engineering: Stanford, CA, USA, 2001. [Google Scholar]
  57. Bradley, B.A. Structure-Specific Probabilistic Seismic Risk Assessment. Doctoral Dissertation, University of Canterbury, Department of Civil and Natural Resources Engineering, Christchurch, New Zealand, 2009. [Google Scholar]
  58. Snoj, J.; Dolšek, M. Pushover-based seismic risk assessment and loss estimation of masonry buildings. Earthq. Eng. Struct. Dyn. 2020, 49, 567–588. [Google Scholar] [CrossRef]
  59. Tsang, H.H.; Wenzel, F. Setting structural safety requirement for controlling earthquake mortality risk. Saf. Sci. 2016, 86, 174–183. [Google Scholar] [CrossRef]
  60. Zuccaro, G.; Cacace, F. Seismic Casualty Evaluation: The Italian Model, an Application to the L’Aquila 2009 Event. In Human Casualties in Earthquakes. Advances in Natural and Technological Hazards Research; Spence, R., So, E., Scawthorn, C., Eds.; Springer: Dordrecht, The Netherlands, 2011; Volume 29, pp. 171–184. [Google Scholar]
  61. Lazar Sinković, N.; Dolšek, M. Fatality risk and its application to the seismic performance assessment of a building. Eng. Struct. 2020, 205. [Google Scholar] [CrossRef]
  62. Ribarič, V. Seizmičnost Slovenije—Seismicity of Slovenia, Katalog Potresov (792n.e.—1981)—Catalogue of Earthquakes (792A.D.—1981); Seizmološki Zavod SR Slovenije: Ljubljana, Slovenia, 1982. [Google Scholar]
  63. ARSO (Agencija Republike Slovenije za Okolje) Močni Potresi v Preteklosti. Available online: http://www.arso.gov.si/potresi/potresnaaktivnost/Močni_potresi_v_preteklosti.pdf (accessed on 25 May 2021).
  64. Grünthal, G.; Wahlström, R.; Stromeyer, D. The unified catalogue of earthquakes in central, northern, and northwestern Europe (CENEC)—Updated and expanded to the last millennium. J. Seismol. 2009, 13, 517–541. [Google Scholar] [CrossRef] [Green Version]
  65. Zupančič, P.; (Slovenian Environment Agency, Ljubljana, Slovenia). Personal Communication, 2020.
  66. CEN. EN1998-1. Eurocode 8: Design of Structures for Earthquake Resistance–Part 1: General Rules; Seismic Actions and Rules for Buildings; European Committee for Standardisation: Brussels, Belgium, 2004. [Google Scholar]
  67. ATC. FEMA P-58-1, Seismic Performance Assessment of Buildings: Volume 1—Methodology; Federal Emergency Management Agency: Washington, DC, USA, 2012.
Figure 1. Risk matrix according to [23] for the evaluation and communication of representative earthquake scenarios in Ljubljana. The risk in [23] is evaluated for the consequence on (i) people, (ii) economy, environment, and cultural heritage (E&E&C), and (iii) politics and society (P&S). The overall consequence is also defined.
Sustainability 13 07624 g001
Figure 2. Building density in the Republic of Slovenia.
Sustainability 13 07624 g002
Figure 3. Population density in the Republic of Slovenia.
Sustainability 13 07624 g003
Figure 4. Flowchart of processes of scenario-based seismic risk assessment methodology with an indication of the results of each process.
Sustainability 13 07624 g004
Figure 5. An example of the realised fragility functions for a particular building, and the realisation of the damage state (DS3) based on the generated random number and PGA from the simulated ground-motion field.
Sustainability 13 07624 g005
Figure 6. (a) The range of P G A ˜ DS 4 , c , l for the considered building classes with and without consideration of the load-conservatism factor, (b) schematic presentation of two simulations of P G A ˜ DS 4 , c , l and the corresponding distributions of P G A ˜ DS 4 , k , l for building class 3, and (c) schematic presentation of two simulations of P G A ˜ DS 4 , k , l and the corresponding fragility functions for two buildings from building class 3.
Sustainability 13 07624 g006
Figure 7. PGA ground-motion field approximately corresponding to (a) the 5th percentile and (b) the median direct economic losses. The ground-motion intensities are presented only for the cells that include buildings.
Sustainability 13 07624 g007
Figure 8. The average PGA for 500 simulations at (a) rock and (b) surface level. In the latter case, the ground-motion intensities are presented only for the cells that include buildings.
Sustainability 13 07624 g008
Figure 9. The damage map, which presents the spatial distribution of the average building stock damage within cells of 0.25 × 0.25 km, corresponding to the simulations that caused approximately (a) the 5th percentile and (b) the median direct economic losses. The damage presented is the direct consequence of ground-motion fields from Figure 7.
Sustainability 13 07624 g009
Table 1. Definition of building classes based on the material of the load-bearing structure, construction period, and number of storeys, and their presentation in terms of the number of buildings, estimated market value of buildings, and number of residents.
Building ClassLoad-Bearing Structure MaterialConstruction PeriodNumber of StoreysNumber of Buildings (×103)Estimated Market Value (Billion EUR)Number of Residents (×103)
1Brick, stone (masonry)Until 19641–3109.110.076342.7
24 or more4.73.74872.5
31965–19811–395.910.098328.5
44 or more1.41.54739.9
5From 19821–3119.213.963386.0
64 or more1.31.42726.8
7Reinforced concreteUntil 19641–34.91.20813.5
84 or more0.71.418.3
91965–19811–313.93.59641.1
104–61.33.02348.6
117 or more0.83.84571.2
12From 19821–323.48.0566.1
134–61.85.52552.6
147 or more0.53.50637.1
15Unspecified, other Until 19641–347.84.7154.9
164 or more2.42.635.2
171965–19811–333.14.7102.7
184 or more1.12.540.6
19From 19821–356.310.2146.0
204 or more1.22.628.1
Table 2. The earthquake (Mw = 6.2, epicentre at 46.10° N, 14.50° E) consequences, expressed by the median and 90% confidence interval.
5th Percentile50th Percentile95th Percentile
No. of buildings in DS116,94922,95730,187
No. of buildings in DS217,12934,36747,818
No. of buildings in DS3223413,73929,376
No. of buildings in DS4318468124,210
No. of collapsed buildings476743487
Expected no. of fatalities 193381820
Direct economic losses (EUR)1.70 × 1097.87 × 10922.93 × 109
Table 3. The earthquake (Mw = 6.2, epicentre at 46.10° N, 14.50° E) consequences, expressed by the median and 90% confidence interval. The effects of the between- and within-event ground-motion residuals are neglected.
5th Percentile50th Percentile95th Percentile
No. of buildings in DS124,25425,19226,294
No. of buildings in DS232,42335,66639,502
No. of buildings in DS3856311,31014,658
No. of buildings in DS4174927874390
No. of collapsed buildings248399636
Expected no. of fatalities142241391
Direct economic losses (EUR)5.39 × 1096.62 × 1098.11 × 109
Publisher’s Note: MDPI stays neutral with regard to jurisdictional claims in published maps and institutional affiliations.

