Abstract
As an ecological engineering project, artificial upwelling can enhance seaweed growth in the oligotrophic sea area by lifting bottom water, which is rich in nutrients, to the surface and thereby increase coastal carbon sequestration. Generally, engineering projects producing artificial upwelling occur far away from land and are self-powered using offshore solar energy or wind energy. The key to successfully implementing such engineering projects is to produce artificial upwelling with limited energy. With this in mind, an intelligent control system is designed for the energy management of the artificial upwelling engineering project that operates at AoShan Bay in Qingdao, China. This engineering project uses artificial upwelling to assist in the cultivation of macroalgae. The intelligent control system can automatically produce upwelling according to the battery condition and guarantee safety during operation. Meanwhile, users can monitor the system in real time with a Cloud platform. The functioning of the system and the effect of upwelling are confirmed by a sea trial. This research provides guidelines and technical support for the future design of intelligent control systems mounted on artificial upwelling engineering projects.
1. Introduction
With the increasing emission of carbon dioxide, global warming has become one of the most serious challenges to the sustainable development of human society. Global warming leads to glacier melting, sea level rises, extreme weather events, biological extinction and other catastrophic consequences [1]. One potential means of alleviating the greenhouse effect is to develop carbon sequestration technologies.
CO2 enhanced oil recovery (CO2-EOR) is a technology for carbon sequestration in the petroleum industry [2,3]. When carbon dioxide is made completely miscible with crude oil through specific techniques, both carbon sequestration and the oil recovery efficiency are enhanced [4,5,6].
Macroalgae culturing is another effective approach for carbon sequestration [7]. Through photosynthesis, macroalgae can absorb carbon in seawater, reducing the partial pressure of CO2 at the surface ocean and then promoting the diffusion of atmospheric CO2 into seawater [8]. Previous studies have shown that global macroalgae can sequester 700 million tons of carbon every year, accounting for about 35% of the total annual net carbon sequestration of global oceans [9]. However, the large-scale cultivation of macroalgae would reduce water exchange, thus hindering the supply of exogenous nutrients [10]. As a result of the lack of nutrients, macroalgae may suffer from diseases or even die, threatening not only productivity but the local ecosystem.
Artificial upwelling engineering projects, which bring deep seawater—which is rich in nutrients—up to the surface, potentially resolve the lack of nutrients during the growth of macroalgae. This engineering approach will hopefully increase marine carbon sequestration [11,12] and has attracted increasing attention worldwide due to its potential positive environmental effects [13]. Global climate model simulations suggest that, with most optimistic assumptions, artificial upwelling is likely to sequester atmospheric carbon dioxide at a rate of about 900 million tons per year [14], which is almost half of the rate of CO2 absorption in the global ocean [15].
China has set up an artificial upwelling engineering project in AoShan Bay (36°22′ north latitude and 120°50′ east longitude). The surface water of AoShan Bay is nutrient-limited, while the bottom water and sediment pore water are nutrient-rich [16]. This engineering project is considered to be a promising way to absorb CO2 from the atmosphere by assisting in the cultivation of macroalgae [17]. While a portion of macroalgae is harvested to participate in the carbon cycle on land, the rest could be stored in the deep ocean via a biological pump [11]. However, it is sometimes difficult for engineering projects to exploit energy in the open ocean.
In this paper, it is aimed to design and implement an intelligent control system for the artificial upwelling engineering project in AoShan Bay. The system is designed to manage the power and timing of upwelling by analyzing real-time data including light, temperature, output power, etc. Meanwhile, it provides early warning functions, remote control and data transmission. It is organized as follows in this paper: Section 2 describes the conditions of the artificial upwelling engineering project built in AoShan Bay and defines the functions of the system according to its requirements; Section 3 describes the realization of the hardware and software system; Section 4 discusses a sea trial conducted to verify the function of the system and the effect of upwelling; and Section 5 gives a summary of the conclusions.
2. Methods
2.1. Analysis of Artificial Upwelling Engineering
In the context of attempts to increase the ability of the coastal ocean to sequester carbon dioxide, an air-lift artificial upwelling engineering project has been developed to help cultivate kelp (a type of macroalgae) in coastal areas (Figure 1). This engineering project serves not only to increase the nutrient concentration at the surface ocean, but also to adjust the ratio of nitrogen/phosphorus/silicon/iron such that the biological pump’s efficiency reaches its maximum in terms of exporting organic carbon to the deep sea.
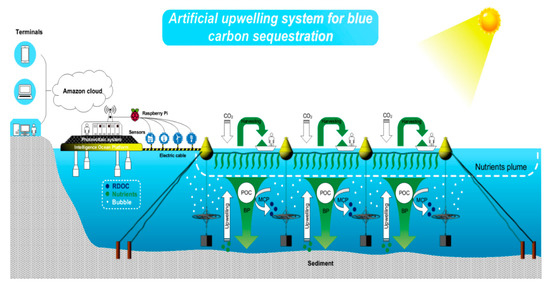
Figure 1.
Diagram of the ecological engineering project for carbon sequestration in coastal mariculture environments in China.
The aforementioned engineering project was deployed in September 2017 in the AoShan Bay, JiMo City, China (36°22′18.24″ N, 120°49′38.49″ E), including a solar power generation system and air injection system.
The solar power generation system is used to provide power to the air injection system to form a large-scale rising bubble plume. The system is divided into 12 sets of independent operations with an identical modular configuration. Each set includes 12 solar panels (about 20 m2 each), one control inverter-integrated machine and four batteries. A solar panel is laid over the top layer of the offshore platform, while the batteries and the inverter controller are installed in the control room. The model of the battery is a 12 V 150 Ah, and the maximum stored electric energy is 1.8 kWh. The inverter controller consists of a photovoltaic controller and an inverter. The former controls the charging and discharging process of the solar panel to the battery, and the latter converts the DC into 220 V AC.
The air injection system is used to generate a large-scale rising bubble plume. The rising bubble plume transports the cold and nutrient-rich bottom water or sediment-interstitial water to the surface, stimulating the growth of the kelp and the absorption of carbon dioxide from the air. The system consists of air pipes, nozzles and air pumps (Figure 2). The outer diameter of the air pipes is 16 mm and the thickness is 4 mm. The nozzles are used to fix the air pipes, which are made of cement blocks. The air pumps are installed outside the control room, protected by a metal shell against rain and corrosion. Each air pump uses 220 V AC power supply, with a power of 1.1 KW, maximum air injection pressure of 0.8 MPa and air injection rate of 100 L/min. In addition, the whole air injection system is divided into eight independent subsystems, each of which is responsible for an area of about 1050 m2. The air injection rate of the subsystem can be adjusted according to the number of air pumps opened, and the maximum is no more than 300 L/min.
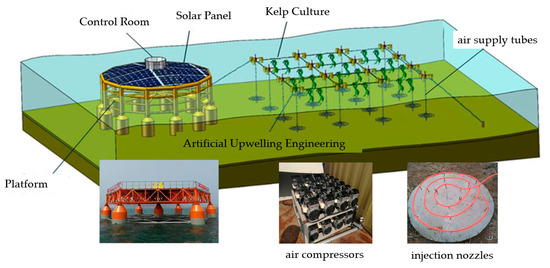
Figure 2.
The schematic diagram of the artificial upwelling system.
The solar power generation system is designed to provide an average of 60 kWh of electricity power per day to the air injection system, and this enables the whole system to work for about 4 h per day. It is estimated that more than 50,000 m3 of nutrient-rich bottom water could be transported to the surface every day, generating a nitrogen flux of 10.1 tons per year from the pore water in sediments to the surface water. The lifted nutrient-rich water is expected to improve the nutrient concentration in a sea area of 1500 acres and is capable of utilizing 250 tons of CO2 per year (tCO2/y) [18].
The offshore platform is made of Q235A steel. From above, it can be viewed as a hexagonal structure with a circumcircle diameter of 24 m, and the total area of a single layer is 439 m2. The total height of the floating offshore platform is about 14.7 m. The height above the water surface is 7.7 m and the underwater height is 7 m. The offshore platform is composed of two parts: the upper platform and the chassis. The upper platform is of the lattice type, with six circumferential steel frames and 12 radial steel frames and a height of 2 m. The top chord, bottom chord, diagonal member and vertical member of the steel frame are all H-shaped steel; the chassis is composed of seven pontoons (six around and one at the center) whose diameter is 2.2 m and height is about 8 m. The 3D structure drawing of the offshore platform is shown in Figure 3. The top chord plane of the upper platform is covered with a steel plate. A 15 m2 central control room with a height of 2.4 m is set on the steel plate, which is used to store the battery, inverter and controller of the solar photovoltaic system, as well as the intelligent control system (Figure 4). In addition, a 36 m walkway is paved on the offshore platform to facilitate operation on the offshore platform.
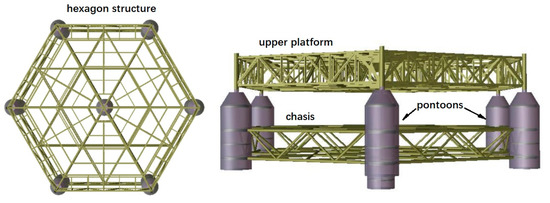
Figure 3.
The 3D structure drawing of the offshore platform.
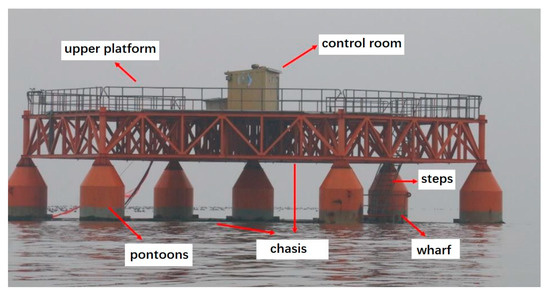
Figure 4.
The picture of the deployed offshore platform on the ocean.
2.2. Requirement Analysis and Funcional Design for Control System
The requirement analysis of the intelligent control system is shown in Figure 5.
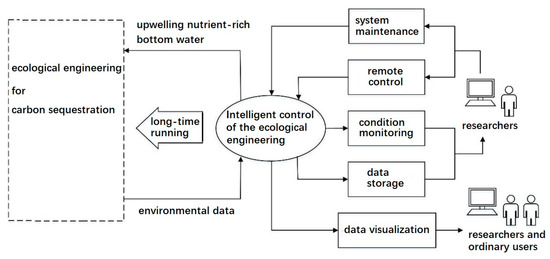
Figure 5.
Requirement analysis of the intelligent control system.
- (1)
- The intelligent control system of the ecological engineering project is efficient and reliable. The system has a good adaptive ability to improve the upwelling efficiency and energy efficiency.
- (2)
- Researchers can maintain and control the system in real time. The system can monitor the surrounding environment of the sea area in real time and store the relevant data. The system can monitor the running status of the equipment in real time, automatically respond to failure and notify the scientific researchers.
- (3)
- The system can summarize all kinds of data and display them to users.
The functional design of the intelligent control system can be divided into four parts:
- (1)
- The fundamental functions, which include the functions of controlling air-lift artificial upwelling by implementing the upwelling control strategies, data transfer and processing, the storage of the environmental monitoring data and equipment operation data, the realization of the remote transmission of data and user interaction;
- (2)
- Core functions, which include energy management and operational planning;
- (3)
- Remote control-related functions, which enable researchers to remotely control the onboard sensors and the ecological engineering project as required;
- (4)
- Data-related functions, which realize the acquisition, storage and display of all kinds of data.
3. Realization of the Intelligent Control System
3.1. Hardware System Structure
Open looping control strategy is used in the intelligent control system (Figure 6). The diagram of the hardware system structure of the intelligent control system is shown in Figure 7. The microcontroller module is the central processing core of the whole energy-saving system, data acquisition and processing system. The power module provides 3.3 V, 5 V or 12 V DC power for controllers, sensors, etc. The remote-control module performs the functions of connecting the whole system with the outside world by transferring data to the Cloud platform, accepting the remote-control information sent by the back-end users and responding accordingly. The output control module controls the working condition of the air pumps. The sensor module includes a temperature and humidity sensor, inverter controller, water temperature sensor and light intensity sensor. The integrated temperature and humidity sensor and inverter controller collect indoor temperature and humidity data and battery power and voltage data, which are used to ensure the safety of the whole system. The water temperature sensor and light sensor acquire the environmental parameters of the kelp culture area, which provide a database for air injection control.
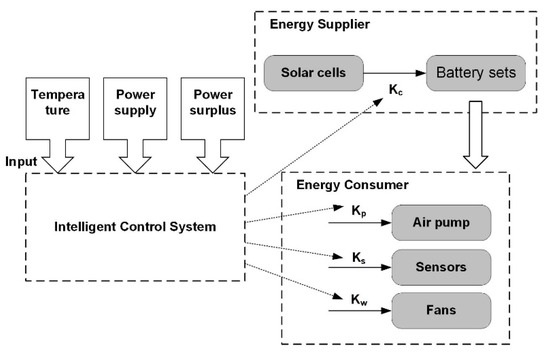
Figure 6.
Open looping control flow chart. The coefficients Kc, Kp, Ks and Kw with values of 0 or 1 represent switches.
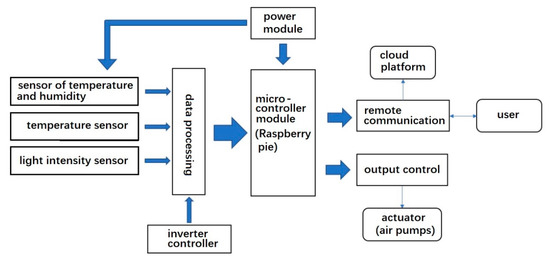
Figure 7.
The diagram of the hardware system structure of the intelligent control system.
A Raspberry Pi 3 Model B is chosen as the micro-controller module of the intelligent control system as it is only the same size as a credit card but exhibits high-level performance. The Raspberry Pi can run a complete operating system; it is equipped with a BCM2837 processor based on ARM Cortex-A53 core, with a working frequency of 1.2 GHz, a running memory of 1 GB and built-in Wi-Fi, and is equipped with various communication interfaces. Alongside its excellent performance, it has a low energy consumption (less than 12.5 W) and moderate price.
3.2. Software System Structure
The control core of artificial the upwelling software system is the Raspberry Pi and the data center is built on the basis of the Amazon Cloud service (AWS, Figure 8). After the Raspberry Pi is connected with Amazon EC2 through a key, it can upload the received inverter data, various sensor data and the image and video flow of the video monitoring module to the Cloud platform. On the one hand, the Raspberry Pi can realize intelligent control on each terminal according to its internal program; on the other hand, users can use EC2 to connect the Raspberry Pi in reverse to send control instructions to each terminal or debug the Raspberry Pi program remotely. EC2 can distribute the data flow to the storage bucket (Amazon S3) or database (Amazon DynamoDB) according to the user settings, and the privacy and security of these data can be guaranteed. A static website is built in S3 for users to obtain sensor data and video stream. The operation status and emergency information of the software system can be pushed to users regularly using Amazon SNS. The main program of the software system runs continuously on AWS for a long time or is set to start automatically by the Raspberry Pi, meaning that the whole system can operate intelligently under unattended conditions. Both the software system server and Raspberry Pi program are developed in the Python environment, and the web program is developed in HTML language and JavaScript.
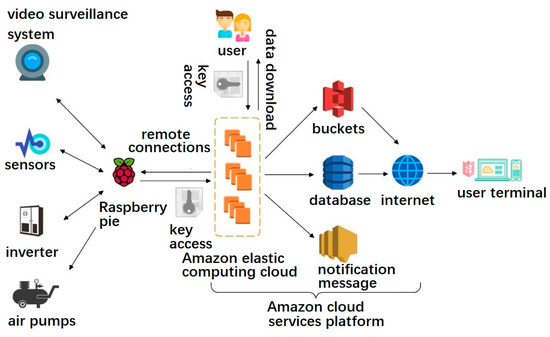
Figure 8.
The diagram of the software system structure of the intelligent control system.
The software system structure of the intelligent control system consists of the basic configuration part and the program design part (Figure 9). The basic configuration includes the initial configuration of the microcontroller and the remote communication configuration to realize the construction of the Linux working environment of the Raspberry Pi and the remote control of the user. The program includes a water temperature and light acquisition program, safety control program and upwelling control program. The water temperature and light acquisition program collects data through corresponding sensors, saves the data on the Raspberry Pi and uploads it to the cloud platform for backup every day.
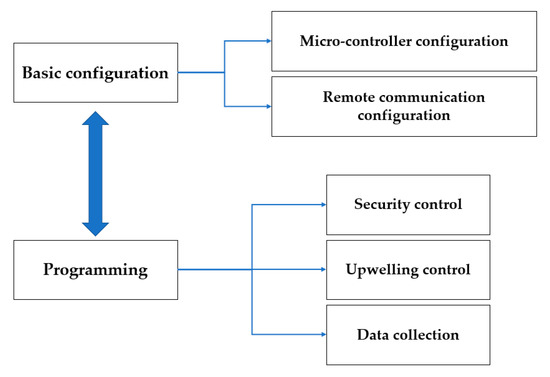
Figure 9.
The functions of the software system.
The artificial upwelling control program is divided into two parts, which are executed once a day (Figure 10). Part I is the data preparation stage, which is used to obtain the data for the current speeds, temperature and light intensities of the day. Part II is air injection control stage. First, it reads the remaining power of the system and calculates the day’s air injection scheme, including the air injection time and air injection rate, using the first part of the temperature, light and flow rate data; then, it controls the air injection in the corresponding time period. During air injection, it judges whether the number of opened air pumps meets the air injection rate every 10 min. If not, it changes the number of working air pumps. After the air injection is completed, it closes the air pumps and completes the work of the day. During the artificial upwelling, real-time control is carried out according to the temperature and light data measured by the sensors. When the temperature and light influence index is lower than the set value, air injection is stopped.
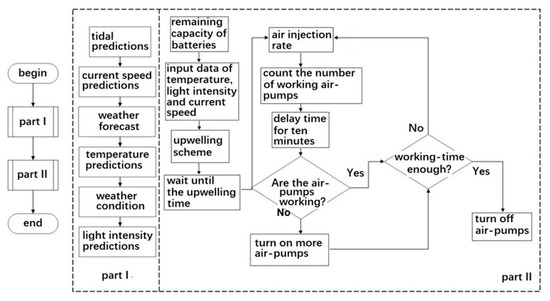
Figure 10.
The flow chart of the artificial upwelling control program.
4. Experiment Setup and Results
4.1. Experiment Setup
The experimental site is chosen near to the location where the engineering project is implemented, as shown in Figure 11.
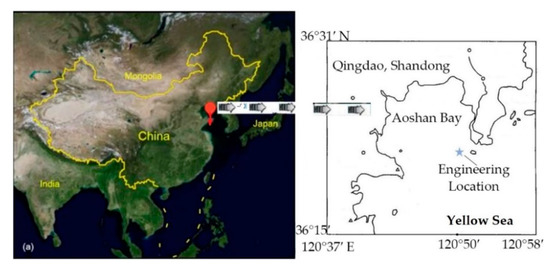
Figure 11.
Study site of the ecological engineering project in a coastal mariculture environment.
The designed intelligent control system ensures that artificial upwelling is automatically produced every day, which can lift nutrients to meet the need of kelp growth. In order to test the system’s functions and the effect of upwelling, a sea trial was conducted, which can be divided into two steps.
In the first step, the intelligent control system was installed both indoors and outdoors on the offshore platform, and the status of the system operation is recorded during the test. The outdoor hardware included a light sensor and water temperature sensor, and the installation position was as shown in Figure 12. The water temperature sensor was located at a depth of 1 m in the water below the platform and the length of the electric wire was 8 m, leading out from the control room. In order to avoid the influence of the shadow of the control room on the light data under the sun, the light sensor was installed on the metal railing at the edge of the platform and fixed with M6 bolts.
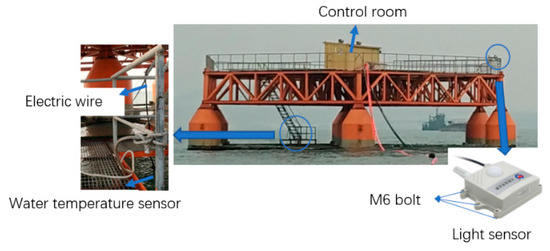
Figure 12.
Installation positions of water temperature and light sensor.
The indoor hardware included the Raspberry Pi controller, relay and temperature and humidity sensor, and their installation positions were as shown in Figure 13. The temperature and humidity sensor monitored the indoor temperature and humidity. It was installed on the wall of the control room and fixed with two M8 nuts, as shown in Figure 13a. Other hardware devices were installed in control cabinet 1 and control cabinet 2 (Figure 13b,c). The control cabinet used two distribution boxes with a length of 400 mm, width of 250 mm and height of 500 mm, which were installed on the wall of the control room by hanging them on the wall. The contactor was installed on the internal guide rail and fixed with bolts to ensure that it would not move. The Raspberry Pi and relay were fixed with foam glue.
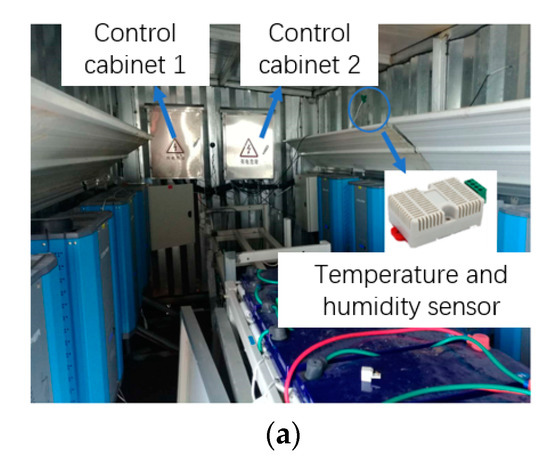
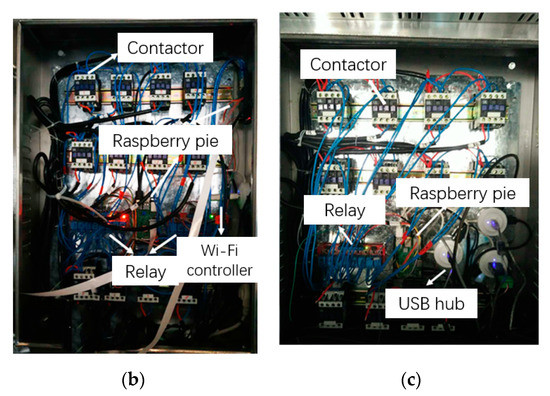
Figure 13.
Indoor hardware installation drawing. (a) Control room; (b) Control cabinet 1; (c) Control cabinet 2.
In the second step, an experiment was carried out in the kelp culture area to verify the feasibility and effectiveness of the control system. The changes of water temperature and nutrient concentration were monitored in the kelp culture area to verify that the upwelling plume successfully reached the surface as an outcome of the working of our intelligent system.
The measurement stations are shown in Figure 14. There were six stations including one for background value (b) around the bubble area. A high-precision CTD was employed (conductivity-temperature-depth instrument: SBE 19plus (V2) to measure temperature variation and sampled seawater at different depths to measure the nutrient concentration variation. During the measurement, the current moved towards the northwest and was approximately parallel to the cables in the kelp culture area.
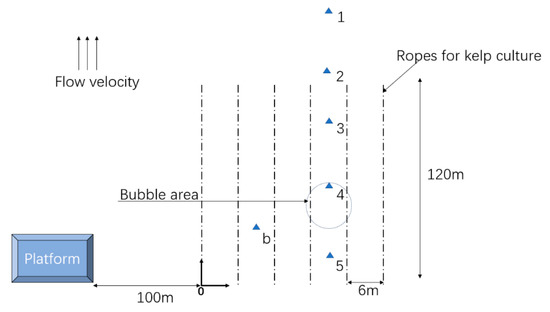
Figure 14.
The schematic diagram of measurement stations.
4.2. Results and Discussion
The system continuously operated for six months from 15 November 2018 to 15 May 2019. Two hardware failures occurred during operation. One Raspberry Pi detected that the chip temperature was too high on 10 January 2019, so it was suspended for use and replaced after 7 days. Three relays were damaged on 16 January 2019, and they are replaced after three days. Except for the few days of hardware malfunction, the system was generally in a good condition.
Through the sea trial, the temperature and nutrient changes caused by upwelling were obtained. The temperature change of stations 1–5 is shown in Figure 15. The black solid line represents the background water temperature before the air pump was turned on. It can be seen that the bottom seawater background temperature was about 4.72 °C and the surface seawater temperature was about 4.92 °C. The temperature difference between the bottom layer and the surface layer was only 0.2 °C, but the temperature sensor on the CTD was sensitive enough to detect this variation, with a high accuracy of 0.0005~0.001 °C. The measurement data were thereby effective.
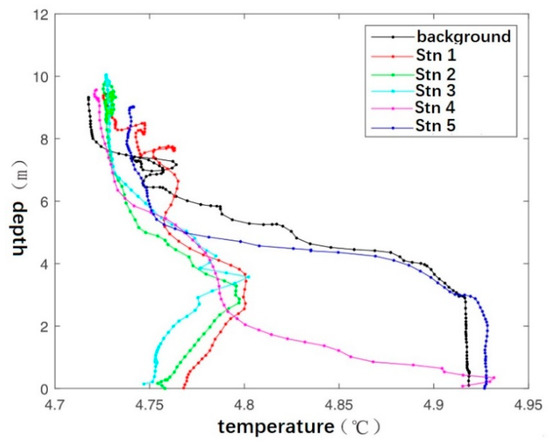
Figure 15.
Changes in sea water temperature at different stations in experimental area (when air pump was turned on).
After the air pump was turned on, there was a large difference between the temperature and background values at stations 1–4, while there was little difference between the temperature and background values at stations 5. In the experiment, the tidal current direction moved from station 5 to station 1, which was approximately parallel to the kelp culture cable. Therefore, station 5 was upstream of the bubble impact area, and stations 1–4 were downstream of the bubble area. The nutrient plume raised by the bubble could not affect station 5 but had an impact on stations 1–4. In addition, there were obvious differences between station 4 and stations 1~3. The main reason for this was that station 4 was close to the nozzle array and the nutrient plume did not reach the surface completely at this location. From the measurement data, only a relatively weak plume reached the surface, so the water temperature on the surface of station 4 was almost not impacted, with only a few meters beneath the surface being notably affected. Stations 1–3 downstream of the nozzle array were far from the air injection area. From the measurement data, most of the lifted bottom water reached the surface at stations 1–3, which caused the surface water temperature change at these stations to be relatively strong.
The N and P nutrient concentrations of the surface water samples taken at stations 1–5 during the period of air pump operation are shown in Table 1. Despite the low concentration of nutrients in these sites, N and P nutrients were found to increase in the surface layer of stations 1–4, which proved that the bottom nutrient seawater was lifted to the surface layer.

Table 1.
The nutrient concentrations in the experimental area in AoShan Bay.
The changes in temperature and nutrient concentration are consistent with those reported by Yao and Qiang [19,20]. With proper air injection rate, the upwelling could bring deep cold water rich in nutrients to the surface water. The cooling effect of surface water in the experiment as well as the improvement of nutrients indicated an obvious effect of upwelling and thus confirmed the feasibility and reliability of the intelligent control system.
5. Conclusions
As an ecological engineering method, artificial upwelling can effectively increase primary productivity and enhance the capacity of marine carbon sinks by using artificial equipment to transport nutrient-rich deep ocean water to the upper euphotic layer, promoting the uptake of nutrients by phytoplankton and algae. Some achievements of artificial upwelling in theory and laboratory experiments have been obtained in China, while only a few research works on the application of the technology and sea trials of artificial upwelling have been carried out to date.
In this paper, research into the key technologies of air-lift artificial upwelling was conducted and an efficient and reliable intelligent control system for an ecological engineering project was designed. The engineering project used air-lift artificial upwelling technology for a marine ranch in China, aiming at the problem of nutrient deficiency during the peak season of kelp growth. First, the requirements of the intelligent control system for artificial upwelling are analyzed and its function design was completed then. The system was mainly used to manage electric energy and produce artificial upwelling every day. In addition, it could realize remote control by users and save data through the Amazon Cloud service. Based on its functions, the hardware and software design of the system were completed. Finally, some sea trials in the mariculture zone were carried out. The control system was installed and the application feasibility was tested. To verify the effect of the intelligent control system, temperature and nutrient concentrations in the experimental area were measured while the system is in operation. The results showed that the control system could produce artificial upwelling and bring nutrients to kelp. In addition, the system performed well during seaweed farming. This kind of ecological engineering project with an intelligent control system can be expected to increase crop yield for carbon sequestration in coastal mariculture environments.
Author Contributions
Conceptualization, and writing—review and editing, P.L.; data curation, formal analysis, investigation, validation, and writing—original draft preparation, W.F.; writing—review and editing, C.X.; methodology, Z.Z.; supervision, T.L., Y.D., Y.C. and Y.P. All authors have read and agreed to the published version of the manuscript.
Funding
This research was financially funded by the National Natural Science Funds of China (No. 41976199); and the National Key Research and Development Program of China (No. 2016YFA0601400).
Conflicts of Interest
The authors declare no conflict of interest.
References
- Field, C. Climate Change 2014–Impacts, Adaptation and Vulnerability: Regional Aspects; Cambridge University Press: Cambridge, UK, 2014. [Google Scholar]
- Mohammadian, E.; Jan, B.M.; Azdarpour, A.; Hamidi, H.; Othman, N.H.B.; Dollah, A.; Hussein, S.N.B.C.M.; Sazali, R.A.B. CO2-EOR/Sequestration: Current Trends and Future Horizons. In Enhanced Oil Recovery Processes-New Technologies; IntechOpen: London, UK, 2019. [Google Scholar]
- Merchant, D. CO2 Sequestration-Enhanced Oil Recovery (CO2/EOR) in the 21st Century. In Proceedings of the Carbon Management Technology Conference, Houston, TX, USA, 15–18 July 2019. [Google Scholar]
- Davarpanah, A.; Mirshekari, B. Experimental investigation and mathematical modeling of gas diffusivity by carbon dioxide and methane kinetic adsorption. Ind. Eng. Chem. Res. 2019, 58, 12392–12400. [Google Scholar] [CrossRef]
- You, J.; Ampomah, W.; Sun, Q.; Kutsienyo, E.J.; Balch, R.S.; Dai, Z.; Zhang, X. Machine learning based co-optimization of carbon dioxide sequestration and oil recovery in CO2-EOR project. J. Clean. Prod. 2020, 120866. [Google Scholar] [CrossRef]
- Davarpanah, A.; Mirshekari, B. Experimental study of CO2 solubility on the oil recovery enhancement of heavy oil reservoirs. J. Therm. Anal. Calorim. 2020, 139, 1161–1169. [Google Scholar] [CrossRef]
- Xiao, X.; Agusti, S.; Lin, F.; Li, K.; Pan, Y.; Yu, Y.; Duarte, C.M. Nutrient removal from Chinese coastal waters by large-scale seaweed aquaculture. Sci. Rep. 2017, 7, 46613. [Google Scholar] [CrossRef] [PubMed]
- Qisheng, T.; Hui, L. Strategy for Carbon Sink and Its Amplification in Marine Fisheries. Eng. Sci. 2016, 18, 68. [Google Scholar] [CrossRef]
- Alpert, S.; Spencer, D.; Hidy, G. Biospheric options for mitigating atmospheric carbon dioxide levels. Energy Convers. Manag. 1992, 33, 729–736. [Google Scholar] [CrossRef]
- Shi, J.; Wei, H. Simulation of hydrodynamic structures in a semi-enclosed bay with dense raft-culture. J. Ocean Univ. China 2009, 39, 1181–1187. [Google Scholar]
- Kirke, B. Enhancing fish stocks with wave-powered artificial upwelling. Ocean Coast. Manag. 2003, 46, 901–915. [Google Scholar] [CrossRef]
- Zhang, Y.; Zhao, M.; Cui, Q.; Fan, W.; Qi, J.; Chen, Y.; Yan, C. Processes of coastal ecosystem carbon sequestration and approaches for increasing carbon sink. China Earth Sci. 2017, 60, 809–820. [Google Scholar] [CrossRef]
- Lovelock, J.E.; Rapley, C.G. Ocean pipes could help the Earth to cure itself. Nature 2007, 449, 403. [Google Scholar] [CrossRef] [PubMed]
- Oschlies, A.; Pahlow, M.; Yool, A.; Matear, R.J. Climate engineering by artificial ocean upwelling: Channelling the sorcerer’s apprentice. Geophys. Res. Lett. 2010, 37. [Google Scholar] [CrossRef]
- Takahashi, T.; Sutherland, S.C.; Wanninkhof, R.; Sweeney, C.; Feely, R.A.; Chipman, D.W.; Watson, A. Climatological mean and decadal change in surface ocean pCO2, and net sea–air CO2 flux over the global oceans. Deep Sea Res. Part II Top. Stud. Oceanogr. 2009, 56, 554–577. [Google Scholar] [CrossRef]
- Lin, T.; Fan, W.; Xiao, C.; Yao, Z.; Zhang, Z.; Zhao, R.; Pan, Y.; Chen, Y. Energy Management and Operational Planning of an Ecological Engineering for Carbon Sequestration in Coastal Mariculture Environments in China. Sustainability 2019, 11, 3162. [Google Scholar] [CrossRef]
- Yao, Z.; Fan, W.; Xiao, C.; Lin, T.; Zhang, Y.; Zhang, Y.; Liu, J.; Zhang, Z.; Pan, Y.; Chen, Y. Numerical Studies on the Suitable Position of Artificial Upwelling in a Semi-Enclosed Bay. Water 2020, 12, 177. [Google Scholar] [CrossRef]
- Fan, W.; Zhao, R.; Yao, Z.; Xiao, C.; Pan, Y.; Chen, Y.; Jiao, N.; Zhang, Y. Nutrient Removal from Chinese Coastal Waters by Large-Scale Seaweed Aquaculture Using Artificial Upwelling. Water 2019, 11, 1754. [Google Scholar] [CrossRef]
- Qiang, Y.; Fan, W.; Xiao, C.; Rivkin, R.B.; Pan, Y.; Wu, J.; Chen, Y. Behaviors of Bubble-Entrained Plumes in Air-Injection Artificial Upwelling. J. Hydraul. Eng. 2018, 144, 04018032.1–04018032.12. [Google Scholar] [CrossRef]
- Yao, Z.; Fan, W.; Xiao, C.; Qiang, Y.; Pan, Y.; Liang, N.K.; Chen, Y. Theoretical and experimental study on influence factors of bubble-entrained plume in air-injection artificial upwelling. Ocean Eng. 2019, 192, 106572. [Google Scholar] [CrossRef]
© 2020 by the authors. Licensee MDPI, Basel, Switzerland. This article is an open access article distributed under the terms and conditions of the Creative Commons Attribution (CC BY) license (http://creativecommons.org/licenses/by/4.0/).