Power Assessment in Road Cycling: A Narrative Review


Abstract
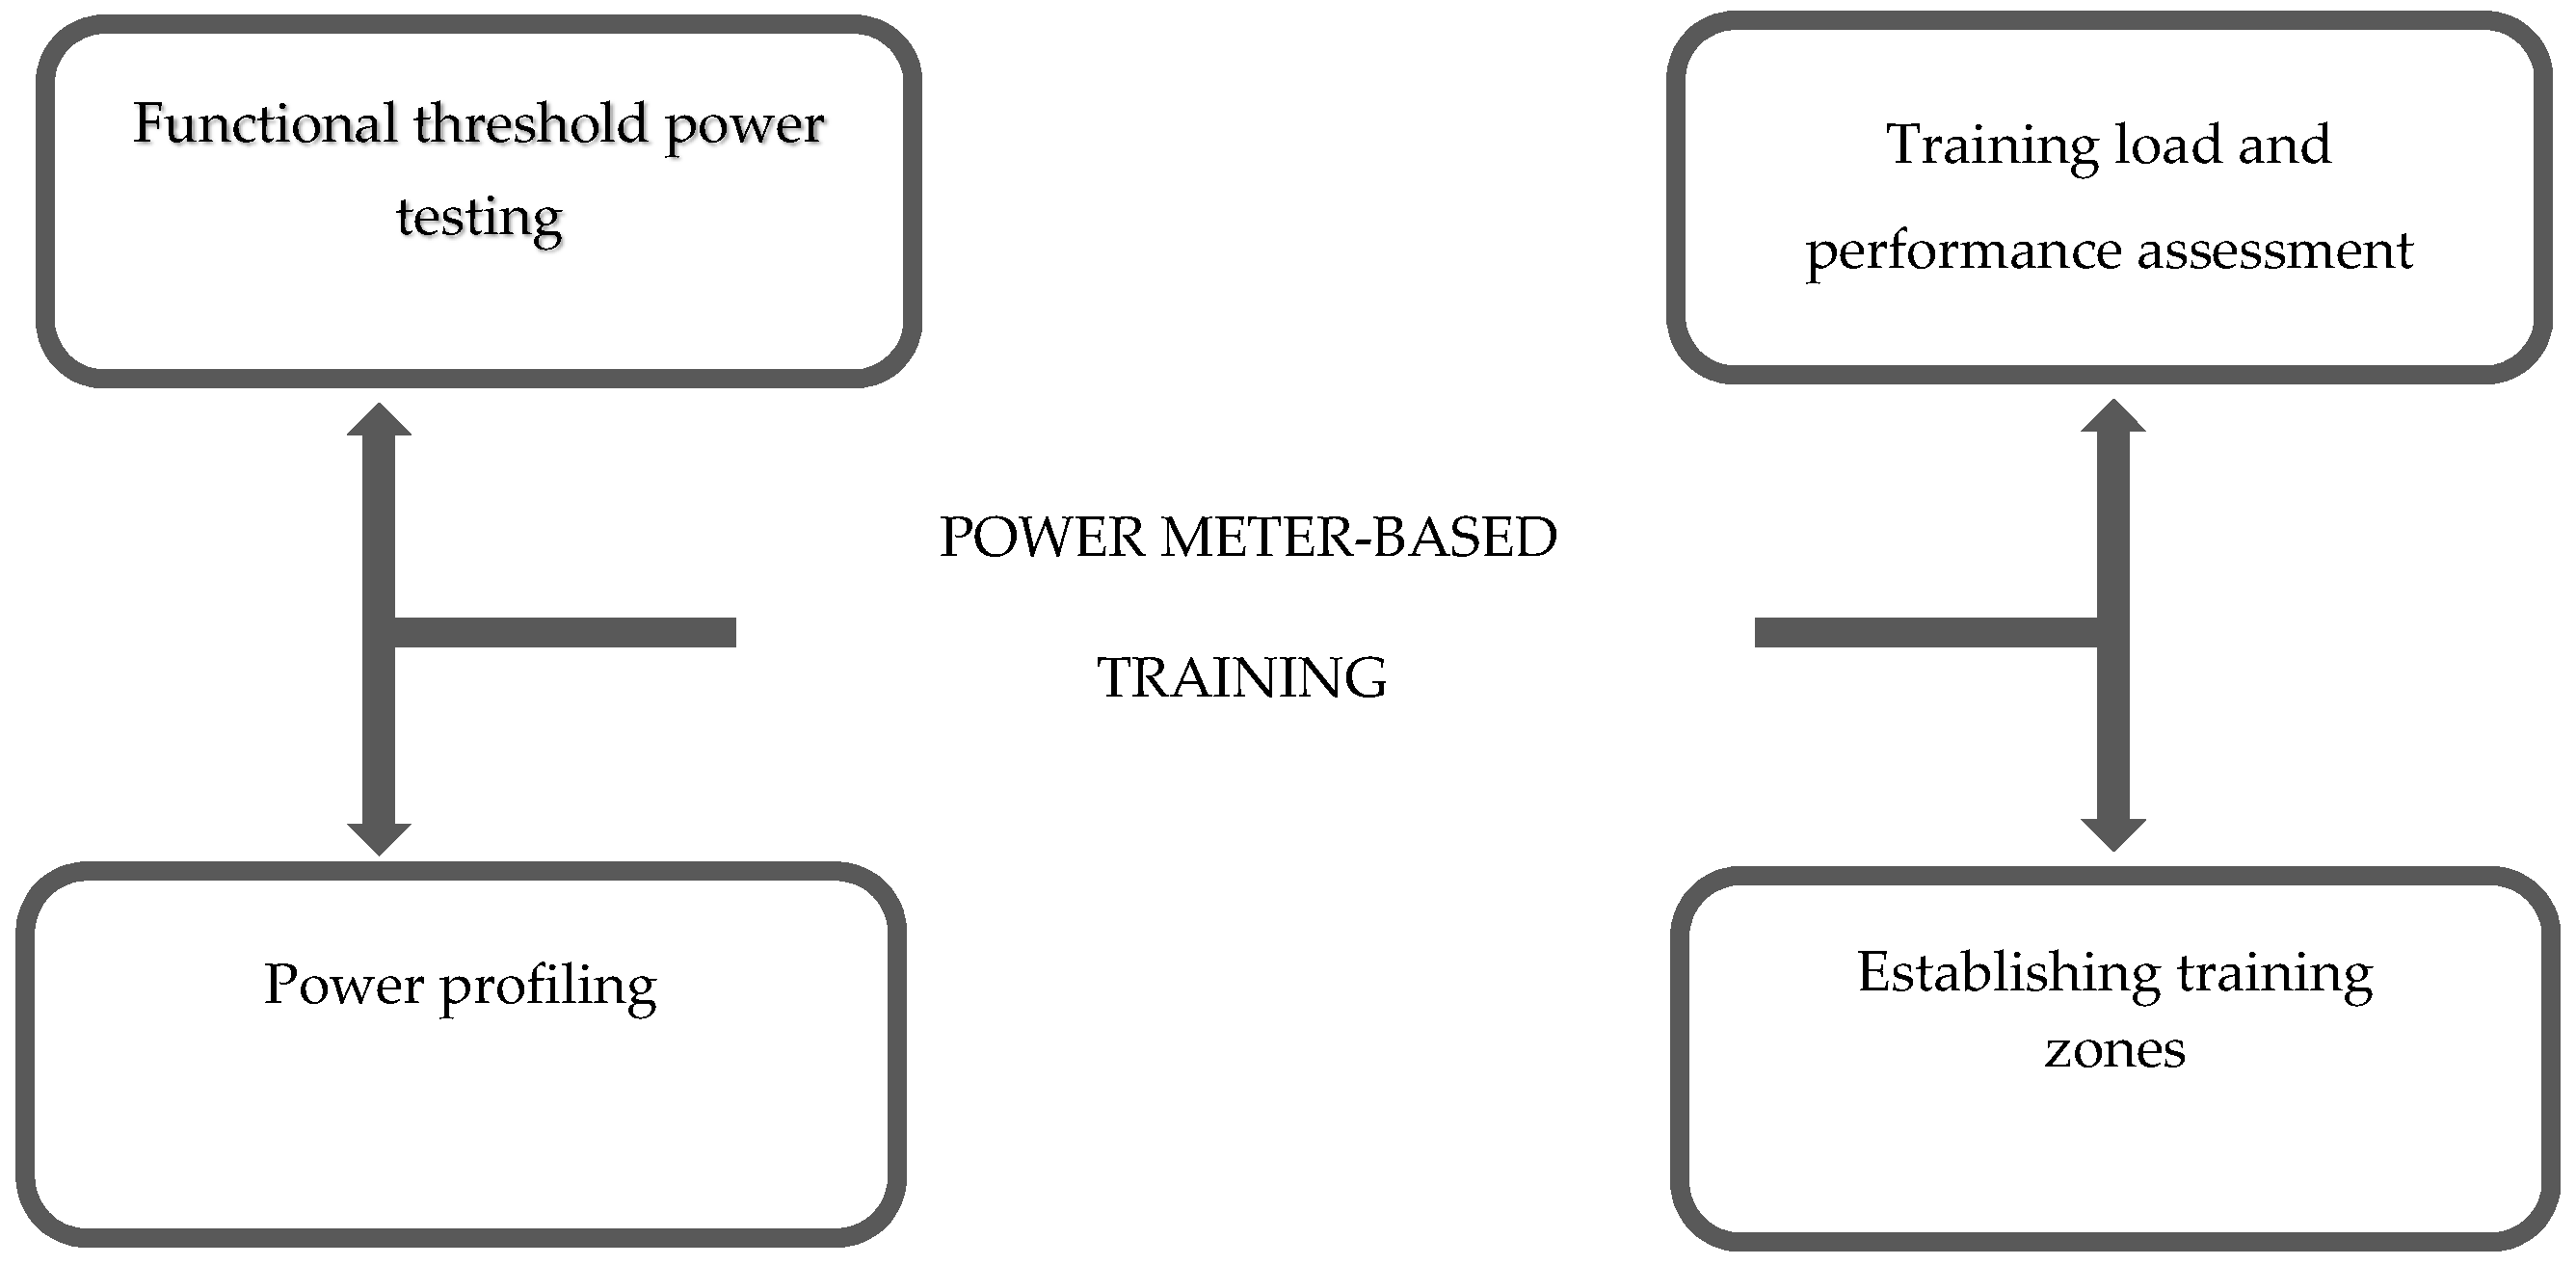
1. Introduction
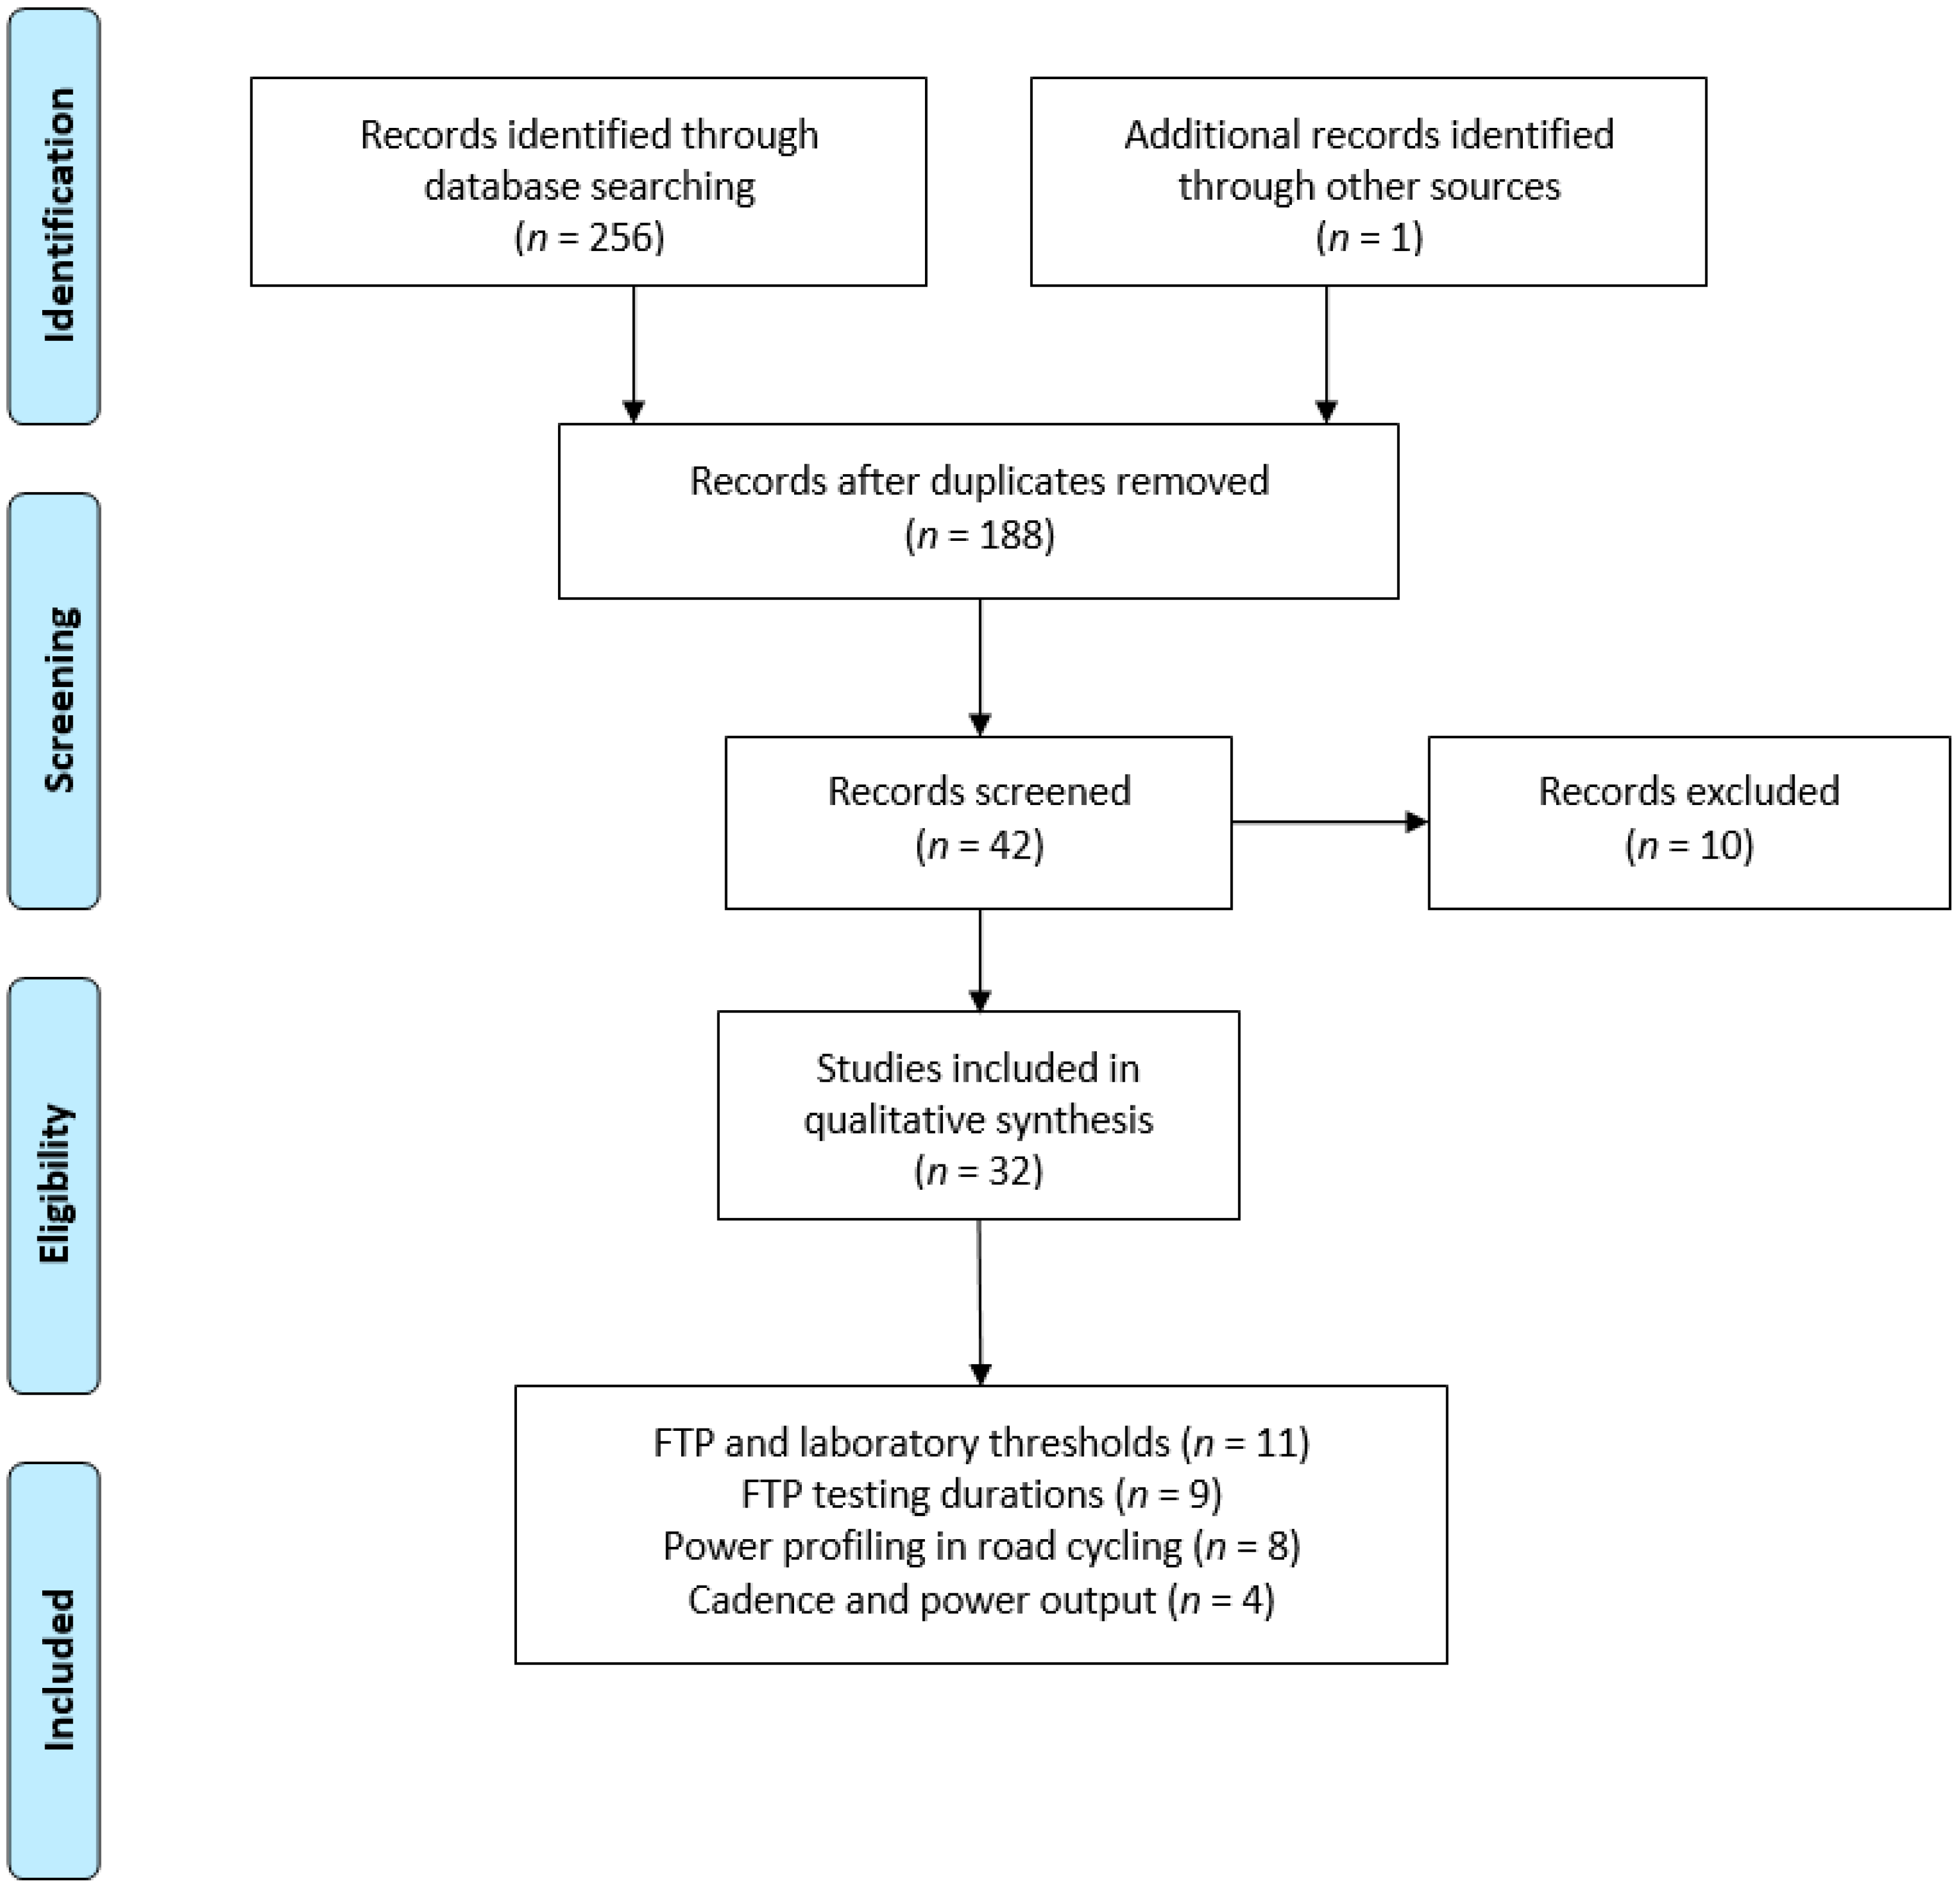
2. Methods
2.1. Information Sources
2.2. Study Inclusion Criteria
2.3. Study Exclusion Criteria
3. Review of the Literature
3.1. Relationship between Functional Threshold Power and Laboratory Thresholds
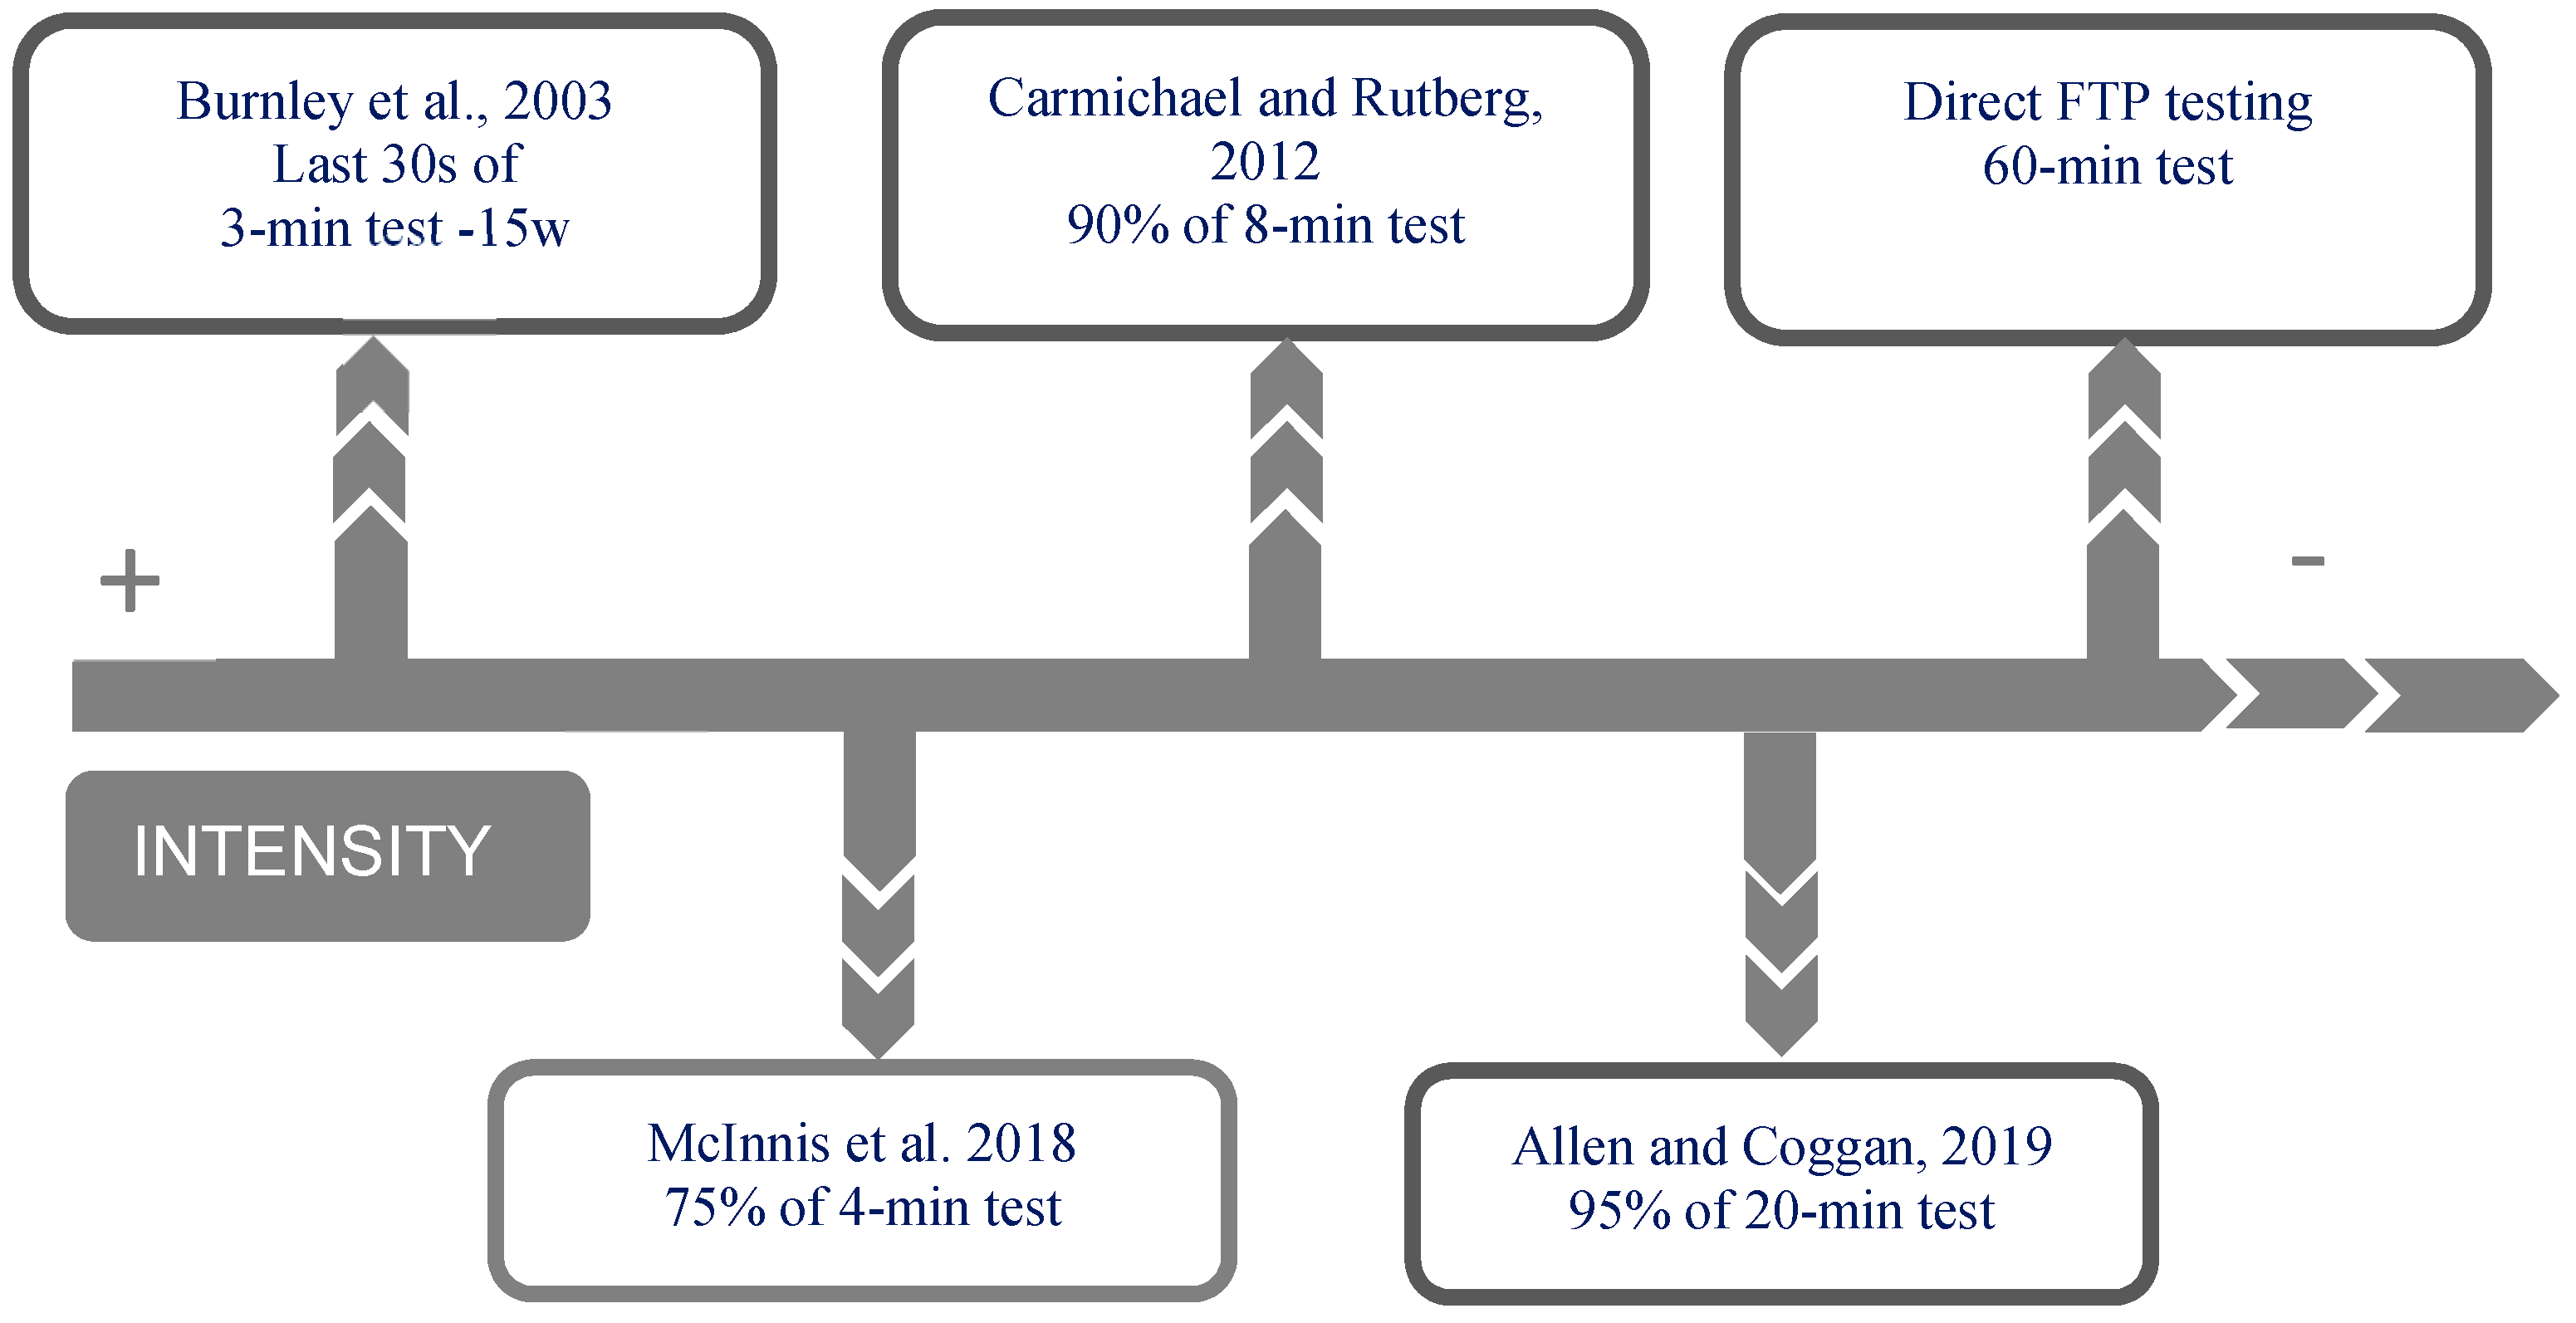
3.2. FTP Testing Durations
3.3. Power Profiling in Road Cycling
3.4. Cadence and Power Output
3.5. Limitations
4. Conclusions
Author Contributions
Funding
Conflicts of Interest
References
- Lucia, A.; Hoyos, J.; Chicharro, J.L. Physiology of professional road cycling. Sports Med. 2001, 31, 325–337. [Google Scholar] [CrossRef] [PubMed]
- Mujika, I.; Padilla, S. Physiological and performance characteristics of male professional road cyclists. Sports Med. 2001, 31, 479–487. [Google Scholar] [CrossRef] [PubMed]
- Peinado, A.B.; Romero-Parra, N.; Rojo-Tirado, M.A.; Cupeiro, R.; Butragueño, J.; Castro, E.A.; Calderón, F.J.; Benito, P.J. Physiological Profile of an Uphill Time Trial in Elite Cyclists. Int. J. Sports Physiol. Perform. 2018, 13, 268–273. [Google Scholar] [CrossRef] [PubMed]
- Støren, O.; Ulevag, K.; Larsen, M.H.; Stoa, E.M.; Helgerud, J. Physiological Determinants of the Cycling Time Trial. J. Strength Cond. Res. 2013, 27, 2366–2373. [Google Scholar] [CrossRef]
- Menaspà, P.; Quod, M.; Martin, D.; Peiffer, J.; Abbiss, C. Physical Demands of Sprinting in Professional Road Cycling. Int. J. Sports Med. 2015, 36, 1058–1062. [Google Scholar] [CrossRef]
- Bell, P.G.; Furber, M.J.W.; van Someren, K.A.; Antón-Solanas, A.; Swart, J. The Physiological Profile of a Multiple Tour de France Winning Cyclist. Med. Sci. Sports Exerc. 2017, 49, 115–123. [Google Scholar] [CrossRef]
- Wallace, L.K.; Slattery, K.M.; Coutts, A.J. A comparison of methods for quantifying training load: Relationships between modelled and actual training responses. Graefe’s Arch. Clin. Exp. Ophthalmol. 2013, 114, 11–20. [Google Scholar] [CrossRef]
- Mujika, I. Quantification of Training and Competition Loads in Endurance Sports: Methods and Applications. Int. J. Sports Physiol. Perform. 2017, 12, S2–S9. [Google Scholar] [CrossRef]
- Sanders, D.; Myers, T.D.; Akubat, I. Training-Intensity Distribution in Road Cyclists: Objective Versus Subjective Measures. Int. J. Sports Physiol. Perform. 2017, 12, 1232–1237. [Google Scholar] [CrossRef]
- Lambert, M.I.; Borresen, J. Measuring Training Load in Sports. Int. J. Sports Physiol. Perform. 2010, 5, 406–411. [Google Scholar] [CrossRef]
- Borresen, J.; Lambert, M. The Quantification of Training Load, the Training Response, and the Effect on Performance. Sports Med. 2009, 39, 779–795. [Google Scholar] [CrossRef] [PubMed]
- Jobson, S.; Passfield, L.; Atkinson, G.; Barton, G.; Scarf, P.A. The Analysis and Utilization of Cycling Training Data. Sports Med. 2009, 39, 833–844. [Google Scholar] [CrossRef] [PubMed]
- Halson, S. Monitoring training load to understand fatigue in athletes. Sports Med. 2014, 44, S139–S147. [Google Scholar] [CrossRef] [PubMed]
- Bourdon, P.C.; Cardinale, M.; Murray, A.; Gastin, P.; Kellmann, M.; Varley, M.C.; Gabbett, T.J.; Coutts, A.J.; Burgess, D.J.; Gregson, W.; et al. Monitoring Athlete Training Loads: Consensus Statement. Int. J. Sports Physiol. Perform. 2017, 12, S2–S161. [Google Scholar] [CrossRef]
- Marroyo, J.A.R.; Villa, G.; García-López, J.; Foster, C. Comparison of Heart Rate and Session Rating of Perceived Exertion Methods of Defining Exercise Load in Cyclists. J. Strength Cond. Res. 2012, 26, 2249–2257. [Google Scholar] [CrossRef] [PubMed]
- Achten, J.; Jeukendrup, A.E. Heart rate monitoring: Applications and limitations. Sports Med. 2003, 33, 517–538. [Google Scholar] [CrossRef] [PubMed]
- Pallarés, J.G.; Morán-Navarro, R.; Ortega, J.F.; Fernández-Elías, V.E.; Mora-Rodriguez, R. Validity and Reliability of Ventilatory and Blood Lactate Thresholds in Well-Trained Cyclists. PLoS ONE 2016, 11, e0163389. [Google Scholar] [CrossRef]
- Passfield, L.; Hopker, J.G.; Jobson, S.; Friel, D.; Zabala, M. Knowledge is power: Issues of measuring training and performance in cycling. J. Sports Sci. 2016, 35, 1–9. [Google Scholar] [CrossRef]
- Allen, H.; Coggan, A. Training and Racing with a Power Meter, 3rd ed.; Velo Press: Boulder, CO, USA, 2010; pp. 326–328. [Google Scholar]
- Castronovo, A.M.; Conforto, S.; Schmid, M.; Bibbo, D.; D’Alessio, T. How to assess performance in cycling: The multivariate nature of influencing factors and related indicators. Front. Physiol. 2013, 4, 116. [Google Scholar] [CrossRef]
- Pallarés, J.G.; Lillo-Bevia, J.R. Validity and Reliability of the PowerTap P1 Pedals Power Meter. J. Sports Sci. Med. 2018, 17, 305–311. [Google Scholar]
- Sparks, S.A.; Dove, B.; Bridge, C.; Midgley, A.; McNaughton, L.R. Validity and Reliability of the Look Keo Power Pedal System for Measuring Power Output During Incremental and Repeated Sprint Cycling. Int. J. Sports Physiol. Perform. 2015, 10, 39–45. [Google Scholar] [CrossRef] [PubMed]
- Maier, T.; Schmid, L.; Müller, B.; Steiner, T.; Wehrlin, J.P. Accuracy of Cycling Power Meters against a Mathematical Model of Treadmill Cycling. Int. J. Sports Med. 2017, 38, 456–461. [Google Scholar] [CrossRef] [PubMed]
- Valenzuela, P.L.; Morales, J.S.; Foster, C.; Lucia, A.; de la Villa, P. Is the Functional Threshold Power a Valid Surrogate of the Lactate Threshold? Int. J. Sports Physiol. Perform. 2018, 13, 1293–1298. [Google Scholar] [CrossRef] [PubMed]
- Gavin, T.P.; van Meter, J.B.; Brophy, P.M.; Dubis, G.S.; Potts, K.N.; Hickner, R.C. Comparison of a Field-Based Test to Estimate Functional Threshold Power and Power Output at Lactate Threshold. J. Strength Cond. Res. 2012, 26, 416–421. [Google Scholar] [CrossRef]
- Jeffries, O.; Simmons, R.; Patterson, S.D.; Waldron, M. Functional Threshold Power Is Not Equivalent to Lactate Parameters in Trained Cyclists. J. Strength Cond. Res. 2019, 1, 1–9. [Google Scholar] [CrossRef]
- Borszcz, F.K.; Tramontin, A.F.; Costa, V.P. Is the Functional Threshold Power Interchangeable with the Maximal Lactate Steady State in Trained Cyclists? Int. J. Sports Physiol. Perform. 2019, 14, 1029–1035. [Google Scholar] [CrossRef]
- Pinot, J.; Grappe, F. The Record Power Profile to Assess Performance in Elite Cyclists. Int. J. Sports Med. 2011, 32, 839–844. [Google Scholar] [CrossRef]
- Novak, A.; Bennett, K.; Pluss, M.A.; Fransen, J.; Watsford, M.L.; Dascombe, B.J. Power Profiles of Competitive and Noncompetitive Mountain Bikers. J. Strength Cond. Res. 2019, 33, 538–543. [Google Scholar] [CrossRef]
- Pinot, J.; Grappe, F. The ‘Power Profile’ for determining the physical capacities of a cyclist. Comput. Methods Biomech. Biomed. Eng. 2010, 13, 103–104. [Google Scholar] [CrossRef]
- Palmer, C. Energy Supply in the Mystery Zone: Enhancing Performance in Events Lasting 1–5 Minutes; Sports & Recreation: Wellington, New Zealand, 2008. [Google Scholar]
- Reiser, M.; Meyer, T.; Kindermann, W.; Daugs, R. Transferability of workload measurements between three different types of ergometer. Graefe’s Arch. Clin. Exp. Ophthalmol. 2000, 82, 0245. [Google Scholar] [CrossRef]
- Jeukendrup, A.E.; Craig, N.P.; Hawley, J.A. The bioenergetics of World Class Cycling. J. Sci. Med. Sport 2000, 3, 414–433. [Google Scholar] [CrossRef]
- Ericsson, F. Current Methods, Concepts, and Theories Regarding Mobile Power Meters in Cycling: A Critical Review of the Physiological and Pedagogical Implications for Training, Racing and Performance Testing; Engineering: Kopparvägen, Sweden, 2010. [Google Scholar]
- Sanders, D.; Abt, G.; Hesselink, M.K.; Myers, T.D.; Akubat, I. Methods of Monitoring Training Load and Their Relationships to Changes in Fitness and Performance in Competitive Road Cyclists. Int. J. Sports Physiol. Perform. 2017, 12, 668–675. [Google Scholar] [CrossRef] [PubMed]
- Beaver, W.L.; Wasserman, K.; Whipp, B.J. A new method for detecting anaerobic threshold by gas exchange. J. Appl. Physiol. 1986, 60, 2020–2027. [Google Scholar] [CrossRef]
- Wasserman, K.; Hansen, J.E.; Sue, D.Y.; Whipp, B.J.; Froelicher, V.F. Principles of Exercise Testing and Interpretation. J. Cardiopulm. Rehabilitat. 1987, 7, 189. [Google Scholar] [CrossRef]
- Dickhuth, H.-H.; Yin, L.; Niess, A.; Röcker, K.; Mayer, F.; Heitkamp, H.C.; Horstmann, T. Ventilatory, lactate-derived and catecholamine thresholds during incremental treadmill running relationship and reproducibility. Int. J. Sports Med. 1999, 20, 122–127. [Google Scholar] [CrossRef] [PubMed]
- de Souza, K.M.; Grossl, T.; Júnior, R.J.B.; de Lucas, R.D.; Costa, V.P.; Guglielmo, L.G.A. Máximo estado estável de lactato estimado por diferentes métodos de determinação. Braz. J. Kinanthropometry Hum. Perform. 2012, 14, 264–275. [Google Scholar] [CrossRef]
- Cheng, B.; Kuipers, H.; Snyder, A.; Keizer, H.; Jeukendrup, A.; Hesselink, M. A New Approach for the Determination of Ventilatory and Lactate Thresholds. Int. J. Sports Med. 1992, 13, 518–522. [Google Scholar] [CrossRef]
- Bishop, D.J.; Jenkins, D.; MacKinnon, L.T. The relationship between plasma lactate parameters, Wpeak and 1-h cycling performance in women. Med. Sci. Sports Exerc. 1998, 30, 1270–1275. [Google Scholar] [CrossRef]
- Borszcz, F.K.; Tramontin, A.; Bossi, A.H.; Carminatti, L.; Costa, V.P. Functional Threshold Power in Cyclists: Validity of the Concept and Physiological Responses. Int. J. Sports Med. 2018, 39, 737–742. [Google Scholar] [CrossRef]
- McGrath, E.; Mahony, N.; Fleming, N.; Donne, B. Is the FTP Test a Reliable, Reproducible and Functional Assessment Tool in Highly Trained Athletes? Int. J. Exerc. Sci. 2019, 12, 1334–1345. [Google Scholar]
- Inglis, E.C.; Iannetta, D.; Passfield, L.; Murias, J.M. Maximal Lactate Steady State Versus the 20-Minute Functional Threshold Power Test in Well-Trained Individuals: “Watts” the Big Deal? Int. J. Sports Physiol. Perform. 2020, 15, 541–547. [Google Scholar] [CrossRef] [PubMed]
- Nimmerichter, A.; Williams, C.; Bachl, N.; Eston, R.G. Evaluation of a Field Test to Assess Performance in Elite Cyclists. Int. J. Sports Med. 2009, 31, 160–166. [Google Scholar] [CrossRef] [PubMed]
- Bossi, A.H.; Lima, P.; de Lima, J.P.; Hopker, J.G. Laboratory predictors of uphill cycling performance in trained cyclists. J. Sports Sci. 2016, 35, 1–8. [Google Scholar] [CrossRef] [PubMed]
- Carmichael, C.; Rutberg, J. The Time-Crunched Cyclist: Fit., Fast, and Powerful in 6 Hours a Week; Velo Press: Boulder, CO, USA, 2012; pp. 189–197. [Google Scholar]
- Sanders, D.S.; Taylor, R.J.; Myers, T.D.; Akubat, I. A field-based cycling test to assess predictors of endurance performance and establishing training zones. J. Strength Cond. Res. 2017, 25, 1. [Google Scholar] [CrossRef]
- Klika, R.J.; Alderdice, M.S.; Kvale, J.J.; Kearney, J.T. Efficacy of cycling training based on a power field test. J. Strength Cond. Res. 2007, 21, 265–269. [Google Scholar] [CrossRef]
- Figueira, T.R.; Caputo, F.; Pelarigo, J.G.; Denadai, B.S. Influence of exercise mode and maximal lactate-steady-state concentration on the validity of OBLA to predict maximal lactate-steady-state in active individuals. J. Sci. Med. Sport 2008, 11, 280–286. [Google Scholar] [CrossRef]
- Jakobsson, J.; Malm, C. Maximal Lactate Steady State and Lactate Thresholds in the Cross-Country Skiing Sub-Technique Double Poling. Int. J. Exerc. Sci. 2019, 12, 57–68. [Google Scholar]
- Skorski, S.; Abbiss, C.R. The Manipulation of Pace within Endurance Sport. Front. Physiol. 2017, 8, 188. [Google Scholar] [CrossRef]
- Correia-Oliveira, C.R.; Santos, R.A.; Silva-Cavalcante, M.D.; Bertuzzi, R.; Kiss, M.A.P.D.; Bishop, D.J.; Lima-Silva, A.E. Prior Low- or High-Intensity Exercise Alters Pacing Strategy, Energy System Contribution and Performance during a 4-km Cycling Time Trial. PLoS ONE 2014, 9, e110320. [Google Scholar] [CrossRef]
- Hibbert, A.; Billaut, F.; Varley, M.C.; Polman, R. Familiarization Protocol Influences Reproducibility of 20-km Cycling Time-Trial Performance in Novice Participants. Front. Physiol. 2017, 8, 488. [Google Scholar] [CrossRef]
- Denham, J.; Scott-Hamilton, J.; Hagstrom, A.D.; Gray, A.J. Cycling Power Outputs Predict Functional Threshold Power and Maximum Oxygen Uptake. J. Strength Cond. Res. 2017, 1. [Google Scholar] [CrossRef] [PubMed]
- MacInnis, M.J.; Thomas, A.C.; Phillips, S.M. The Reliability of 4-Minute and 20-Minute Time Trials and Their Relationships to Functional Threshold Power in Trained Cyclists. Int. J. Sports Physiol. Perform. 2019, 14, 38–45. [Google Scholar] [CrossRef] [PubMed]
- Burnley, M.; Doust, J.H.; Vanhatalo, A. A 3-min All-Out Test to Determine Peak Oxygen Uptake and the Maximal Steady State. Med. Sci. Sports Exerc. 2006, 38, 1995–2003. [Google Scholar] [CrossRef] [PubMed]
- Quod, M.J.; Martin, D.T.; Martin, J.C.; Laursen, P.B. The Power Profile Predicts Road Cycling MMP. Int. J. Sports Med. 2010, 31, 397–401. [Google Scholar] [CrossRef]
- Pinot, J.; Grappe, F. A six-year monitoring case study of a top-10 cycling Grand Tour finisher. J. Sports Sci. 2014, 33, 907–914. [Google Scholar] [CrossRef]
- Morgan, P.T.; Black, M.I.; Bailey, S.J.; Jones, A.M.; Vanhatalo, A. Road cycle TT performance: Relationship to the power-duration model and association with FTP. J. Sports Sci. 2018, 37, 902–910. [Google Scholar] [CrossRef]
- Sanders, D.; Heijboer, M. Physical demands and power profile of different stage types within a cycling grand tour. Eur. J. Sport Sci. 2018, 19, 736–744. [Google Scholar] [CrossRef]
- Sitko, S.; López-Laval, I.; Cirer, R.; Soler, F.C.; González, J.C. Physiological demands, and characteristics of the participants in a cycling sportive event. J. Sports Med. Phys. Fitness 2019, 60, 367–373. [Google Scholar] [CrossRef]
- Sitko, S.; Cirer-Sastre, R.; Laval, I.L. Effects of a low-carbohydrate diet on performance and body composition in trained cyclists. Nutr. Hosp. 2019, 36, 1384–1388. [Google Scholar] [CrossRef]
- Keay, N.; Francis, G.; Hind, K. Low energy availability assessed by a sport-specific questionnaire and clinical interview indicative of bone health, endocrine profile and cycling performance in competitive male cyclists. BMJ Open Sport Exerc. Med. 2018, 4, e000424. [Google Scholar] [CrossRef]
- Bertucci, W.; Grappe, F.; Groslambert, A. Laboratory versus Outdoor Cycling Conditions: Differences in Pedaling Biomechanics. J. Appl. Biomech. 2007, 23, 87–92. [Google Scholar] [CrossRef] [PubMed]
- Bertucci, W.; Grappe, F.; Girard, A.; Betik, A.C.; Rouillon, J.D. Effects on the crank torque profile when changing pedalling cadence in level ground and uphill road cycling. J. Biomech. 2005, 38, 1003–1010. [Google Scholar] [CrossRef] [PubMed]
- Vanhatalo, A.; Doust, J.H.; Burnley, M. Robustness of a 3 min all-out cycling test to manipulations of power profile and cadence in humans. Exp. Physiol. 2007, 93, 383–390. [Google Scholar] [CrossRef] [PubMed]
- Whitty, A.G.; Murphy, A.J.; Coutts, A.J.; Watsford, M.L. Factors associated with the selection of the freely chosen cadence in non-cyclists. Graefe’s Arch. Clin. Exp. Ophthalmol. 2009, 106, 705–712. [Google Scholar] [CrossRef]
- Whitty, A.G.; Murphy, A.J.; Coutts, A.J.; Watsford, M. The effect of low- vs high-cadence interval training on the freely chosen cadence and performance in endurance-trained cyclists. Appl. Physiol. Nutr. Metab. 2016, 41, 666–673. [Google Scholar] [CrossRef]


| Study | Sample | FTP Estimation Method | Laboratory Threshold Estimation Method | Results | Practical Application |
|---|---|---|---|---|---|
| Borszcz et al., 2018 [42] | 23 trained male cyclists (VO2max 59.4 ± 5.9 mL/kg/min). | 95% of 20-min maximal power output and 60-min mean power output. | 1.5 mmol/L above the point of minimum ratio between La and work rate. | Large to very large correlations were found between LT and FTP20 (r = 0.61) and between LT and FTP60 (r = 0.76) for PO. | Both tests are more related to LT than 8-min tests. FTP and LT should not be used interchangeably unless tested on an individual basis. |
| Borszcz et al., 2019 [27] | 7 trained (VO2max 55–64.9 mL/kg/min) and 8 well-trained (VO2max 65–71 mL/kg/min) cyclists. | 95% of 20-min maximal power output. | Highest exercise intensity in which La did not show an increase of >1 mmol/L. | r = 0.91 between FTP and LT. Well-trained group showed a higher association with the PO measures (r = 0.94) than the trained group (r = 0.91). | FTP can be used as a non-invasive and practical alternative for estimating LT. |
| Bossi et al., 2017 [46] | 15 trained cyclists (VO2max 56.1 ± 7.7 mL/kg/min). | 95% of 20-min maximal power output. | VT and RCP. | r = 0.80 between FTP (W/kg) and RCP. r = 0. 59 between FTP and VT. | FTP determined from a 20-min test is strongly related to laboratory variables. |
| Inglis et al., 2020 [44] | 18 competitive cyclists. | 95% of 20-min maximal power output. | MLSS. | PO at MLSS represents 93.1% of PO at FTP. | PO at FTP is higher than PO at MLSS. |
| Gavin et al., 2012 [25] | 7 trained male competitive cyclists (VO2max = 65.3 ± 1.6 mL/kg/min). | 90% of 8-min maximal power output. | 1 mmol/L or greater rise in blood La and blood La of 4.0 mmol/L. | PO at estimated FTP from the 8-min FTP was significantly greater than the PO at LTD1 but not different from the PO at LT4.0. | FTP was only equivalent to LT at 4.0 mmol/L. |
| Jeffries et al., 2019 [26] | 20 competitive male cyclists. | 95% of 20-min maximal power output. | Fixed blood La concentration 4.0 mmol/L, Dmax and modified Dmax. | FTP was strongly correlated (r = 0.88, p < 0.001) with the PO associated with a fixed blood La concentration 4.0 mmol/L but no association was found with other measures. | FTP was only associated to LT at 4.0 mmol/L. |
| Klika et al., 2007 [49] | 24 recreational cyclists (VO2max 46.2 mL/kg/min). | 90% of 8-min maximal power output. | Power at which blood La increased 1 mmol/L above baseline. | FTP was approximately 7.5% higher than LTmeasured under laboratory conditions. | Adjustments are needed when using FTP and LT interchangeably. |
| McGrath et al., 2019 [43] | 19 highly trained cyclists and triathletes (VO2max 66.3 ± 5.5 mL/kg/min). | 95% of 20-min power output. | Dmax. | 89% of athletes sustained FTP during 60-min. r = 0.89 between Dmax and FTP. | FTP represents a quasi-steady state that can be sustained for one hour. |
| Nimmerichter et al., 2010 [45] | 15 competitive male cyclists (VO2max 65 ± 4 mL/kg/min). | 20 and 4-min maximal power output. | VT; RCP, nonlinear increases in La vs. power output. | PO during the 20-min time trial correlated with PO at the second lactate turn point and the RCP. | PO during 20-min time trial has acceptable accuracy to determine laboratory markers. |
| Sanders et al., 2017 [48] | 19 well-trained road cyclists (VO2max 64 ± 4 mL/kg/min). | 90% of 8-min maximal power output. | 4 mmol/L, initial rise of 1 mmol/L above baseline, Dmax, and modified Dmax. | FTP very largely different than Dmax, largely different than PO at initial lactate rise of 1 mmol/L and moderately different than PO at 4 mmol/L and mDmax. | The 8-min FTP test is recommended as a tool for endurance assessment but cannot be used interchangeably with LT. |
| Valenzuela et al., 2018 [24] | 11 recreational (peak power output <4.5 W/kg) and 9 trained (peak power output >4.5 W/kg) cyclists. | 95% of 20-min maximal power output. | Dmax. | Strong correlation between FTP and LT (r = 0.95; p < 0.0001) but FTP was significantly lower (p = 0.0004) in recreational cyclists. | FTP can be used for the assessment of endurance fitness. However, it may underestimate LT in recreational cyclists. |
© 2020 by the authors. Licensee MDPI, Basel, Switzerland. This article is an open access article distributed under the terms and conditions of the Creative Commons Attribution (CC BY) license (http://creativecommons.org/licenses/by/4.0/).
Share and Cite
Sitko, S.; Cirer-Sastre, R.; Corbi, F.; López-Laval, I. Power Assessment in Road Cycling: A Narrative Review. Sustainability 2020, 12, 5216. https://doi.org/10.3390/su12125216
Sitko S, Cirer-Sastre R, Corbi F, López-Laval I. Power Assessment in Road Cycling: A Narrative Review. Sustainability. 2020; 12(12):5216. https://doi.org/10.3390/su12125216
Chicago/Turabian StyleSitko, Sebastian, Rafel Cirer-Sastre, Francisco Corbi, and Isaac López-Laval. 2020. "Power Assessment in Road Cycling: A Narrative Review" Sustainability 12, no. 12: 5216. https://doi.org/10.3390/su12125216
APA StyleSitko, S., Cirer-Sastre, R., Corbi, F., & López-Laval, I. (2020). Power Assessment in Road Cycling: A Narrative Review. Sustainability, 12(12), 5216. https://doi.org/10.3390/su12125216