Article

Synergies of Cutting Air Pollutants and CO2 Emissions by the End-of-Pipe Treatment Facilities in a Typical Chinese Integrated Steel Plant

1
Department of Environmental Science and Engineering, Fudan University, Shanghai 200433, China
2
Big Data Institute for Carbon Emission and Environmental Pollution, Fudan University, Shanghai 200433, China
*
Authors to whom correspondence should be addressed.
Sustainability 2020, 12(12), 5157; https://doi.org/10.3390/su12125157
Submission received: 18 May 2020 / Revised: 16 June 2020 / Accepted: 18 June 2020 / Published: 24 June 2020
(This article belongs to the Section Energy Sustainability)

Abstract

:
Reducing industrial emissions has become increasingly important, given China’s ongoing industrialization. In this study, the reduction in CO2 emissions and air pollutants due to end-of-pipe treatment in a typical integrated steel plant in China was assessed. The emissions were subdivided into sector levels, including main production and auxiliary departments. The synergies of reducing air pollutants and CO2 emissions using end-of-pipe treatment technologies were quantified, including direct and indirect effects. The results show that (1) using the carbon balance method is more suitable for the greenhouse gas (GHG) emissions of the steel plants in China at the enterprise and sector levels. The carbon-related parameters adopted in the carbon balance method strongly impact the accuracy of the emission calculation. (2) Compared with the direct synergistic CO2 emissions caused by chemical reactions, the indirect emissions due to the power consumption of the end-of-pipe facilities is more significant. (3) To achieve the control of local air pollutants and CO2 emissions, the negative effects of CO2 emissions caused by the end-of-pipe treatment technologies should be considered.

1. Introduction

Addressing global climate change and the air pollution problem is one of the biggest challenges of the 21st century. The various local industrial air pollutants include particulate matter (PM), SO2, NOx, and CO2, and the majority of greenhouse gas (GHG) emissions are mainly generated by combusting fossil fuels. As such, there are synergies between reducing air pollutants and controlling GHG emissions. The iron and steel industry (ISI) is the source of a large amount of GHGs and local air pollutant emissions, so research has focused on the control of these emissions. During the past 10 years, with the implementation of structural adjustment and output control, the annual output of crude steel in China’s steel industry has stabilized at approximately 800 Mt, accounting for nearly 50% of the world’s total output [1] (Figure 1).
The high production of China’s ISI generates a large amount of SO2 and total suspended particulate (TSP) [2] (Figure 2) emissions, so air pollutant reduction and energy efficiency use improvement in the ISI have gradually become the focus of environmental protection. China’s total GHG emissions were 1.19 × 10¹⁰ t·CO2eq in 2012, of which the energy-related emissions accounted for 78.5% and industrial process emissions for 12.3% [3]. The ISI is the third largest GHG emission source after thermal power and construction in China due to its coal-based energy structure and the large amount of carbon-related materials used [4].
In the current context, China’s emission control of local air pollutants is becoming increasingly strict. The implementation of China’s Air Pollution Prevention and Control Action Plan [3] has brought China’s thermal power industry ultra-low-emission transformation close to completion, and the transformation in the ISI is still underway [5]. Of the SO2 and PM2.5 discharged in the sintering process, 65.62% is mainly from the converter process in China’s ISI [6], and end-of-pipe treatment is widely used to reduce the emission of air pollutants. Flue gas desulfurization (FGD) technologies, such as limestone–gypsum wet FGD, rotary spray semi-dry FGD, ammonia desulphurization, and flue gas circulating fluid bed desulfurization, are generally applied during sintering [7]. Besides the bag filters and electrostatic precipitators (ESPs), which are the most commonly used industrial dedusting facilities, oxygen converter gas recovery systems and the Lurgi–Thyssen dust removal (LTDR) system are the dust removal technologies used in the process of dedusting the converter fume [8].
End-of-pipe treatment technologies for local air pollutants significantly reduce the emission of local air pollutants, but some of them actually increase the emission of GHGs. To achieve synchronous control, the production and emissions of local air pollutants and GHGs must be accurately calculated to study their correlation.
Many energy efficiency improvement and energy-saving measures can simultaneously abate air pollutants and GHG emissions [9], which means that they have positive synergies. For example, Kuramochi, Xuan et al. found that using imported scrap steel in the steel industry can reduce CO2, SO2, and PM simultaneously [10,11]. SO2, NOx, PM, and CO2 emissions can be simultaneously reduced using energy-saving technologies [12,13] and industrial restructuring [14,15,16] in the steel industry. Most of the research has focused on the benefits produced by increasing energy efficiency, reducing energy use, reducing product output, and using alternative raw materials. However, some local air pollutant emission reduction technologies can increase the GHG emissions, especially end-of-pipe technologies [17,18], which are negative synergies. In the future, for industries with high energy consumption and high air pollutant emissions in China, such as the ISI, reducing air pollutants is more of a priority than reducing GHGs [18], and the end-of-pipe treatment technologies have the largest reduction potential to achieve local air pollution mitigation [19]. Although adopting end-of-pipe facilities is one of the main approaches to reducing local air pollutants, research is lacking on the synergies of air pollution control through end-of-pipe technologies, especially the co-effect of carbon emissions produced. Steel enterprises also require more detailed data to support local air pollutant and GHG emission accounting, which can be used to guide their own selection or transformation of manufacturing processes and end-of-pipe treatment.
To achieve the above goals, the Chinese ISI must apply comprehensive emission accounting, considering the synergies of local air pollutant end-of-pipe treatment technologies and GHG emissions. The three mainstream GHG emission calculation methods for ISI are: the emission factor (EF) method, the carbon balance method, and life cycle analysis (LCA). The EF method calculates the regional and national carbon emissions, but the EFs used need to be localized. The EFs from the Intergovernmental Panel on Climate Change (IPCC) are used internationally but are relatively inaccurate in China [20,21] due to the differences in fuels and their combustion properties [22] or in industrial production technology [23]. LCA is mainly used to calculate the upstream and downstream emissions in addition to the emissions from the plant to determine the driving forces and factors influencing GHG emissions [24,25]. The carbon balance method, requiring a materials input–output table and the energy consumption of enterprises, is complicated for data acquisition but is suitable for studying GHG emission characteristics at the plant and sector levels. Using more characteristic results can help with offering targeted measures to reduce emissions.
In this study, we used the emission factor method and the carbon balance method to calculate the production and emissions of local air pollutants and CO2 in each step of the steel industry process from the bottom up to the plant level, taking a Chinese integrated steel plant as an example. The differences between China’s commonly used carbon balance accounting method, which relies on two sets of carbon content (the default value of the guideline and the characteristic values of the plant), and the IPCC EF method were compared to identify a more suitable approach for GHG emissions accounting at the department level. On this basis, the synergies between local air pollutant abatement and CO2 emissions produced by end-of-pipe treatment were analyzed.

2. Materials and Methods

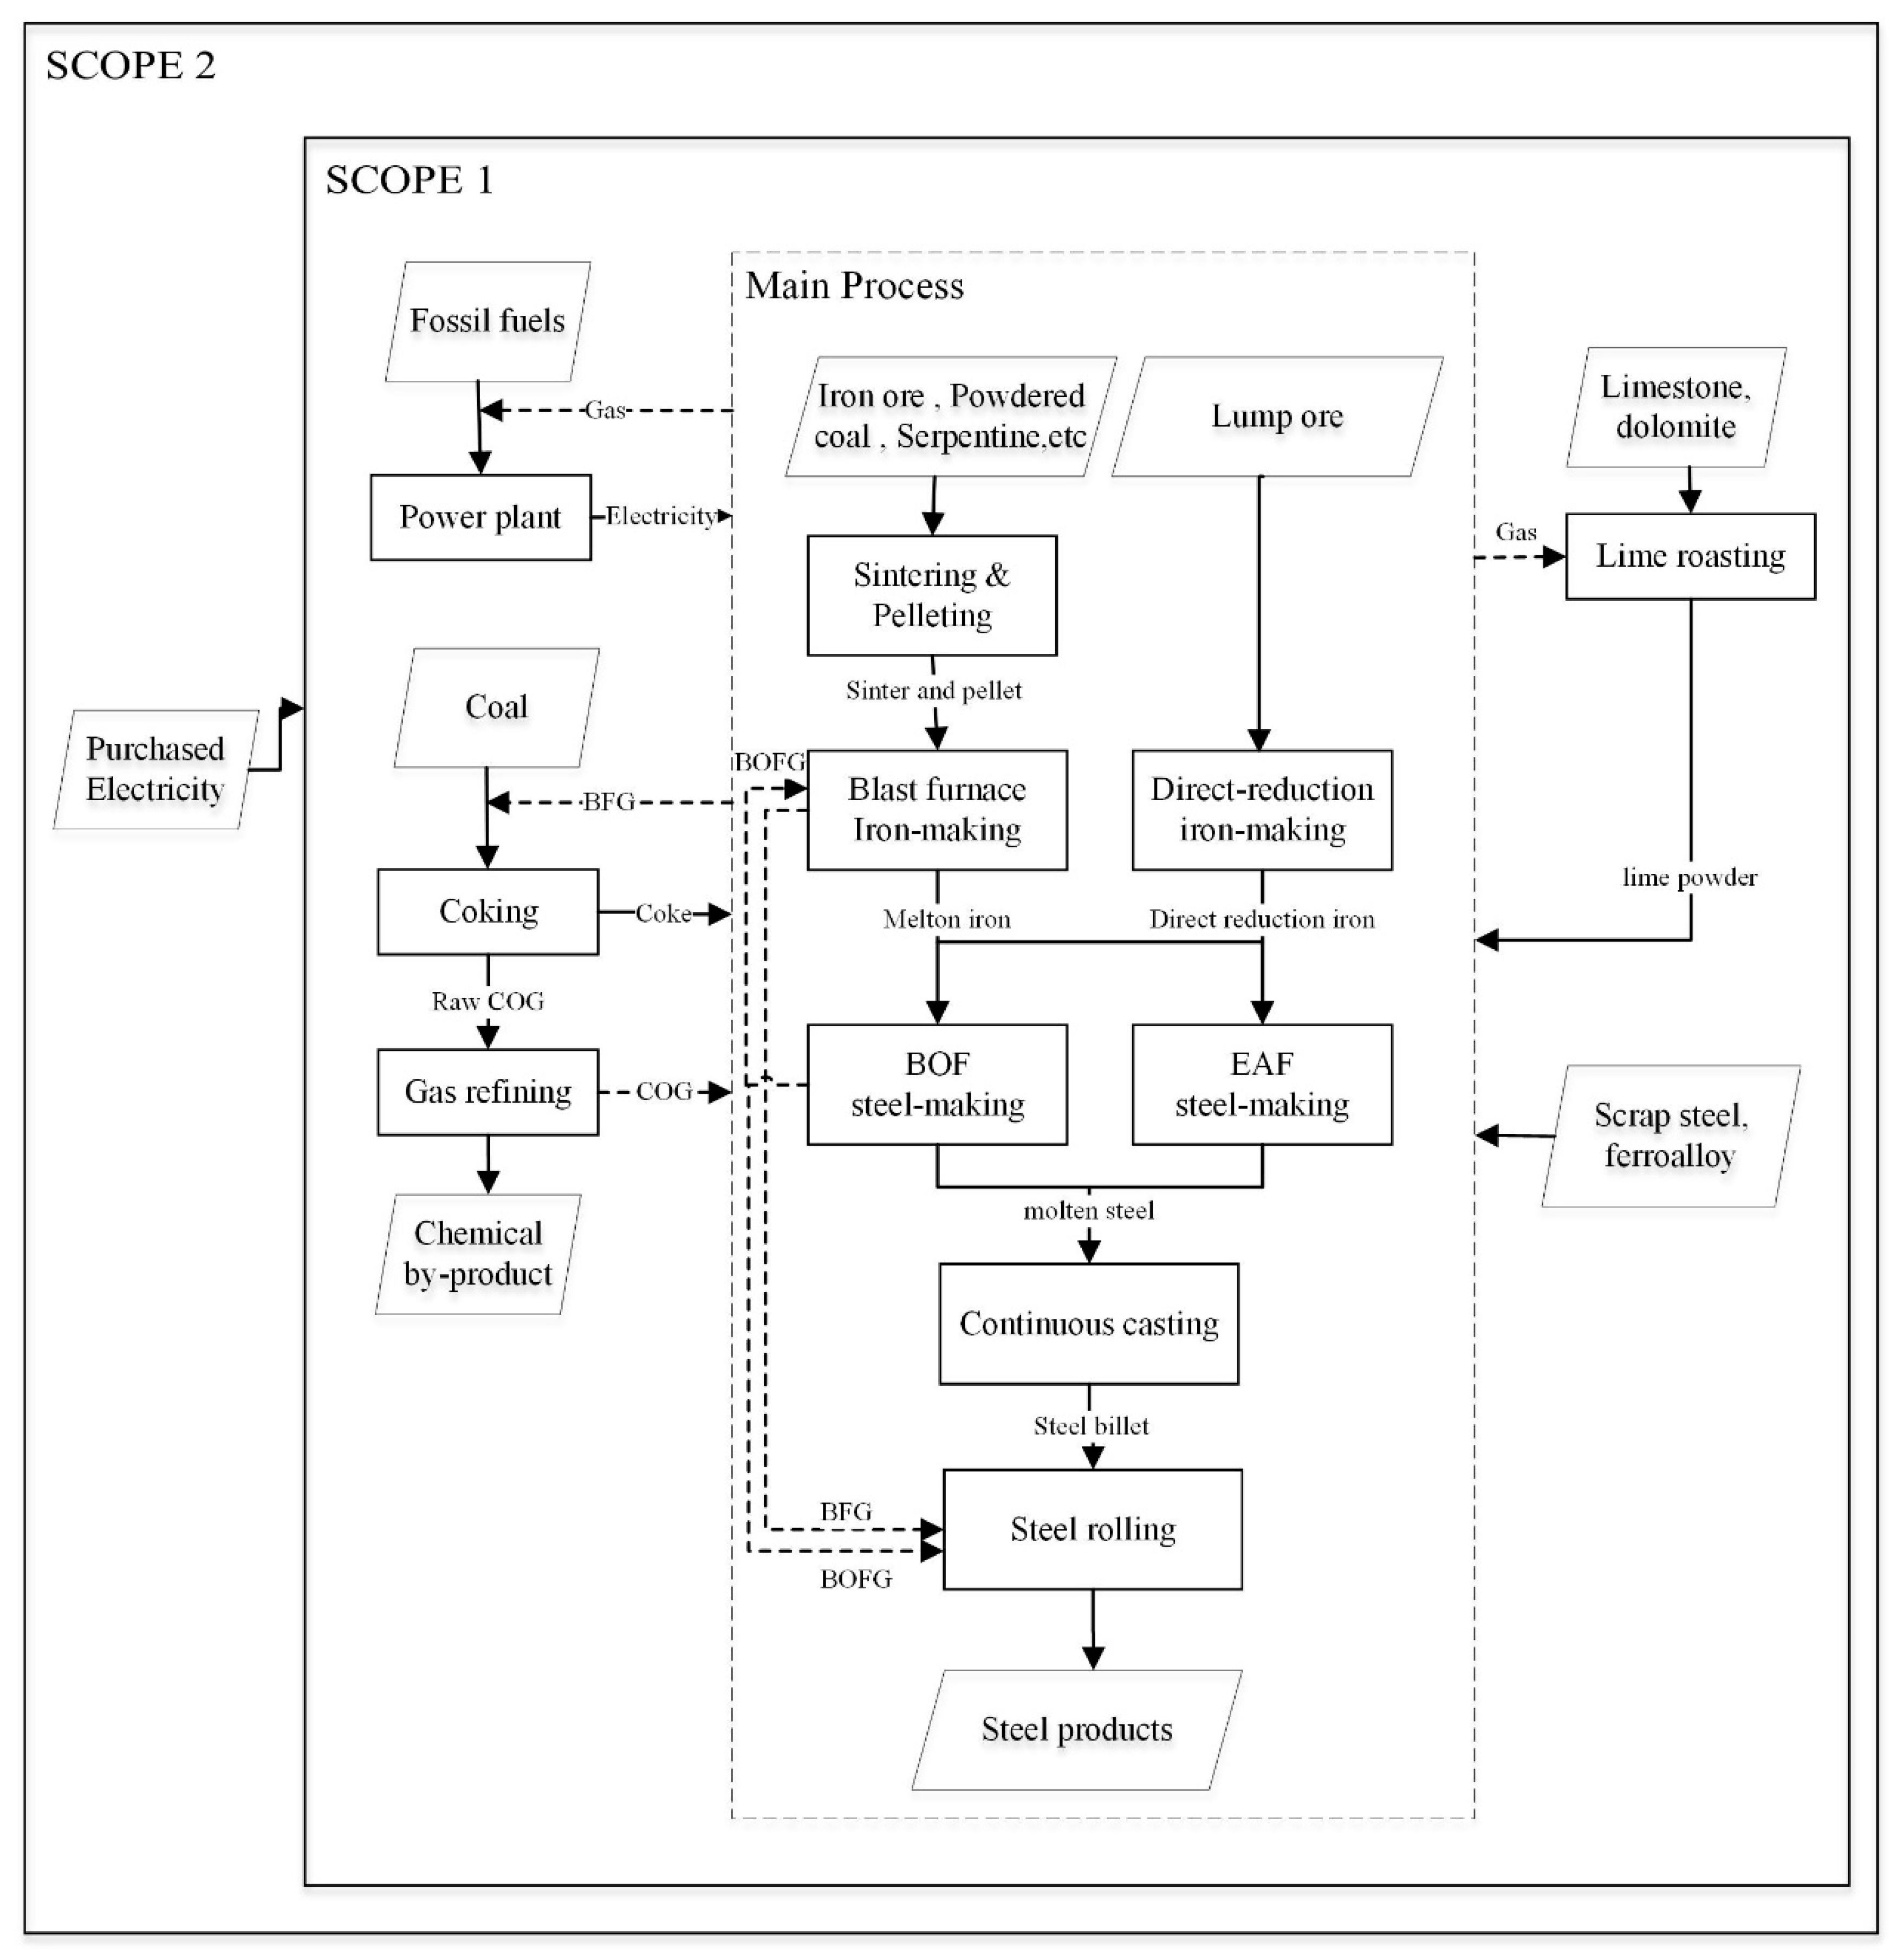
2.1. Research Boundary

Long process flow steel production, compared to short process flow, is a complex system that covers multiple sectors, especially the high emission sectors, including coking, sintering, and power plants. We selected two scopes for consideration. In Scope 1, the production, reduction, and emissions of SO2, TSP, and CO2 were studied based on a long process integrated steel plant. The main production departments of a typical long process integrated steel plant include: sintering/pelleting, iron-making, steel-making, steel-rolling, and auxiliary departments, including coking, lime roasting, and the power plant. The specific production flow is shown in Figure 3. Steel-making technology was divided into basic oxygen furnace (BOF) and electric arc furnace (EAF) for the calculation of their different mechanisms with respect to GHG emissions. In addition to the main raw materials and product flow, the generation departments, including blast furnace gas (BFG), coke oven gas (COG), and basic oxygen furnace gas (BOFG) and their flow direction, are depicted in the figure. Scope 2 involved considering the indirect emissions from the purchased power based on Scope 1. Acronyms and symbols used were listed in Appendix A.

2.2. Emissions Calculation

2.2.1. Calculation of Air Pollutant Emissions

SO2 and TSP emissions of local air pollutants in an integrated steel plant are produced by the production process and fuel combustion. The EF method was used to calculate the production and emissions of SO2 and TSP within the plant boundary, and the EFs were selected in accordance with the production scale and the process used by the departments in the enterprise. For Scope 1, the productions, emissions, and reductions of the local air pollutants were separately calculated using Equations (1)–(3), respectively:
P a , i = E F i × A i × 10 3 ,
E a , i = P a × ( 1 η ) ,
R a , i = P a × η ,
where P denotes the production of air pollutants (t); E denotes the emissions of air pollutants (t); R denotes the reduction of air pollutants (t); subscripts a and i denote the pollutant types (including SO2 and TSP) and the departments of the integrated steel plant (including coking, sintering, iron-making, steel-making, steel-rolling, lime roasting, and power plant), respectively; EF denotes the EFs (kg/t or mg/Nm3); A denotes the consumption of raw materials (t or 10-6 Nm3) in the power plant or annual production (t) in the other departments; and η denotes the removal rate of pollutants (%).
Due to the lack of EFs of SO2 in steel-making, SO2 was calculated using Equation (4) as SO2 is produced from fuel combustion in the heating furnace during steel-making:
E S O 2 , s t e e l m a k i n g = 1.822 × 10 5 × k ( F k × E F k ) ,
where E S O 2 , s t e e l m a k i n g is the emission of SO2 in the steel-making department (t), F is the input of gaseous fuel used (Nm3), EF denotes the hydrogen sulfide content of the fuel (mg/Nm3), and subscript k denotes the fuel types.
The indirect emissions of SO2 and TSP produced by purchased electric power were calculated. For example, EFSO2 = 3.13 t·SO2/GWh, and EFTSP = 0.75 t·TSP/GWh, which were computed by the electric power generation and air pollutant emissions of the production and support of electric power and heat power sector in the statistical data [26]. Equation (5) was used to calculate the total emission of local air pollutants for Scope 2:
E a , t o t a l = i E a , i + E l × E F a ,
where E t o t a l denotes the total emission of air pollutants, including direct and indirect emissions (t); subscripts a and i denote the air pollutant types and departments, respectively; El denotes the electric power purchased from the power grid (MWh); and EF denotes the emission factor (CO2/MWh), which was calculated using the data from the environmental statistics yearbook.

2.2.2. Calculation of CO2 Emissions

The EF method and carbon balance method were used to calculate the CO2 emissions of the target plant. The output of each department and the EFs (Appendix B), which are quoted from the IPCC [27,28] (hereafter referred to as IPCC Tier1), were used to calculate the sectoral carbon emissions using the EF method in Equation (6).
E C O 2 , i = P i × E F i ,
where subscript i denotes the departments, E C O 2 denotes the CO2 emission (t),   P denotes the annual production (t), and EF denotes the emission factors (t·CO2/t).
The carbon balance method can be used to calculate the carbon emissions from the materials used and carbon sequestration in the products based on an input–output table of the enterprise. Equation (7) was used to calculate CO2 emissions from process and fuel combustion in Scope 1.
E C O 2 , i = ( j M j × α j + k F k × L C V k × C C k × O F k m M P m × α m n B P n × α n )                                             × 44 12 ,
where the subscripts i, j, k, m, and n denote the department, raw material types, fuel types, main product types, and by-product types, respectively; E C O 2 denotes the emissions of CO2 (t); M denotes the input of the raw materials used (t); α is the carbon content; F denotes the input of the fuel used (t or 104 Nm3); MP denotes the output of the main products (t); BP denotes the output of the by-products (t); LCV is the low calorific value (GJ/t or GJ/104 Nm3; C C k denotes the carbon content per unit calorific value (t·C/GJ); and O F k is the carbon oxidation rate (%).
Since the indirect CO2 emission from purchased electric power was considered, the total CO2 emission in the integrated steel plant was calculated using Equation (8):
E C O 2 , t o t a l = i = 1 7 E C O 2 , i + E l × E F p g ,
where E C O 2 , t o t a l denotes the CO2 emission of the whole integrated steel plant (t); the subscript i denotes the department; ECO2 is the emissions of CO2 (t); El denotes the electric power purchased from the power grid (GWh); and E F p g denotes the emission factor of the power grid (t·CO2/GWh).
The accuracy of the carbon balance method is largely affected by the carbon content used. Many calculation methods (such as the Tier 3 method from the IPCC) encourage people to use the plant-specific carbon content to obtain more accurate calculation results. However, the carbon contents of many materials are not available, so the default value needs to be used for the calculation. Two sets of carbon contents were used to compare the difference between the default and actual values: one was based on the Greenhouse Gas Emission Accounting Method and Reporting Guidelines for Chinese Iron and Steel Enterprises (on trial) [29] (hereafter referred to as NDRC), and the other was based on data from the Retrospective Environmental Impact Assessment of the Enterprise (hereafter referred to as the REIA report) (Appendix C).
From the comparison of these two sets of parameters, the carbon contents of BOFG, crude benzene, and limestone in the REIA report are slightly lower than the default value in the NDRC guidelines. In addition, the carbon content is higher in the REIA report than in the NDRC guidelines for most materials.
In the actual production process, gas ash from BFG is reused as a carbonaceous raw material. Therefore, this calculation method included gas ash with a carbon content of 30% [30]. Some materials with less use or low carbon content, such as the mill scale and the sinter, were not considered in the CO2 emissions calculation.

2.3. Synergies Assessment

The synergies of the end-of-pipe technologies include direct and indirect effects. Direct effects refer to the GHG emissions produced by the chemical reactions that occur in the end-of-pipe treatment, such as flue gas desulfurization equipment that uses limestone and lime as desulfurizers.
Taking the limestone–gypsum wet FGD method as an example, the removal of SO2 by CaCO3 leads to CO2 emissions:
CaCO 3 + 2 SO 2 + H 2 O C a ( H S O 3 ) 2 + C O 2 ,
CaCO 3 + C a ( H S O 3 ) 2 + O 2 + 3 H 2 O 2 CaCO 4 · 2 H 2 O + C O 2 .
At this point, end-pipe-treatment can impact the GHG emissions in addition to reducing the target air pollutant through chemical reactions.
The indirect effects refer to the indirect GHG emissions caused by power consumption of the end-of-pipe equipment. The power consumption is often affected by factors such as the air volume and inlet concentration of the local air pollutants, and the same technology consumes different amounts of power in different departments, which is often ignored and hard to quantify.

2.3.1. Calculation of Synergistic Emissions

The GHG emissions caused by the desulfurization facilities can be estimated according to the internal chemical reactions. For the limestone–gypsum wet FGD method mentioned previously, reaction equations show that removing every 1 kg of SO2 produces 0.68 kg of CO2 emissions. Using limestone–gypsum wet FGD can reduce about 50% of the TSP along with desulphurization, and the practical emission reduction rate changes with the sulfur and ash contents of the coal used [31].
The CO2 emissions implied in the energy consumption can be calculated by the power consumption coefficient and CO2 emissions per unit power consumption. Few measurements and statistics are available for the power consumption of end-of-pipe treatment in steel enterprises, so we used the power consumption per unit dedusting and power consumption per unit desulfurization, which were obtained from the literature as indicators to determine the power consumption coefficient of the dedusting and desulfurization facilities. The proportion of electricity generation is often used to calculate the power consumption of desulfurization and dedusting facilities in the thermal power industry. Because power plants in integrated steel enterprises are similar to thermal power plants, we used 2.4% and 0.45% [32] of the gross generation as the power consumption of the lime–gypsum wet FGD equipment and electrostatic precipitator in the power plant, respectively.
When the rated power and annual air pollutant removal capacity of the equipment are known, Equation (9) can be used to calculate the power consumption coefficient.
C E e c , i = P × w h R a , i ,
where C E e c denotes the electric power consumption coefficient (kWh/t); the subscripts i and a denote departments and air pollutants, respectively; P denotes the rated power of terminal treatment facilities (kW);   R denotes the annual reduction of air pollutant (t); and wh denotes the annual working hours of the terminal treatment facilities (h).
Except for in the power plant, the power consumption coefficients of end-of-pipe equipment in the various departments are shown in Table 1, from which the annual power consumption can be estimated.
The electric power used by the integrated steel enterprises comes from its internal power plant, other power generation facilities, and the regional power grid. Since the power grid of the enterprise acts as a whole, the purchased power and the power generated inside the enterprise are mixed and sent to all power consumption departments, so the source of power used by each department cannot be traced. Therefore, we chose Scope 2 to calculate the CO2 emissions produced by the power consumption of the end-of-pipe facilities. The amount of power consumption can be calculated, but determining its sources was difficult. To account for the indirect emissions caused by power consumption, the CO2 emissions of the power consumption in the enterprise were calculated using Equation (10), which combines emissions from the internal power plant and external regional power grids:
E F C O 2 , e l e c t r i c i t y = E C O 2 , p o w e r   p l a n t + E l pg × E F p g E l + E l p g ,
where E F C O 2 , e l e c t r i c i t y denotes the emission factor of the specific steel plant (t/MWh), E C O 2 , p o w e r   p l a n t denotes the CO2 emissions in the internal power plant (t),   E F p g denotes the emission factor of the electric power purchased from the power grid outside the enterprise (t/MWh), El denotes the annual generation capacity of the steel plant (MWh), and Elpg denotes the electric power purchased from the power grid (MWh).
The CO2 emissions related to the power consumption of the end-of-pipe facilities in each department were calculated using Equation (11):
E C O 2 , a = ( P a , i E a , i ) × C E a , i × E F C O 2 , e l e c t r i c i t y ,
where E C O 2 denotes the CO2 emissions related to the power consumption of the end-of-pipe treatment (t); subscripts i and a denote the departments and the air pollutant types, respectively; CE denotes the coefficient of electric power consumption (kwh/t); P denotes the production of air pollutants (t); and E denotes the emissions of air pollutants (t).

2.3.2. Pollutant Reduction Cross-Elasticity

The equation for pollutant reduction cross-elasticity (Els) can be used to assess the synergistic effect between the local air pollutants emission reduction and the GHG emissions [32,42]. The cross-elasticity between air pollutant and CO2 was calculated using Equation (12).
E l s C O 2 / a = i ( ( E C O 2 , a , i + E C O 2 , a , i ) / E C O 2 , t o t a l ) i R a , i / i P a , i ,
where E l s C O 2 / a denotes the cross-elasticity between CO2 and air pollutant a, subscript i denotes the departments, E C O 2 denotes the CO2 emissions related to the chemical reaction in the end-of-pipe treatment facilities (t), E C O 2 denotes the CO2 emissions related to the power consumption of the end-of-pipe treatment facilities (t), E C O 2 , t o t a l denotes the CO2 emission of the whole integrated steel plant (t), R denotes the reduction of air pollutants (t), and P denotes the production of air pollutants (t).
If E l s C / a < 0 , the measure applied has negative synergies, which means it reduces local air pollutants but discharges CO2. If E l s C / a > 0 , the measure applied has positive synergies, which means it reduces local air pollutants and CO2 simultaneously. For each of the end-of-pipe technologies applied, the absolute value of its E l s C / a is positively related to its impacts on GHG emissions.

3. Results

3.1. Overview of the Target Plant

The target integrated steel plant had a yearly steel output of 15 Mt and a yearly power consumption of approximately 10,576 GWh. The plant generated a total of 9943 GWh of power from the internal power plant, coke dry quenching (CDQ), and blast furnace top gas recovery turbine unit (TRT), purchased 1482 MWh of power from the regional power grid, and transferred 848 MWh of power outside the boundary.
The main production processes, including sintering, iron-making, steel-making, steel-rolling, and the auxiliary facilities, including the power plant, coking plant, and lime roasting plant, satisfy the majority of the power, coke, and lime demands. Other materials, such as ore, pellets, ferroalloys, and a small amount of coke, were purchased. The iron ore and other materials are sintered in the belt sintering machines, and then react with coke and flux in the blast furnaces. The molten iron together with scrap steel and ferroalloy transferred to the BOF and the EAF are refined, cast, and subsequently rolled into steel products.
In terms of the end-of-pipe technology for local air pollutants, the sintering and power plants were equipped with limestone–gypsum wet FGD, and the coke plant had its own gas refining and chemical product production equipment. The enterprise used a bag filter and electrostatic precipitator to dedust most departments, and LTDR equipment was installed to handle the primary flue gas of the BOF. Overall, the terminal treatment technologies in this integrated steel plant were advanced for China.

3.2. Production, Reduction, and Discharge of Air Pollutants

The target plant had installed various desulfurization and dedusting equipment, but little end-of-pipe technology was used to reduce the emissions of other air pollutants, so the synergies of reducing SO2 and TSP were chosen for study. The calculation results of the production, reduction, and discharge of SO2 and TSP in Scopes 1 and 2 are shown in Table 2. The sintering plant in the main production facility and the power plant in the auxiliary facility are the key departments producing and emitting SO2; their SO2 production accounts for 89.94% of the plant total. Both of them were equipped with FGD equipment with an annual desulfurization capacity of 35.92 kt, greatly reducing SO2 emissions within the plant boundary. The overall SO2 removal rate of the integrated steel plant was about 84.95%.
With the tightening of the emission standards of industrial atmospheric particles in China, most iron and steel plants have implemented strict dust removal measures to reduce organized dust from various processes. In the power plant processes, sintering, iron-making, and steel-making, the amount of TSP produced accounted for 32.90%, 25.45%, 20.59%, and 15.98% of the total TSP production in the plant, respectively. After the organized particles were collected and removed by the dedusting facilities, the overall TSP removal rate of the integrated steel plant reached 99.36%

3.3. CO2 Emissions Analysis

3.3.1. CO2 Emissions

In this study, the EF method and carbon balance method were used for carbon emission accounting. The activities included the product output and raw material consumption of each department. In the EF method, the CO2 emissions of steel-rolling and power plants were all produced by the fuel combustion process, so the calculation was based on the fuel consumption and the EFs were obtained from the energy sector of the IPCC, whereas the emissions of the other departments were calculated according to the EFs provided by the industrial processes and product use sector of the IPCC. In the carbon balance method, two types of carbon content (from the default value in the NDRC and REIA report) were used separately, and the accounting results of the three sets of parameters are shown in Table 3. The CO2 emissions calculated by the carbon balance method were divided into three parts: the carbon emissions of the process, fuel combustion, and carbon sequestration of the products and by-products.
Table 3 shows that the emissions of CO2 determined by the EF method were the highest and those by the carbon balance method with the parameters given in the NDRC were the lowest. However, for each department in the enterprise, the carbon emissions were quite different and the reasons for these differences were not the same.
The results of the EF method were much higher than those of the carbon balance method for the iron-making and steel-making departments mainly because the EFs from the IPCC are based on the assumption that all the gas produced in the blast furnace and the BOF is burned in this sector and generates CO2. However, in reality, the by-product gases produced in the integrated steel plant are often redistributed and then used comprehensively through the scheduling system [43]. The dynamic optimization approach for the comprehensive use of the gases can also improve energy efficiency and reduce CO2 emissions [44]. According to the REIA report, the BFG used in the iron-making sector accounted for only 33% of its output and BOFG was used in all other sectors, so the carbon in the gas was burned and discharged in other sectors. Therefore, the CO2 emissions of iron-making and steel-making departments calculated by IPCC Tier1 were larger, which may be higher than in reality.
The sintering and coking departments mainly use fossil fuels as raw materials, and the steel-rolling and power plant departments burn fossil fuels directly. Among the calculation results of these four departments that are closely related to energy, the calculation results of IPCC Tier1 were similar to those of the carbon balance method with the NDRC parameters. In IPCC Tier1, the CO2 EFs of the fuels are calculated according to the carbon content of the unit calorific value and the low calorific value. On this basis, the carbon balance method adopted by NDRC further considers the influence of the carbon oxidation rate. Therefore, the EFs of fuels could also be obtained by the carbon content per unit calorific value, low calorific value, and carbon oxidation rate in the NDRC method. For coal, gas, and other major fuels with large consumption rates, the CO2 EFs determined by the two methods were similar, which decreased the difference between the calculated results of the two methods in these departments.
For the lime roasting department, the calculation result of IPCC Tier1 was lower than that of the carbon balance method, and the calculation results of the carbon balance method with the two types of parameters were very similar. IPCC Tier1 is the EF method based on the output. To obtain a finer CO2 EF of lime roasting, we determined the types and carbon contents of lime products. The product consists of 85% limestone lime and 15% dolomite lime [27]. As the carbon content of dolomite lime is higher than that of limestone lime, the larger the proportion of dolomite used, the larger the EF of lime roasting. In the integrated steel enterprise studied here, the proportion of limestone in the raw materials used was relatively small and the proportion of dolomite was relatively large, so the default value of the EF of lime roasting in IPCC Tier1 would underestimate the actual carbon emissions. In the carbon balance method, the activity level used by the two sets of the parameters was the same, and the carbon content difference of the raw materials was only 0.1–0.2%. Therefore, the difference in the calculation results was small, which was mostly due to the fuel combustion emissions in the baking furnace.
In addition, we noted that for the carbon balance method, the calculation result of the carbon content in the NDRC guidelines was generally lower than that based on the REIA report, but in different sectors the size of the difference differed. To explore the reasons for this difference, we divided the carbon emission sources and analyzed the impact on the carbon emissions of each sector.

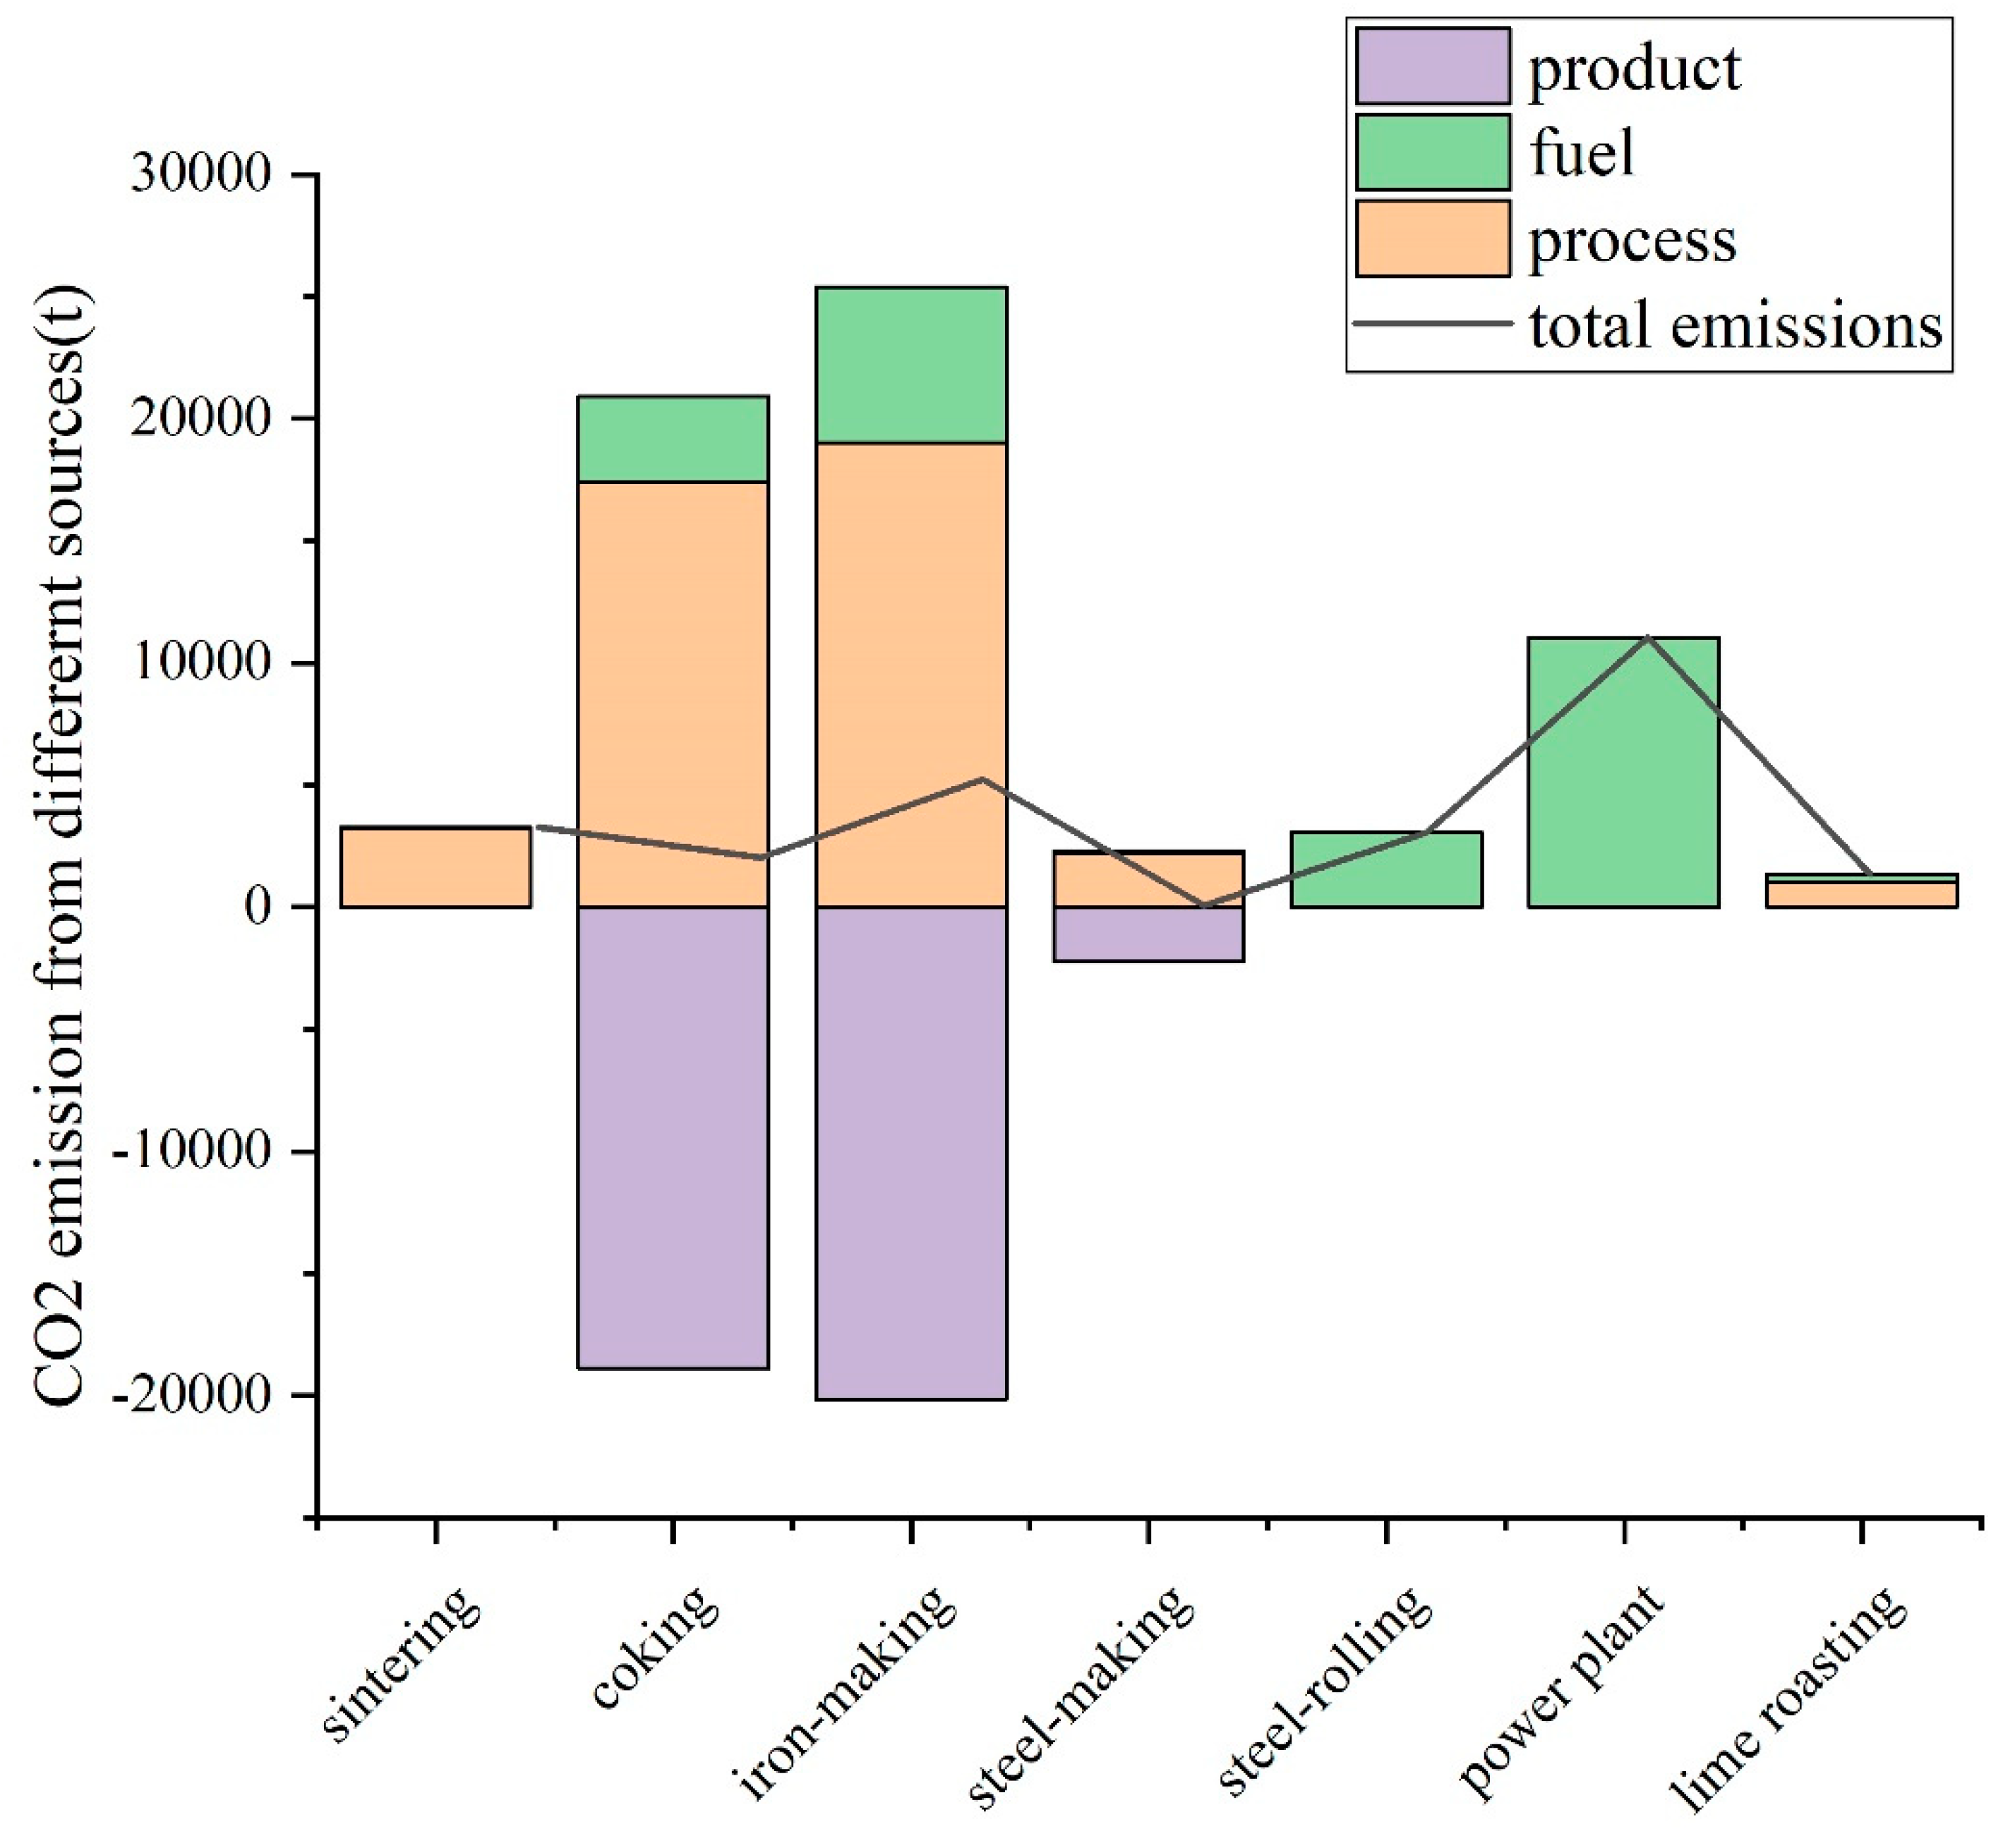
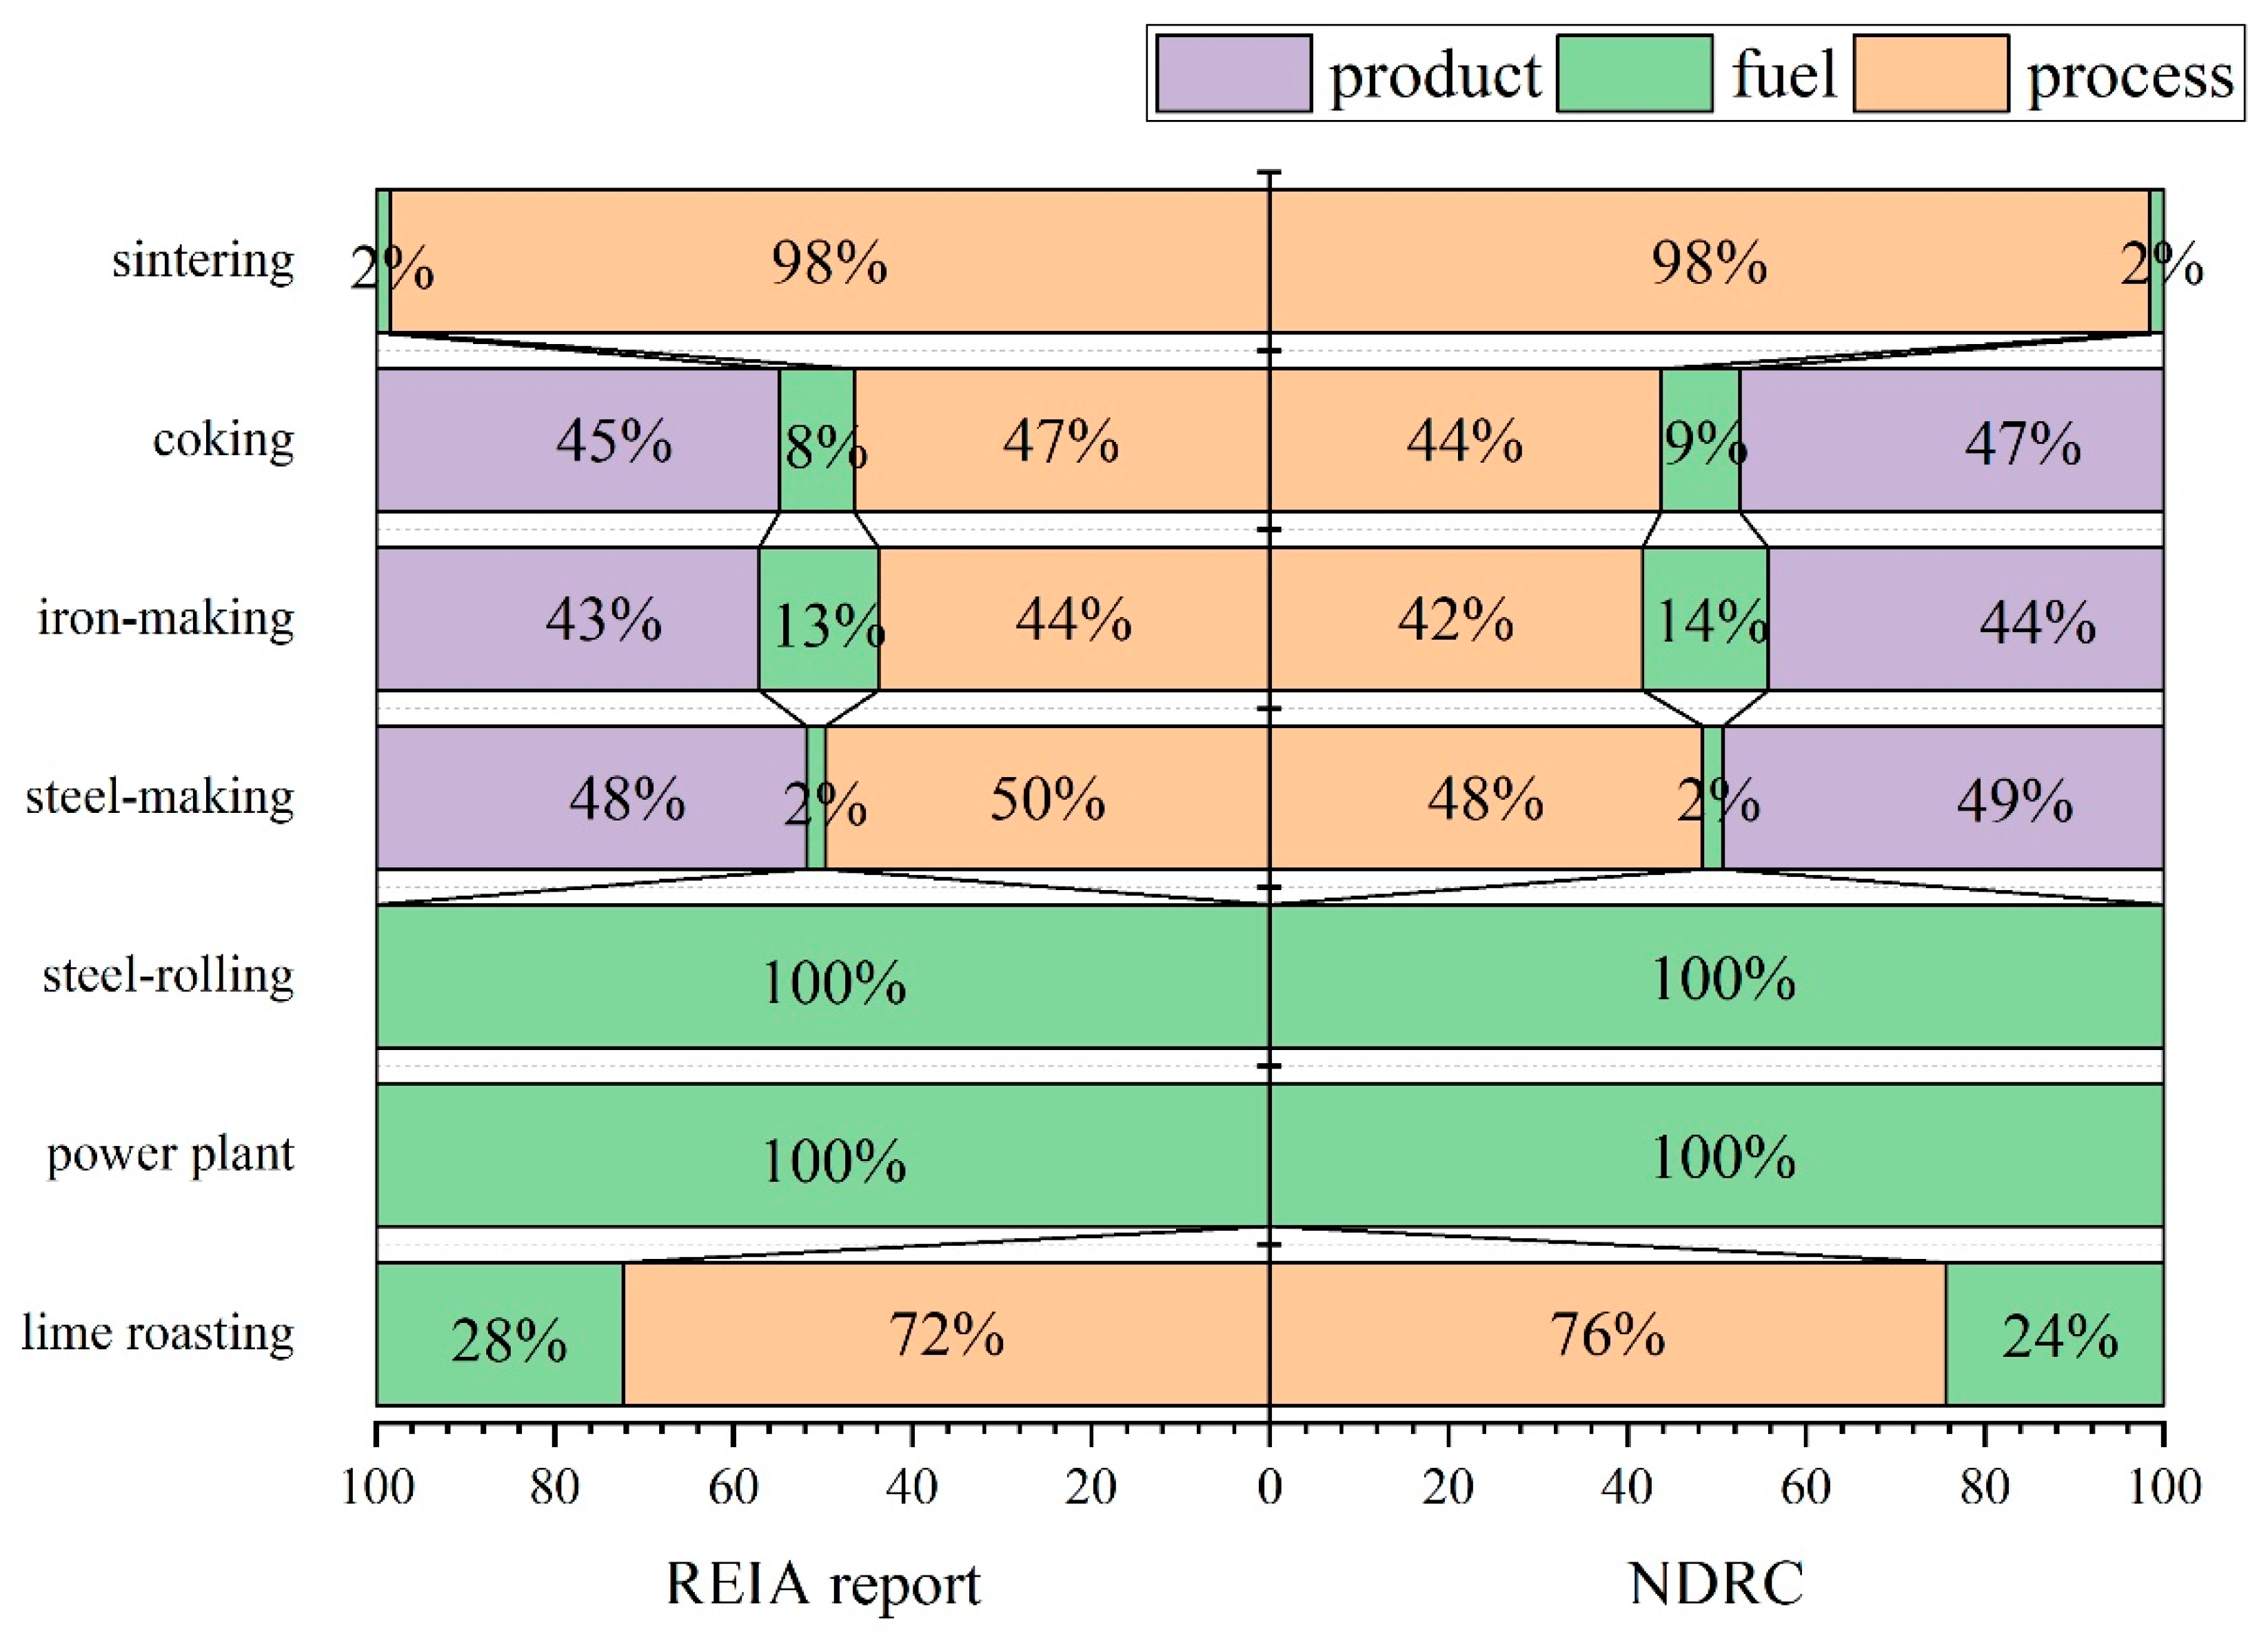
3.3.2. CO2 Emission Sources

As the NDRC method is the official guideline in China and its default values of the carbon content of raw materials, fuels, and products are more universal than those of the REIA report, we used the calculation results that apply carbon-related parameters in the NDRC to analyze the CO2 emission sources. The annual CO2 emissions of the departments in the whole plant were approximately 26.04 Mt and the purchased power indirectly emitted 1.3 Mt of CO2, with the internal power plants and iron-making accounting for 42% and 20% of the total, respectively, and the steel-making department accounting for the least, at 0.002%. The sources of CO2 emissions in the departments are shown in Figure 4. Among them, the process and fuel produced positive CO2 emissions, whereas the carbon sequestration of products and by-products had negative emissions. The CO2 emissions of the sintering and lime roasting were mainly produced from their processes. In departments including coking, iron-making, and steel-making, which used extensive carbonaceous raw materials and fuels, most of the carbon elements were transferred to the carbonaceous products and by-products, including coke, COG, BFG, and BOFG. Therefore, the carbon in these departments flowed to other departments in the plant through these intermediate by-product gases, which were further oxidized into CO2 and were emitted into the atmosphere. During steel-rolling and in the power plant, due to the consumption of a large amount of fuel (especially gas and coal), substantial energy-related CO2 emissions were produced.
CO2 emission source analysis can provide a thorough explanation of how the use of the actual carbon content and the default value will affect the calculation results of those departments. Comparing the calculation results using the actual carbon content data in the REIA report and the default value of carbon-related parameters in the NDRC guidelines, Figure 5 shows the ratio of carbon emissions from fuel combustion and the processes at the department level together with their carbon sequestration from products.
The carbon emissions from steel-rolling and the power plant were all produced from fuel combustion. A difference was found between the calculation results for these two departments (Table 3) based on the above two sets of carbon-related parameters, and the difference was more obvious for the power plant. Using the default value in NDRC may cause the calculation results of the CO2 emissions to be larger. The fuel used for steel-rolling included various types of gas, while the fuel used by the power plant was mainly coal and other solid fuels. Here, we speculate that the difference between the actual carbon content of coal and other solid fuels and the NDRC default value is greater than that of gas.
The carbon emissions of the sintering and lime roasting sectors were mainly derived from the process (Figure 5), and their carbon emissions were mainly determined by the input raw materials. In these two departments, the raw materials for sintering were mainly solvents such as lime and iron-containing raw materials, and the raw materials for lime roasting were mainly limestone and dolomite. For these raw materials, the carbon content of their components is much lower than that of fossil fuels and is relatively stable. For process sources, the CO2 emissions calculation results based on the above two sets of carbon-related parameters were not much different.
For coking, iron-making, and steel-making, the main sources of CO2 emissions were the process and product of carbon sequestration (negative carbon emissions). The gases produced by these departments carry huge amounts of carbon to other departments, which makes their actual CO2 emissions relatively low. Based on the above two sets of carbon-related parameters, the CO2 emissions from fuel combustion were relatively low, and the proportions between the various departments were similar. The difference in the CO2 emissions for the three sectors was mainly due to the process and product sources. For the target plant in this study, the default value in NDRC underestimated the actual carbon content of the raw materials and overestimated that of the products. The CO2 emissions calculated using NDRC parameters in the process source were low, whereas the carbon sequestration of the product was large, and the calculation results of the CO2 emissions based on the NDRC default value were lower than those of the actual carbon content reported by the REIA under the influence of both.

3.4. Synergies of End-of-Pipe Treatment Equipment

Masses of local air pollutants are produced during the process of production in integrated steel plants. To reduce the emission of air pollutants, various end-of-pipe treatment technologies have been widely used. Some of those technologies effectively abate local air pollutants, but the chemical reactions occurring in the end-of-pipe equipment increase CO2 emissions. Whereas the sintering and power plant departments of the integrated steel plant reduced SO2 by 15.46 kt using the limestone–gypsum wet FGD equipment, they also produced CO2 emissions of 10.63 kt during the chemical reactions, with an EF of 0.69 t·CO2/t·SO2.
According to the calculation of power consumption and the dedusting and desulfurization capacity of these facilities in the target plant, the annual power consumption of dedusting and desulfurization facilities in the seven departments accounted for 3.63% and 1.85% of the total annual power consumption of the whole plant, respectively. Table 4 shows the proportion of power consumption of this equipment in each department in the total power consumption of the plant. The COG, BFG, and BOFG produced by the coke oven, blast furnace, and converter had a high dust content and could not be directly transported to other departments as fuel, so dust removal equipment was needed. In addition, the originally produced COG contained considerable amounts of hydrogen sulfide, which were refined and converted into sulfuric acid and other by-products when removing the dust from the gas through the desulfurization and refining system in the coking plant. As an auxiliary process, it was not considered in this study. During steel-making, the flue gas from the BOF was divided into primary and secondary flue gas. The primary flue gas contained more CO, which mainly came from the reduction process of carbon in molten iron during smelting. After the LTDR process, the BOFG was purified and can be used as fuel. The secondary flue gas of the converter was created by the other production stages of steel-making. The dust in the secondary flue gas of the BOF and EAF was removed by bag filters. Compared with other departments, the dedusting process in the steel-making department was more complex. The substantial amount of dust production increased the power consumption of the dedusting facilities, accounting for approximately 1.68% of the power consumption of the whole plant.
The power plant included a set of combined cycle power plant units that used gas as fuel and three sets of coal-fired power generation units. The power consumption of desulfurization and dedusting facilities for coal-fired units accounted for 1.42% and 0.39% of the total power consumption of the whole plant, respectively.
According to the power balance table of the plant and its associated CO2 emissions (Appendix D), the annual CO2 emission in Scope 2 was 27.35 Mt, including CO2 emissions of the power generation projects in the plant and the emissions produced by the purchased power. The electric power used in the plant was obtained from the CDQ, TRT, internal power plant, and external regional power grid. Among them, CDQ and the TRT are energy-saving technologies that use the heat during the process to generate power but do not emit CO2. The CO2 emissions in Scope 1, calculated according to the carbon balance method using parameters from the NDRC guidelines together with the emissions related to the purchased power, were used to assess the synergies.
Due to data limitations, we were only able to obtain the proportion of purchased electricity at the whole enterprise level, but it was difficult to define whether the source of power consumed by the end-of-pipe treatment in the departments was the internal power plant or the external power grid. To comprehensively estimate the emissions produced by power consumption in Scope 2, we used the sum of the purchased power and self-generated power and the total related emissions to determine a characteristic EF of the plant. The specific EF of the power-related emissions was 1.08 t·CO2/MWh according to Equation (10). See Table 5 for the indirect CO2 emissions of the end-of-pipe equipment in each department.
Given the characteristics of power consumption, we were unable to determine if the source of power consumed by the end-of-pipe equipment was power purchased from the regional power grid or self-produced power from the plant. However, through a comprehensive internal carbon EF, the CO2 emission related to the power consumption of the end-of-pipe equipment was estimated, and its proportion in the total carbon emission of the whole enterprise was calculated. The results showed that 415.61 kt of CO2 was produced from the process of dedusting and 211.39 kt of CO2 from the process of desulfurization. The CO2 emissions generated in the end-of-pipe equipment and implied in their power consumption accounted for 2.29% of the total CO2 emissions of the whole plant.
Figure 6 shows the proportion of CO2 emissions (including direct and indirect emissions) of the end-of-pipe treatment equipment in each department to the total CO2 emissions of all end-of-pipe equipment in the plant. A large amount of air pollution was reduced in the internal power plants, steel-making, sintering, and iron-making, accounting for 34.56%, 25.57%, 17.20%, and 16.94% of the synergistic CO2 emissions, respectively. The end-of-pipe equipment in the lime roasting, steel-rolling and coking departments accounted for a very small proportion of synergistic CO2 emissions.
Among the various end-of-pipe equipment, direct CO2 emissions were only produced by the chemical reactions in limestone–gypsum wet FGD and their emissions were far less than the indirect CO2 emissions due to their power consumption, which only accounted for 3.79% of the synergistic CO2 emissions. Therefore, the synergies of CO2 emissions produced by using end-of-pipe treatment were mainly derived from the indirect CO2 emissions caused by the power consumption of these facilities. The end-of-pipe treatment facilities increased the CO2 emissions per ton of steel of the target plant from 1.70 to 1.74 t·CO2/t·steel.
Table 6 shows the Els of different end-of-pipe treatment technologies. Because of chemical reactions and power consumption of the end-of-pipe treatment equipment in the target plant emitting CO2 while reducing local air pollutants, all the technologies studied here had negative Els. Among the dust removal technologies, the LT process used in the converter dedusting, which is a specific technology for ISI, had the lowest Els, showing the reduction of 63,552 tons of TSP with an increase of 140,451 tons of CO2 emissions because of the electricity consumption of the LT process. As all the Els results were negative, the end-of-pipe treatment technologies causing CO2 emissions in the integrated steel plant need to be taken seriously.

4. Discussion

4.1. Applicability of CO2 Emission Calculation Methods

The carbon balance method is more appropriate for measuring CO2 emissions at the enterprise and sector levels than the EF method. The default emission factors of coking, iron-making, and steel-making in IPCC Tier1 were not enough to represent the comprehensive internal use of gas, which led to the redistribution of carbon emissions across departments. The EFs that are not localized enough also decrease the accuracy of the calculation results. For instance, the default EFs of the EAF were obtained from related studies of European steel companies that use scrap as the main raw material [27]. However, in the EAF process in China, hot iron is used as the main raw material of the EAF [23]. In this study, the EAF of the target plant used molten iron, iron alloys, and scrap to make steel. Compared with scrap, molten iron has a higher carbon content, which increases the carbon emissions of the EAF process.
When the carbon balance method is used for carbon emission accounting of the integrated steel plant, it is crucial to obtain accurate basic data of activity levels, such as the raw material input and product output. The selection of carbon-related parameters is also important. Carbon-related parameters for fuels, including the low calorific value, the carbon content per unit calorific value and the carbon oxidation rate, and the carbon content for materials and products, affect the calculation results of CO2 emissions. The CO2 emissions generated by fuel combustion are affected by the carbon oxidation rate, whereas the coal used as a reducing agent in sintering and iron-making is a kind of raw material, and its carbon oxidation rate does not need to be considered. Therefore, in the calculation process, whether the carbon oxidation rate needs to be used and how to select the carbon oxidation rate according to the use method of coal must be considered. In addition, for fuel two sources of carbon content are used in the carbon balance method. One method is adopted in the NDRC guidelines, using the default value of the carbon content per unit mass calculated using a low calorific value and the carbon content per unit calorific value; the other is adopted in the REIA report, and the carbon content is obtained by detection. In the calculation of the energy sector provided by the IPCC, the CO2 EF of fuel is also calculated using the low calorific value and the carbon content of the unit calorific value. With these methods, only the NDRC guidelines provide the defaults of the carbon oxidation rate; other methods assume that the carbon oxidation rate is 100%. Some studies reported that the energy-related carbon emissions calculated by the parameters provided by the IPCC are higher than those calculated by the localization parameters of China due to the influence of the coal quality and carbon oxidation rate during the combustion process [20,45]. Therefore, using the carbon balance method, considering and localizing all three types of carbon-related parameters can effectively improve the accuracy of CO2 emissions calculations at the enterprise and sector levels.
When the carbon balance method is used for the calculation, some materials referred to as key materials have a critical impact on the calculation result for each department, such as coke in the iron-making department and pig iron and BOFG in the steel-making department. The consumption of key materials and their carbon-related parameters significantly impact the calculation results. The carbon-related parameters may vary widely for different enterprises so that determining the key materials in each department and localizing their carbon-related parameters can considerably improve the accuracy of CO2 emission accounting.

4.2. Power Consumption Coefficient

In this study, the power consumption per unit pollutant removal was taken as the power consumption coefficient of the end-of-pipe equipment, which was used to evaluate the indirect CO2 emissions caused by their power consumption. Because of the lack of accurate measurements of the power consumption of end-of-pipe equipment, which produces indirect CO2 emissions and plays a major role in the synergies, the calculation of its power consumption mainly depended on the estimated power consumption coefficient in the current research. Therefore, determining the power consumption coefficient was essential for calculating the synergies between local air pollutant abatement and GHG emissions. However, due to the lack of research on the power consumption of the end-of-pipe equipment in the ISI, the power consumption coefficient in this study was determined using two sources: the power consumption coefficient of the power plant from relevant research and the environmental impact assessment report of the thermal power plant. The power consumption coefficients of the other departments were calculated by the parameters obtained from the relevant literature of the power consumption end-of-pipe equipment in this sector.
Using this method, the power consumption coefficient was mainly affected by the following factors: (1) Pollutant removal amount. For these facilities, the removal amount of air pollutants has a strong relationship with the department producing the pollutants, the specific process used by the departments, and the reduction rate of the pollutants. With the proposal of ultralow emission standards, the requirements for the reduction rate of air pollutants are being continuously tightened, so the reduction amount of pollutants has also markedly increased. (2) Operation power consumption of air pollutant end-of-pipe facilities. Using the same technology in different areas or using different technologies in the same area will produce differences in the actual power consumption of the end-of-pipe equipment. The chosen end-of-pipe technologies have different environmental impacts [46]. Even with the same equipment under different operation conditions, the actual power rate and power consumption continue to change. For example, in Xu et al., when the boiler load was reduced from 100% to 70%, the power of the desulfurization facility decreased by 350 kW. When the boiler load was reduced to 30%, the power was further reduced by 950 kW, and with the variety of flow gas flows, the booster fan energy consumption varied from approximately 400 to 1900 kW [47]. Therefore, determining the dynamic change in the power consumption of the end-of-pipe equipment without installing electricity meters on the specific equipment to measure its power consumption is difficult. (3) CO2 EF of the internal power plant. Most of the power consumed (86.99%) in the target plant was generated by the internal power plant, which is highly dependent on the purchased coal as fuel. According to its power generation and related CO2 emissions, the EF of the power plant was 1.11 t·CO2/MWh, which was higher than the carbon emission coefficient of the electric power supplied by coal-fired power plants in the thermal power industry to the regional power grid during the same period, resulting in the carbon EF of the electric power used in the target plant being higher than that of other enterprises using the regional power grid. Sakamoto also reported similar conclusions in the carbon emission accounting of different processes for iron and steel enterprises [48]. The establishment of a more precise measurement and monitoring system of carbon emission accounting at the enterprise level would help to accurately measure the power consumption coefficient and the dynamic change in the power consumption of the end-of-pipe technology in each department of the plant, which could increase the accuracy of the quantitative evaluation of the synergies.

4.3. Denitration Facilities

In 2012, China implemented the Emission Standard of air pollutants for sintering and pelleting of the iron and steel industry (GB28662-2012) and began to restrict the emission concentration of NOx to 50–200 mg/m3 from sintering and pelletizing processes in the ISI. With the same process on the production scale, strict discharge concentration standards require steel enterprises to improve their removal rate of air pollutants and increase the removal amount, which may further highlight the synergistic effect of the end-of-pipe technology. Some denitration technologies have been applied in the ISI, such as activated coke flow gas purification technology, which has been used in the sintering machines and coking furnaces of many enterprises [49]. Additionally, many plants have room to improve denitration. As flue gas denitrification technologies have been widely used, their synergistic effect on GHG emissions also needs to be considered. Due to the limitation of data sources, the target plant in this study was not equipped with any end-of-pipe equipment for denitration at that time, so the synergies between denitration and GHG emissions were not analyzed in this study, but could be included in future research.

5. Conclusions

Substantial amounts of local air pollutants and GHGs are produced in long process steel enterprises, and the use of end-of-pipe technology can increase GHG emissions while mitigating local air pollutants. In this study, a long process integrated steel plant was used as a case study, and the local air pollutant (SO2 and TSP) production and emission of each department were calculated according to the EF method within two scopes. The CO2 production of each department was also calculated using the EF and carbon balance methods. The CO2 emissions produced by the local air pollutant end-of-pipe equipment were calculated, which were used to analyze the synergistic effect of local air pollutant and GHG emissions reduction. The main conclusions were as follows:
By using bag filters, ESPs, and the LTDR process, 965.57 kt of TSP was effectively removed, accounting for 99.36% of the dust production. The sintering and power plant, the key departments producing SO2 emissions, are equipped with desulfurization facilities and have reduced the amount of SO2 generated within the boundary by 35.92 kt.
The carbon emissions of each department of the enterprise calculated by the EF method and carbon balance method were compared. The CO2 emitted by the enterprise calculated by the IPCC Tier1 was 45.27 Mt, and those by the carbon balance method based on the carbon content parameters of the NDRC guidelines and REIA report were 27.35 and 35.17 Mt, respectively. In addition, the indirect CO2 emissions from the purchased power were 1.31 Mt. In the carbon emission accounting of some processes in the steel industry, IPCC Tier1 is based on certain assumptions, such as the complete combustion of gases produced in the various sectors and the proportion of raw materials and products, which may produce a large deviation of the calculation results at the sector level. According to the analysis of the CO2 emission sources, in the calculation using the carbon balance method, the COG, BFG, and BOFG carrying the carbon and burned in other departments showed that departments using them were the actual emission sources.
The end-of-pipe treatment equipment applied in the target plant reduced 965.46 kt of TSP and 35.92 kt of SO2 and consumed 1.85% of the power consumption of the whole plant. Of the synergistic CO2 emissions, 627 Mt was related to their power consumption dominating the synergistic emissions, compared to 20.70 Mt of direct CO2 emissions caused by the chemical reactions. Even the total carbon emissions related to end-of-pipe equipment controlling air pollutants accounted for 2.29% of the total carbon emissions of the plant. To synergistically control local air pollutants and CO2 emissions, the negative effects of CO2 emissions produced by the end-of-pipe treatment technologies should be considered.

Author Contributions

Original draft preparation, H.T. and J.H.; writing—review and editing, P.J. and W.M. All authors have read and agreed to the published version of the manuscript.

Funding

This research was supported by the National Natural Science Foundation of China (71673051, 71774033) and Fudan Tyndall Center of Fudan University (FTC98503B09a).

Conflicts of Interest

The authors declare no conflict of interest.

Appendix A

Table A1. List of the acronyms and symbols used in the paper.
GHGgreenhouse gasCEelectric power consumption coefficient
TSPtotal suspended particulateElscross-elasticity
PMparticulate matterwhannual working hours
ISIiron and steel industryaair pollutant
FGDflue gas desulfurizationidepartment
ESPelectrostatic precipitatorjraw material type
LTDRLurgi-Thyssen dust removalkfuel type
EFemission factormmain product type
LCAlife cycle analysisnby-product type
BOFbasic oxygen furnacepgregional power grid
EAFelectric arc furnaceαcarbon content
COGcoke oven gasηremoval rate of pollutant
BFGblast furnace gasElthe electric power purchased from the power grid
BOFGbasic oxygen furnace gasFinput of fuel
PproductionMinput of raw material
EemissionMPoutput of main products
E’emission related to the power consumption of the end-of-pipe treatment facilitiesBPoutput of by-product
RreductionCCcarbon content
IPCCIntergovernmental Panel on Climate ChangeOFcarbon oxidation rate
NDRCGreenhouse Gas Emission Accounting Method and Reporting Guidelines for Chinese Iron and Steel Enterprises (on trial)LCVlow calorific value
REIA reportRetrospective Environmental Impact Assessment of the Enterprise

Appendix B

Table A2. CO2 emission factors in the iron and steel industry from the Intergovernmental Panel on Climate Change (IPCC).
DepartmentSinteringCokingIron-MakingSteel-Making (EAF)
E F i   (t·CO2/t·product)0.210.511.430.18
DepartmentSteel-Making (BOF)Steel-RollingPower PlantLime Roasting
E F i   (t·CO2/t·product)0.15**0.75
* CO2 emissions were calculated according to the fuel consumption.

Appendix C

Table A3. Carbon-related parameters used to calculate CO2 emissions during fuel combustion.
NDRCREIA Report
TypeLCV
(GJ/t or
GJ/104 Nm3)
CCCV (t·C/TJ)OF
(%)
TypeLCV
(GJ/t or
GJ/104 Nm3)
CCCV (t·C/TJ)CCM
(t·C/t)
Nongaseous fuel (t·C/t·fuel)washed coal20.30427.490.94washed coal//0.7865
lignite14.08280.96steam coal//0.6701
Fuel oil41.81621.10.98Fuel oil41.81621.1/
diesel oil42.65220.20.98diesel oil42.65220.2/
Gaseous fuel (t·C/104 Nm3)COG173.5412.10.99COG//2.277
BFG3370.80.99BFG//2.43
BOFG8449.60.99BOFG//4.118
natural gas389.3115.30.99natural gas389.3115.3/
other gas52.2712.20.99city gas167.2612.1/
producer gas167.2612.1/
Note: LCV, CCCV, OF and CCM, is low calorific value, carbon content per unit calorific value, carbon oxidation rate and carbon content per unit mass, respectively. For calculation using the parameters from the REIA report, the carbon oxidation rate was assumed to be 100% because it had not been tested. Most of the carbon content was reported in per unit calorific value from NDRC but in per unit mass in the REIA report. Due to the classification of fuels, some of the types used in the integrated plant were not mentioned in NDRC method, so the approximate options were used.
Table A4. Carbon content of materials and products used in the carbon balance method.
NDRCREIA Report
TypeCarbon Content Per Unit Mass (t·C/t)TypeCarbon Content Per Unit Mass (t·C/t)
coke0.839coke0.879
washed coal0.669washed coal0.787
other coal products0.587soft asphalt0.885
crude benzene0.949crude benzene0.922
coal tar0.736coal tar0.924
anthracite0.558injection coal0.788
BF slag/BF slag0.006
pig-iron0.041pig-iron0.047
crude steel0.00248crude steel0.007
scrap0.003
steel slag0.011
dolomite0.12dolomite0.13
limestone0.128limestone0.119
EAF carbon electrode0.999EAF carbon electrode/

Appendix D

Table A5. Electric power balance and related CO2 emissions.
ProjectPower Proportion (%)Related CO2 Emissions (×106 t)
Power plant87.0114.15
CDQ1.940.00
TRT5.070.00
Purchased from the power grid4.021.31
Transferred to the power grid8.020.00
Loss0.020.00
Total10015.46
Note: Power proportion refers to the ratio of power generation or the consumption of the projects to the annual power consumption of the integrated steel plant; 8.02% of the power in the plant was sent to the regional power grid. Since this part of the power was from the power plant inside the boundary, its relevant CO2 emissions were included in the power plant project.

References

  1. WSA. Steel Statistical Yearbook 2018; WSA: Brussels, Belgium, 2018. [Google Scholar]
  2. NBS. China Statistics Yearbook on Environment; China Statistics Press: Beijing, China, 2006. Available online: http://www.stats.gov.cn/ztjc/ztsj/hjtjzl/2006/ (accessed on 21 June 2020).
  3. MEE. China’s 2018 Annual Report on Policies and Actions to Address Climate Change; MEE: Beijing, China, 2018. [Google Scholar]
  4. Zeng, S.; Lan, Y.; Huang, J. Mitigation paths for Chinese iron and steel industry to tackle global climate change. Int. J. Greenh. Gas. Control 2009, 3, 675–682. [Google Scholar] [CrossRef]
  5. Liu, Z.; Mao, X.; Jiang, H. Key Directions and Contents of Ecological Environment Protection During the 14th Five-Year Plan Period. Chin. J. Environ. Manag. 2019, 3, 40–45. [Google Scholar]
  6. Gao, C.; Gao, W.; Song, K.; Na, H.; Tian, F.; Zhang, S. Spatial and temporal dynamics of air-pollutant emission inventory of steel industry in China: A bottom-up approach. Resour. Conserv. Recycl. 2019, 143, 184–200. [Google Scholar] [CrossRef]
  7. Zhao, C.L.; Wu, T.; Bo, X.; Su, Y. The status quo of sintering flue gas desulfurization of iron & steel industry and pollutants co-treatment suggestion. Environ. Eng. 2014, 10, 76–78. [Google Scholar]
  8. Wang, A.; Cai, J.-J.; Li, X.-P.; Wang, D.; Zhou, Q.-A. Affecting Factors and Improving Measures for Converter Gas Recovery. J. Iron Steel Res. Int. 2007, 14, 22–26. [Google Scholar] [CrossRef]
  9. IPCC. Climate Change 2014: Mitigation of Climate Change; IPCC: Geneva, Switzerland, 2014. [Google Scholar]
  10. Kuramochi, T. Assessment of midterm CO2 emissions reduction potential in the iron and steel industry: A case of Japan. J. Clean. Prod. 2016, 132, 81–97. [Google Scholar] [CrossRef]
  11. Xuan, Y.; Yue, Q. Scenario analysis on resource and environmental benefits of imported steel scrap for China’s steel industry. Resour. Conserv. Recycl. 2017, 120, 186–198. [Google Scholar] [CrossRef]
  12. Griffin, P.W.; Hammond, G.P. Industrial energy use and carbon emissions reduction in the iron and steel sector: A UK perspective. Appl. Energy 2019, 249, 109–125. [Google Scholar] [CrossRef]
  13. Wu, X.; Zhao, L.; Zhang, Y.; Zhao, L.; Zheng, C.; Gao, X.; Cen, K. Cost and potential of energy conservation and collaborative pollutant reduction in the iron and steel industry in China. Appl. Energy 2016, 184, 171–183. [Google Scholar] [CrossRef]
  14. Mao, X.; Zeng, A.; Hu, T.; Zhou, J.; Xing, Y.; Liu, S. Co-control of Local Air Pollutants and CO2 in the Chinese Iron and Steel Industry. Environ. Sci. Technol. 2013, 47, 12002–12010. [Google Scholar] [CrossRef]
  15. Gu, A.; Teng, F.; Feng, X. Effects of pollution control measures on carbon emission reduction in China: Evidence from the 11th and 12th Five-Year Plans. Clim. Policy 2016, 18, 198–209. [Google Scholar] [CrossRef]
  16. Zhang, S.; Worrell, E.; Crijns-Graus, W.; Wagner, F.; Cofala, J. Co-benefits of energy efficiency improvement and air pollution abatement in the Chinese iron and steel industry. Energy 2014, 78, 333–345. [Google Scholar] [CrossRef]
  17. Zhang, Q.; Wang, Y.; Zhang, W.; Xu, J. Energy and resource conservation and air pollution abatement in China’s iron and steel industry. Resour. Conserv. Recycl. 2019, 147, 67–84. [Google Scholar] [CrossRef]
  18. Li, H.; Tan, X.; Guo, J.; Zhu, K.; Huang, C. Study on an Implementation Scheme of Synergistic Emission Reduction of CO2 and Air Pollutants in China’s Steel Industry. Sustainabilty 2019, 11, 352. [Google Scholar] [CrossRef] [Green Version]
  19. Zhang, F.; Xing, J.; Zhou, Y.; Wang, S.; Zhao, B.; Zheng, H.; Zhao, X.; Chang, H.; Jang, C.; Zhu, Y.; et al. Estimation of abatement potentials and costs of air pollution emissions in China. J. Environ. Manag. 2020, 260, 110069. [Google Scholar] [CrossRef]
  20. Liu, Z.; Guan, D.; Wei, W.; Davis, S.J.; Ciais, P.; Li, X.; Peng, S.; Zhang, Q.; Hubacek, K.; Marland, G.; et al. Reduced carbon emission estimates from fossil fuel combustion and cement production in China. Nature 2015, 524, 335–338. [Google Scholar] [CrossRef] [Green Version]
  21. Shan, Y.; Liu, J.; Liu, Z.; Xu, X.; Shao, S.; Wang, P.; Guan, D. New provincial CO2 emission inventories in China based on apparent energy consumption data and updated emission factors. Appl. Energy 2016, 184, 742–750. [Google Scholar] [CrossRef] [Green Version]
  22. Xu, W.; Wan, B.; Zhu, T.; Shao, M. CO2 emissions from China’s iron and steel industry. J. Clean. Prod. 2016, 139, 1504–1511. [Google Scholar] [CrossRef]
  23. Na, H.-M.; Gao, C.-K.; Tian, M.-Y.; Qi, Z.-Q.; Ye, Z. MFA-based analysis of CO2 emissions from typical industry in urban—As a case of steel industry. Ecol. Model. 2017, 365, 45–54. [Google Scholar] [CrossRef]
  24. Jing, R.; Cheng, J.C.; Gan, V.J.; Woon, K.S.; Lo, I.M. Comparison of greenhouse gas emission accounting methods for steel production in China. J. Clean. Prod. 2014, 83, 165–172. [Google Scholar] [CrossRef]
  25. Li, L.; Lei, Y.; Pan, D. Study of CO2 emissions in China’s iron and steel industry based on economic input–output life cycle assessment. Nat. Hazards 2015, 81, 957–970. [Google Scholar] [CrossRef] [Green Version]
  26. NBS. China Statistical Yearbook on Environment; China Statistics Press: Beijing, China, 2010. Available online: http://www.stats.gov.cn/ztjc/ztsj/hjtjzl/2010/ (accessed on 21 June 2020).
  27. IPCC. 2006 IPCC Guidelines for National Greenhouse Gas Inventories; IGES: Hayama, Japan, 2006; Available online: https://www.ipcc-nggip.iges.or.jp/public/2006gl/index.html (accessed on 21 June 2020).
  28. Gitarskiy, M.; Yu, A.; Izrael Institute of Global Climate and Ecology IPCC. 2019 Refinement to the 2006 IPCC Guidelines for National Greenhouse Gas Inventories. Fundam. Available online: https://www.ipcc.ch/report/2019-refinement-to-the-2006-ipcc-guidelines-for-national-greenhouse-gas-inventories/ (accessed on 20 June 2020).
  29. NDRC. Greenhouse Gas Emission Accounting Method and Reporting Guidelines for Chinese Iron and Steel Enterprises (on Trial); NDRC: Beijing, China, 2013. Available online: http://www.gov.cn/zwgk/2013-11/04/content_2520743.htm (accessed on 21 June 2020).
  30. Bin, J.; Xiong, X. Discussion on Recovery Process and Implementation of Iron, Carbon and Zinc Resources in Blast Furnace Gas and Gas Ash. Iron Steel Scrap China 2006, 5, 30–32. [Google Scholar]
  31. MEE. The Production and Emission Accounting Coefficient Manual for the Second National Pollution Source Census (Trial Version); MEE: Beijing, China, 2019. [Google Scholar]
  32. Zhao, H.; Ma, W.; Dong, H.; Jiang, P. Analysis of Co-Effects on Air Pollutants and CO2 Emissions Generated by End-of-Pipe Measures of Pollution Control in China’s Coal-Fired Power Plants. Sustainability 2017, 9, 499. [Google Scholar] [CrossRef] [Green Version]
  33. Hou, Q. Study on Reforming of Dust Removal in High Ore Bunker in Lian Yuan Steel Sintering Plant. Master’s Thesis, Wuhan University of Technology, Wuhan, China, April 2006. [Google Scholar]
  34. Liu, W.; Zhang, R.; Guo, Y.; Hu, X.; Hou, F. Tianjin Steel Sintering Flue Gas Desulfurization Treatment Project Practice. J. EMCC 2014, 24, 3. [Google Scholar]
  35. Wu, Z. The Improvement and Application of Coking Production Systemin Chongqing Steel Group. Master’s Thesis, Chongqing University, Chongqing, China, November 2007. [Google Scholar]
  36. Gui, X. Design and Realization of Blast furnace Casthouse Bag Dust Removal Control System. Master’s Thesis, Northeastern University, Liaoning, China, June 2013. [Google Scholar]
  37. Gong, W. Analysis on the selection of new OG method and LT method for converter primary flue gas removal. Iron Steel Technol. 2009, 46–50. [Google Scholar]
  38. Liu, C. Power saving technology for dust removal system of converter steelmaking plant. World Metal Guide 2017, 5, B13. [Google Scholar]
  39. Wei, H. Research and Modification of Dust Removal Technology for 80 Tons Electric Furnace in Hangzhou Iron and Steel Co. Master’s Thesis, Jiangxi University of Science and Technology, Ganzhou, China, June 2011. [Google Scholar]
  40. Feng, Z. Upgrade Transform of Baosteel 2050 Hot Rolling Plant Dedust Automation System. Metall. Equip. 2016, 1, 52–56. [Google Scholar]
  41. Cheng, C. Practice of dust removal technology in lime production in Jiugang Sintering Plant. Gansu Metall 2004, 26, 68–70; discussion 73. [Google Scholar]
  42. Jia, X.; Xin, G.; Qian, Y.; Qian, Y. Sectoral co-control of air pollutants: Case of a chlor-alkali/polyvinyl chloride sector in China. J. Clean. Prod. 2016, 112, 1667–1675. [Google Scholar] [CrossRef]
  43. Zhao, X.; Bai, H.; Hao, J. A review on the optimal scheduling of byproduct gases in steel making industry. Energy Procedia 2017, 142, 2852–2857. [Google Scholar] [CrossRef]
  44. Maddaloni, A.; Porzio, G.F.; Nastasi, G.; Colla, V.; Branca, T.A. Multi-objective optimization applied to retrofit analysis: A case study for the iron and steel industry. Appl. Therm. Eng. 2015, 91, 638–646. [Google Scholar] [CrossRef]
  45. Li, X.; Xie, H.; Kou, W.; Wang, W.; Zhang, N. Discussion and case study on the CO2 emission calculation methods in iron and steel industry. J. Saf. Environ. 2016, 16, 320–324. [Google Scholar]
  46. Feng, C.; Gao, X.; Tang, Y.; Zhang, Y. Comparative life cycle environmental assessment of flue gas desulphurization technologies in China. J. Clean. Prod. 2014, 68, 81–92. [Google Scholar] [CrossRef]
  47. Xu, G.; Yang, Y.; Wang, N.; Yuan, X.; Li, J.; Song, X. Analysis on Energy Consumption and Optimal Operation of FGD System in Power Plant. In Proceedings of the 2010 Asia-Pacific Power and Energy Engineering Conference, Chengdu, China, 28–31 March 2010. [Google Scholar]
  48. Sakamoto, Y.; Tonooka, Y. Estimation of CO2 emission for each process in the Japanese steel industry: A process analysis. Int. J. Energy Res. 2000, 24, 625–632. [Google Scholar] [CrossRef]
  49. Zhao, X.; Cheng, X.; Hou, J. Development Report on Desulfurization and Denitration Industry Technology. China Environ. Prot. Ind. 2018, 9, 14–22. [Google Scholar]
Figure 1. Crude steel production in the world and China [1].
Sustainability 12 05157 g001
Figure 2. The emissions of SO2 and total suspended particulate (TSP) in the iron and steel industry [2].
Sustainability 12 05157 g002
Figure 3. Typical steel production flow chart in China. BOF: basic oxygen furnace; EAF: electric arc furnace; BFG: blast furnace gas; BOFG: basic oxygen furnace gas; COG: coke oven gas.
Sustainability 12 05157 g003
Figure 4. CO2 emission sources in the different departments.
Sustainability 12 05157 g004
Figure 5. Distribution of the CO2 emission sources under two carbon-related parameters.
Sustainability 12 05157 g005
Figure 6. The contribution to total CO2 emission by the end-of pipe treatment equipment.
Sustainability 12 05157 g006
Table 1. Power consumption coefficient of departments in the integrated steel plants.
DepartmentSectionTSPSO2
End-of-Pipe Treatment FacilitiesPower Consumption Coefficient (kWh/t)End-of-Pipe Treatment FacilitiesPower Consumption Coefficient (kWh/t)
SinteringSintering machine headelectrostatic precipitator(ESP)185.00
[33]
Limestone–gypsum wet Flue gas desulfurization (FGD)4795.20
[34]
Sintering machine tail and othersbag filter229.81
[33]
Cokingbag filter237.11
[35]
Iron-makingbag filter510.74
[36]
Steel-makingPrimary flue Gas in BOFLurgi–Thyssen dust removal (LTDR)2042.46 [37]
Ordinary flue gas in BOFbag filter273.41
[38]
EAFbag filter1973.27 [39]
Steel-rollingbag filter17.43
[40]
Lime roastingbag filter146.16 [41]
Table 2. The production, reduction, and discharge of air pollutants in different departments.
ScopeDepartmentSO2TSP
Production (t)Reduction (t)Discharge (t)Production (t)Reduction (t)Discharge(t)
1sintering10,732.769659.481073.28247,334.85246,827.89506.97
coking1161.550.001161.5543,325.6542,808.58517.07
iron-making1017.160.001017.16200,075.66199,743.24332.42
steel-making92.680.0092.68155,244.15152,038.003206.15
steel-rolling1875.390.001875.394723.244250.12473.12
power plant27,300.0526,262.521037.52319,682.40318,552.771129.63
lime roasting106.780.00106.781363.141349.5113.63
subtotal42,286.3735,922.006364.36971,749.09965,570.116178.99
2purchased power4.640.004.641.110.001.11
total42,291.0135,922.006369.00971,750.20965,570.116180.10
Table 3. CO2 emissions calculated by different methods in two scopes (×103 t).
ScopeDepartmentEF MethodCarbon Balance Method
IPCCNDRCREIA Report
Scope 1sintering3700.513273.993463.07
coking2664.712021.564305.37
iron-making20,779.165222.377125.31
steel-making2385.0564.65195.09
steel-rolling3053.713061.023226.65
power plant10,432.0111,055.1014,146.39
lime roasting943.241342.351399.49
subtotal43,958.3826,041.0433,861.38
Scope 2purchased power1308.521308.521308.52
Total45,266.9027,349.5635,169.90
Table 4. The proportion of electric power consumption of end-of-pipe treatment equipment.
DepartmentDust RemovalDesulfurization
Power Consumption (MWh)Proportion of Power Consumption (%)Power Consumption (MWh)Proportion of Power Consumption (%)
Sintering52,183.33 0.49 45,301.89 0.43
Coking10,150.47 0.10 //
Iron-making102,016.90 0.96 //
Steel-making178,076.80 1.68 //
Steel-rolling74.08 0.00 //
Power plant41,400.00 0.39 150,058.25 1.42
Lime roasting197.24 0.00 //
Total384,098.82 3.63 195,360.14 1.85
Table 5. Indirect emissions of end-of-pipe treatment equipment in the integrated steel plant.
Local Air PollutantsDepartmentEnd-of-Pipe Treatment EquipmentReduction (kt/a)Related Indirect CO2 Emission (kt/a)Proportion of Related CO2 Emission (%)
TSPSinteringESP + bag filter246.83 56.46 0.21
Cokingbag filter42.81 10.98 0.04
Iron-makingbag filter199.74 110.39 0.40
Steel-makingLT process + bag filter152.04 192.69 0.70
Steel-rollingbag filter4.25 0.08 0.00
Power plantESP318.45 44.80 0.16
Lime roastingbag filter1.35 0.21 0.001
Subtotal/965.46 415.61 1.52
SO2Sinteringlimestone–gypsum wet FGD9.66 49.02 0.18
Power plantlimestone–gypsum wet FGD26.26 162.37 0.59
Subtotal/35.92 211.39 0.77
Total///627.00 2.29
Table 6. Pollutant reduction cross-elasticity (Els) of end-of-pipe treatment technologies applied in the target plant.
Target Air PollutantMeasurePollutant Reduction (t)Related CO2 Emissions (t)Els
TSPESP419,900.1465,083.81−5.51
Bag filter482,118.35210,075.18−15.48
LTDR63,551.60140,450.63−78.52
SO2Limestone–gypsum wet FGD35,922.00237,188.83−10.21

