Article

Calculation of Potential Radiation Doses Associated with Predisposal Management of Dismantled Steam Generators from Nuclear Power Plants

Department of Nuclear Engineering, Kyung Hee University, 1732 Deokyoung-daero, Giheung-gu, Yongin-si, Gyeonggi-do 17104, Korea
*
Author to whom correspondence should be addressed.
Sustainability 2020, 12(12), 5149; https://doi.org/10.3390/su12125149
Submission received: 14 May 2020 / Revised: 16 June 2020 / Accepted: 22 June 2020 / Published: 24 June 2020
(This article belongs to the Special Issue Nuclear Waste Management and Sustainability)

Abstract

:
Although the generation of large components from nuclear power plants is expected to gradually increase in the future, comprehensive studies on the radiological risks of the predisposal management of large components have been rarely reported in open literature. With a view to generalizing the assessment framework for the radiological risks of the processing and transport of a representative large component—a steam generator—12 scenarios were modeled in this study based on past experiences and practices. In addition, the general pathway dose factors normalized to the unit activity concentration of radionuclides for processing and transportation were derived. Using the general pathway dose factors, as derived using the approach established in this study, a specific assessment was conducted for steam generators from a pressurized water reactor (PWR) or a pressurized heavy water reactor (PHWR) in Korea. In order to demonstrate the applicability of the developed approach, radiation doses reported from actual experiences and studies are compared to the calculated values in this study. The applicability of special arrangement transportation of steam generators assumed in this study is evaluated in accordance with international guidance. The generalized approach to assessing the radiation doses can be used to support optimizing the predisposal management of large components in terms of radiological risk.

1. Introduction

Various types of large components which are mainly made of metal, including reactor pressure vessels (RPVs), pressurizers (PZRs), and steam generators (SGs), are generated from the decommissioning of nuclear power plants (NPPs); these can even be produced during the operation period of pressurized water reactors (PWRs) and pressurized heavy water reactors (PHWRs), as well from replacement projects of degraded large metal components such as SGs and others [1]. In 2009, the International Atomic Energy Agency (IAEA) reported that SGs in 175 units of NPPs have been replaced in total worldwide [2]. Furthermore, the numbers of NPPs approaching their designed lifetimes or which have permanently ceased operation have increased continually, which supports the forecasting of a future gradual increase in replaced and/or dismantled large components [3].
Special considerations are needed when managing large components from NPPs because of their bulky size, heavy weight, and high cost of handling, in addition to other factors. In this respect, the Nuclear Energy Agency (NEA) under the Organization for Economic Co-operation and Development (OECD) published a specific issue report on the management of large components to be generated from the decommissioning of NPPs in 2012 [4]. In the issue report, the OECD/NEA suggests that multiple considerations of technical, regulatory, and economic aspects should be taken at “all stages” including the predisposal management (i.e., transport, treatment, and storage) of dismantled large components onsite or offsite of NPPs, and further pointed out the significance of radiological assessment in deciding the management options of large components. In addition, the IAEA stated that the hazards induced by the cutting and handling of large components should be assessed and managed so that the potential consequences of such hazards can be prevented or mitigated [5]. Furthermore, the IAEA’s requirements of interdependences among all steps in the predisposal management of radioactive waste are also applicable to the management of radioactive large components from NPPs [6].
In practice, replaced or dismantled large components have been managed in various ways according to the relevant country or site. In many cases, replaced large components such as SGs and reactor heads have been temporarily stored onsite without segmentation [7,8]. Dismantled RPVs and SGs have been transported in one piece without segmentation from NPPs to the low-level radioactive waste repository, by barge, through an inland waterway in the United States [9,10]. Segmentation operations of the head, pressure vessel, and internal parts of the reactor have been reported [11]. It has also been reported that replaced large components have been transported to a domestic storage facility via road and inland waterways and to a smelter in Sweden through the overseas waterway [12,13].
However, no comprehensive studies have been reported on the radiological risk assessments for all possible predisposal management options of large components in an integrated manner. For instance, a preliminary study has estimated the radiation doses for the decommissioning workers involved in the cutting and smelting of an SG, with neither assessment of the handling of the SG in one piece nor its transportation to offsite [14]. Other studies on radiological risk assessment for the transportation—but not the processing—of two actual SGs from German NPPs to offsite facilities have been conducted, such as (a) the overseas transport of four SGs from Stade NPP to Studsvik processing plant in Sweden and (b) the transport of SGs in one piece from Obrigheim NPP to the Lubmin offsite interim storage facility through road and inland waterways [13]. In addition, one study taking a wider scope has reported on the expected direct exposure from the in situ cutting and handling of an SG at Bohunice NPP Unit 1 and the offsite transportation of segmented and conditioned waste packages to Mochovce waste repository in Slovakia [15]. Although this study is more comprehensive than previous works, the following aspects can be noted as limitations: (a) the handling of the SG in one piece was not considered, (b) there was a simple assumption of the unit activity (1 Bq) of 60Co only as a radioactive source term, (c) inhalation and ingestion pathways were not considered, and (d) alternative waterway transportation was not assessed.
Accordingly, this study proposes an integrated radiation dose calculation framework for various predisposal management scenarios of SGs to support the decision making of the effective management of large components. In order to attain this goal, radiological dose calculation models have been structured, and their applicability has been demonstrated through case studies.

2. Methodology

2.1. Target Large Component and Its Characteristics

Among the various large and heavy components installed at NPPs, SGs are known to be larger and heavier than other components. Hundreds of experiences of replacement and dismantling of SGs and their subsequent processing, storage, and disposal at operating or decommissioned NPPs have been reported [2]. Accordingly, for this study, the SG was chosen as a target large component for modeling the management options and evaluate the radiological impacts. Although the weights and dimensions of SGs vary widely depending on the capacities of nuclear reactors and the specific design of the SGs, SGs are typically cylindrical metal objects weighing hundreds of tons that are a few meters in diameter and over 10 m in height [16].
A representative U-tube SG consists of an external shell (or body) that is usually made of a metal alloy, a bottom side chamber, and a tube bundle through which primary coolant passes. Therefore, the shell side of an SG is usually not significantly radioactive under normal operation conditions because it does not contact the radioactive primary coolant, whereas the water chamber is slightly contaminated and the inner surface of the tube bundles is contaminated with radionuclides present in the primary coolant. In this study, the SG is assumed to be a cylindrical metal solid having the same mass as the SG for the simplification and generalization of the problem. In addition, publicly reported actual radioactive source terms for SGs including activated corrosion products such as 60Co, fission products such as 137Cs and 90Sr, actinides such as 244Cm, tritium (3H), or radiocarbon (14C) characterized through radiological surveys and measurements have been assumed and used in this study (see Section 3.1).

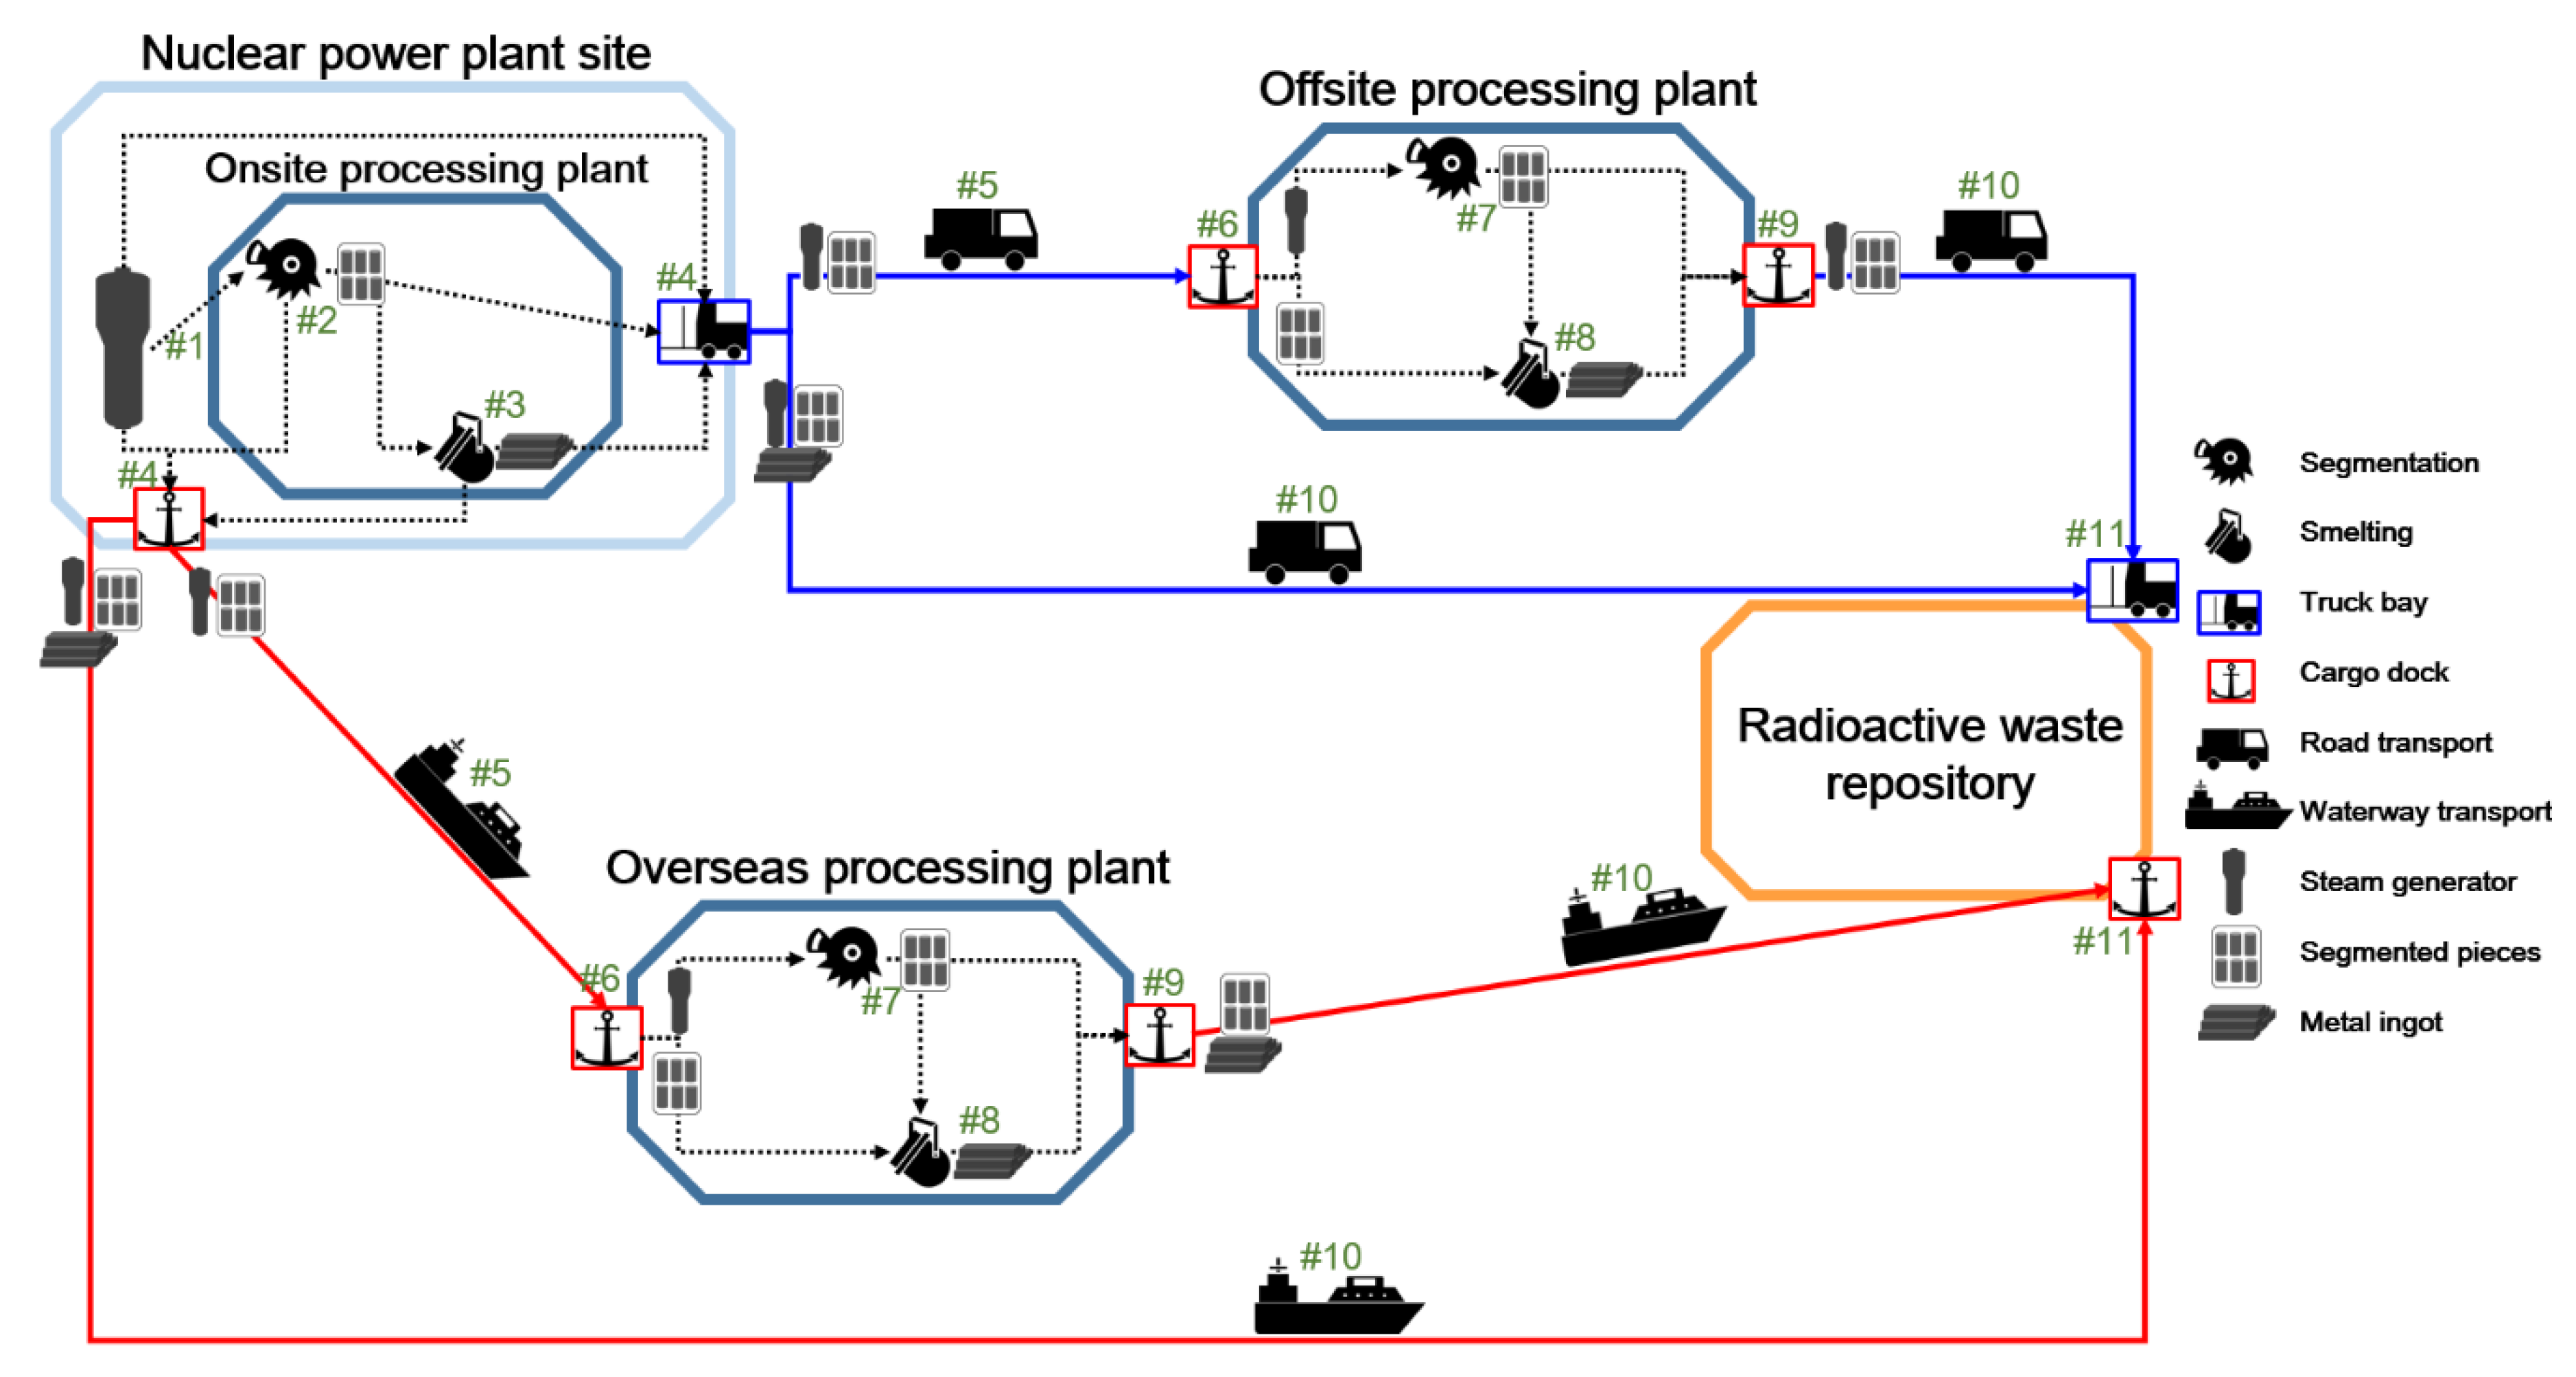
2.2. Scenarios for Predisposal Management of Dismantled Steam Generators

Large metal components such as SGs dismantled from NPPs have been managed in various ways. Based on a literature review of past experiences, 12 generalized potential management scenarios of SGs have been derived according to the various processing methods (i.e., segmentation, smelting, or handling in one piece without processing), places of processing (i.e., onsite, offsite, or overseas), and transportation means (i.e., road, inland, or overseas waterway) as depicted in Figure 1 and Table 1 [7,8,9,10,11,12,13,17].
The detailed description of the symbol in Table 1 is as follow; Sj (j = 1 to 4) represents the different segmentation workers; scrap cutter, scrap loader, scrap transfer worker, and scrap processor, respectively. Mk (k = 1 to 7) represents the different smelting workers; smelter loader, furnace operator, baghouse processor, slag worker, ingot caster, ingot loader, and ingot transfer worker, respectively. T1 indicates a trailer driver who transports a steam generator in one piece. T2 indicates a truck driver who transports the processed objects of a steam generator. T3 indicates a ship crew who transports objects by waterway. The receptor H represents the package handler who loads or unloads a package (both the one-piece steam generator and the processed objects). Furthermore, the subscript after H and T means the location number in Figure 1.
As summarized in Table 1, Scenarios 1 to 6 refer to the road transportation and Scenarios 7 to 12 refer to waterway transportation. Scenarios 1 and 7 refer to the handling of the SG in one piece without processing, whereas the others consider processing such as segmentation only or smelting after segmentation. Scenarios 2, 3, 8, and 9 represent processing at the NPP site and transportation to the repository, but Scenarios 5, 6, 11, and 12 assume offsite (domestic or overseas) processing and transportation to the repository. It is worth noting that a possible option for onsite segmentation at an NPP and subsequent offsite smelting is reflected in Scenarios 4 and 10. Taking into consideration the Korean situation in which all NPPs and radioactive waste repositories are located at coastal regions, it is assumed that offsite transportation to a domestic processing plant is conducted using public roads or through overseas waterways in the case of an overseas processing plant.

2.3. Basic Equations to Calculate Radiation Dose

In order to estimate the radiation dose to each receptor (see Table 1) exposed to radiation for each stage of the predisposal management of SGs, a set of potential exposure pathways are assumed, and the appropriate dose calculation models applied. In the segmentation and smelting processes, direct exposure from radioactive metal is expected, and the inhalation of radioactive materials suspended in the air of the workplace and inadvertent secondary ingestion of radioactive materials can be assumed as potential exposure pathways inducing the radiation exposure to the receptors [18]. The total radiation dose ( D t o t in mSv/year) to the receptors participating in the processing of SGs can be calculated by summing the estimated radiation doses from all the possible pathways, which are generally categorized into direct radiation and internal exposure due to the inhalation or ingestion of radionuclides as follows:
D t o t = D e x t + D i n h + D i n g
where D e x t is the annual external dose to receptors from direct radiation (mSv/y), and D i n h and D i n g are the annual internal doses from the inhalation and ingestion pathways, respectively (mSv/y).
The annual effective dose to the receptors involved in segmentation and smelting (i.e., S1 to S4, and M1 to M7) from direct radiation D e x t can be calculated by
D e x t = i N D e x t , i = i N C S , i · D C F e x t , i · t = i N C S , i · D C F e x t , i · ( W T P )
where C S , i is the activity concentration of radionuclide i in metal scrap (Bq/g), D C F e x t , i is the external dose conversion factor of radionuclide i (mSv/h per Bq/g) which is determined by the source geometry, dimension, and distance between the source and the receptor, t is the annual exposure time (h/y),   W is the weight of SG annually processed (ton/y), T P is the throughput of processing (ton/h), and N is the number of radionuclides.
The annual effective dose to the receptors (i.e., S1 to S4, and M1 to M7) from the inhalation of radioactive materials in the air D i n h can be calculated by [19]
D i n h = i N D i n h , i = C D · ε · B R · f R · ( W T P ) · i N C S , i · D C F i n h , i
where C D is the concentration of respirable dust in the air (g/m3), D C F i n h , i is the inhalation dose conversion factor of radionuclide i (mSv/Bq), ε is the efficiency of the respiratory protection equipment, B R is the breathing rate of the receptor (m3/h), and f R is the respirable fraction of airborne dust.
In addition, the annual radiation dose to the receptors (i.e., S1 to S4, and M1 to M7) from the ingestion of radioactive materials D i n g can be estimated as [19]
D i n g = i N D i n g , i = ( C D · B R · ( 1 f R ) + I R ) · ( W T P ) · i N C S , i · D C F i n g , i
where D C F i n g , i is the ingestion dose conversion factor of radionuclide i (mSv/Bq) and I R is the inadvertent ingestion rate (g/h).
It is noted that the radionuclides present in metal scrap are redistributed into resulting matrices such as ingot, slag, and dust if the metal scrap is melted in a smelter such as an electric arc furnace [18]. Accordingly, C S , i in Equations (1) to (3) should be replaced with an adjusted activity concentration of radionuclide i in each matrix (i.e., ingot, slag, or dust) taking into consideration the respective matrix involved in a specific scenario using Equation (5):
C P , i = C S , i · f E , P , i f M , P     ,
where C P , i is the adjusted activity concentration of radionuclide i in a resulting matrix P (i.e., ingot, slag, or dust) in Bq/g, f E , P , i is the element partitioning factor of radionuclide i in matrix P, and f M , P is the mass partitioning factor of metal scrap into matrix P.
On the other hand, receptors involved in transport operations (i.e., T1 to T3 and H) are also exposed mainly due to the direct radiation from the radionuclides present in SGs or transport packaging containing processed objects under normal transport conditions. During normal transport operation, the radionuclides are assumed to be contained in the package, and the inhalation and ingestion pathways can be ignored. The annual radiation dose for receptors T1 to T3 caused by direct radiation from transport packaging D T r a n s (in mSv/y) can be calculated by
D T r a n s = i N D T r a n s , i = i N C S , i · N t r a n s · D R i · L v
where D R i is the normalized dose rate at the receptor’s location per unit activity concentration of radionuclide i (mSv/h per Bq/g), N T r a n s is the number of transport operations per year ( y 1 ), L is the distance between the origin and the destination of the packaging to be transported (km), and v is the average speed of the transport carrier (i.e., vehicle for road transport and vessel for waterway transport) in km/h. After the smelting process, the dose to receptor T1 to T3 can be calculated by the following equation:
D T r a n s = i N D T r a n s , i = i N C P , i · N T r a n s · D R i · L v
For receptor H, the annual radiation dose caused by direct radiation from the transport packaging during the handling operation D h a n d l e , i (in mSv/y) can be calculated by replacing D C F e x t , i with D R i in Equation (2).
It is noted that only the potential radiological impact from scenarios representing normal conditions in the processing and transportation of SGs have been considered in this comparative study, whereas off-normal or accidental scenarios with low probabilities are subject to preparedness and responses to emergencies [13,14].

2.4. Calculation Tools

Here, we report a few models which have been developed to estimate the radiological impacts from the recycling of scrap metals in which numerical models similar to Equations (1) to (4) are used as basic formulas for calculation [18,19,20]. Among these models, RESRAD-RECYCLE, developed by the Argonne National Laboratory as a computation tool to calculate radiation doses and risks resulting from the recycling of radioactive scrap metal, was adopted in this study in order to facilitate numerical calculation [19]. The RESRAD-RECYCLE code has been validated and widely applied to the prediction of radiation doses from the recycling of scrap metals containing radionuclides through a series of processes including cutting, smelting, and fabrication [21,22].
On the other hand, the potential radiological consequences to receptors T1 to T3 and H from the transportation and handling of SGs and/or the resultant processed objects have been modeled and calculated in this study using the RADTRAN 6 computer code developed by Sandia National Laboratories under the funding of the U.S. Nuclear Regulatory Commission and the U.S. Department of Energy [23]. RADTRAN 6, which simulates the radiation risk based on the measured or calculated dose rate at 1 m from the package, has also been well validated and is frequently used for environmental impact assessments of nuclear installations and transportation risk analysis worldwide [24].

3. Results and Discussions

3.1. General Assessment for the Predisposal Management of Dismantled Steam Generators

In this section, a set of general pathway dose factors (PDFs) was derived for each radionuclide at its unit activity concentration based upon the processing and transportation of a reference SG of the Optimized Power Reactor (OPR 1000) with a weight of 540 tons and reported physical dimensions of 21 m in height and 5.7 m in outer diameter [25,26]. In total, 26 radionuclides are referenced from publicly available inventory data for SGs from a PWR (Kori Unit 1) and a PHWR (Bruce A Unit 1) and considered in the general assessment [14,27]: eight actinides (237Np, 238Pu, 239Pu, 240Pu, 241Am, 242Pu, 243Am, and 244Cm), six fission products (90Sr, 99Tc, 106Ru, 129I, 137Cs, and 144Ce), 10 activated corrosion products (54Mn, 55Fe, 57Co, 59Ni, 60Co, 63Ni, 65Zn, 94Nb, 125Sb, and 154Eu), and two others (3H and 14C).

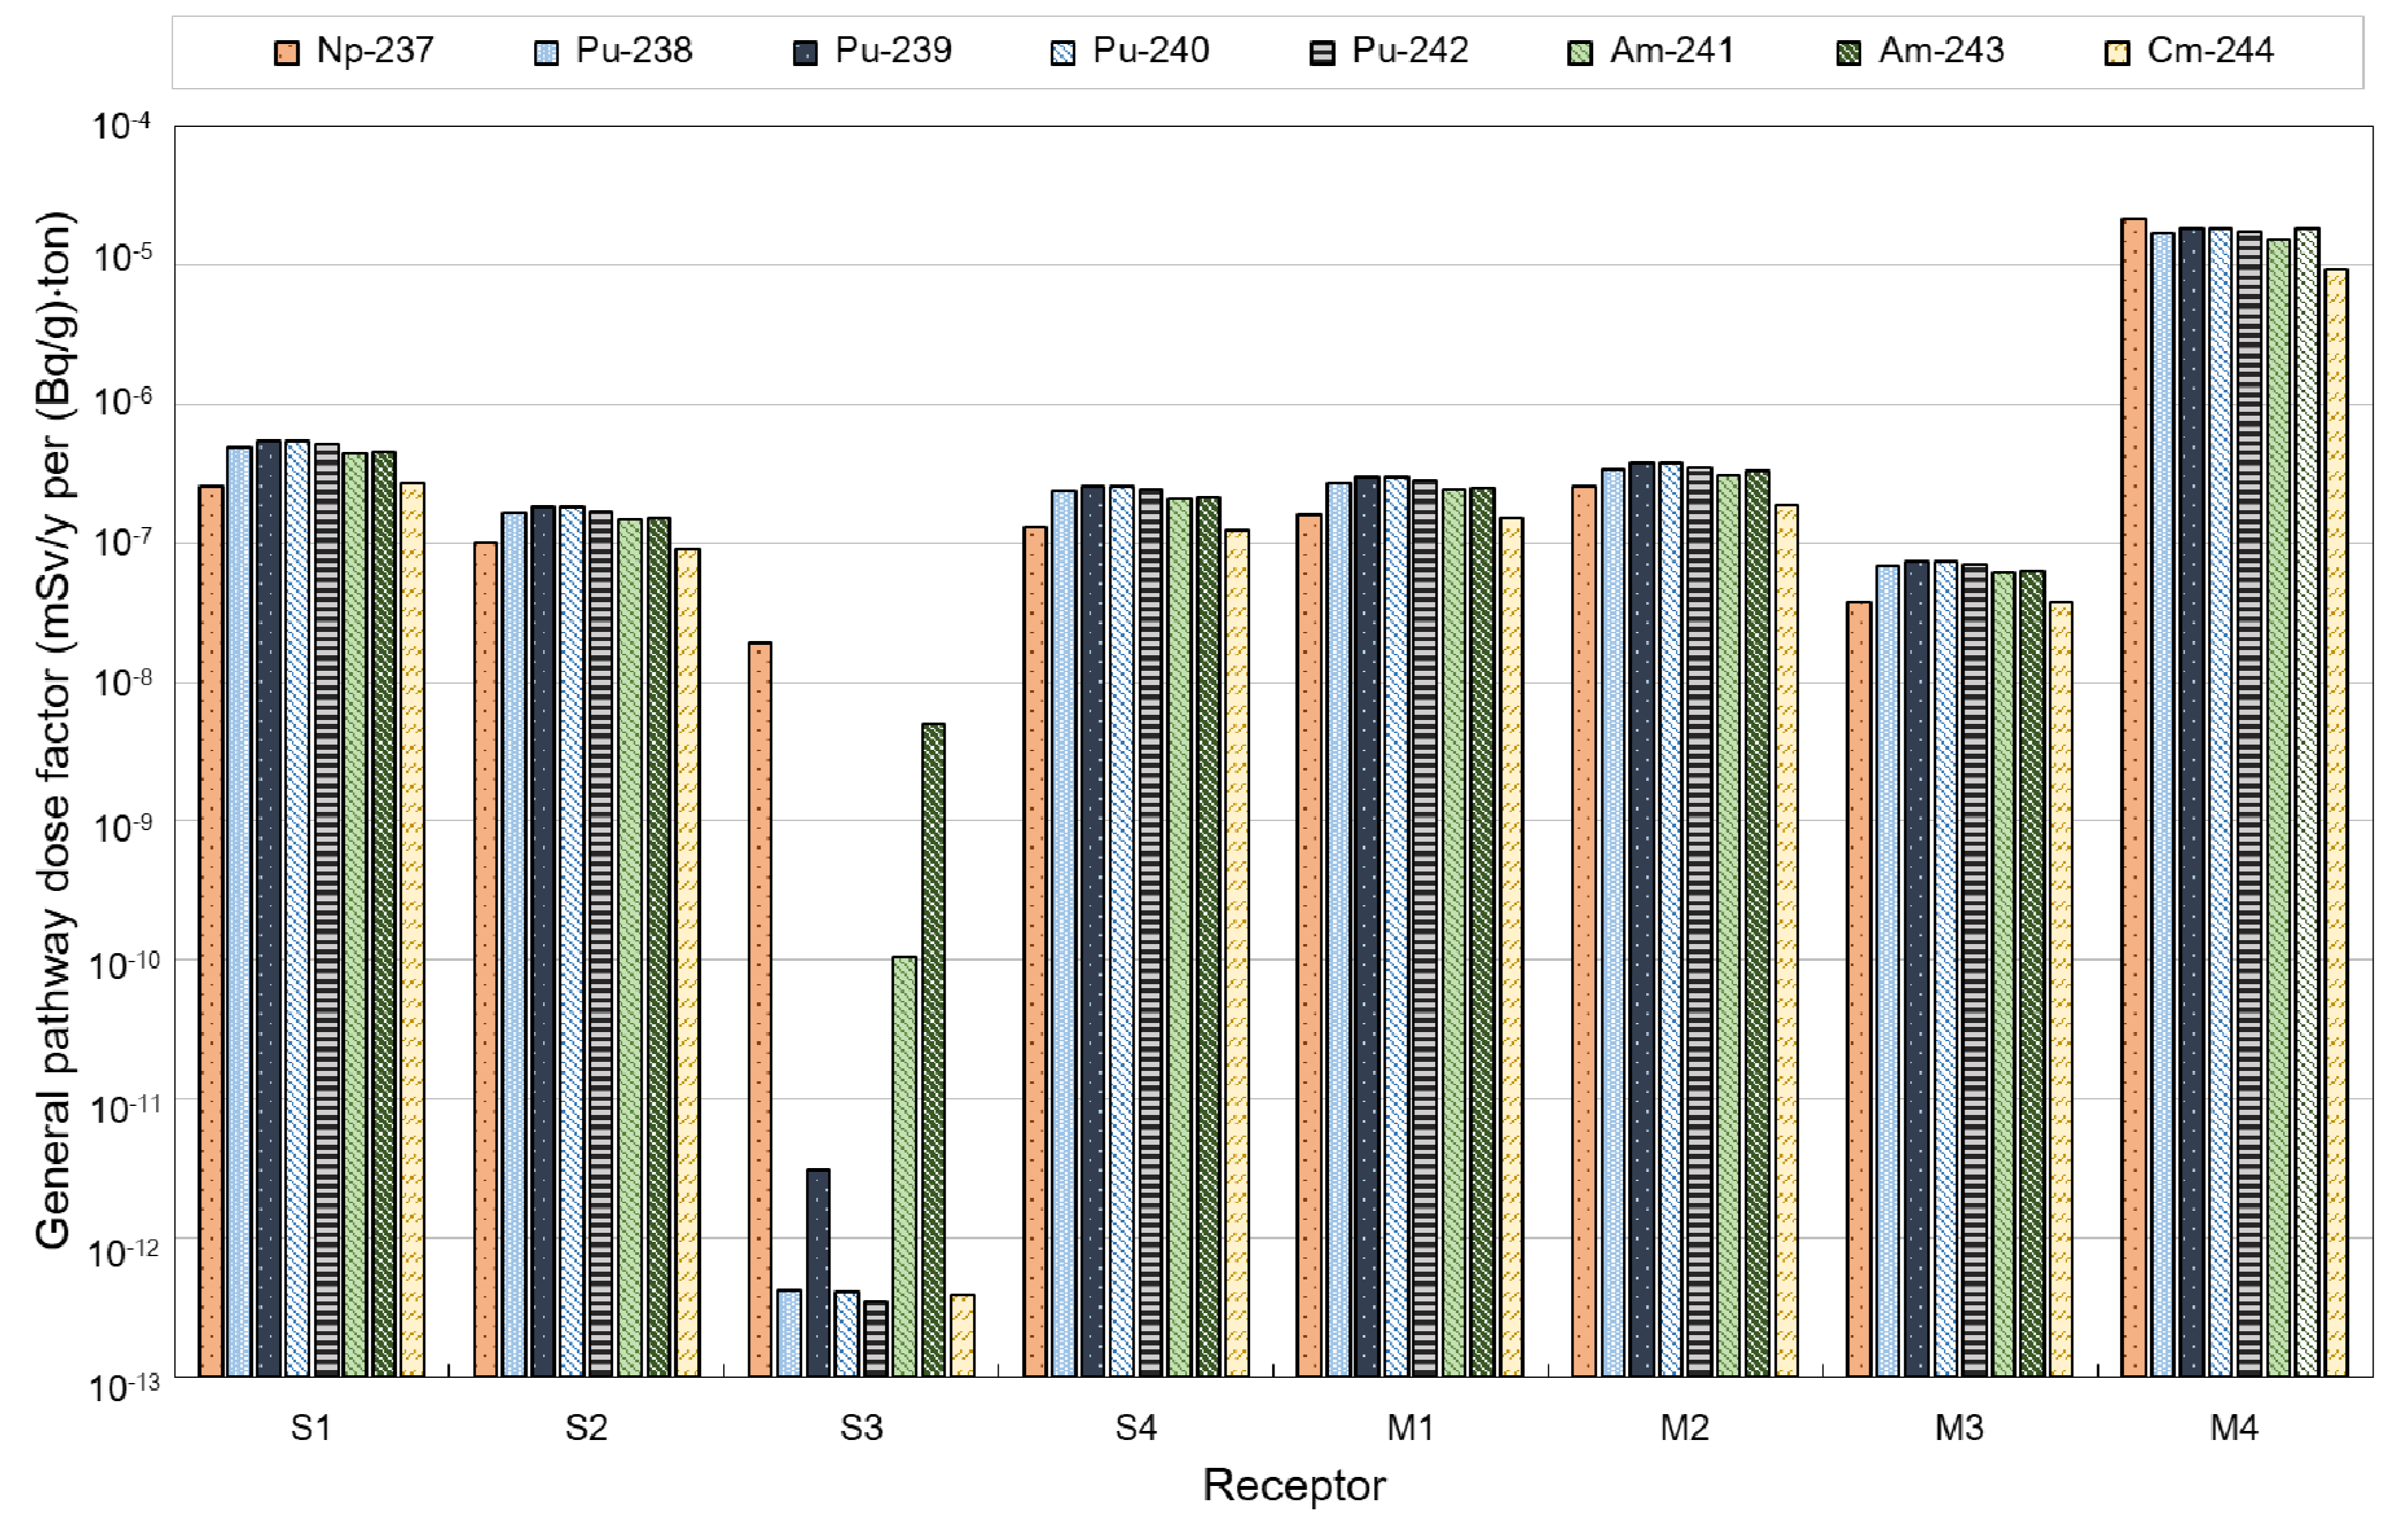
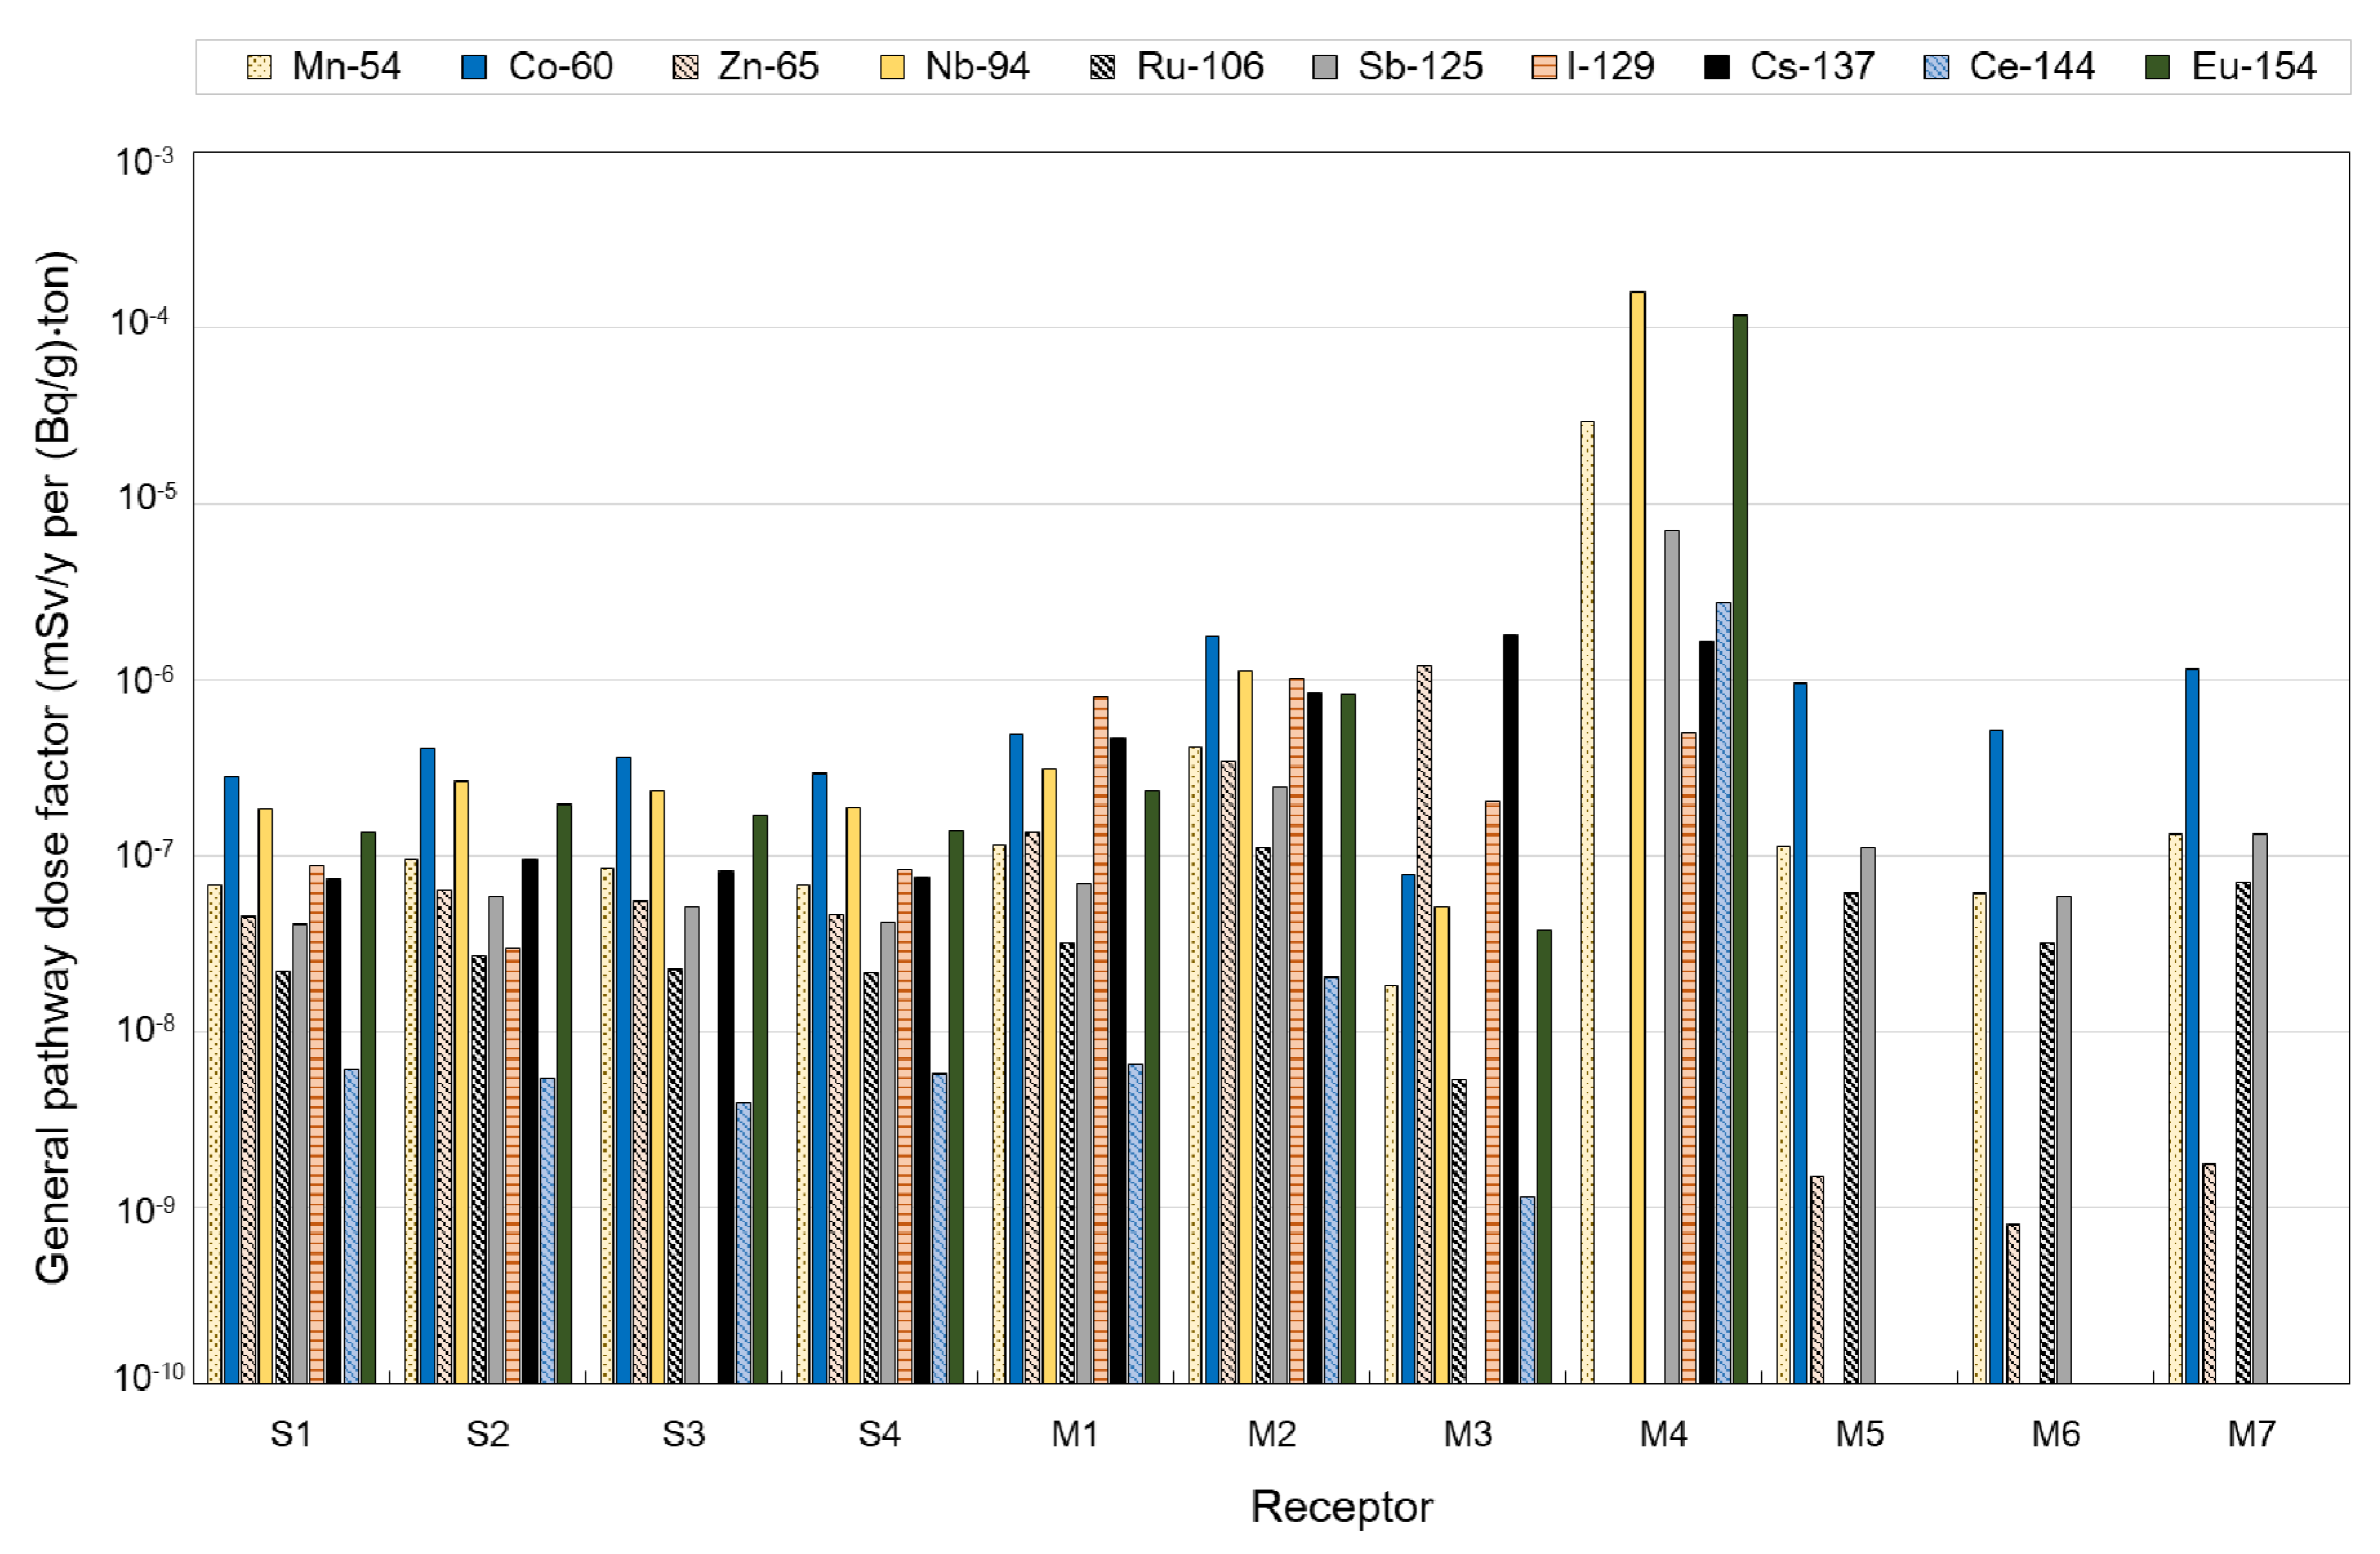
3.1.1. General Pathway Dose Factors for Processing of Dismantled Steam Generators

The potential radiation dose to each receptor involved in the processing of an SG does not depend on the specific site or scenario but instead relies on the activity concentrations of existing radionuclides and weight of the SG, as implied in Equations (1) to (4). In order to derive general PDFs for the processing of an SG, anticipated doses to all potential receptors (i.e., S1 to S4, and M1 to M7, as shown in Table 1) were calculated using RESRAD-RECYCLE code by assuming the unit activity concentration of each radionuclide.
The general PDF for each radionuclide and each receptor can be expressed in terms of ( m S v / y   )   p e r   ( B q / g ) · t o n , as below, from Equations (1) to (4):
G e n e r a l   P D F i = D e x t , i + D i n h , i + D i n g , i W · C S , i = D C F e x t , i + C D · ε · B R · f R · D C F i n h , i + ( C D · B R · ( 1 f R ) + I R ) · D C F i n g , i T P
where the value of T P is the reciprocal of time for processing 1 ton of steel scrap which can be derived from the default exposure time for processing 100 ton of steel scrap as proposed in the RESRAD-RECYCLE model [19]. In addition, the values of f M , P for SG as steel scrap in Equation (5) are assumed to be 90% for ingot, 10% for slag, and 1% for dust using the default values in RESRAD-RECYCLE [19]. The elements with low boiling points, such as cesium, typically concentrate in the dust, and the elements that easily oxidize tend to concentrate in the slag [19]. It is noted that default dose coefficients for inhalation and ingestion (see Equations (3) and (4)) in RESRAD-RECYCLE, which are based upon Federal Guidance Report No. 11, have been replaced with those recently introduced in the International Commission on Radiological Protection (ICRP) Publication 119, in order to calculate the effective dose in accordance with the radiation protection recommendations of ICRP Publication 60 [28,29,30]. The geometry and dimensions of objects handled by receptors participating in SG processing and the distance from the receptors are assumed to be the same as the reference values as proposed in the RESRAD-RECYCLE manual [19]. Thus, the assumed D C F e x t , i is using a default value in the RESRAD-RECYCLE [19]. Other parameters ( C D ,   ε ,   B R ,   f R ,   I R ) are also assumed to be the default value in the RESRAD-RECYCLE [19].
3H, 14C, and 129I are not taken into account in RESRAD-RECYCLE, which may be due to the fact that 3H, 14C, and 129I emit very weak photons, and direct exposure from them is negligible [31]. However, internal exposure from the inhalation and ingestion of these radionuclides may be of concern; radiological impacts from 3H, 14C, and 129I have been frequently considered in the assessment of radioactive waste management [20,32]. In this study, internal exposure from the inhalation and ingestion of these radionuclides has therefore been separately calculated, whereas direct radiation has not been assessed for these three radionuclides.
Values of other parameters used in this study with regard to the processing of a SG are assumed to be the same as the default values in RESRAD-RECYCLE, as mentioned above. Figure 2 shows the general PDF for each actinide and for each receptor involved in the processing of the SG, which is calculated using Equation (8).
It is worth noting that the general PDFs for receptors handling metal ingot (i.e., M5 to M7) are calculated to be zero due to there being no elemental partitioning of actinides into ingot through the smelting process (see Table 2 and Equation (5)) [19].
Significant differences are not found in the general PDFs for receptors S1, S2, S4, M1, M2, and M3, while the PDFs for M4 show much higher values than for other receptors. Furthermore, the variability in PDF values among the eight actinides for a receptor is generally small (e.g., the highest ratio of the maximum to minimum PDF is 2.27), except for receptor S3, for which the significant differences in the PDFs of actinides are observed (e.g., the ratio of the maximum to minimum PDF is about 50,000).
The small differences in the general PDFs for radionuclides (except receptor S3) can be ascribed to the comparable dose coefficients for intake among actinides (i.e., 1.1 × 10⁻⁷ to 2.5 × 10⁻⁷ Sv/Bq for ingestion and 2.1 × 10⁻⁵ to 4.7 × 10⁻⁵ Sv/Bq for inhalation) and the dominance of internal exposure for the respective receptors. In addition, irregularities of the general PDFs among the actinides observed for receptor S3 (i.e., scrap transfer worker) result from the fact that direct radiation becomes the only applicable exposure pathway due to the general assumption of negligible portions of releasable radionuclides under normal transfer conditions [33]. On the other hand, the higher values of general PDFs for receptor M4 (i.e., slag worker) than other receptors, can be attributed to the longer exposure time, higher external dose conversion factor due to larger dimensions of objects, shorter distance from the receptor, and the higher slag-partitioning factor of actinides, as shown in Table 2 [19].
Figure 3 shows the calculated general PDF for each non-actinide and for each receptor involved in the processing of the SG, in accordance with Equation (8).
For receptors S1 to S4, which are involved prior to the smelting process, where the mass of metal scrap and the constituent elements are redistributed into resulting matrices, the external exposure pathway is dominant, and thus the radiological impacts from gamma-emitting radionuclides 60Co, 94Nb, 154Eu, 137Cs, 129I, and 54Mn are higher than for other radionuclides.
In the beginning of the smelting process, in which the receptors M1 and M2 are involved, both direct radiation from scrap metal and internal exposure from the intake of radioactive dust at the smelter or furnace are in effect. Therefore, the general PDF values of radionuclides emitting high-energy gamma rays (e.g., 60Co, 94Nb, and 154Eu) and partitioned into dust (e.g., 137Cs, 129I and 65Zn) are remarkably high (see Table 2). For receptor M3, which handles the baghouse filter, the general PDF values of radionuclides that preferably partition into the dust phase (e.g., 137Cs and 65Zn) are higher compared to the others. Likewise, the general PDFs of 94Nb, 154Eu, 129I, 54Mn, and 125Sb, which tend to be redistributed into slag, turn out to be dominant for slag workers (receptor M4). It is also noted that the general PDFs for receptor M4 are much higher than other receptors, as shown in Figure 3, which can be ascribed to the same arguments already addressed to interpret the similar trend observed in Figure 2. In addition, gamma-emitting radionuclides preferably partitioned into ingot (i.e., 60Co, 54Mn, 125Sb, 106Ru, 65Zn, etc.) induce higher PDF values for receptors handling ingot (i.e., M5 to M7).
Due to the volatile characteristics of 3H, 14C and 129I, however, the radionuclides may not be trapped by the baghouse filter and may ultimately be dispersed into the atmosphere [20]. As implied in the footnote of Table 2, significant portions of volatile elements are released into the atmosphere from the processing facility and the radiological impacts from them may require additional care regarding public exposure, due to the release of airborne radionuclides. In this regard, the activity concentration of radionuclide i at the boundary of the processing facility, C B , i (Bq/m3), can be calculated as [34]
C B , i = ( 1000 ) ( 31 , 536 , 000 ) · C S , i · W · f D , i · ( X / Q )
where f D , i is the dischargeable fraction of the volatile element i, 1000 is the factor used to convert tons into grams, 31,536,000 is the factor used to convert seconds to years, and X / Q is the atmospheric dispersion factor ( s / m 3 ). By applying C S , i of 1 Bq/g, W of 1 ton/year and f D , i of 90%, 36.5%, and 50% for 3H, 14C and 129I, respectively, as well as X / Q of 4.605 × 10⁻⁶ s / m 3 (at 1000 m downwind distance) as suggested in comparable studies, C B , i for 3H, 14C, and 129I were calculated and compared to the effluent concentration limit for airborne radionuclide ( E C L A , i ) set forth in 10 CFR Part 20 Appendix B, based upon the annual radiation dose limit (i.e., 1 mSv/year) for the members of the public, as shown in Table 3 [20,35].
As shown in Table 3, the ratio of C B , i   to E C L A , i lies within a range from an order of approximately 10−14 to 10−9, and the activity concentrations equivalent to the ratio of C B , i   to E C L A , i   to unity are calculated to be 2.03 × 10⁸ to 2.81 × 10¹³ Bq/g, which conforms to a total activity of each radionuclide of 1.09 × 10¹¹ to 1.52 × 10¹⁶ MBq in the SG (i.e., 540 tons). It is noted that the above estimated total activity for each volatile radionuclide equivalent to the public dose limit is much lower than the actual radioactive source terms of SGs in Section 3.2.1. Thus, the potential exposure due to volatile radionuclides released into the atmosphere from a processing plant are not further taken into account in this study, since their contributions to radiological impacts turn out to be negligible.

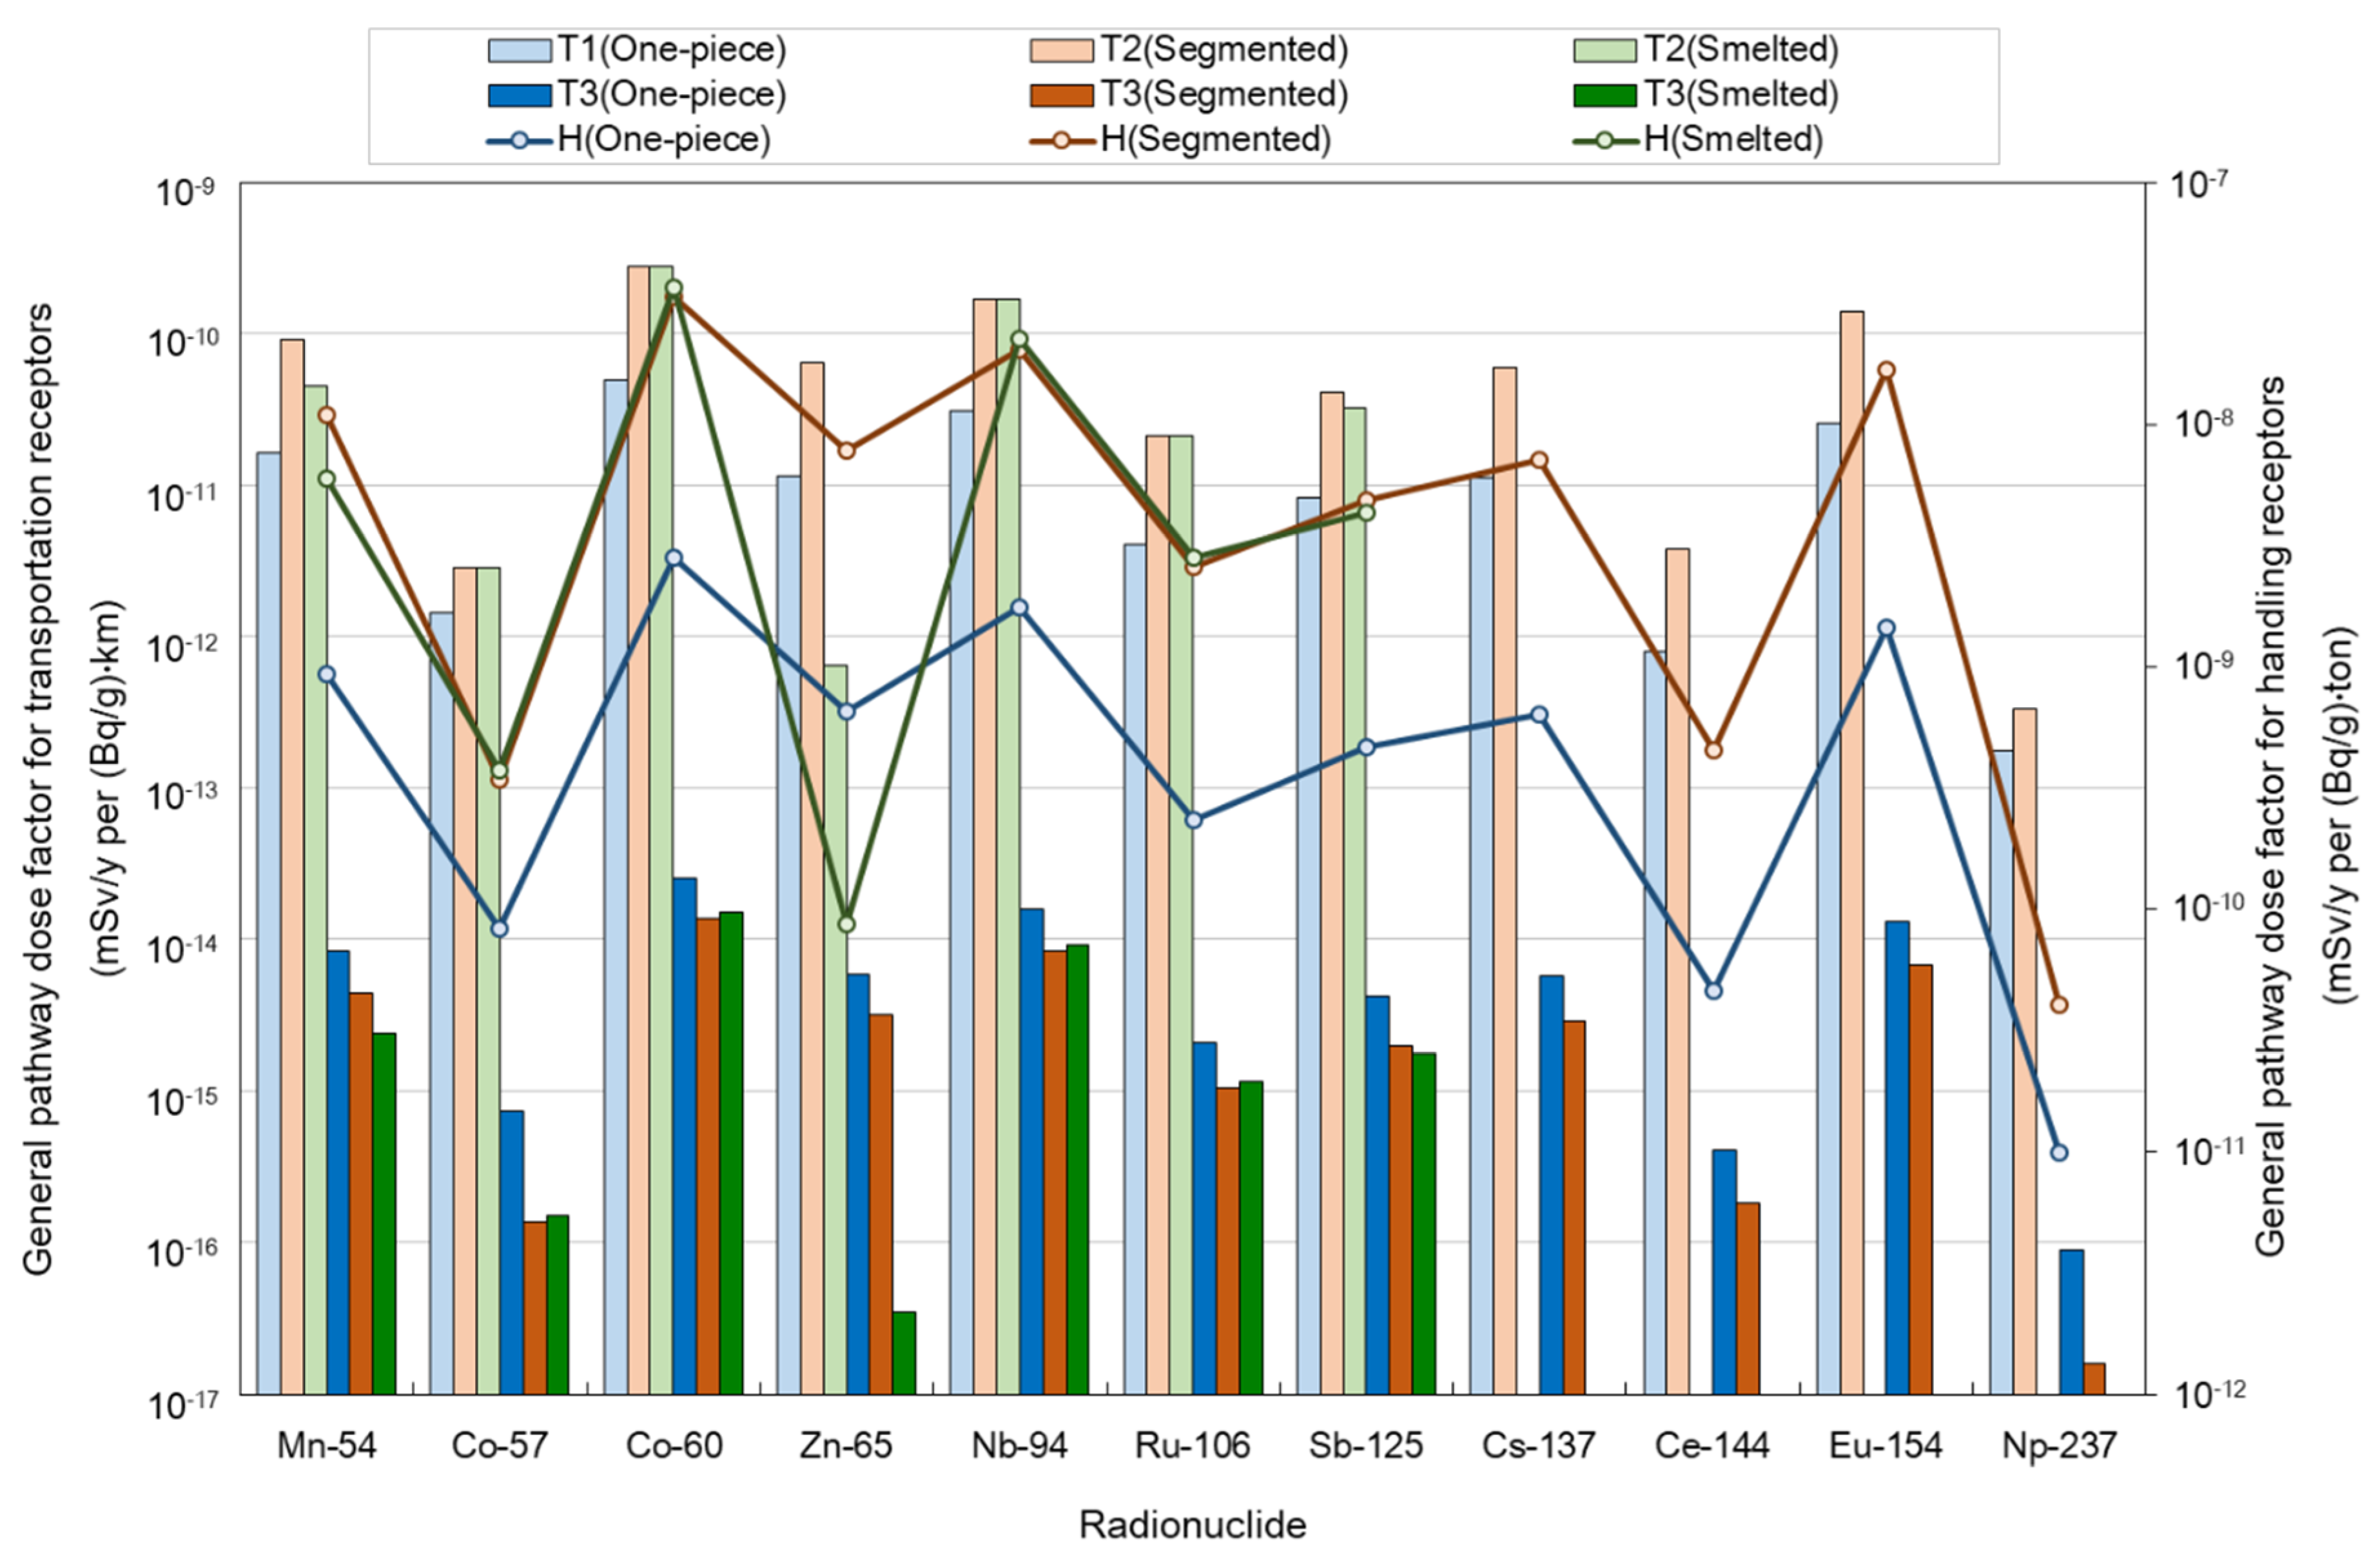
3.1.2. General Pathway Dose Factors for Transportation and Handling of Dismantled Steam Generators

Using Equation (6), the general PDF for each radionuclide and each receptor (i.e., T1 to T3) involved in the transport operations can be defined in terms of ( m S v / y   )   p e r   ( B q / g ) · k m , as below:
G e n e r a l   P D F T r a n s , i = D T r a n s , i C S , i · L = D R i · N T r a n s v
and receptor H, involved in the handling operations, can be defined in terms of ( m S v / y   )   p e r   ( B q / g ) · t o n as follows:
G e n e r a l   P D F H a n d l e , i = D H a n d l e , i C S , i · W = D R i T P
where D h a n d l e , i (in mSv/year) can be calculated by replacing D C F e x t , i with D R i in Equation (2).
In order to calculate the radiation dose from transportation using RADTRAN 6, the dose rate 1 m from the package should be provided as an input [32]. Thus, the dose rate 1 m from a package containing 1 Bq/g of each radionuclide listed in Table 4 has been derived using the MicroShield® computer code with regard to the SG in one piece, and a container containing processed (i.e., segmented or smelted) objects [36]. For simplification, each radionuclide is assumed to be homogeneously distributed in the total volume of the SG weighing 540 tons in one piece, defined in Section 3.1, and in the International Organization for Standardization (ISO) 1496/1 container (length 12 m, width 2.4 m, and height 2.5 m), which is widely used in the transportation of low and intermediate level radioactive waste (LILW), containing 20 tons of processed objects [23]. As such, the dose rate 1 m from each package containing each of the 11 key radionuclides for SG transportation at unit activity concentration was derived as shown in Table 4, ranging in the order of 10−7–10−4 ( m S v / h   )   p e r   ( B q / g ) . It should be noted that other radionuclides showing negligibly low dose rates ranging in the order of 10−25–10−15 ( m S v / y   )   p e r   ( B q / g ) are not given in Table 4.
In Table 4, the ratio of the dose rate 1 m from the SG to that from the ISO 1496/1 container that emplaced segmented objects is about 1.6, on average, except for 57Co and 237Np. The higher dose rate 1 m from the SG than from the container can be attributed to the difference in total radioactivity present in the whole SG and in one container; that is, there is 27 times higher radioactivity in the SG than in the single container for segmented SG. Due to the redistribution of radionuclides after smelting, for some radionuclides that are concentrated to ingot after smelting as the concentration of these radionuclides can be calculated by Equation (5) (i.e., Co57, Co60, Nb94 and Ru106) using the values in Table 2, the dose rate at 1 m from the container containing smelted SG (i.e., ingot) is higher than that for segmented SG. However, for other nuclides that are not redistributed to ingot after smelting (i.e., Cs137, Ce144, Eu154 and Np237), no radiological impacts of these nuclides for smelted SG transportation were observed. The much lower ratios for two low-energy photon emitters 57Co and 237Np (a few keV of average photon energy) can be ascribed to the fact that the low-energy photon is very susceptible to self-absorption [37].
As shown in Figure 4, the general PDFs for T1–T3 and H have been derived using the RADTRAN 6 code in accordance with Equations (10) and (11), using the assumed values of parameters referenced from the open literature, as given in Table 5.
As shown in Figure 4, the general PDF values for receptors T1 and T2 which use road transportation are 766 to 1952 times higher than those for the waterway transport workers, T3, and the general PDFs for the receptor involved in the transportation/handling of the processed SG are about two to six times higher than those for SG in one piece. The higher PDF values for the road transportation than for the waterway transportation result from an inspector checking the packaging for only two minutes per day being considered a crew member for waterway transport in the RADTRAN 6 model, while a driver for road transportation, exposed during the whole transport operation, is assumed to be a crew member [32].
On the other hand, the higher general PDF values for the processed SG transportation/handling for receptors T1, T2 and H than those for SG in one piece can be attributed to N t r a n s which have values of 27 y 1 for the segmented SG transportation and 24.3 y 1 for smelted SG because the loading limit of the container is 20 ton so that 540 ton of segmented objects are transported in 27 times, and 486 ton that are partitioned to the ingot mass (90%) of smelted objects are transported in 24.3 times. Furthermore, although the dose rate at 1 m from the container containing smelted SG is higher than that containing segmented SG for Co57, Co60, Nb94 and Ru106 given in Table 4, the general PDF values for segmented SG are higher than those for smelted SG due to the N t r a n s mentioned in the previous paragraph. Thus, the effect of N t r a n s is greater than that of the concentrated radioactivity concentration of the ingot.
However, for waterway receptor, T3, N t r a n s is the same whether the transportation of SG in one piece or in the container including processed objects. Therefore, the general PDFs for SG in one piece is higher than that for the containers with processed objects, which conforms to the relative magnitudes of the dose rate at 1 m from package calculated in this study (see Table 4).

3.2. Specific Assessment for Predisposal Management of Dismantled Steam Generators

In order to estimate the potential radiological impacts from the management of actually dismantled SGs, a set of assessments have been conducted for two types of SGs from PWRs and PHWRs to be managed in Korea. One of the SGs was replaced from Kori Unit 1 in 1998 and the other from Bruce A Unit 1 in 1997; these are assumed to be representative large components from PWRs and PHWRs, respectively.

3.2.1. Characteristics and Source Terms of Dismantled Steam Generators

Kori Unit 1 is a two-loop 576 MWe PWR in Korea under permanent shutdown since 2017, and its replaced SG has a dimension of about 20 m in height and 4.88 m in outer diameter, and weighs 300 tons [42]. On other hand, Bruce A Unit 1 is a one-loop 840 MWe Canadian PHWR, and its replaced SG has a dimension of about 11.7 m in height and 2.6 m in outer diameter and weighs 100 tons [27,43]. Table 6 shows the actual radionuclide-specific inventories of the two types of SGs obtained from the open literature [38,44].
The composition and inventory of each radionuclide in the PWR SG were reported to be characterized by a smear test for radioactive deposits onto the surface of the SG chamber and the measurement of the dose rates from the SG tubes in 1998; however, non-gamma emitters were not included in the source terms [44]. Ten short-lived radionuclides with half-lives of less than 180 days were excluded from the 16 reported radionuclides, resulting in six radionuclides (e.g., 54Mn, 57Co, 60Co, 65Zn, 106Ru, and 144Ce) being assessed for the PWR SG. On the other hand, the radioactive source terms for the PHWR SG were reported to be determined by multiple measures, not only including direct measurements by in situ gamma spectrometry, but also the application of scaling factors and neutron activation calculations to estimate the hard-to-detect radionuclides in 2010 [27]. From the reported 22 radionuclides, short-lived radionuclides were screened out as well, and 21 radionuclides in total were retained for assessment in this study.

3.2.2. Specific Scenarios for Predisposal Management of Dismantled Steam Generators

One PWR SG is assumed to be produced from one of the six PWRs in the Hanul NPPs where PWRs are in operation, then processed or unprocessed and ultimately transported using a road or waterway to the final radioactive waste repository, Wolsong LILW Disposal Center (WLDC), in accordance with the 12 scenarios given in Table 1. In addition, it is assumed that one PHWR SG is generated from one of the four PHWRs in the Wolsong NPPs site and then transported to WLDC with/without processing via road transport only; waterway transport is screened out due to the proximity of WLDC to the Wolsong NPPs site.
The distance from each NPP site to the overseas processing plant and WLDC is estimated using publicly available geographic information, as shown in Table 7. The distance from each NPP site to the offsite domestic processing plant is simply assumed to be 100 km for road transportation, while the distance to the overseas processing plant (21,500 km, as shown in Table 7) is estimated by assuming transportation from the Wolsong NPP site to the Studsvik radioactive metal processing plant in Sweden [45].
As addressed in Section 3.1.2 and Table 4, the dose rate 1 m from each packaging (i.e., two types of SGs and containers including processed objects) was calculated using the radioactive source terms of each SG given in Table 6 as follows: 0.805 and 0.237 mSv/h for the one-piece SGs from PWR and PHWR, respectively, and 0.604 and 0.193 mSv/h for the containers with segmented objects produced from the processing of the SG from each NPP, and 0.654, 0.213 mSv/h for the containers with smelted objects of the SG from each NPP. Moreover, the values of N T r a n s are 15 and 5 y−1 for the PWR and PHWR segmented SGs, respectively, and 13.5 and 4.5 y−1 for the PWR and PHWR smelted SGs.

3.2.3. Calculation of Radiation Dose from Processing of Dismantled Steam Generators

The total dose of the receptors processing SGs can be rewritten from Equations (1) and (8) as
D t o t = W · i = 1 N C s . i · G e n e r a l   P D F i
where N is the number of radionuclides. Accordingly, the total dose of each receptor processing the PWR SG and PHWR SG shown in Figure 5 was calculated by the general PDF for each radionuclide i (see Figure 2 and Figure 3), the weight of PWR SG and PHWR SG (300 and 100 ton, respectively), and the concentration of each radionuclide i (see Table 6).
Although it is not specified in Figure 5, 60Co turns out to be the most dominant for all receptors except for M4 (slag worker), which is attributed to it having the highest activity concentration among the 26 radionuclides, as given in Table 6, and the high general PDF value for 60Co, except for M4, due to the very high element partitioning of 60Co into ingot and no partitioning into the slag phase, as shown in Table 2.
As shown in Figure 5, all the radiation doses of the receptors S1 to S4 and M1 to M7 for PWR SG are higher than those for the PHWR SG. This can be explained by the higher inventory of radionuclides in the PWR SG (see Table 6) and the three times heavier weight of the PWR SG compared to the PHWR SG, as implied in Equation (12). In addition, two receptors—M2 (furnace operator) and M4 (slag worker)—received the highest radiation doses in the processing of both types of SGs. The high exposure of the receptor M2 can be attributed to the high dust loadings (i.e., C D in Equation (3)) in the smelting process compared to the segmentation process [19]. On the other hand, the high radiation dose for receptor M4 can be ascribed to the fact that more radionuclides tend to redistribute into slag than into ingot and dust phases in the smelting process (see Table 2). Moreover, the relatively high radiation dose of M4 among others involved in the processing of PHWR SGs results from the selective partitioning (i.e., 99%) of all actinides into the slag phase. Finally, the lower radiation dose of receptor M3 (baghouse processor) than the other receptors in the processing of PWR and PHWR SGs is explained by the very low contents of 65Zn and 137Cs (i.e., 0.3% and 0.6%, respectively, as given in Table 6), whereas only two out of the 26 radionuclides of concern tend to distribute selectively into the dust phase, which are the radionuclides that most affect the receptor M3.

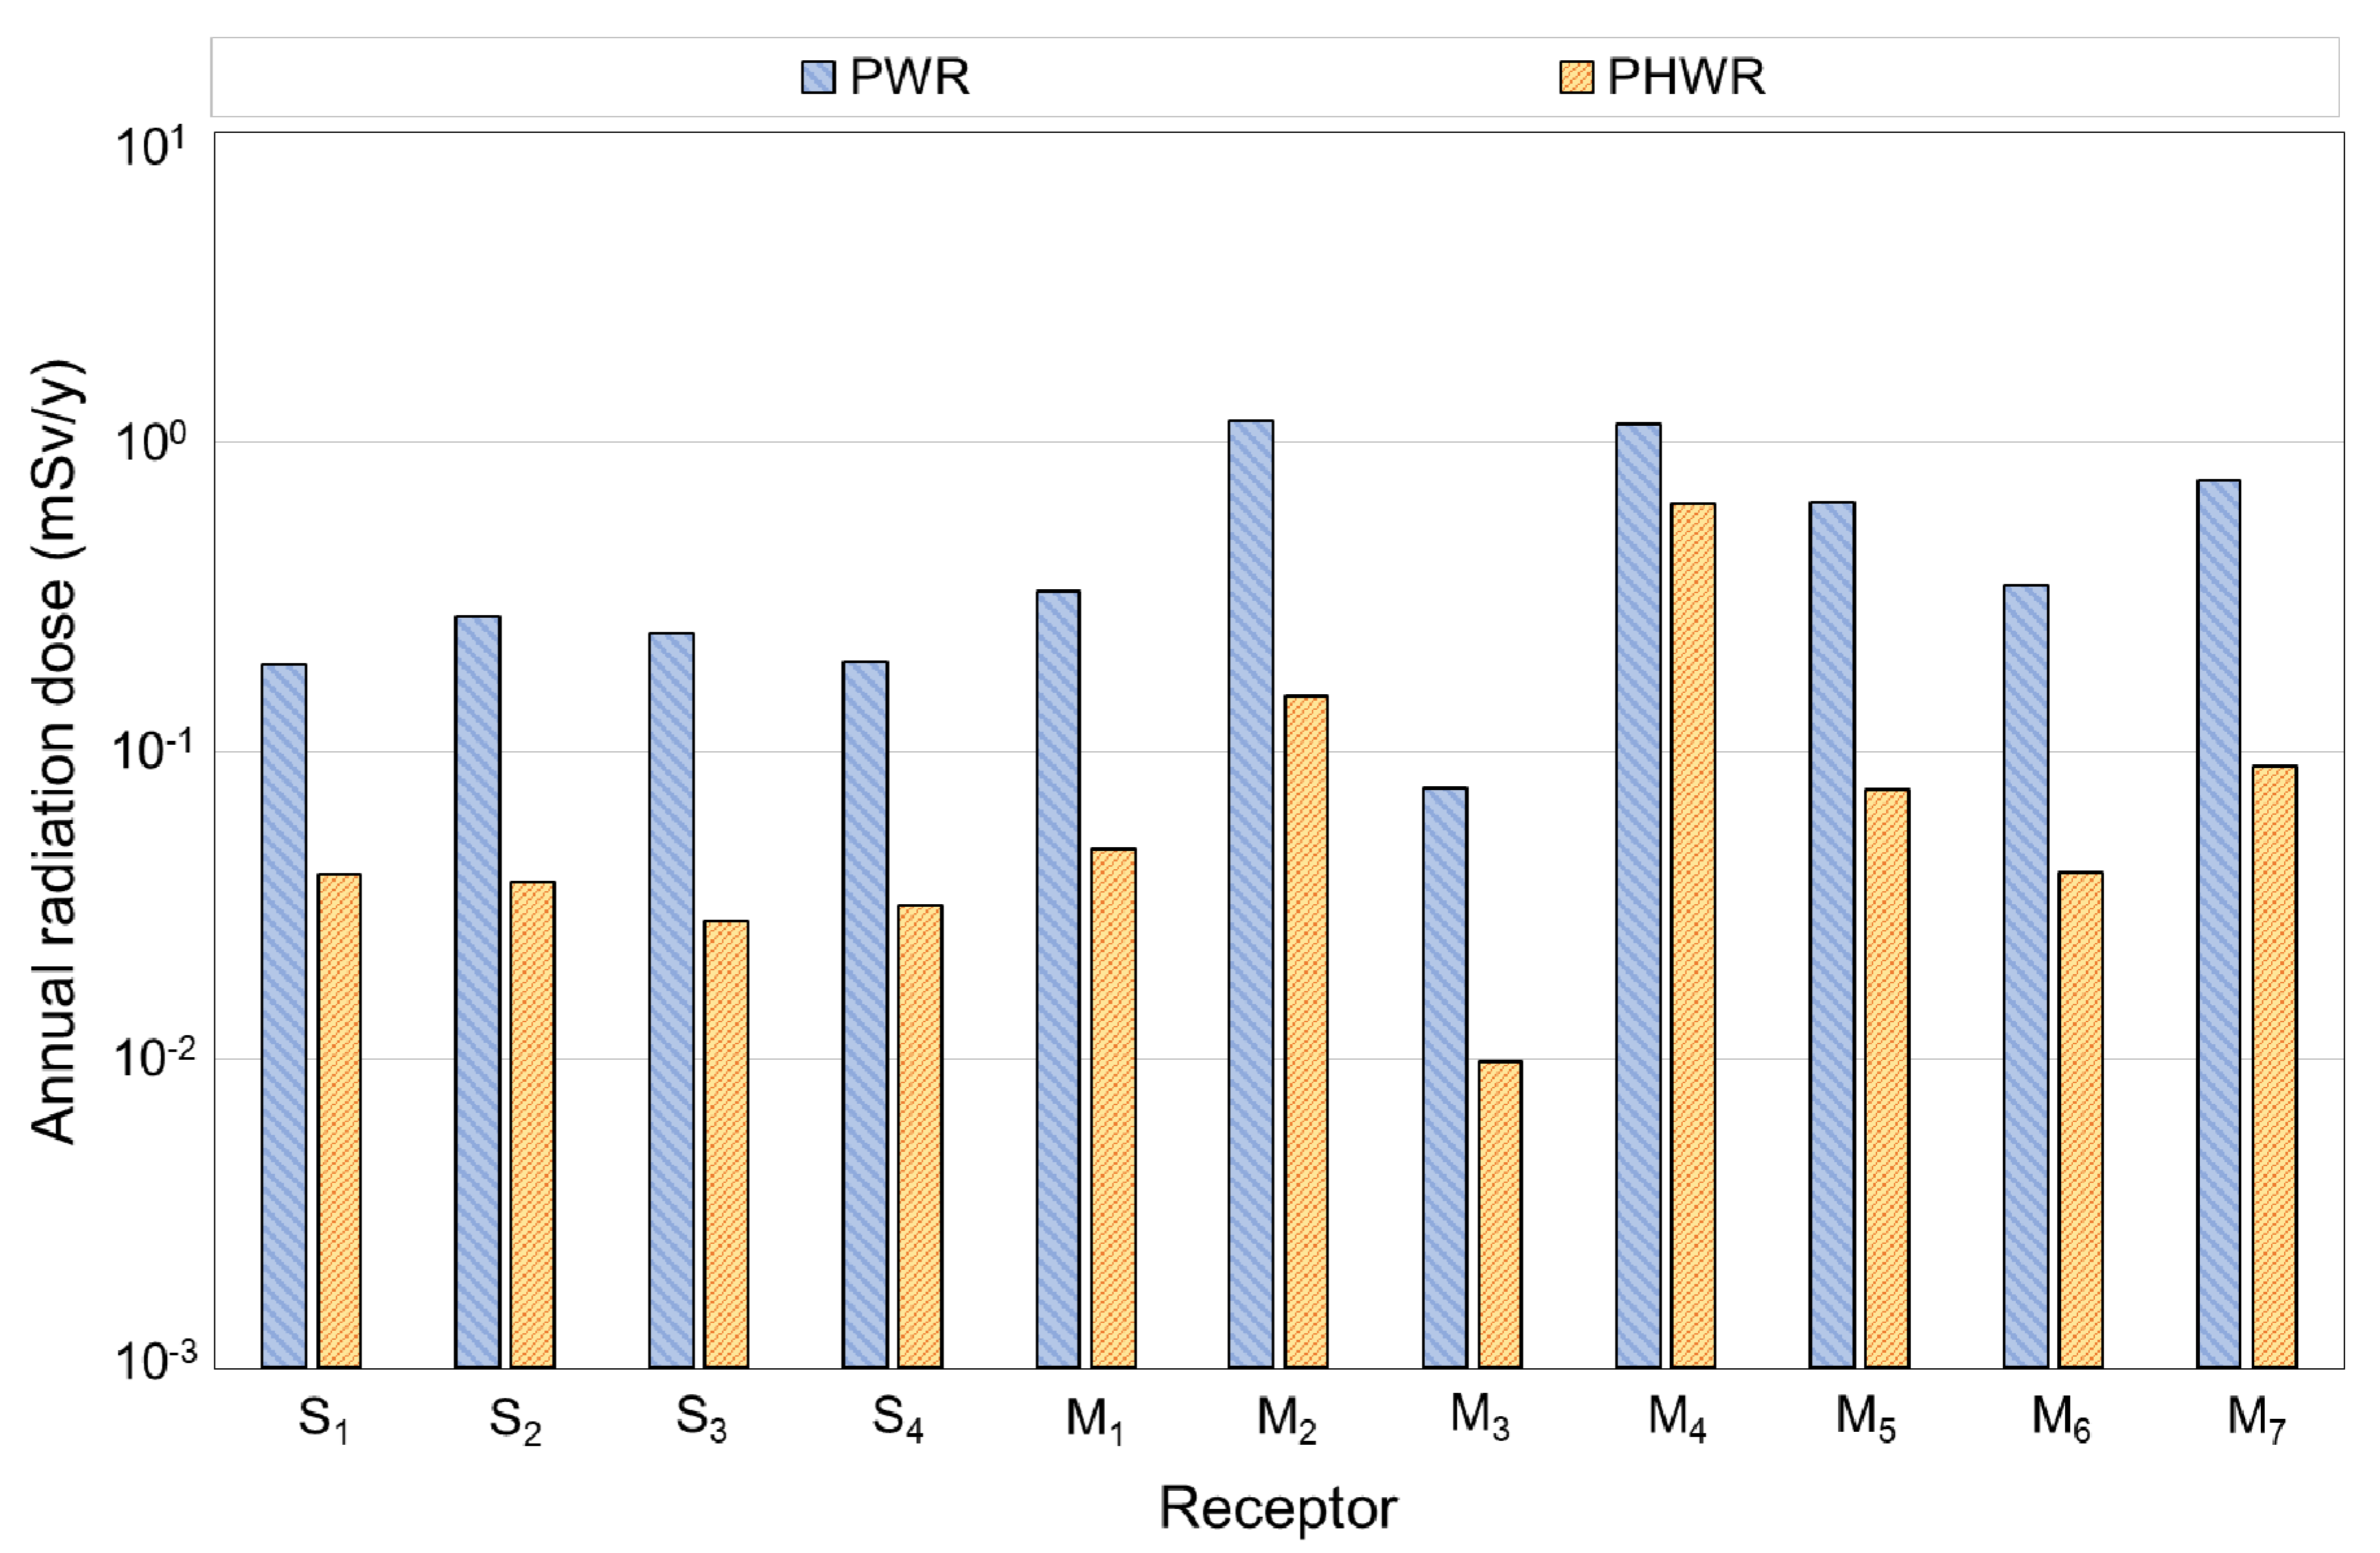
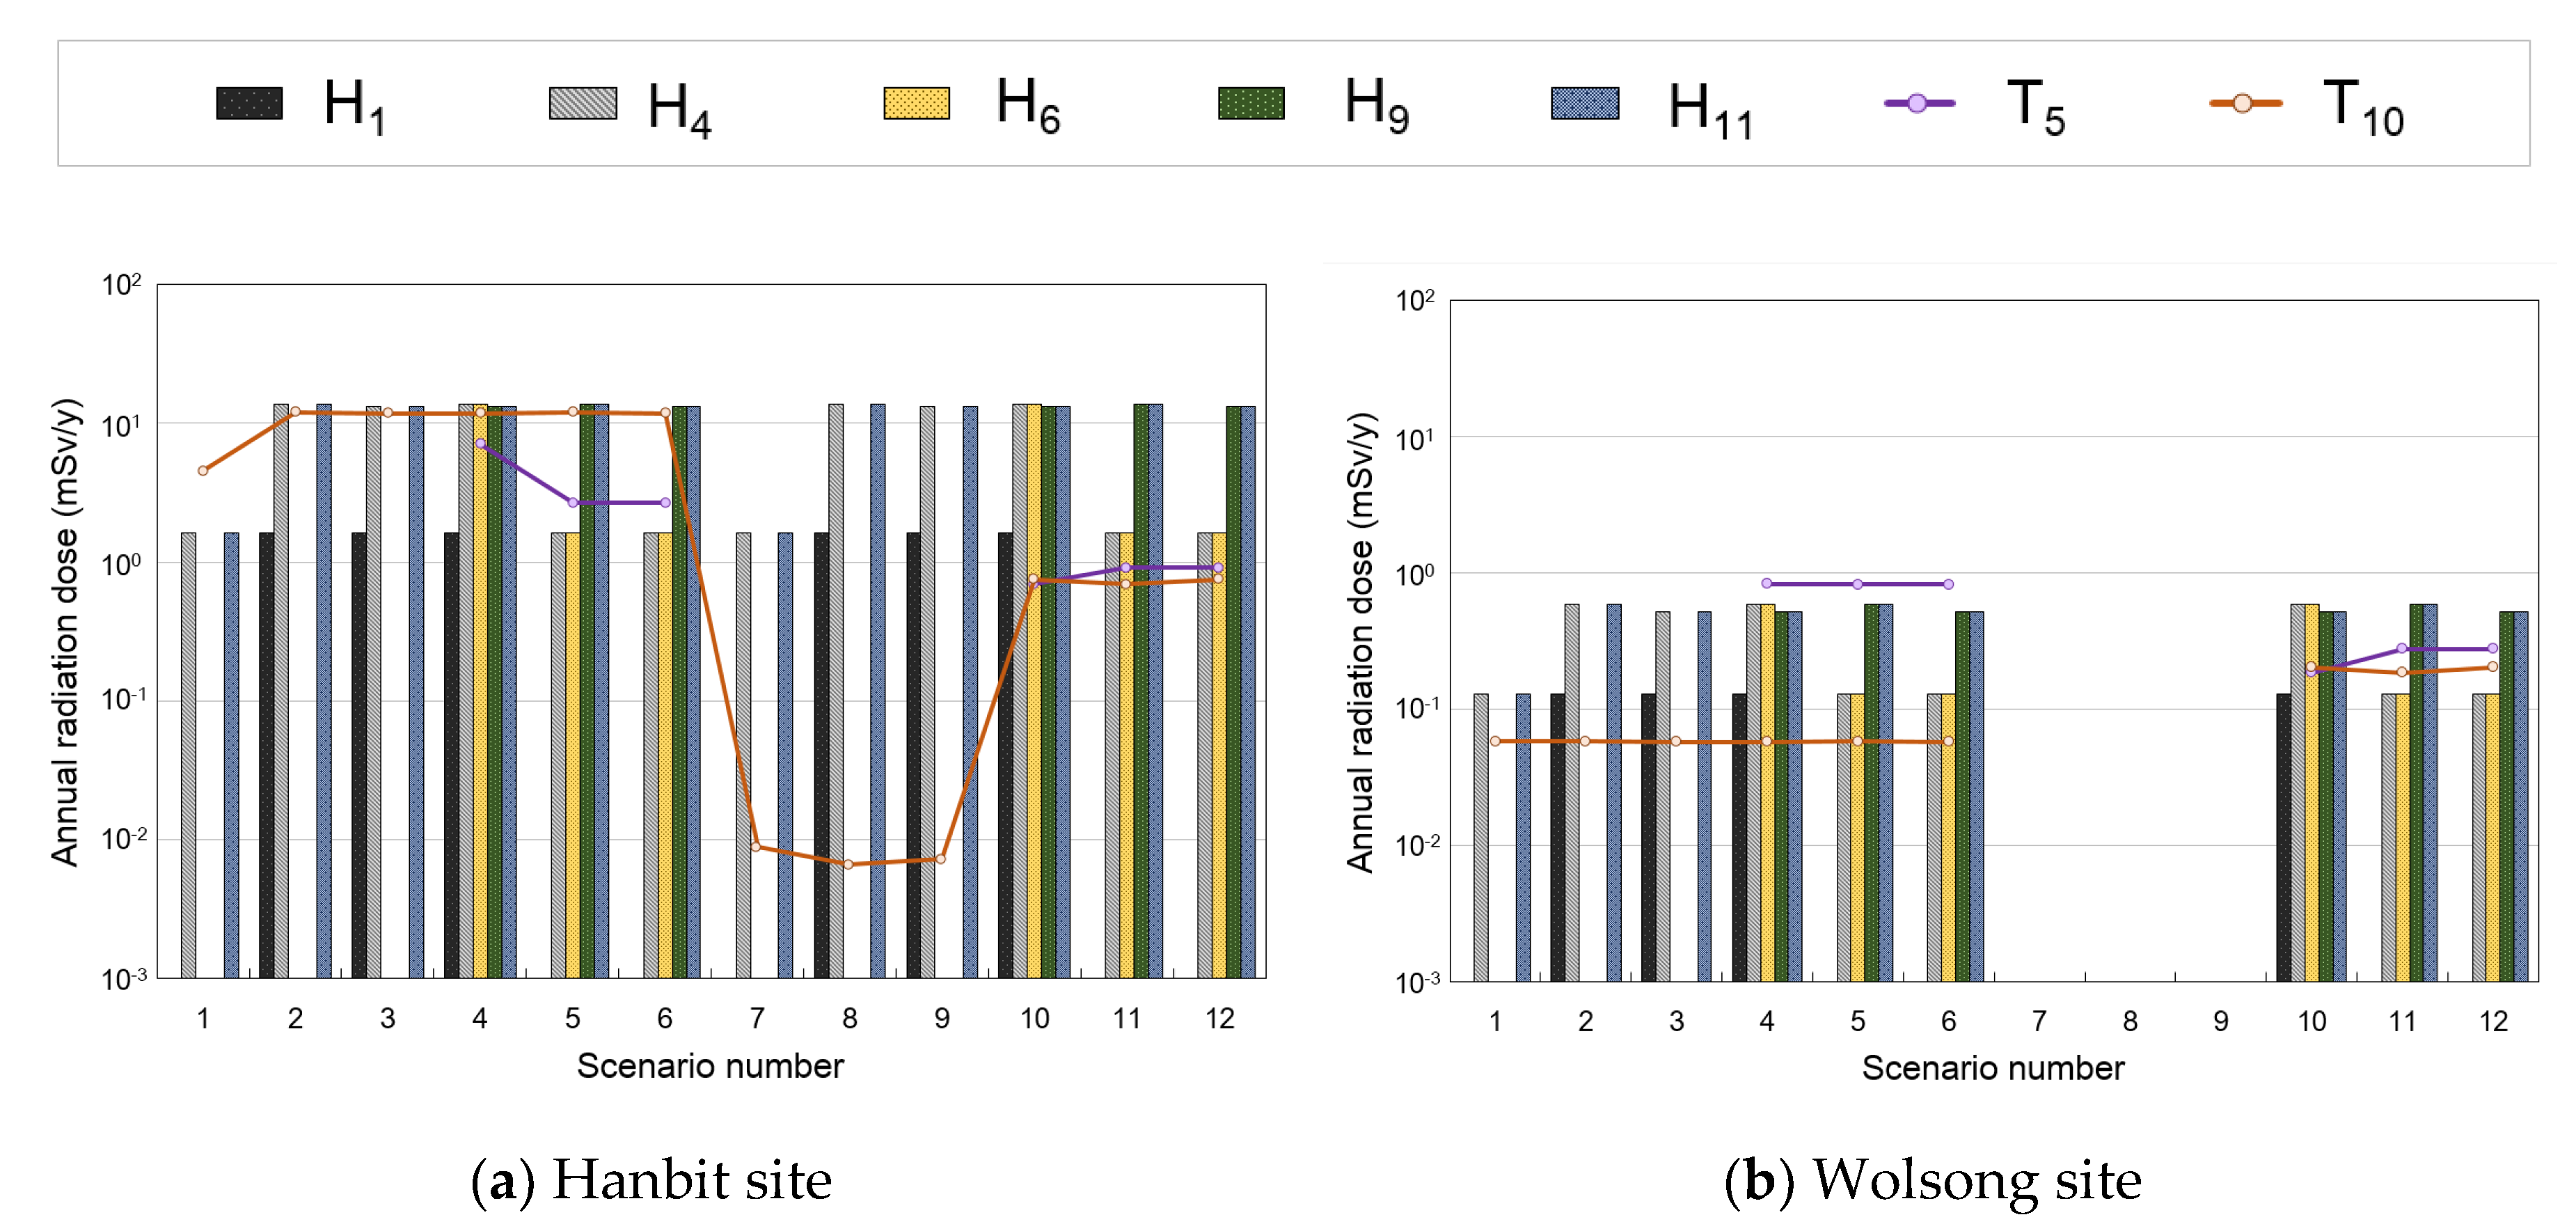
3.2.4. Calculation of Radiation Dose from Transportation and Handling of Dismantled Steam Generators

In contrast to the specific dose calculation for the processing receptors that can be directly calculated using the general PDFs and the given input parameters (see Section 3.2.3), the radiation dose of the receptors involved in the transportation or handling of SGs in a specific case should be calculated in a different way. That is, the total dose of the transportation receptor can be calculated using Equation (6) as below:
D t r a n s = L · N T r a n s v · i = 1 N D R i · C s . i
On the other hand, the total dose of receptor-handling SG can be derived from Equation (2) as follows:
D H a n d l e = W T P · i = 1 N D R i · C s . i
Radiation doses for the receptors (T1 to T3 and H) participating in the transportation of SGs from the PWRs NPP site in Korea (i.e., Hanbit) or from PHWRs NPP site (i.e., Wolsong) are calculated using Equations (13) and (14) and the values of parameters v given in Table 5, C S , i in Table 6, L in Table 7, and N T r a n s in Section 3.2.2. No plots for the Scenarios 4–9 in Figure 6b result from the screening out of the inland waterway transport of the PHWR SG from Wolsong Site to WLDC (see Section 3.2.2).
The radiation doses for the package handlers (H) in all scenarios in Figure 6a,b are calculated to be the same, as the target package is same (e.g., H4 = H6 and H9 = H11 for Scenarios 4–6 and Scenarios 10–12). The lower doses for H in Figure 6b than Figure 6a can be explained by the differences in the radionuclides inventories (Table 6) and the general PDFs derived in this study (Figure 4) between SGs from PWR and PHWR.
The calculated doses for T210 in Scenarios 2 and 5 (i.e., the transportation of segmented SG) show the highest level among the road transport workers (T1 and T2) in Scenarios 1–6 in Figure 6a, which conforms to the relative magnitudes of the general PDFs calculated in this study (see Figure 4). However, the higher doses for T310 in Scenarios 11 and 12 (i.e., the transportation of the SG in one piece), among waterway transport workers in Figure 6a, can also attributed to the highest general PDF values for the transportation of the SG in one piece (see Figure 4). Likewise, the higher radiation dose for T310 (i.e., the transportation of segmented SG) than that for T35 (i.e., the transportation of smelted SG) in Scenario 10 can be explained by the higher general PDF for the transportation of segmented SG than for the transportation of smelted SG (see Figure 4).
The lower radiation doses for the receptors involved in the inland or overseas waterway transportation of the PWR SGs in Scenarios 7–12 in Figure 6a compared to the road transport drivers in Scenarios 1–6 were already predicted in the respective general PDFs, as shown in Figure 4. On the other hand, the higher doses for the overseas waterway transportation of the PHWR SGs in Scenarios 10–12 in Figure 6b compared with road transportation in Scenarios 1–3 are contrary to the general PDFs in Figure 4, which can be ascribed to the much longer distance for the overseas transportation (21, 500 km) than for the road transportation (7 km), as shown in Table 7.

3.3. Comparison with Actual Experiences in and Studies on Predisposal Management of Steam Generators

In order to test the applicability of the models proposed in this study, a comparison with other modeling studies or actual experiences is helpful. Comprehensive studies covering every stage in the predisposal management of SGs are not available in the open literature; however, the radiological impact assessment models established in this study are partly compared to a reference study only on the onsite processing of an SG in Korea and another practical reference study only on the transportation of SGs in Germany [13,14].

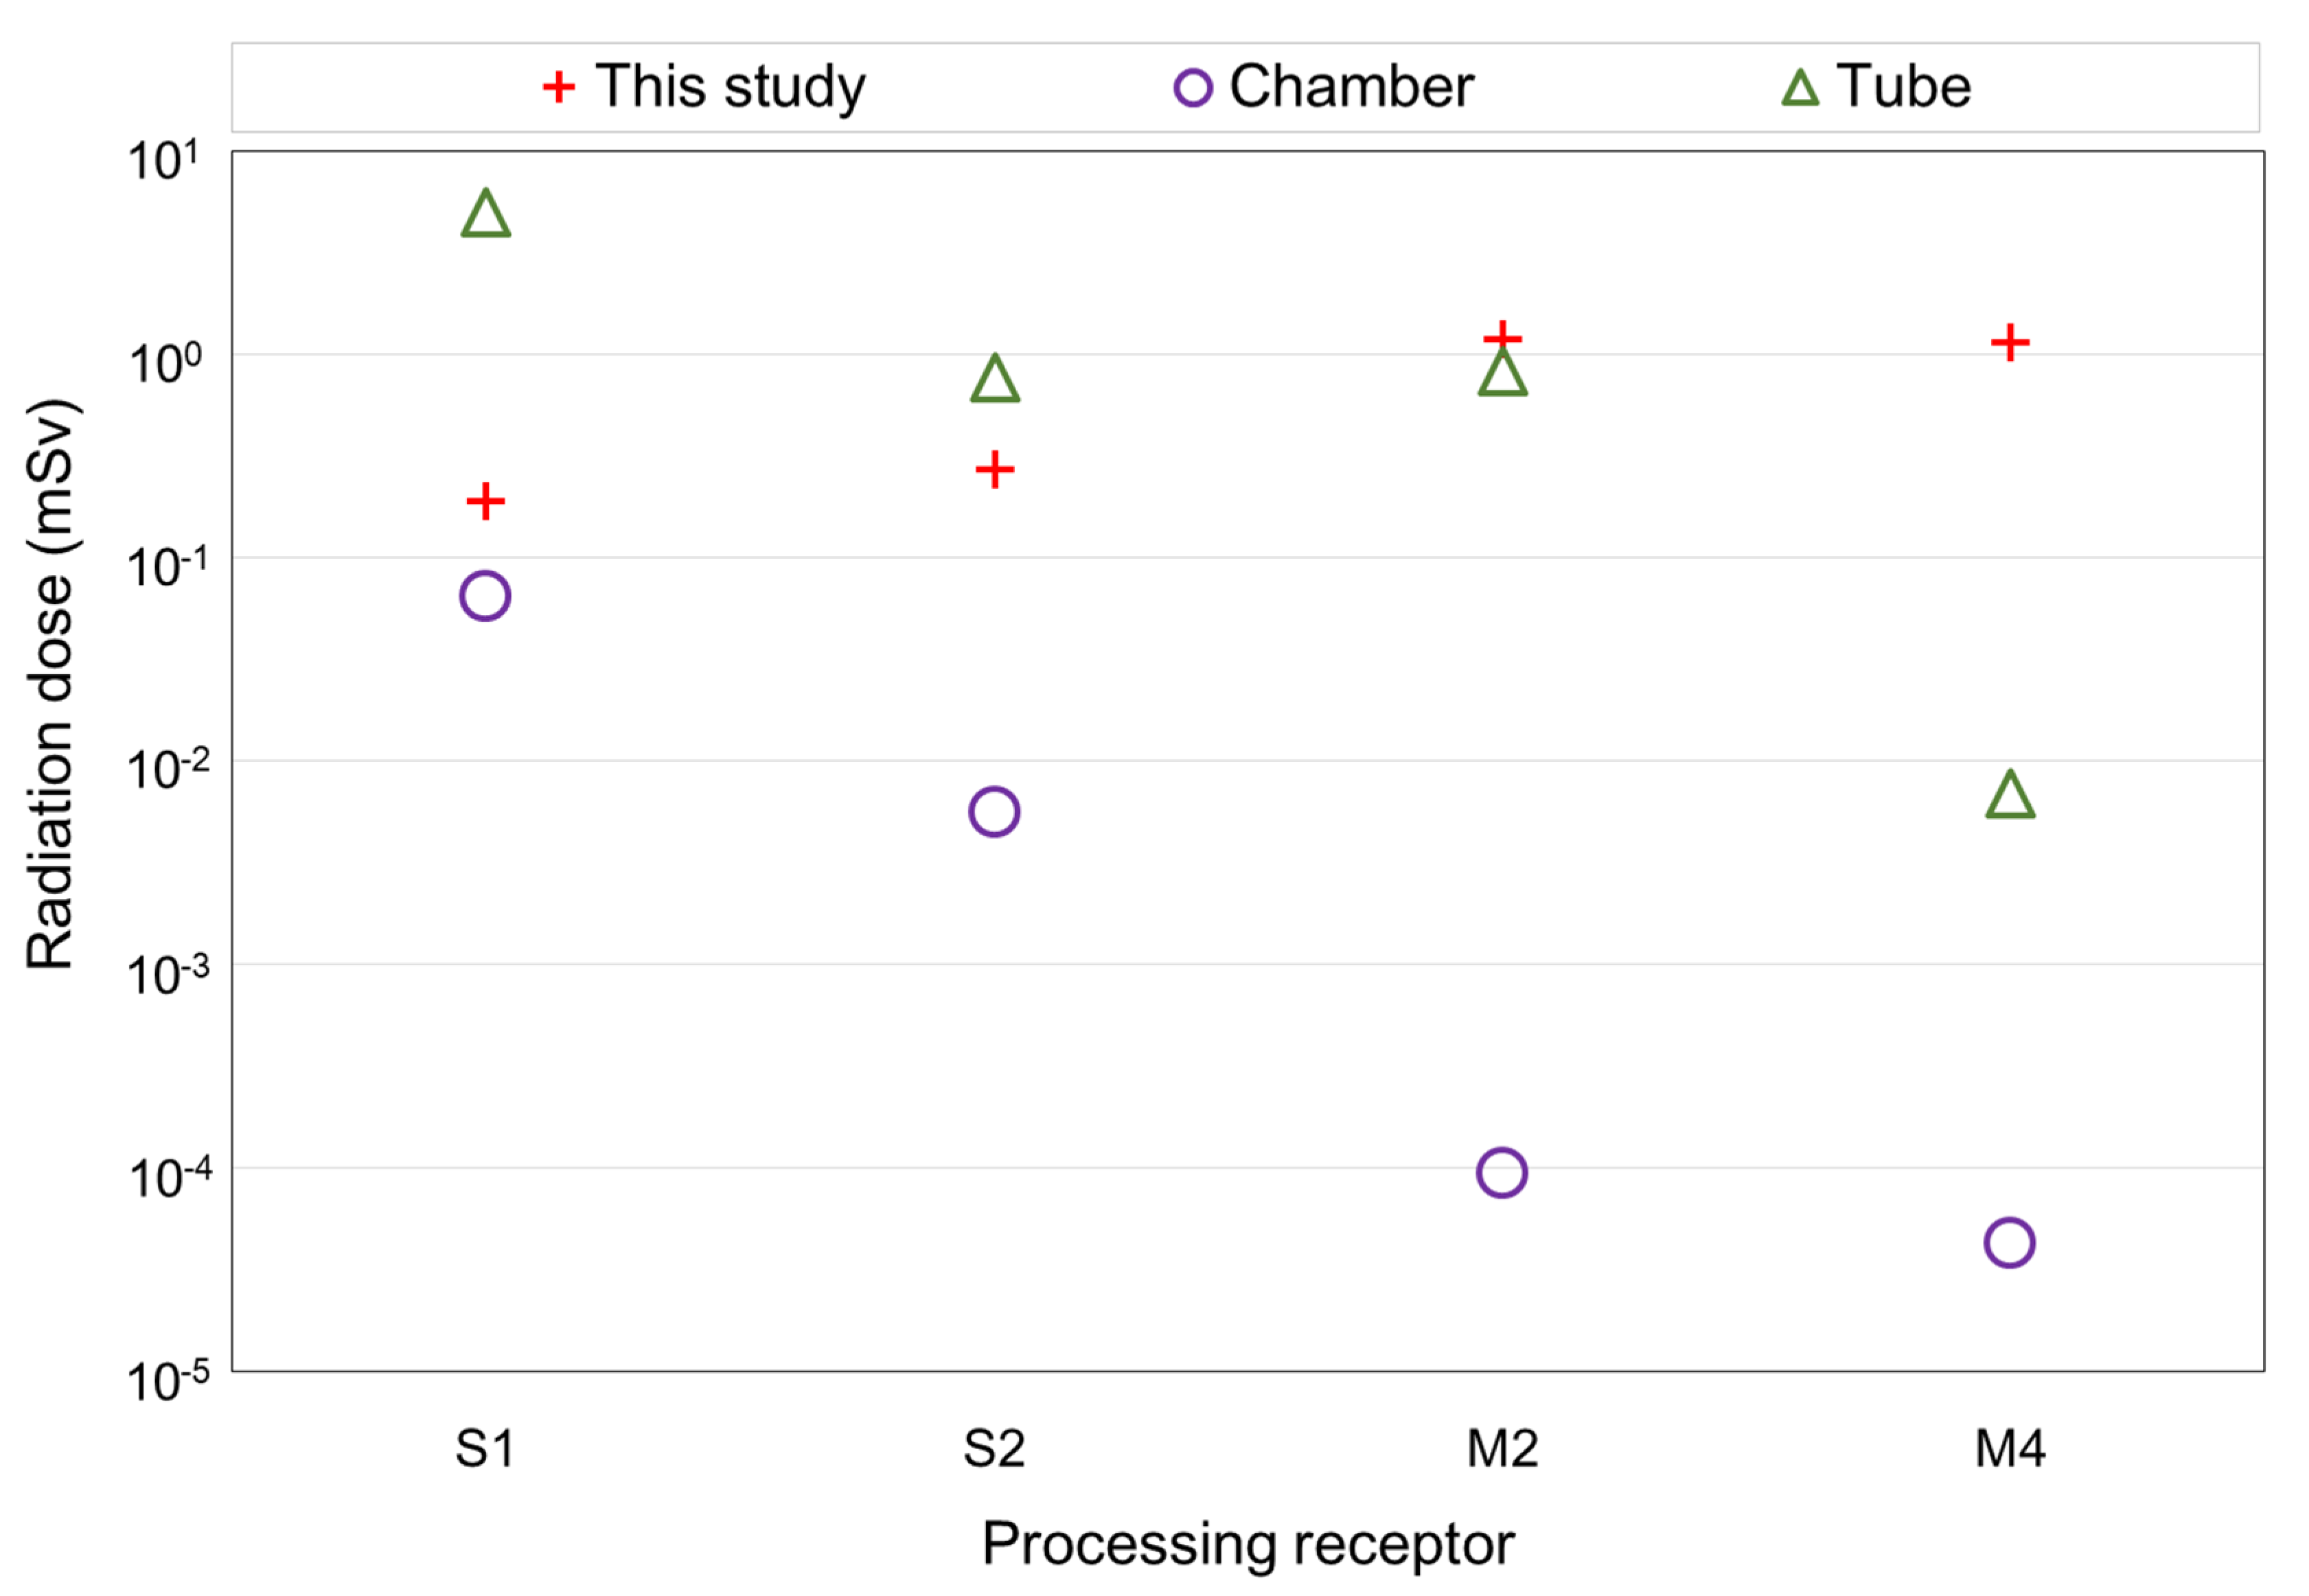
3.3.1. Comparative Studies for Processing of Steam Generators

Conditions and input parameters for comparison with the reference study on the onsite processing of an SG are shown in Table 8, where the conditions or parameter values are assumed to be the same as or equivalent to the reference as much as practicable [14]. Receptors S1, S2, M2, and M4 (see Table 2), which were common to both studies, were selected for comparison. The specific considerations assumed in the reference study, such as the separation of the tubes and chambers of the SG, the decontamination of segmented pieces, and the shielding of radioactive objects from workers, could not be fully reflected due to limitations in the known information or inherent differences in the basic models and scenarios between the two studies.
The radiation doses for the four designated receptors were calculated using Equation (12), the general PDFs in Figure 3, and the values of parameters in Table 8, and then compared with the respective results in the reference study as shown in Figure 7.
As shown in Figure 7, the radiation doses for the receptors S1 and S2 calculated in this study lie between those for the receptors involved in the processing of chambers and tubes given in the reference study, which is mainly attributed to the fact that more radioactivity is distributed to the tube sides (reported to be about 95% of total activity) rather than to the chambers (about 5%) in the SG, as reported in the actual experience report on the SG replacement [42]. Regarding receptors M2 and M4, on the other hand, the estimated radiation doses in this study are higher than those reported for the respective receptors in the reference study [14]. The reference study underestimates the radiation doses for M2 (furnace operator) and M4 (slag worker), which can be explained by the multiple factors considered in the reference study, such as decontamination prior to smelting, the shorter exposure duration for M4, lower mass partitioning into slag, additional shielding, and the 28-year-long radioactive decay (low-element partitioning of the relatively long lived 60Co into slag, as shown in Table 6) prior to processing.

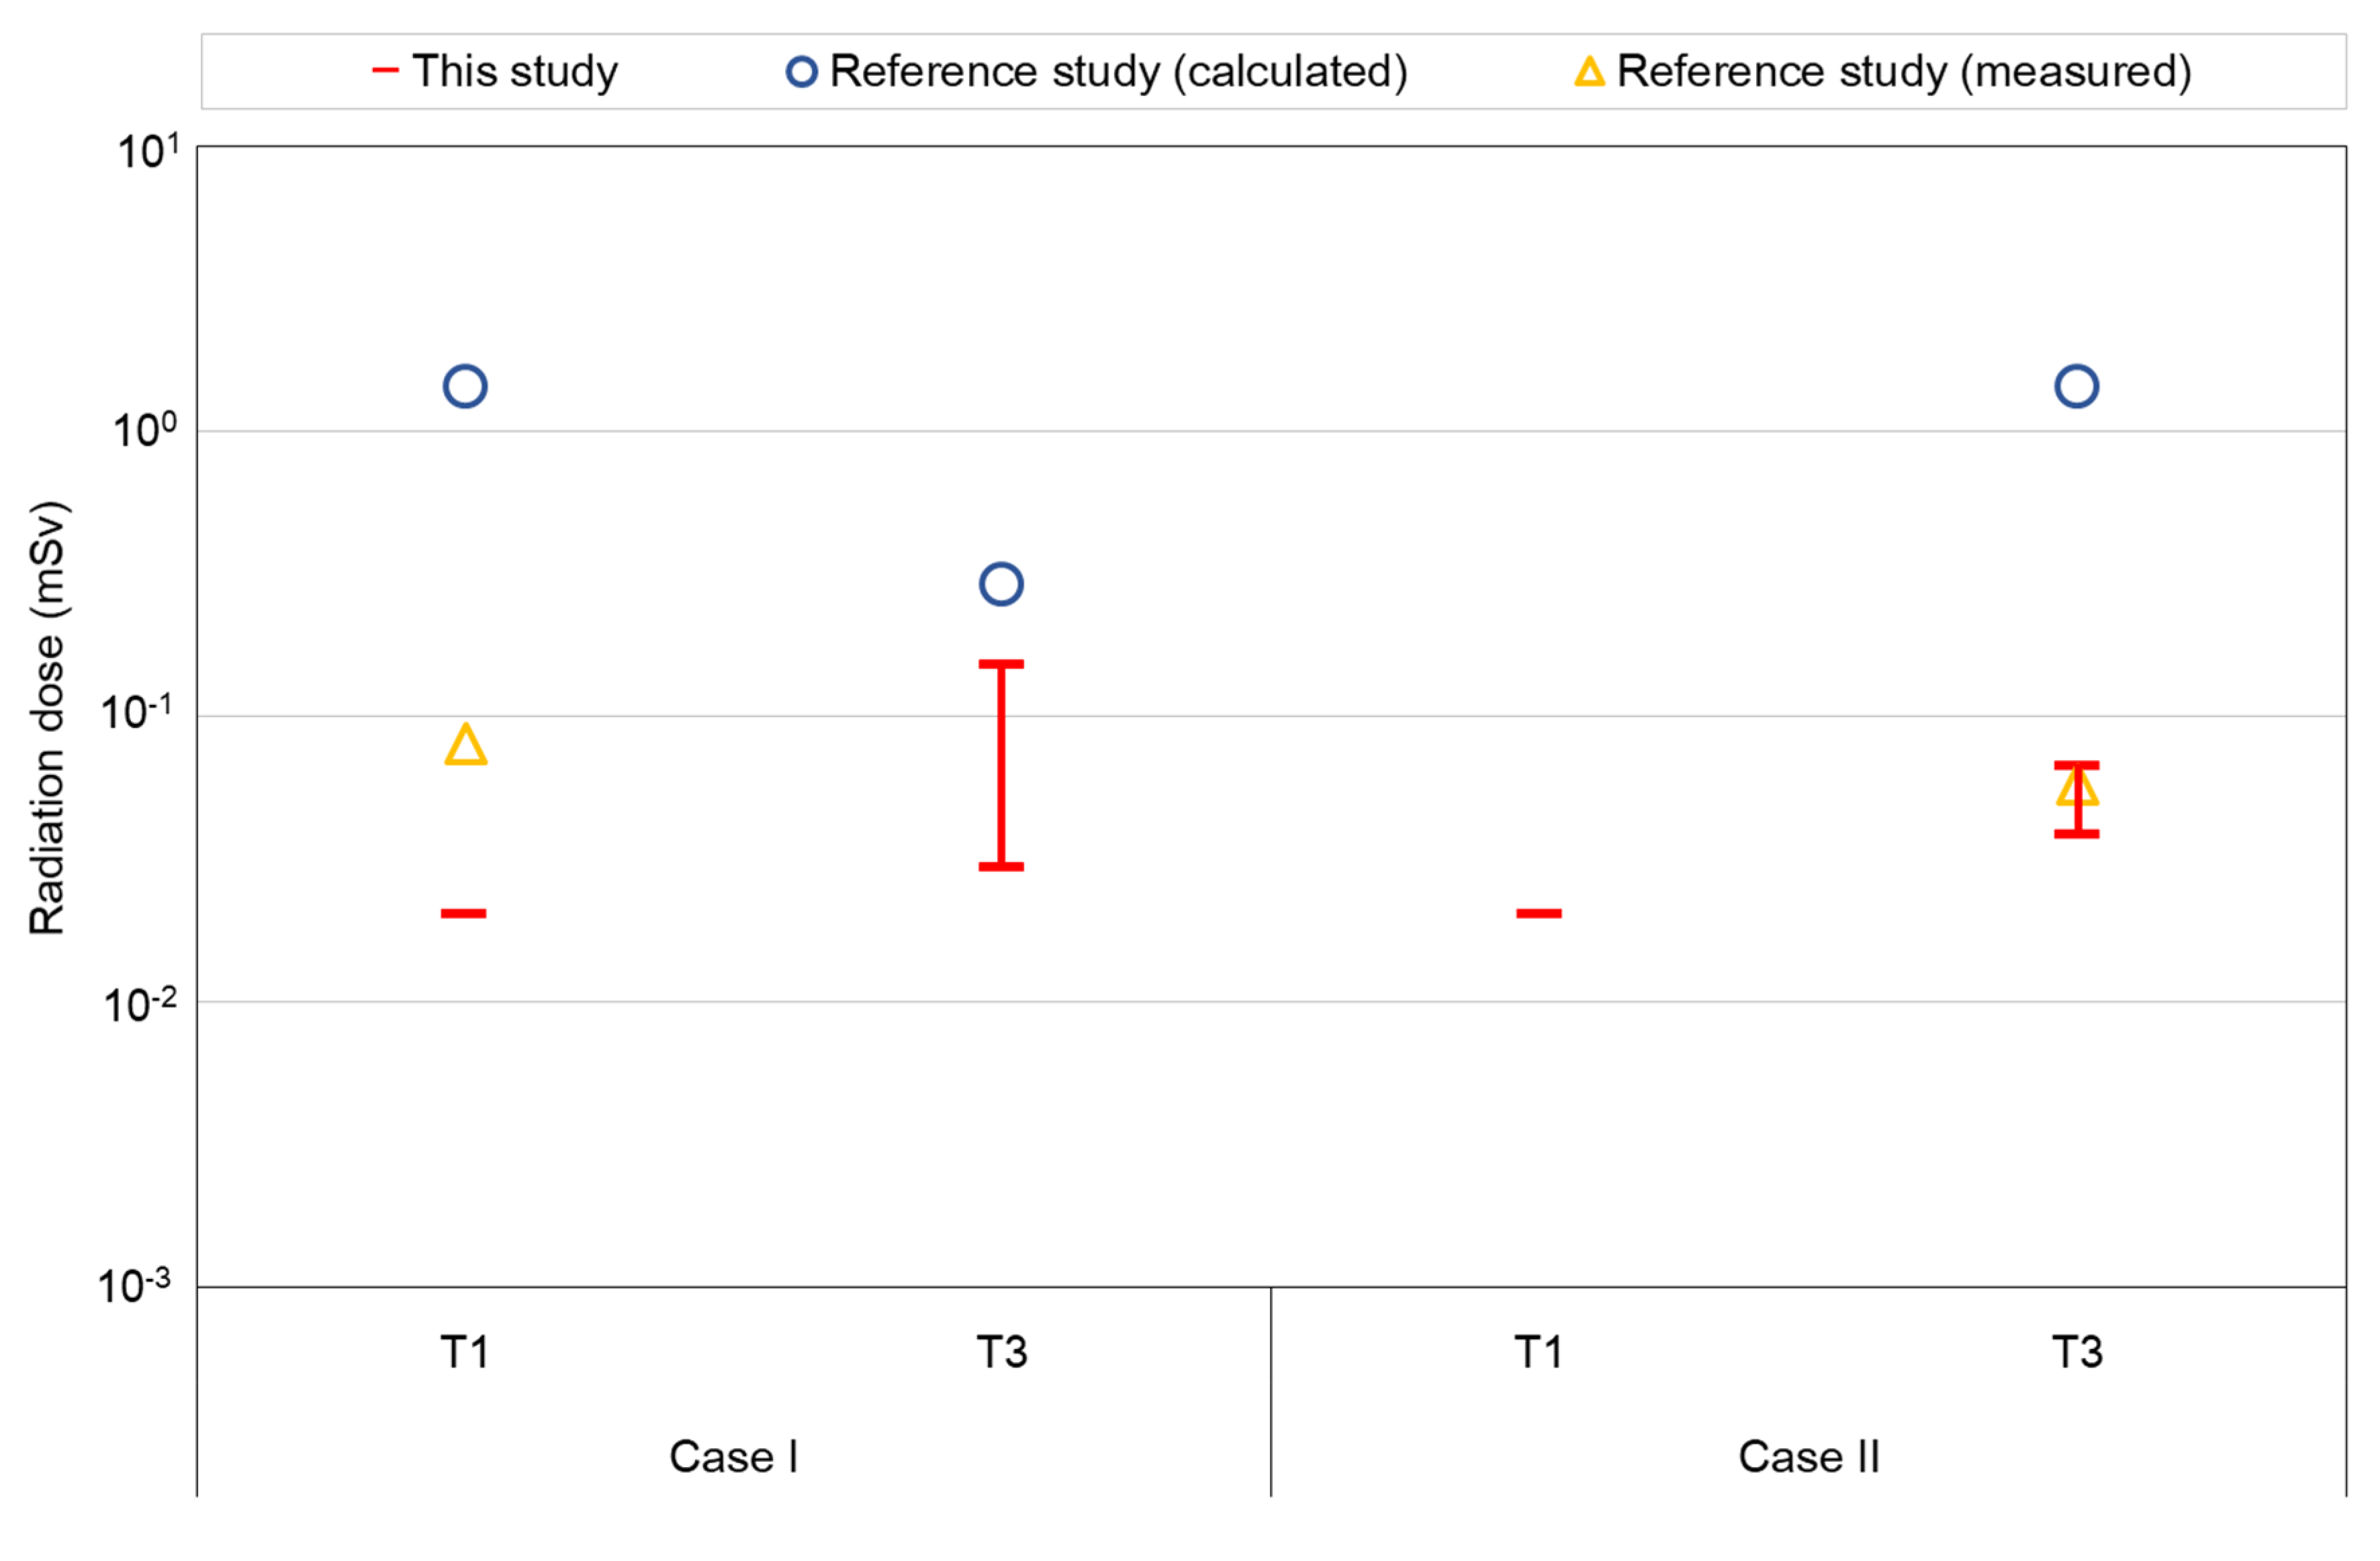
3.3.2. Comparative Studies for Transportation of Steam Generators

The conditions and values of the input parameters, for comparison with the reference study on the offsite transportation of SGs in one piece, are shown in Table 9 [13].
Due to the limited information presented in the reference study, a few conditions and parameters should be assumed based on regulatory limits or reasonable inference. The distance of onsite road transportation in each case, which is not given in the reference study, has been assumed to be about 1 km by measuring the length of the routes using a publicly available map [48,49]. Likewise, the distance from the Stade NPP to Studsvik through the overseas waterway (see Case II) was assumed to be 920 km [50]. Furthermore, the dose rates from the packages, which are not reported in the reference study, are assumed to be 0.1 mSv/h at 2 m from the surface of the package, in accordance with international transport regulations [51].
As stated in Section 3.2.4, the total doses of the representative transportation receptors T1 and T3 are calculated using Equation (13) and the assumed conditions in Table 9, and then compared with the results in the reference study (see Figure 8).
As shown in Figure 8, the calculated radiation doses for the designated receptors are quite comparable to those reported in the reference study, which implies that the assessment models developed in this study and the assumed conditions for comparison (see Table 9) are reasonable. The range of radiation doses for receptor T3 in Case I calculated in this study lies between those calculated and actually measured (i.e., below the detection limit) in the reference study. For Case II, the calculated dose for T3 is much closer to the measured value rather than the higher estimated value in the reference study [13]. This study underestimates the radiation dose for receptor T1 in Case I compared to the reference study (i.e., 1.4% to 25% of the reported values), but further analysis could not be conducted due to the limited information (e.g., actual radioactive source terms) in the reference case.

3.4. Application of Regulations to Transport of One-Piece Steam Generators

Segmented pieces of SG or byproducts (e.g., ingot, slag, baghouse dust filter) from the processing of SGs can be transported using designated standard packages (e.g., Type IP (industrial package), Type A package) under the full-scope transport regulations for radioactive materials [51]. Due to the bulk size and heavy weight of SGs, however, an SG in one piece without segmentation cannot be placed into any available standard packages and the transport regulations may not be fully applicable [4]. Special arrangement for the transportation of consignments which cannot satisfy all applicable requirements has been already adopted in the IAEA Transport Regulations; however, the IAEA provides much more specific guidance on the transport of “large components” under special arrangements, as shown in Table 10 [51,52].
In order to evaluate if the SGs from the PWRs and PHWRs assumed in this study (see Section 3.2) can meet all the criteria for the approval of transportation under special arrangements, the quantitative criteria were assessed for each SG, while a set of qualitative criteria which should be confirmed case by case are assumed to be satisfied in this study. In accordance with qualitative criterion (a), firstly, the sum of the fraction for activity contents in each SG (see Table 3) is calculated using the following equation:
S u m   o f   f r a c t i o n = i N A i A 2 , i
where A i is the activity of each radionuclide i in SG (TBq) and A 2 , i is the A2 value defined in Table 2 of the IAEA Specific Safety Requirements No. SSR-6 (TBq) [51].
The sum of fractions is calculated to be 5.6 ( 10) and 37.3 ( > 10 but 100) for the PWR SG and the PHWR SG, respectively, which can be interpreted to mean that the PWR SG assumed in this study meets qualitative criterion (a) for all the transport measures but the PHWR SG is not appropriate for inland waterway transport under special arrangement.
Using the MicroShield® computer code and specifications of the SGs (see Section 3.1.2), the dose rates 3 m from the PWR SG and the PHWR SG were calculated to be lower than the limiting value of 10 mSv/h, at 0.46 and 0.12 mSv/h, respectively. Accordingly, the qualitative criterion (b) is demonstrated to be satisfied for both SGs. At the same time, the maximum radiation levels on the outside shell of the PWR SG and the PHWR SG are 1.38 and 0.50 mSv/h, respectively, which are both lower than the 2 mSv/h specified as a limiting value for the qualitative criterion (c).
With regard to the qualitative criterion (d), finally, the potential intake of radionuclide i by a person Q I N T , i (TBq) can be simply calculated by Equation (16):
Q I N T , i = Q I V , i · F R E L · F R S U S · F I N T
where Q I V , i is the inventory in the package (TBq) of radionuclide i, F R E L is the releasable fraction of the activity which is to be released from the package in an accident, F R S U S is the fraction of the released activity which is in respirable aerosol, and F I N T is the fraction of the respirable released activity to be inhaled by a person in the vicinity of the accident [52]. By simply adopting the reference values for F R E L (0.1), F R S U S (0.01), and F I N T (10−4) suggested by the IAEA and assuming the radioactivity in Table 6 for Q I V , i , the sum of fraction for Q I N T , i is calculated by the following equation:
S u m   o f   f r a c t i o n = i N Q I N T , i A 2 , i
where the calculated values of the sums of fractions are 0.56 × 10⁻⁶ for the PWR SG and 3.73 × 10⁻⁶ for the PHWR SG, respectively, which can be interpreted to mean that the PWR SG assumed in this study meets the qualitative criterion (d), but the PHWR SG is not appropriate for transport under special arrangement. Through more specific assessments for F R E L ,   F R S U S , and   F I N T , however, even higher levels of the total activity content could be justified [52].
Qualitative criterion (e) is subject to a specific SG’s non-fixed contamination levels; therefore, the criteria cannot be evaluated for the two SGs assumed in this study. Therefore, it is assumed that both SGs are demonstrated to meet the qualitative criterion (e) and to be defined as surface contaminated objects (SCOs) with the provided information regarding the surface contamination. Under this assumption, the SGs should meet Type IP package requirements for transportation under special arrangement and furthermore, the SGs should be categorized into SCO-I and SCO-II subject to Type IP-1 and IP-2 package requirements, respectively [51].
Based upon the set of assumptions made and the evaluation conducted in this study, the PWR SG meets the criteria for transportation under special arrangement through all the transport modes, while the PHWR SG is not to be applicable for inland waterway transportation under special arrangement. The practical applicability of the special arrangement transportation of SGs is also shown in Table 11, which introduces a few respective cases reported in the open literature [13,38,53,54,55].

4. Conclusions

Twelve comprehensive scenarios including every stage in the predisposal management of a representative large component from NPPs (i.e., SG) were modeled based upon processing methods, places of processing, and transportation means, and an integrated framework was established to assess the radiological risk for 15 receptors involved in the processing and transport of SG in each scenario. Assuming a unit activity concentration of each radionuclide reported to be present in SGs, a set of normalized general PDFs were derived for 26 radionuclides.
It was found that the normalized potential radiation dose is greatly affected by the selective partitioning of mass and element in the smelting of metal component SGs. The general PDF value for slag workers is higher than for the other receptors for most radionuclides except 129I, due to multiple factors such as the relatively long exposure time and selective partitioning of all actinides into slag. In addition, the representative high-energy gamma emitter 60Co selectively partitioned into ingot is the most dominant radionuclide for the receptors involved in the processing and handling of scrap or ingots. With regard to transportation operations, it is shown that the general PDFs for road transport are much higher (766 to 1952 times) than for waterway transport, and those for the transport of processed objects from SG are two to six times higher than the transport SG in one piece.
Assuming two types of SGs are generated from PWRs and PHWRs at two nuclear sites, processed and ultimately disposed of in Korea, a set of specific assessments was conducted by using the derived general PDFs for directly processing and separately derived equations for transport, according to the methodology established in this study and additional specific data such as the actually measured source terms. The estimated radiation doses for the processing workers were affected by the weight and radioactive source terms of the SG rather than its origin. The higher radiation dose calculated for the workers processing SGs from PWRs than those from PHWRs can be attributed to the heavier weight and differences in the characterized radioactive source terms. Under the conditions assumed in this study, the maximum annual individual doses for the receptors involved in the predisposal management of SGs lies between 13.7 mSv (for a PWR SG) and 1.14 mSv (for a PHWR SG) for each generated and processed SG. It is worth noting that the highest calculated individual dose was about 27.4% of the effective dose limit for the radiation workers (50 mSv/year), whereas the calculated dose for the workers involved in long-distance transportation was about 68.5% of the 5 year average effective dose limit for a radiation worker (20 mSv/year), which suggests additional shielding for rotating transport workers should be considered.
Compared with reference cases (i.e., actual experience in the transportation of SGs and studies on the processing of SGs from PWRs), the estimated maximum radiation doses calculated in this study are comparable to those in the reference cases, from 1.44% to 165% for processing and from 1.4% to 25% for the transportation of the doses measured or estimated in the reference cases.
Finally, the feasibility of the special arrangement transport for SGs in one piece that do not meet international transportation regulations has been partly demonstrated in terms of both qualitative and quantitative manners. It was shown that the PWR SG may satisfy all the quantitative criteria for special arrangement transportation, while the assumed PHWR SG is unsuitable for inland waterway transport and are even not applicable for special arrangement itself unless a further detailed evaluation of the accidental intake of radionuclides is conducted.
The normalized general PDFs derived in this study can be used for the preliminary estimation of radiological risk in each stage of the predisposal management of SGs. Furthermore, the comprehensive safety assessment framework, together with the developed scenarios, can be used for a more detailed assessment with site-specific data and conditions. It is expected that the radiological risk assessment framework, together with the general PDFs developed in this study, may contribute to finding an optimal management option for large components to be generated from the decommissioning of NPPs, taking into account multiple attributes including both radiological and non-radiological factors.

Author Contributions

Writing—original draft preparation, G.H.C.; writing—review and editing, J.H.C.; methodology, J.-h.P. All authors have read and agreed to the published version of the manuscript.

Funding

This work was supported by the Korea Institute of Energy Technology Evaluation and Planning (KETEP) and the Ministry of the Trade, Industry & Energy (MOTIE) of the Republic of Korea (No.20191510301290). This work was supported by the Nuclear Safety Research Program through the Korea Foundation of Nuclear Safety (KoFONS), granted financial from the Nuclear Safety and Security Commission (NSSC), Republic of Korea (No.2003017).

Conflicts of Interest

The authors declare no conflict of interest.

References

  1. Nuclear Energy Agency (NEA). The Economics of Long-term Operation of Nuclear Power Plants; NEA No.7054; NEA: Paris, France, 2012. [Google Scholar]
  2. International Atomic Energy Agency (IAEA). Heavy Component Replacement in Nuclear Power Plants: Experience and Guidelines; Nuclear Energy Series No.NP-T-3.2; IAEA: Vienna, Austria, 2008. [Google Scholar]
  3. International Atomic Energy Agency (IAEA). Power Reactor Information System (PRIS). Available online: https://pris.iaea.org/PRIS/WorldStatistics/OperationalByAge.aspx (accessed on 17 April 2020).
  4. Nuclear Energy Agency (NEA). The Management of Large Components from Decommissioning to Storage and Disposal; NEA/RWM/R(2012)8; NEA: Paris, France, 2012. [Google Scholar]
  5. International Atomic Energy Agency (IAEA). Decommissioning of Facilities; Safety Standards Series No. GSR Part 6; IAEA: Vienna, Austria, 2014. [Google Scholar]
  6. International Atomic Energy Agency (IAEA). Predisposal of Management of Radioactive Waste; Safety Standards Series No. GSR Part 5; IAEA: Vienna, Austria, 2009. [Google Scholar]
  7. Korea Hydro & Nuclear Power Co., Ltd. Replacement of Large Components for Operation Nuclear Power Plants. Available online: https://npp.khnp.co.kr/index.khnp?menuCd=DOM_000000105002002000 (accessed on 15 June 2020).
  8. Nuclear Regulatory Agency (NRA). Radiation Management Report on Nuclear Facilities in 2017; NRA: Tokyo, Japan, 2018. [Google Scholar]
  9. Maheras, S.J.; Best, R.E.; Ross, S.B.; Buxton, K.A.; England, J.L.; McConnell, P.E.; Massaro, L.M.; Jensen, P.J. Preliminary Evaluation of Removing Used Nuclear Fuel from Shutdown Sites; PNNL-22676 Rev. 10; PNNL: Richland, WA, USA, 2017. [Google Scholar]
  10. McGrath, R.; Reid, R. Waste Management for Decommissioning of Nuclear Power Plants: An EPRI Decommissioning Program Report. In Proceedings of the Symposium on Recycling Metals Arising from Operation and Decommissioning of Nuclear Facilities, Nyköping, Sweden, 8–10 April 2014; EPRI: California, CA, USA, 2014. [Google Scholar]
  11. Westinghouse Electric Company. PWR Reactor Vessel and Reactor Internals Segmentation and Packaging; DDR-0004; Westinghouse: New York city, NY, USA, 2018. [Google Scholar]
  12. Ken, S. Safe and Secure Transport and Storage of Radioactive Materials, 1st ed.; Woodhead Publishing: Cambridge, UK, 2015; p. 277. [Google Scholar]
  13. Nitsche, F.O.; Fasten, C. Transport of large components in Germany-some experiences and regulatory aspects. RAMTRANS 2010, 22, 54–58. [Google Scholar] [CrossRef]
  14. Son, Y.J.; Park, S.J.; Byon, J.; Ahn, S. The assessment and Reduction Plan of Radiation Exposure during Decommissioning of the Steam Generator in Kori Unit 1. JNFCWT 2018, 16, 377–387. [Google Scholar] [CrossRef]
  15. Hornáček, M.; Nečas, V. The analysis of management of radioactive waste arisen from steam generator’s dismantling from radiological and economical point of view. Prog. Nucl. Energy 2017, 100, 406–418. [Google Scholar] [CrossRef]
  16. Riznic, J. Steam Generators for Nuclear Power Plants; Woodhead: Duxford, UK, 2017; p. 53. [Google Scholar]
  17. Park, J.H.; Cheong, J.H. Potential Management Options of Radioactive Large Metallic Components from NPPs in Operation and Decommissioning. In Proceedings of the Korean Radioactive Waste Society Spring 2018, Busan, Korea, 30 May–1 June 2018. [Google Scholar]
  18. International Atomic Energy Agency (IAEA). Application of Exemption Principles to the Recycle and Reuse of Materials from Nuclear Facilities; Safety Series No.111-p-1.1; IAEA: Vienna, Austria, 1992. [Google Scholar]
  19. Cheng, J.J.; Kassas, B.; Yu, C.; Lepoire, D.; Arnish, J.; Dovel, E.S.; Chen, S.Y.; Williams, W.A.; Wallo, A.; Peterson, H. RESRAD-RECYCLE: A Computer Model For Analyzing the Radiological Doses and Risks Resulting from the Recycling of Radioactive Scrap Metal and the Reuse of Surface-Contaminated Material and Equipment; ANL/EAD-3; Argonne National Laboratory: Illinois, IL, USA, 2000.
  20. United States Nuclear Regulatory Commission (US NRC). Radiological Assessment for Clearance of Materials from Nuclear Facilities; NUREG-1640; US NRC: Washington, DC, USA, 2003.
  21. Cheng, J.J.; Yu, C.; Williams, W.A.; Murphie, W. Validation of the RESRAD-RECYCLE computer code. In Proceedings of the WM’02 Conference, Tucson, AZ, USA, 24–28 February 2002. [Google Scholar]
  22. Song, J.S.; Kim, D.M.; Lee, S.H. A Study on the Application of Standards for Clearance of Metal Waste Generated During the Decommissioning of NPP by Using the RESRAD-RECYCLE. JNFCWT 2016, 14, 305–320. [Google Scholar] [CrossRef]
  23. Weiner, R.F.; Hinojosa, D.; Heames, T.J.; Farnum, C.O.; Kalinina, E.A. RADTRAN 6/RadCat 6 User Guide; SAND2013-8095; Sandia National Laboratories: Albuquerque, NM, USA, 2013. [Google Scholar]
  24. Obsborn, D.M.; Weiner, R.F.; Mills, G.S.; Hamp, S.C. Verification and Validation of RADTRAN 5.5; SAND2005-12741274; Sandia National Laboratories: Albuquerque, NM, USA, 2005. [Google Scholar]
  25. Yoon, J.; Kim, W.; Park, K.T.; Kang, W.M.; Kang, B.S. Development of Temporary Lifting Device for Steam Generator in Containment Vessel at Nuclear Power Plant, Transaction of the Korean Society of Mechanical Engineers. 2020. Available online: https://doi.org/10.3795/KSME-A.2020.44.4.291 (accessed on 23 June 2020).
  26. Korea Institute of Nuclear Safety (KINS). Technical Review Report on Hanul Nuclear Power Plant Units 3 and 4 Operation Change Permit (Steam Generator Replacement); 12-060, U-AM-57(12); KINS: Daejeon, Korea, 2013. [Google Scholar]
  27. Ontario Power Generation (OPG), Inc. Reference Low and Intermediate Level Waste Inventory for the Deep Geological Repository; 00216-REP-03902-00003-R003; OPG, Inc.: Ontario, ON, Canada, 2010. [Google Scholar]
  28. U.S. Environmental Protection Agency (EPA). Limiting Values of Radionuclide Intake and Air Concentration and Dose Conversion Factors for Inhalation, Submersion, and Ingestion; Federal Guidance Report No. 11; U.S. EPA: Washington, DC, USA, 1988.
  29. International Commission on Radiological Protection (ICRP). ICRP Publication 119: Compendium of Dose Coefficients Based on ICRP Publication 60; Annals of the ICRP; ICRP: Stockholm, Sweden, 2013; Volume 42, pp. 1–130. [Google Scholar]
  30. International Commission on Radiological Protection (ICRP). ICRP Publication 60: 1990 Recommendations of the International Commission on Radiological Protection; Ann. ICRP 21 (1-3); ICRP: Stockholm, Sweden, 1991. [Google Scholar]
  31. U.S. Environmental Protection Agency (EPA). Potential Recycling of Scrap Metal from Nuclear Facilities, Part I: Radiological Assessment of Exposed Individuals Volume 1; U.S. EPA: Washington, DC, USA, 2001.
  32. Alexander, W.R.; McKinley, L.E. Deep Geological Disposal of Radioactive Waste; Elsevier Radioactivity in the Environment Volume 9; Elsevier: Amsterdam, The Netherlands, 2011; p. 30. [Google Scholar]
  33. Weiner, R.F.; Neuhauser, K.S.; Heames, T.J.; O’Donell, B.M.; Dennis, M.L. RADTRAN 6 Technical Manual; SAND2014-0780; Sandia National Laboratories: Albuquerque, NM, USA, 2014.
  34. United States Nuclear Regulatory Commission (US NRC). Calculation of Annual Doses to Man from Routine Releases of Reactor Effluents for the Purpose of Evaluating Compliance with 10 CFR 50, Appendix I; Regulatory Guide 1.109, Revision 1; US NRC: Washington, DC, USA, 1977.
  35. United States Nuclear Regulatory Commission (US NRC). Standards for Protection against Radiation; Code of Federal Regulations Title 10, Part 20, Appendix B—Annual Limits on Intake (ALIs) and Derived Air Concentrations (DACs) of Radionuclides for Occupational Exposure; Effluent Concentrations; Concentrations for Release to Sewerage; US NRC: Washington, DC, USA, 2015.
  36. Grove Software, Inc. MicroShield® User’s Manual; Grove Software Inc.: Lynchburg, USA, 2011. [Google Scholar]
  37. Michael, F.L. Handbook of Radioactivity Analysis (Third Edition); Academic Press: Oxford, UK, 2012; pp. 1051–1052. [Google Scholar]
  38. Canadian Nuclear Safety Commission (CNSC). Special Form Certificates; CDN/5255/X-96 (Rev. 0); CNSC: Ottawa, ON, Canada, 2010.
  39. Seo, M.H.; Hong, S.W.; Park, J.B. Radiological Impact Assessment for the Domestic On-road Transportation of Radioactive Isotopes Wastes. JNFCWT 2016, 14, 279–287. [Google Scholar] [CrossRef]
  40. Swedish Nuclear Fuel and Waste Management (SKB). Available online: https://web.archive.org/web/20120506092817/http://www.skb.se/Templates/Standard____15149.aspx (accessed on 11 May 2020).
  41. Walberg, M.; Viermann, J.; Beverungen, M.; Kemp, L.; Lindström, A. Disposal of Steam Generators from Decommissioning of PWR Nuclear Power Plants. In Proceedings of the International Youth Nuclear Congress, Interlaken, Switzerland, 20–26 September 2008. [Google Scholar]
  42. Korea Electric Power Corporation (KEPCO). Kori Unit 1 Steam Generator Replacing Experience Report; ‘99-0328- DAN-38; KEPCO: Naju, Korea, 1999. [Google Scholar]
  43. Bruce Power. Bruce A Refurbishment for Life Extension and Continued Operation Project; Bruce Power: Ontario, ON, Canada, 2004. [Google Scholar]
  44. Shin, S.W.; Son, J.K.; Cho, C.H.; Song, M.J. Analysis of Dose Rates from Steam Generators to be Replaced from Kori Unit 1. JRPR 1998, 23, 175–184. [Google Scholar]
  45. SEARATES. Available online: https://www.searates.com/services/distances-time/ (accessed on 11 May 2020).
  46. Google Map. Available online: https://goo.gl/maps/jMEeWeMBeKjYwR6i8 (accessed on 13 May 2020).
  47. Kim, J.K.; Jin, H.H.; Lee, Y.C. A Legal Study on the Transportation of the Radioactive Waste by Sea under Act on the Arrival, Departure, etc. of Ships. Marit. Law Rev. 2017, 29, 201–228. [Google Scholar]
  48. Google Map. Available online: https://goo.gl/maps/KYBDENWaqc3W8asn7 (accessed on 13 May 2020).
  49. Google Map. Available online: https://goo.gl/maps/XnLYcbSJ1ZJFTeWj6 (accessed on 13 May 2020).
  50. Google Map. Available online: https://goo.gl/maps/ah4FA1nWxu7j2vTTA (accessed on 11 May 2020).
  51. International Atomic Energy Agency (IAEA). Regulations for the Safe Transport of Radioactive Materials; Safety Standards Series No. SSR-6 (Rev.1); IAEA: Vienna, Austria, 2018. [Google Scholar]
  52. International Atomic Energy Agency (IAEA). Advisory Material for the IAEA Regulations for the Safe Transport of Radioactive Material (2012 Edition); Safety Standards Series No. SSG-26; IAEA: Vienna, Austria, 2014. [Google Scholar]
  53. United States Nuclear Regulatory Commission (US NRC). Interim Guidance on Transportation of Steam Generators (Generic Letter 96-07); US NRC: Washington, DC, USA, 1996.
  54. James, L.W.; Rick, W.B. Large Component Regulatory Relief in the United States. In Proceedings of the 14th International Symposium on the Packaging and Transportation of Radioactive Materials (PATRAM (2004)), Berlin, Germany, 20–24 September 2004. [Google Scholar]
  55. Shirai, K.; Ozaki, S. Evaluation of transport experience for large-scale radioactive wastes produced from decommissioning of nuclear plant and re-use of metallic radioactive wastes to the transport container. Denryoku Chuo Kenkyusho Hokoku 2003, 12, 1–4. [Google Scholar]
Figure 1. Schematic view of the generalized potential scenarios and the respective locations for the predisposal management of steam generators from nuclear power plants.
Sustainability 12 05149 g001
Figure 2. General pathway dose factor for each actinide and for each receptor in the processing of a steam generator as calculated in this study.
Sustainability 12 05149 g002
Figure 3. General pathway dose factor calculated in this study for each non-actinide and for each receptor in the processing of a steam generator.
Sustainability 12 05149 g003
Figure 4. General pathway dose factor for each radionuclide and for each receptor, from T1 to T3 (read left Y axis) and H (read right Y axis), involved in the transportation of the steam generator as calculated in this study.
Sustainability 12 05149 g004
Figure 5. Radiation dose of receptors S1 to M7 involved in the processing of the PWR or PHWR steam generator calculated in the specific assessments.
Sustainability 12 05149 g005
Figure 6. Calculated radiation dose of the receptors T1–T3 and H involved in the transportation of the steam generators from two NPP sites.
Sustainability 12 05149 g006
Figure 7. Comparison of the radiation doses for the receptors S1, S2, M2, and M4 calculated in this study and presented in the comparable reference study [14]. Plots for the “Camber” and “Tube” represent the estimated radiation doses for the workers processing the chambers and tubes of the steam generator, respectively, in the reference study.
Sustainability 12 05149 g007
Figure 8. The comparison of the radiation doses for receptors T1 and T3 calculated in this study and presented in the comparable reference study for Cases 1 and 2 [13]. Plots for the “Reference study (calculated)” and “Reference study (measured)” represent the radiation doses for the transport workers as calculated and actually measured, respectively, in the reference study [13]. The plot for T3 in Case I is not shown since the measured radiation dose is reported to be below the detection level. The reference study does not provide the value for T1 in Case II, and therefore, it is not plotted in Figure 8.
Sustainability 12 05149 g008
Table 1. Generalized potential scenarios for the management of large metal components from nuclear power plants (NPPs) categorized by the measures for their processing and transportation at each stage and the considered receptors.
Scenario No.Stage of Predisposal Management
Nuclear Power Plant Site On/Offsite Processing Plant Repository
#1#2#3#4#5#6#7#8#9#10#11
1---H4-----T110H11
2H1Sj-H4-----T210H11
3H1SjMkH4-----T210H11
4H1Sj-H4T25H6-MkH9T210H11
5---H4T15H6Sj-H9T210H11
6---H4T15H6SjMkH9T210H11
7---H4-----T310H11
8H1Sj-H4-----T310H11
9H1SjMkH4-----T310H11
10H1Sj-H4T35H6-MkH9T310H11
11---H4T35H6Sj-H9T310H11
12---H4T35H6SjMkH9T310H11
Table 2. Element partitioning factor of each radionuclide in dismantled steam generators [19].
NuclideElement Partitioning Factor (%)NuclideElement Partitioning Factor (%)
IngotSlagDustIngotSlagDust
3H 11000125Sb80200
14C 163.500129I 102525
54Mn49501137Cs0397
55Fe9721144Ce0991
57Co9901154Eu0991
60Co9901237Np0991
59Ni9901238Pu0991
63Ni9901239Pu0991
65Zn1099240Pu0991
90Sr0991242Pu0991
94Nb9901241Am0991
99Tc9901243Am0991
106Ru9901244Cm0991
1 Note: element-partitioning factors are as given in Table 2 and balanced average atmospheric release fractions of volatile elements 3H, 14C, and 129I (i.e., 90%, 36.5%, and 50%, respectively) are taken from NUREG-1640 [20].
Table 3. Estimated concentration of the volatile radionuclides at the boundary of the processing facility, the ratio with regard to the applicable effluent concentration limits for airborne radionuclides, assuming the unit activity concentration of each radionuclide in the steam generator, and activity concentration equivalent to the unit ratio.
Radionuclide C B , i  
( B q / m 3   p e r   ( B q / g ) t o n )
E C L A , i   ( B q / m 3 ) Ratio   of   C B , i   E C L A , i   Activity   Concentration   Equivalent   to   C B , i   E C L A , i   = 1 ( B q / g )
3H1.31 × 10−103.70 × 1033.55 × 10−142.81 × 10¹³
14C5.33 × 10−91.11 × 1024.80 × 10−112.08 × 10¹⁰
129I7.30 × 10−91.48 × 1004.93 × 10−92.03 × 10⁸
Table 4. The dose rate 1 m from packages per unit of radioactivity concentration.
RadionuclideDose Rate (mSv/h per Bq/g)
One PieceSegmentedSmelted
54Mn1.34 × 10−48.96 × 10−54.88 × 10−5
57Co1.18 × 10−52.78 × 10−63.06 × 10−6
60Co4.04 × 10−42.75 × 10−43.02 × 10−4
65Zn9.38 × 10−56.35 × 10−57.06 × 10−7
94Nb2.53 × 10−41.68 × 10−41.84 × 10−4
106Ru3.33 × 10−52.10 × 10−52.31 × 10−5
125Sb6.66 × 10−54.00 × 10−53.56 × 10−5
137Cs9.06 × 10−55.84 × 10−50
144Ce6.54 × 10−63.70 × 10−60
154Eu2.07 × 10−41.37 × 10−70
237Np1.42 × 10−63.27 × 10−70
Table 5. Assumed conditions and input parameter values to derive general pathway dose factors using RADTRAN 6 code.
Transport MeansProcessing MethodsSpeed (km/h) [38,39,40]Vehicle Weight ,   W   ( ton / y ) Throughput ,   T P   ( ton / h ) N t r a n s   ( y 1 )
RoadOne piece20Trailer5401001
Segmented60Truck2010027
Smelted60Truck2010024.3
Waterway [41]One piece22Ship [42]5401001
Segmented22Ship5401001
Smelted22Ship4861001
NOTE: The assumed distance from the receptor to the object transported is 4 m for T1, T2 and T3. In addition, it is assumed that the receptor H handles the object 10 m away with a crane. The total weight of the smelted objects transported is 486 ton which is partitioned to ingot mass.
Table 6. Radioactive source terms of the assumed dismantled steam generators for a pressurized water reactor (PWR) and a pressurized heavy water reactor (PHWR).
PWR Steam Generator from Kori Unit 1 [44]PHWR Steam Generator from Bruce A Unit 1 [38]
RadionuclideHalf-Life (year)Total Activity (MBq)RadionuclideHalf-Life (year)Total Activity (MBq)
51Cr7.59 × 10−21.71 × 1053H1.20 × 1012.15 × 104
54Mn8.57 × 10−13.50 × 10414C5.70 × 1031.50 × 103
59Fe1.22 × 10−12.59 × 10455Fe2.70 × 1002.43 × 104
57Co7.42 × 10−13.06 × 10360Co5.27 × 1008.47 × 104
58Co1.94 × 10−11.13 × 10659Ni7.50 × 1045.20 × 102
60Co5.27 × 1006.36 × 10563Ni9.60 × 1016.69 × 104
65Zn6.70 × 10−11.97 × 10490Sr2.90 × 1014.71 × 104
85Sr1.78 × 10−11.51 × 10594Nb2.00 × 1041.50 × 101
95Zr 1.76 × 10−16.40 × 104125Sb2.80 × 1004.11 × 101
95Nb9.61 × 10−21.25 × 10599Tc2.10 × 1059.00 × 10−2
103Ru1.08 × 10−11.93 × 105129I1.60 × 1073.90 × 10−4
106Ru1.01 × 1001.85 × 105137Cs3.00 × 1018.21 × 102
113Sn3.15 × 10−15.67 × 103181Hf1.16 × 10−16.74 × 10²
136Cs3.62 × 10−25.13 × 105154Eu8.80 × 1002.91 × 102
141Ce8.90 × 10−23.91 × 104237Np2.10 × 1067.50 × 10−1
144Ce7.79 × 10−13.84 × 104238Pu8.80 × 1014.80 × 103
239Pu2.40 × 1044.90 × 103
240Pu6.50 × 1036.99 × 103
242Pu3.80 × 1057.10 × 100
241Am4.30 × 1021.61 × 104
243Am7.40 × 1031.60 × 101
244Cm7.80 × 1028.24 × 103
Total activity 3.3 × 10⁶ Total activity 2.89 × 10⁵
Table 7. Lengths of the transport routes from the designated origins to the destinations assumed for specific assessment. LILW: low and intermediate-level radioactive waste.
OriginDistance to Destination (km)
Wolsong LILW Disposal CenterProcessing Plant
Road [46]Waterway [47]RoadWaterway [45]
Kori809610021,500
Hanul17020710021,500
Table 8. Conditions and input parameters assumed for the comparison with the reference study on the onsite processing of steam generators in Korea.
ParameterThis StudyReference Study [14]
Component and weightKori Unit 1 SG (300 ton)
PartsAssumed to be in one pieceSeparated into tubes and chambers
Radionuclide54Mn, 60Co, 65Zn, 106Ru, and 144Ce
Activity concentrationHomogeneous (see PWR SG in Table 6)Chamber: 15.9 and 0.03 Bq/g for 60Co and 106Ru, respectively
Tube: 0.53, 4309, 0.04, 8.47, and 0.28 Bq/g for 54Mn, 60Co, 65Zn, 106Ru, and 144Ce, respectively
Radioactive decayDecay prior to processing not consideredDecay for 28 years prior to processing
ShieldingNot consideredConsidered
DecontaminationNot consideredConsidered
Mass partitioning90% for ingot, 10% for slag, and 1% for dust (see Section 3.1)98.35% for ingot, 1.64% for slag, and 0.01% for dust
Exposure durationSee footnote 1S1: 40 h (chamber), 100 h (tube)
S2: 43 h (chamber), 15 h (tube)
M2: 73 h (chamber), 60 h (tube)
M4: 3 h (chamber), 2.5 h (tube)
1 The exposure duration (t) was not directly used in the dose calculation of this study. However, the exposure duration can be estimated from the weight and throughput in accordance with the relation in Equations (2)–(4).
Table 9. Conditions and input parameters assumed for comparison with the reference study on the offsite transportation of steam generators in Germany.
ParameterCase ICase II
This StudyReference Study [13]This StudyReference Study [13]
ComponentTwo SGs (16.5 m height, 3.6 m outer diameter, and 177 ton weight)Four SGs (16.5 m height, 3.5 m outer diameter, and 160 ton weight)
RouteFrom Obrigheim NPP to Lubmin interim storageFrom Stade NPP to Studsvik in Sweden
Transport measure and distanceRoad: 1 km [48]
Waterway: 1399 km
Road (onsite) and waterway
1400 km total
Road: 1 km [49]
Waterway: 920 km [50]
Road (onsite) and waterway
Distances not given
Transport time 1Road: 1 h
Waterway: 63.6 h or 15 days
15 daysRoad: 1 h
Waterway: 50 h or 4 days
4 days
Dose rate from SG0.1 mSv/h 2 m from surface [51]Not given0.1 mSv/h 2 m from surface [51]Not given
1 Road transport time is assumed to be 1 h considering the practical arrangements needed for onsite transport. On the other hand, transport time for the waterway is either derived from the transport distance and respective speed (see Table 5) or assumed to be the same period reported in the reference study.
Table 10. Recommended criteria to approve the special arrangement transport of steam generators in one piece suggested by the International Atomic Energy Agency (IAEA) [52].
Quantitative CriterionQualitative Criterion
(a)Conveyance activity limit 10A2 for inland waterway or 100A2 for other modes [51]
-
Non-fissile or fissile excepted
-
No unnecessary extraneous material in interior void space of the component
-
Negligible liquid content
-
Satisfying Type IP (Industrial Package)-2 requirements for the component including any unpackaged penetrations, openings and crevices, and additional shielding
-
Consigned as exclusive use of the component
-
Excluded from air transport due to size and mass of the component
(b)External radiation level 3 m from unshielded component 10 mSv/h
(c)Maximum radiation level on outside shell of and at plane formed by opening/penetration on the component < 2 mSv/h
(d)Accidental intake of radionuclide by a person ~10−6A2 or corresponding inhalation dose of 50 mSv
(e)Non-fixed contamination of the component’s accessible surface Limiting value for surface contaminated objects (SCOs) [51] 1
1 Limiting the value for the non-fixed contamination on the inaccessible surface for beta and gamma emitters and low-toxicity alpha emitters is 40 × 103 Bq/cm2, and 4 × 10³ Bq/cm2 for all other alpha emitters.
Table 11. Reported cases of the suggestion and application of special arrangements for the transportation of steam generators.
CountryApplied StandardsType of Object and Package
United States [53,54]
-
Dose rate ≤ 10 mSv/h (3 m from SG)
-
Conveyance activity ≤ 100A2.
-
Surface contamination for beta, gamma and low toxicity alpha ≤ 40 × 103 Bq/cm2
-
Surface contamination for other alpha ≤ 4 × 10³ Bq/cm2
SCO Type IP-2
Germany [13]
-
Dose rate ≤ 10 mSv/h (at 3 m from SG)
-
10A2 for inland waterway and 100A2 for other modes
-
Intake by inhalation ≤ 10−6A2
SCO-II Type IP-2
Canada [38]
-
Surface contamination for beta, gamma and low toxicity alpha ≤ 40 × 103 Bq/cm2
-
Surface contamination for other alpha ≤ 4 × 10³ Bq/cm2
-
Speed limit for road transport vehicle ≤ 20 km/h
SCO-I Type IP-1
Japan [55]
-
Surface dose rate < 10 mSv/h (at 3 m from SG)
-
Total activity ≤ 100A2
-
Surface contamination for beta and gamma ≤ 40 × 103 Bq/cm2
-
Activity concentration limit for sea transport ≤ 74 Bq/g 1
SCO-I Type IP-1
1 It is reported that compliance with this criterion facilitates the process of the sea transportation of an SG which is not considered a “dangerous material” [55].

