Article

Effect of Gamma Irradiation on Structural Features and Dissolution of Nuclear Waste Na–Al–P Glasses in Water

by
Alexey V. Luzhetsky
1,
Vladislav A. Petrov
2,
Sergey V. Yudintsev
2,
Viktor I. Malkovsky
2,
Michael I. Ojovan
2,3,*,
Maximilian S. Nickolsky
2,
Andrey A. Shiryaev
2,4,
Sergey S. Danilov
5 and
Elizaveta E. Ostashkina
1
1
Federal State Unitary Enterprise-United Ecological, Scientific and Research Centre of Decontamination of Radioactive Waste (RAW) and Environmental Protection, 119121 Moscow, Russia
2
Institute of Geology of Ore deposits, Petrography, Mineralogy and Geochemistry, 119017 Moscow, Russia
3
Department of Materials, Faculty of Engineering, The University of Sheffield, Sheffield S1 3JD, UK
4
Institute of Physical Chemistry and Electrochemistry, 119071 Moscow, Russia
5
Vernadsky Institute of Geochemistry and Analytical Chemistry, 119991 Moscow, Russia
*
Author to whom correspondence should be addressed.
Sustainability 2020, 12(10), 4137; https://doi.org/10.3390/su12104137
Submission received: 17 April 2020 / Revised: 11 May 2020 / Accepted: 12 May 2020 / Published: 19 May 2020
(This article belongs to the Special Issue Nuclear Waste Management and Sustainability)

Abstract

:
Structural properties and water dissolution of six sodium–aluminum–phosphate (NAP) glasses have been investigated before and after irradiation by a gamma-ray source based on 60Co. Two of these samples were of simple composition, and four samples had a complex composition with radionuclide simulants representing actinides, fission, and activated corrosion products. Samples of the simple composition are fully vitreous, whereas samples of the complex composition contained up to 10 vol.% of aluminum–phosphate, AlPO4, and traces of ruthenium dioxide, RuO2. Based on the study of pristine and irradiated glasses, it was established that the radiation dose of 62 million Gray had practically no effect on the phase composition and structure of samples. At the same time, the rate of leaching of elements from the irradiated samples by water was decreased by about two times.

1. Introduction

Nuclear energy is an important source of electricity and a key component of low-carbon energy. In 2018, 450 nuclear power reactors with a total installed capacity of 396 GW€ generated 10% of all electricity in the world, including one-third of low-carbon power generation [1]. In OECD countries, the USA, and Russia, 18–20% of electric energy is produced at nuclear power plants. In France, the amount increased to over 70% [2]. Nuclear energy also has other applications—production of isotopes for various purposes [3], heat generation, desalination, etc. Its negative side is associated with the accumulation of spent nuclear fuel (SNF) and radioactive waste (RW). Up to 12,000 tons of SNF are produced in the world each year, whereas a PWR-VVER type reactor generates annually 25–30 tons of SNF [1,4]. By 2014, about 370,000 tons of SNF had already been produced, of which almost a third was reprocessed [5]. A closed nuclear fuel cycle with SNF reprocessing is being implemented in Russia, France, United Kingdom, China, whereas in Canada, Sweden and Finland, South Korea, Germany, and some other countries, the emphasis is on an open cycle with SNF disposal without reprocessing [6,7,8].
The volumes of SNF and RW resulting from the SNF reprocessing will inevitably grow over time [9]. The reprocessing is accompanied by the generation of liquid radioactive waste, including high-level waste (HLW) in an amount of 13–31 m3 per ton of SNF [10]; after evaporation, its volume is reduced to 250 L [3]. Liquid HLW are isolated in vitreous matrices: Sodium–aluminum–phosphate (Na–Al–P) glasses in Russia [11,12,13,14,15], and alkali-borosilicate (A-B-Si) glasses elsewhere [16,17,18,19,20,21,22,23,24]. By 2013, about 30,000 tons of vitrified HLW had been accumulated [6,8,25,26]. Taking into account the current rates of SNF reprocessing and solidification of liquid HLW, at present, the total volume of nuclear waste glass can be estimated as 35,000 tons with an approximate weight ratio between Na–Al–P and A-B-Si glasses of 20% to 80%. SNF and RW management in Russia is described in national reports on fulfilling obligations arising from the Joint Convention on the Safety of Spent Fuel and Radioactive Waste Management [27,28,29]. For SNF reprocessing PUREX technology developed at the end of the 1940s in the USA to extract fissile Pu isotopes for military applications is used [30]. The amount of SNF in the Russian Federation at the end of 2016 reached approximately 22500 tons, of which about 2/3 were from RBMK and 1/3 was from VVER reactors. The reprocessing of SNF of VVER-440, BN-600 and research reactors is carried out at the RT-1 “Mayak” reprocessing plant; about 6000 tons of SNF have been processed to date. Up to 200 tons of the SNF per year is reprocessed now. Recently reprocessing SNF of VVER-1000 and defective SNF of RBMK-1000 have also been started at this plant. Federal State Unitary Enterprise (FSUE) “MCC” has a facility for reprocessing of 5 tons VVER-1000 SNF per year and in 2021 its second stage is expected to launch its productivity to 250 tons of SNF per year [29]. Given the import of SNF from Russian-designed reactors from abroad, the rate of accumulation of spent nuclear fuel in Russia is much higher than the rate of reprocessing. However, according to the planned upgrade of the reprocessing plants, it is assumed that by 2030 the rate of reprocessing of SNF in Russia will exceed the rate of its formation. At the same time, this will greatly increase the volume of vitrified HLW.
The composition of SNF depends on the type of reactor, the composition of the initial fuel, its burnup and storage time [5,6,9]. Radionuclides in SNF are represented by fission products, actinides (uranium and newly formed radioisotopes), activated elements of fuel assemblies and construction materials involved [6,22,23]. The main fission products include rare earth elements (REE), Zr, Mo, Tc, Ru, Pd, Cs, Sr, Rh, Te, Xe, Kr, I. Among them, REE accounts for 25 wt.%, Platinoids—16%, Zr—15%, Mo—12%, Cs—6% [3]. After three years of storage of SNF with a burnup of 33 GWd/t (at 3.5% initial enrichment of 235U), the content, in kg per ton of SNF, [23] is: alkalis (Cs, Rb)—3, alkaline earths (Sr, Ba)—2.4, rare earths (mainly light, Ce groups)—10.2, transition 4d-metals (Mo, Zr, Tc)—7.7, noble metals of the platinum group (Ru, Rh, Pd)—3.9, as well as 0.5 kg of Se and Te, 0.2 kg of I and Br; Ag, Cd, Sn, Sb make another 0.1 kg. These proportions are largely inherited into liquid HLW after SNF reprocessing [3,10,17], where various technological impurities are also present. In RW, in particular, there are [23]—19 wt.% of transition metals (Mo, Zr, Tc, etc.), 18% of REE (La, Ce, Pr, Nd, Sm), 10% alkaline (Gs, Rb) and alkaline-earth (Sr, Ba) elements, 7% platinoids (Ru, Rh, Pd), 2% of minor actinides (Np, Am, Cm), up to 1% Se and Te, the remaining 43 wt.% on Fe, Ni, Cr, Na, P, and a number of less significant elements.
Investigations are underway to support available vitrification technologies and develop improved borosilicate and aluminum-iron phosphate glasses in order to prove the possibility of reliable immobilization of HLW. The compositions of the modernized glasses differ from the traditional ones in the ratio of the main components. They additionally include HLW components such as oxides of Cs, Sr, Ba, Nd, Cr, Zr, Ru, and U. To determine the suitability of such glasses for immobilization and disposal of HLW, it is necessary to study their thermal and radiation resistance and influence of radiation on durability at interaction with water. There are many works on this topic for borosilicate glass matrices, whereas for sodium–aluminum–phosphate glasses, such data are contained in very few publications [11].
The main dose rate from HLW is alpha, beta and gamma rays emitted from the decay of fission products. To study the resistance of the glasses to gamma radiation, high activity 60Co sources are used. In this paper, we studied the effect of γ-radiation on properties of nuclear waste sodium–aluminum–phosphate (NAP) glasses—their structure and resistance to leaching in the water at 25 and 90 °C. Effects of irradiation on properties of NAP glasses of various compositions are compared with previous studies reported in the literature. The aim of this work is to study the effect of radiation (γ-irradiation from 60Co source) on the structure and properties of two groups of nuclear waste NAP glasses. Samples of the first group—“simple composition”—comprise only principal components of the glass matrix (oxides of Na, Al, Fe and P), serving as reference material. Glasses of the second group—“complex composition”—contain simulants of HLW with respective changes in the content of the major elements (Table 1).

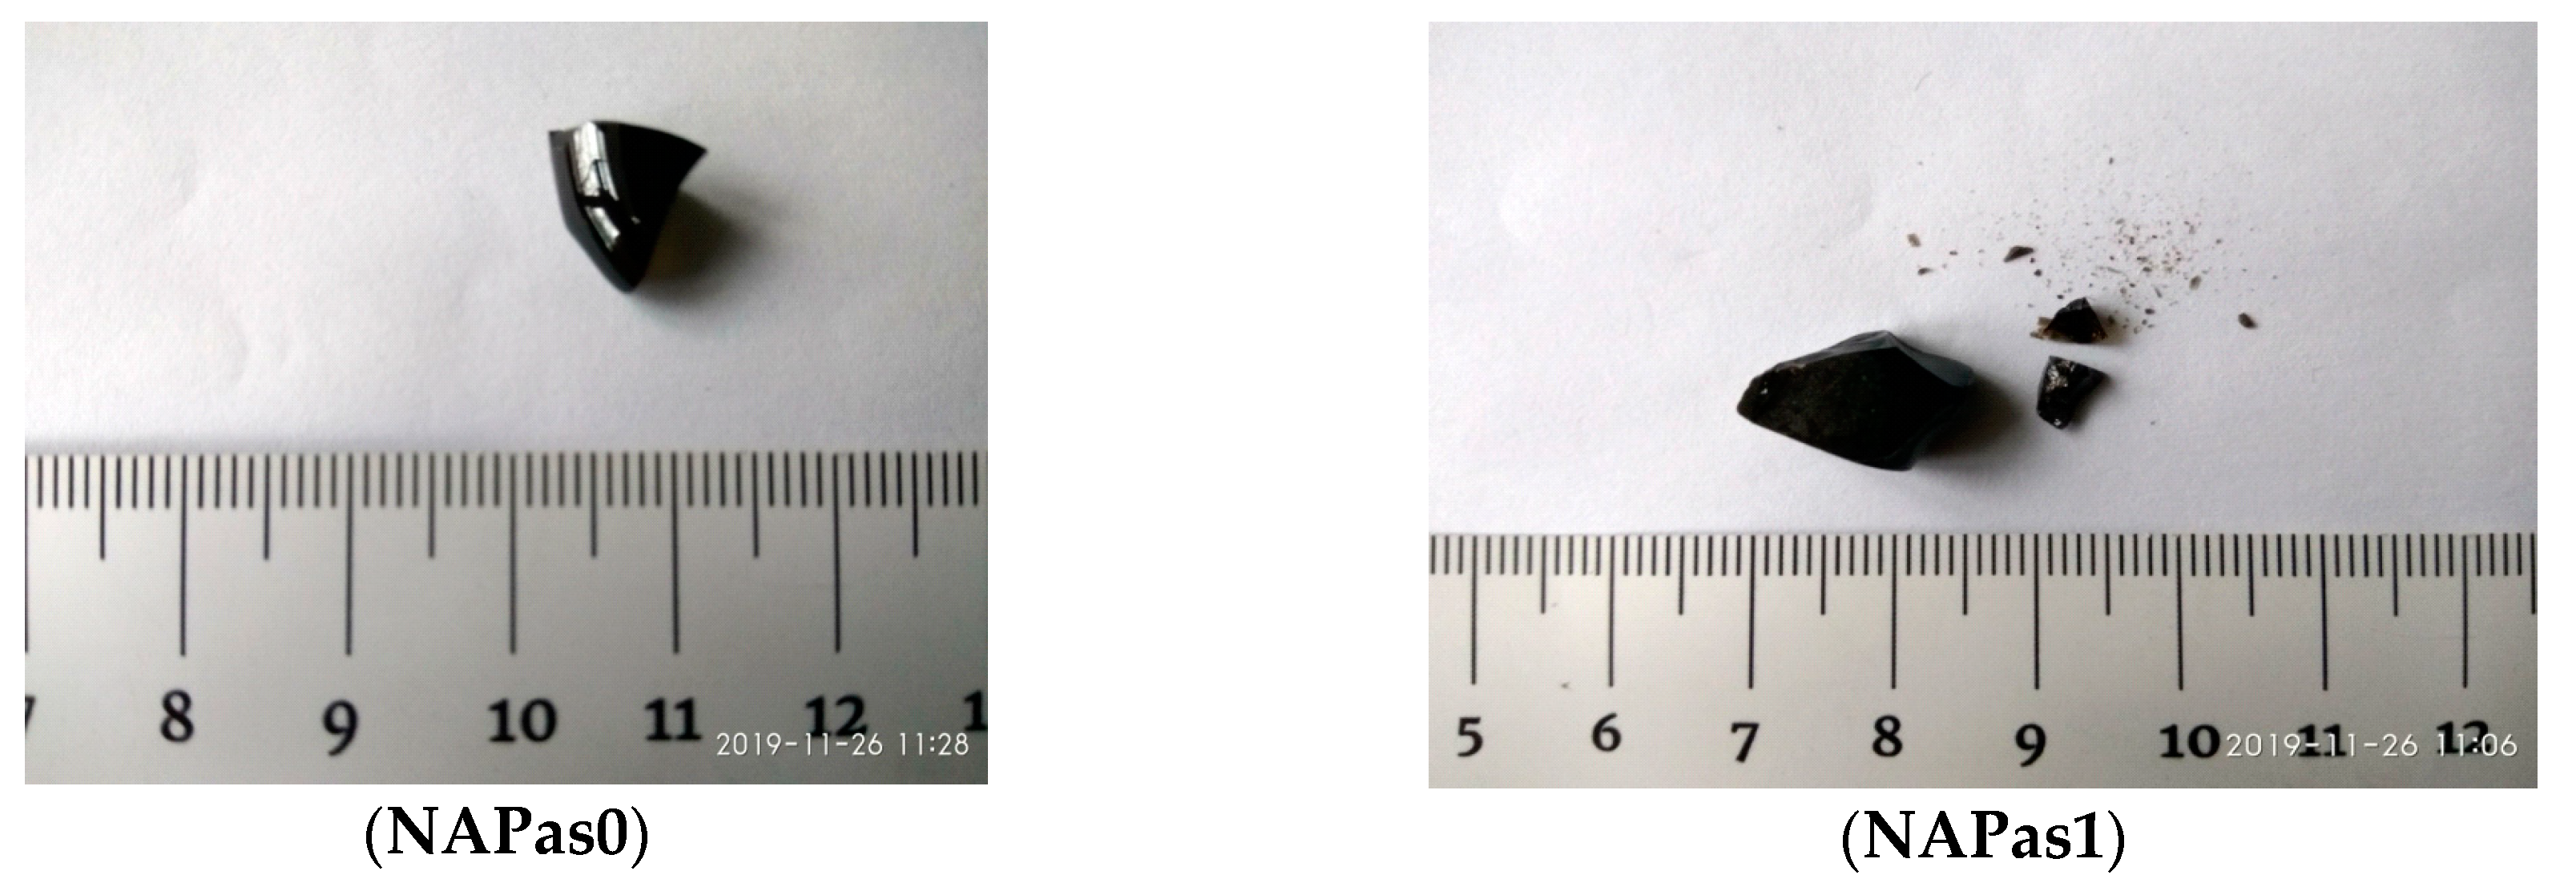
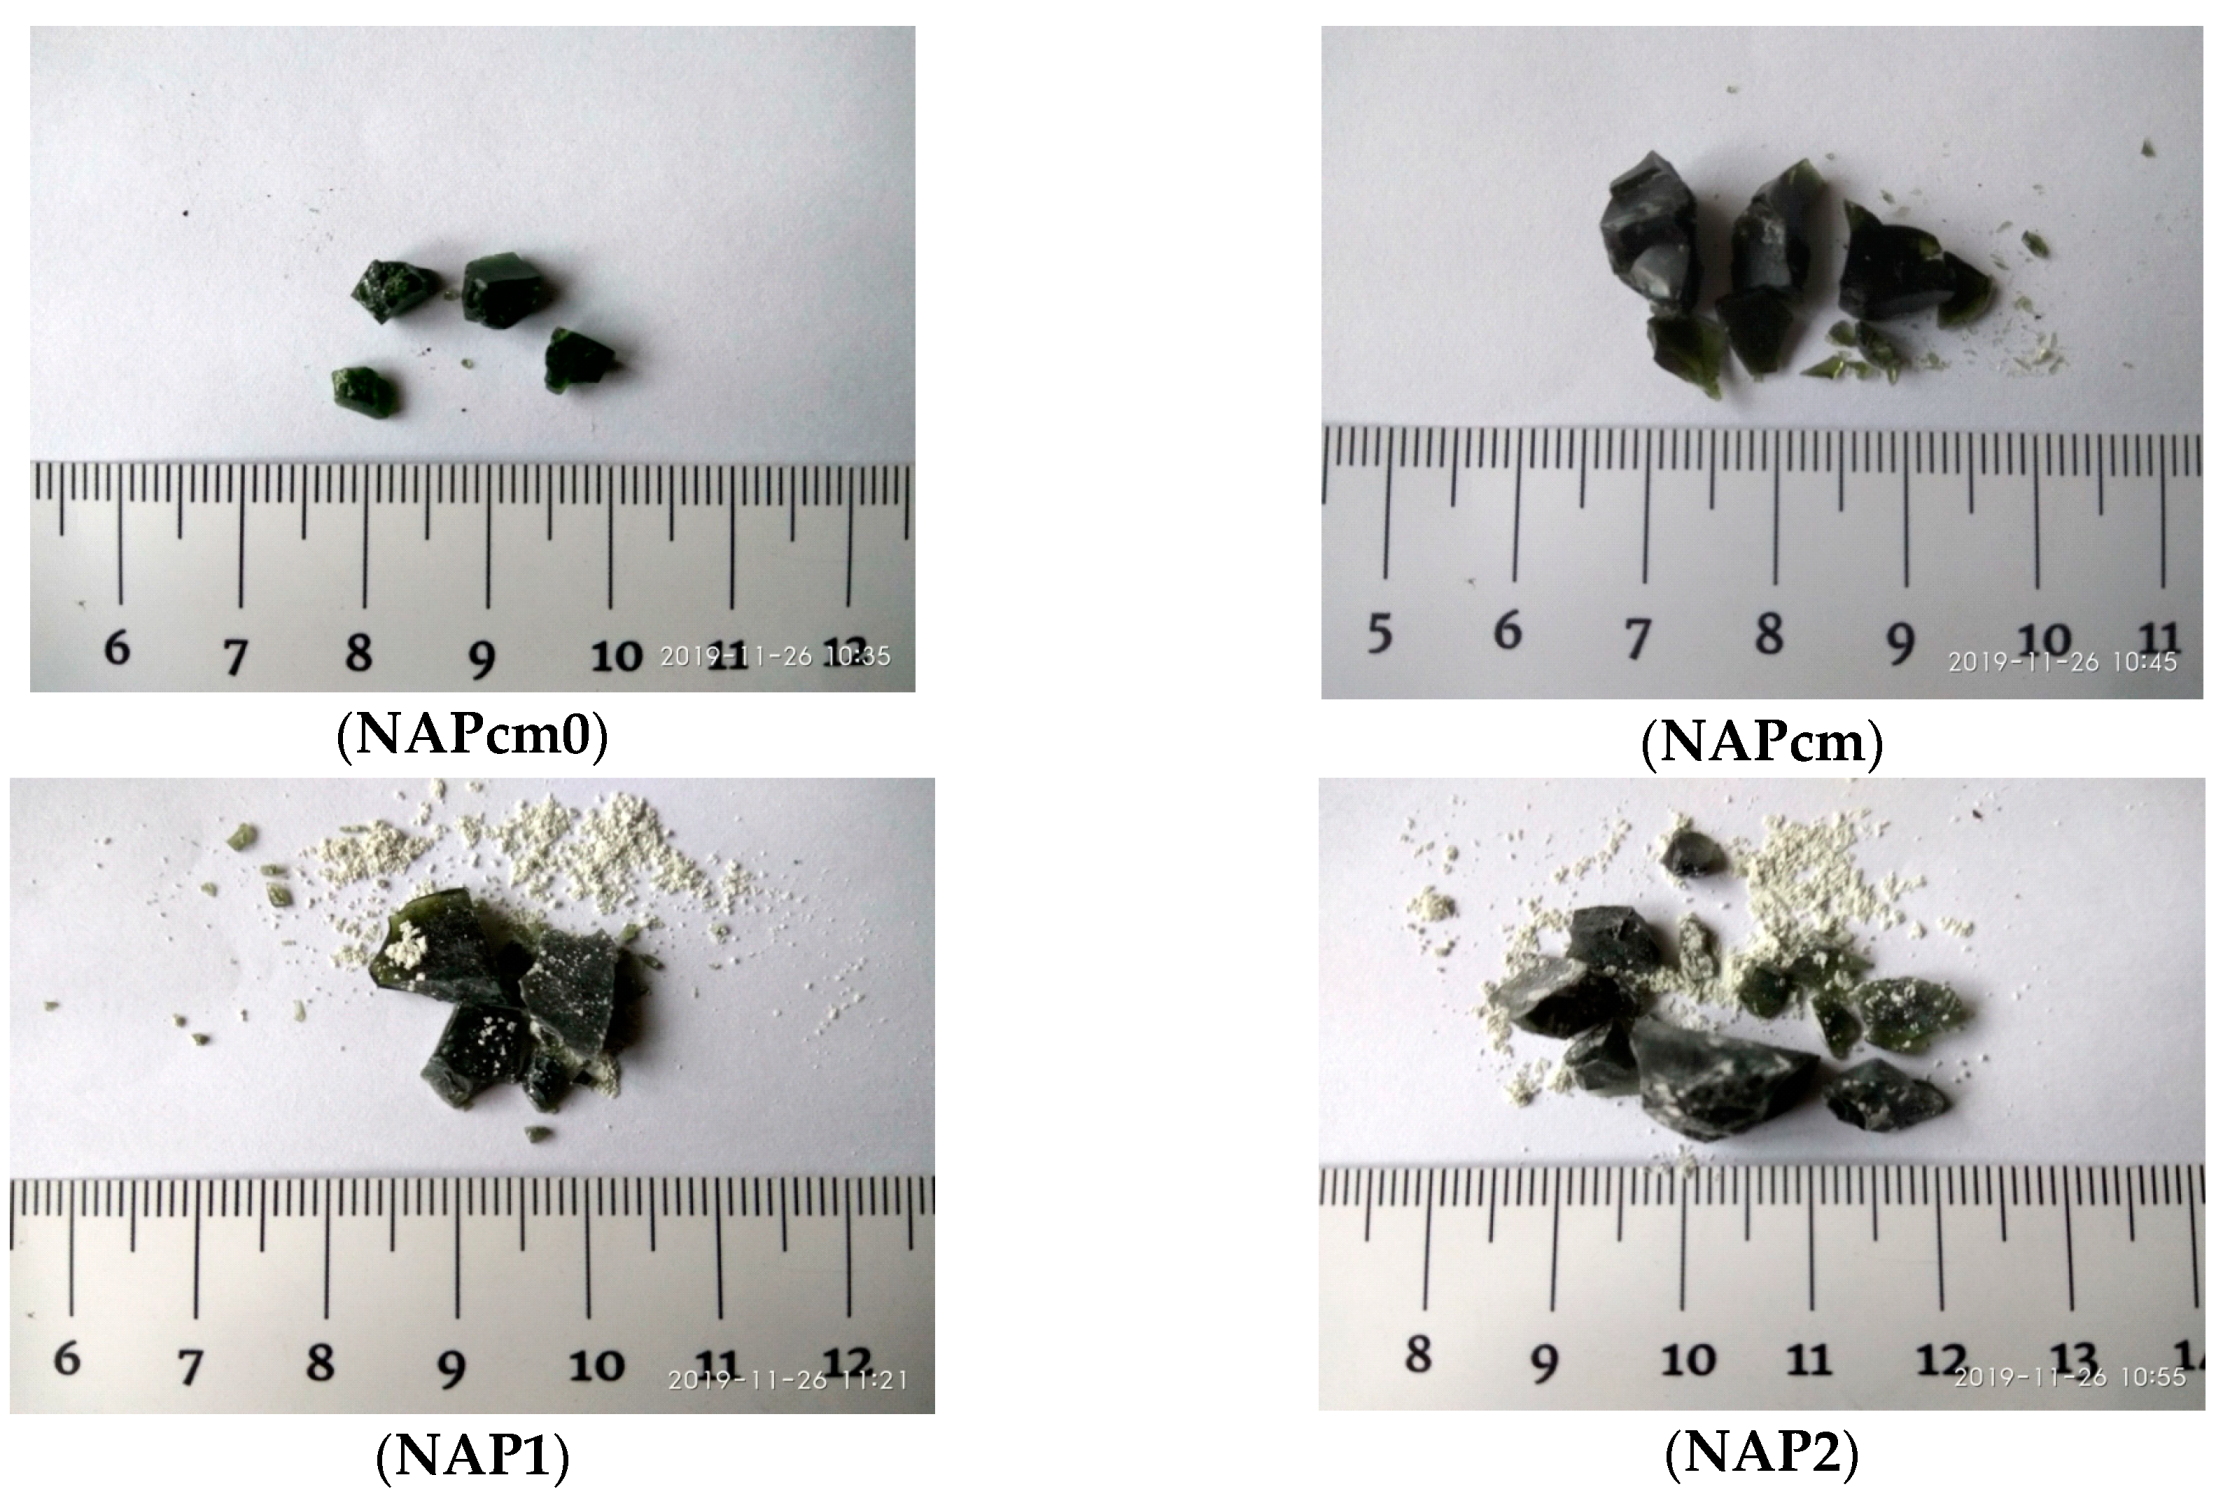
2. Materials and Methods

The NAP glasses studied in this work, potentially suitable for isolation of historical (legacy) HLW of FSUE “Mayak”, were synthesized in corundum crucibles as follows. The glass batch mixture was heated to 1100 °C at a rate of 10–30 °C/h; for complete homogenization, the melt was held for 2 hours and quenched. The glass was cooled in the isothermal annealing mode. The compositions of glasses of simple and complex composition are summarized in Table 1. The composition of simulant sodium–aluminum–phosphate glass of FSUE “Mayak” [13] is also presented. Glass samples (Figure 1) are visually translucent, opaque, possess green or dark green color and a conchoidal fracture.
The radiation durability of HLW glasses is one of the important criteria for acceptability of high-level radioactive waste for geological disposal (Class 1 in Russian classification, vitrified HLW of FSUE “Mayak” and Mining and Chemical Combine). Radiation durability is the maximum dose at which there is practically no change in the structure, chemical and mechanical strength of the immobilized RW. For instance, after gamma irradiation with a dose of 108 Gy, the glass uniformity should be maintained in the volume of the glass block as controlled by x-ray phase analysis, and changes in the content of the main components in the glass composition should be less than 10% [31].
In order to verify compliance with regulatory requirements, the glass samples were irradiated with a dose of 6.2 · 107 Gy, which is close to that specified by regulatory requirements [31], at the RHM-gamma installation of FSUE “RADON”. The dose rate of irradiation was 1 · 104 Gy/h. No thermal (overheating) effects were observed during or after irradiation. Analyses of both unirradiated (pristine) and irradiated samples were performed on a GSM 5610LV scanning electron microscope (SEM) equipped with energy dispersive (EDS) detector.
The phase composition of unirradiated and irradiated NAP glasses were studied by the x-ray diffraction method, infrared and Raman spectroscopy and scanning electron microscopy. X-ray diffraction measurements were performed in the Bragg—Brentano geometry (“reflection”) on an EMPYREAN diffractometer using Ni filtered CuKα radiation. An X’Celerator linear semiconductor detector was used. Samples were mechanically grounded and placed on a zero-background holder made of single-crystal silicon. No binders were not used; the samples were wetted with ethanol to prevent loss during the measurements. HighScore software and PDF2 database (International diffraction data center, ICDD) were used for data analysis.
Raman spectra of the samples investigated were recorded on a Senterra (Bruker) spectrometer; for excitation laser with a wavelength of 532 nm was used. Infrared spectra were obtained on a SpectrumOne IR® spectrometer (Perkin Elmer). For some samples, spectra were also recorded using an AutoImage IR microscope. To record the absorption spectra in the infrared region, the powders were pressed into KBr tablets.
Chemical resistance of NAP glasses was analyzed using standard Russian test protocols [32,33].

3. Structural Properties of the Glasses before and after Irradiation
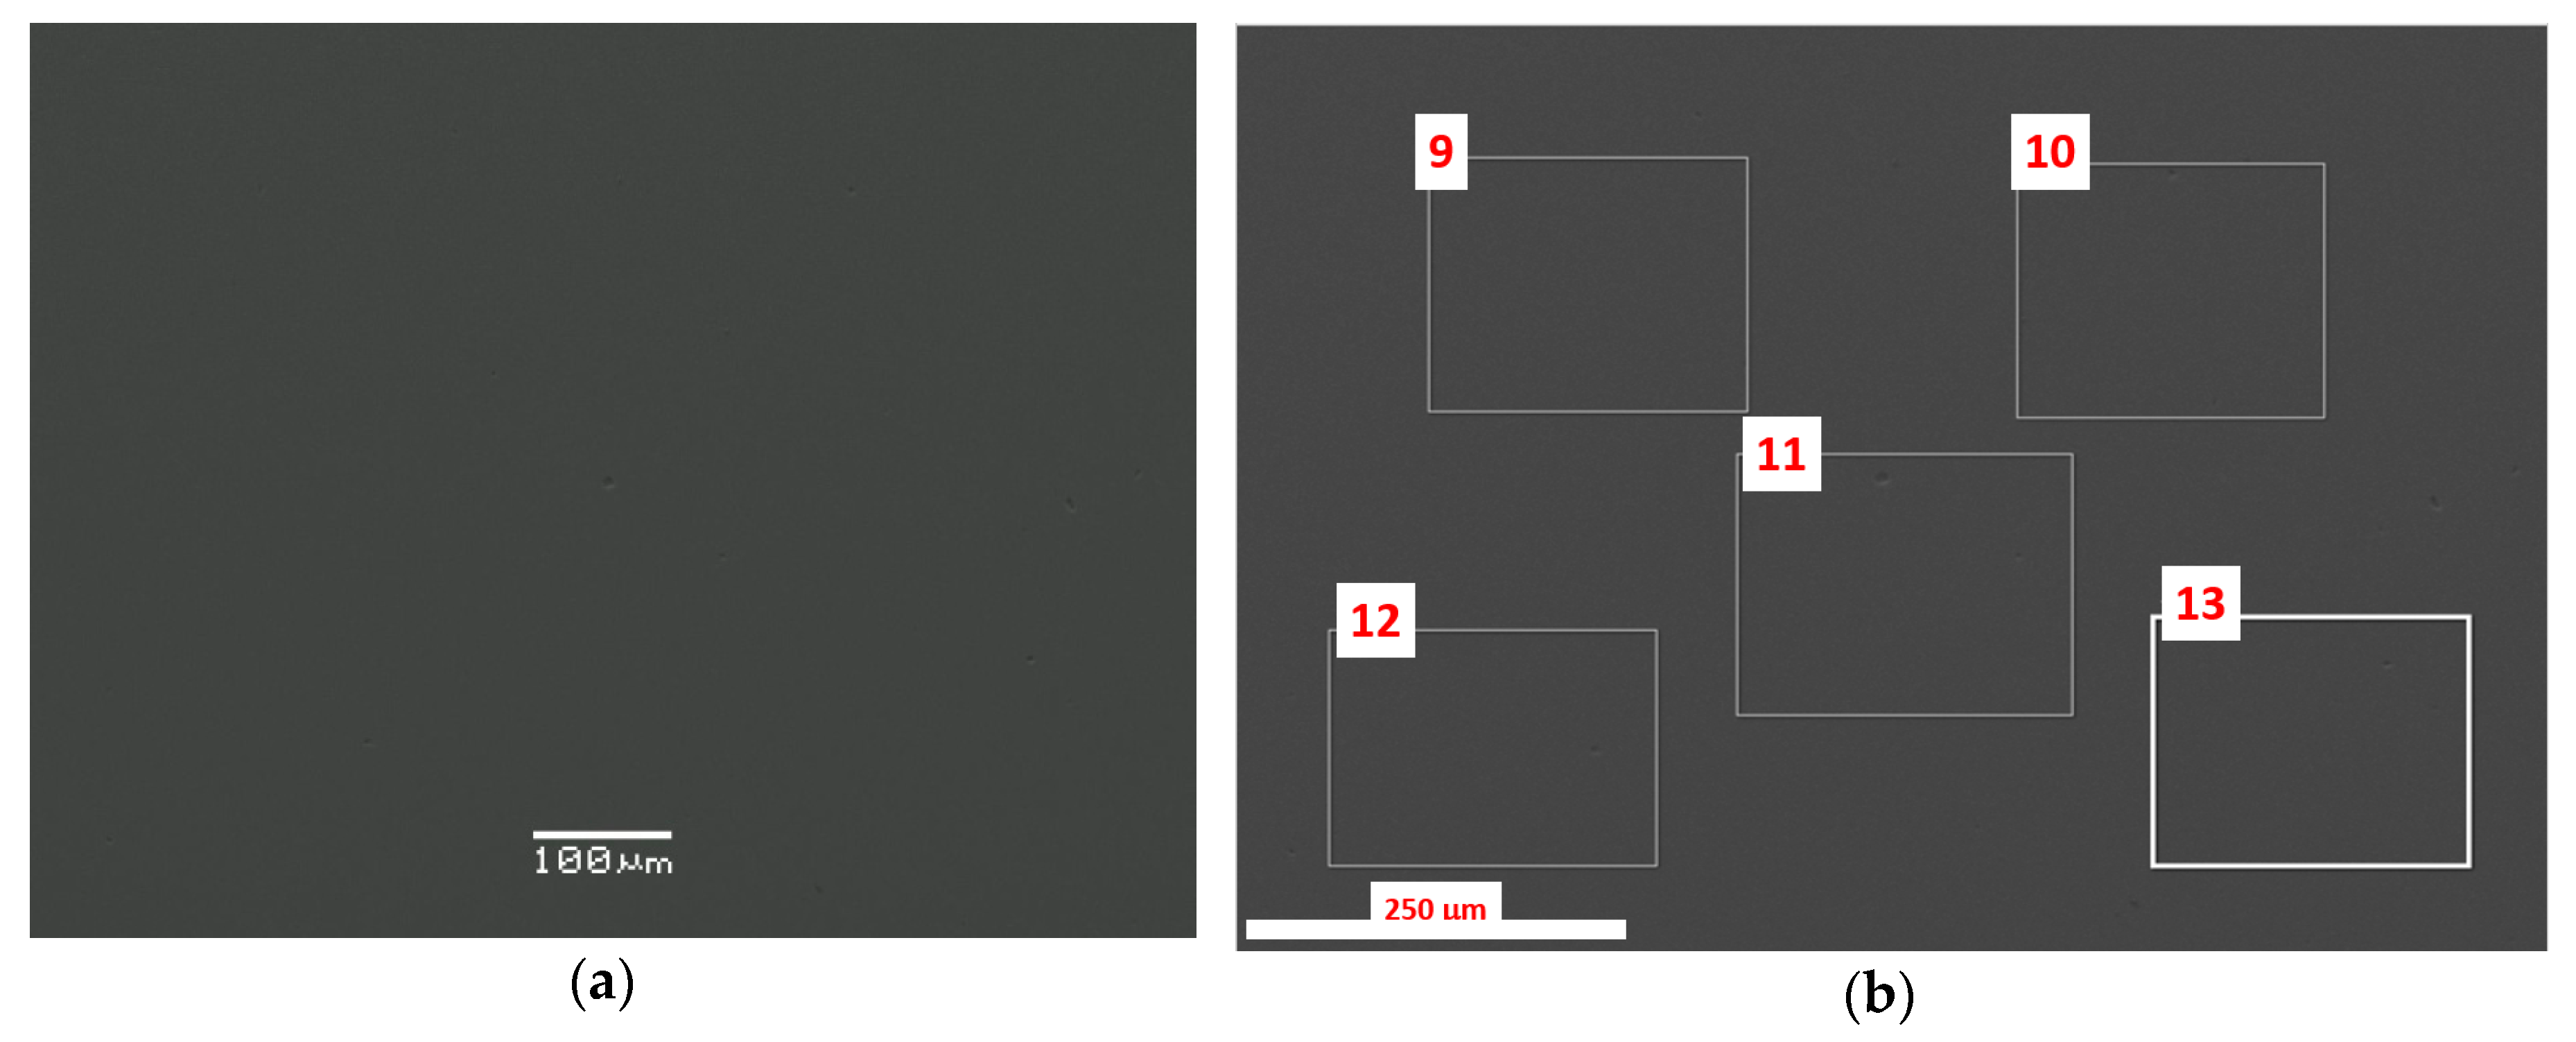
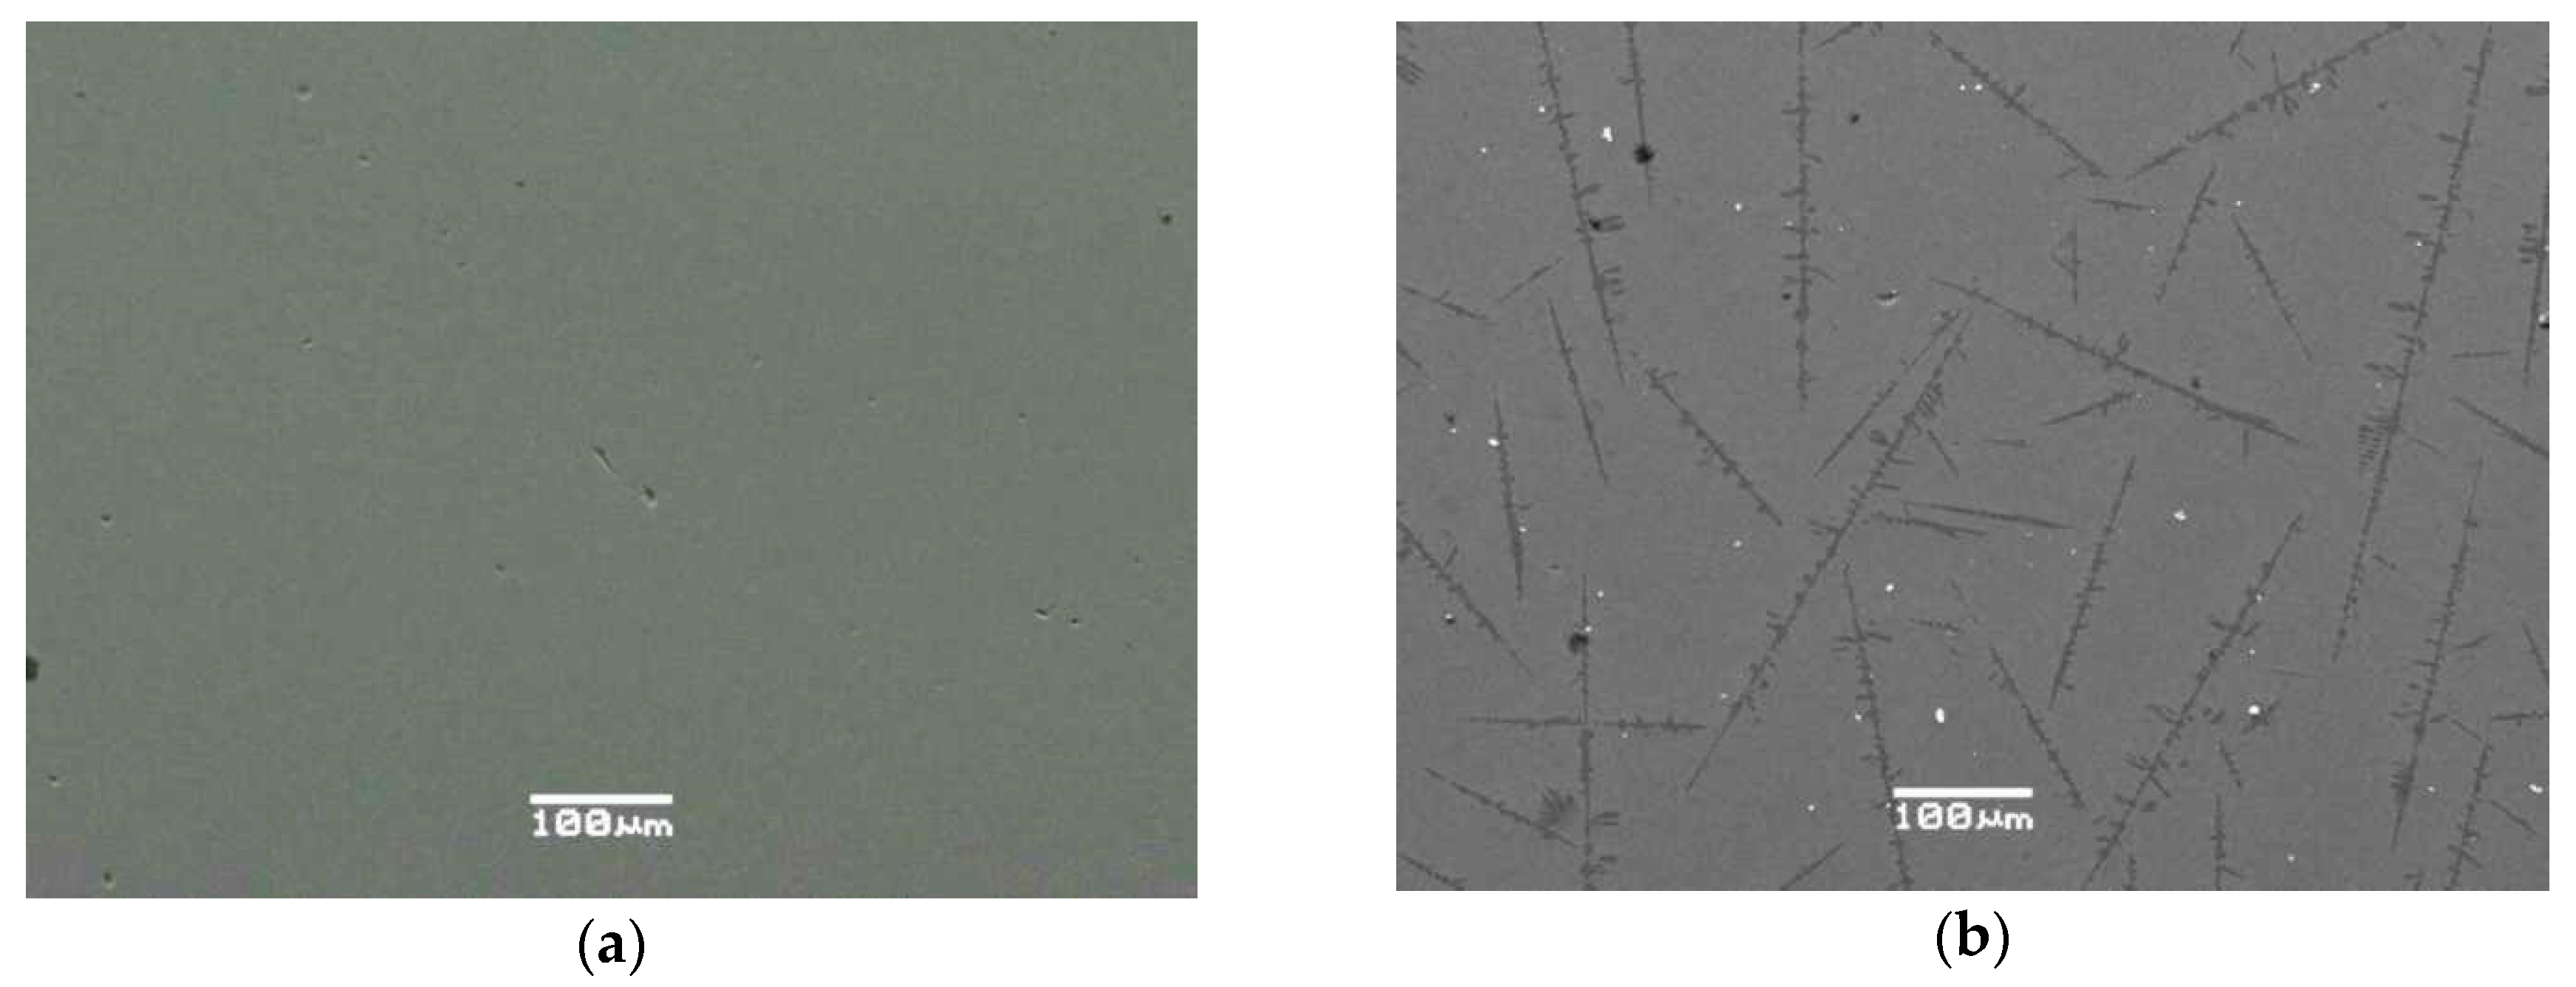
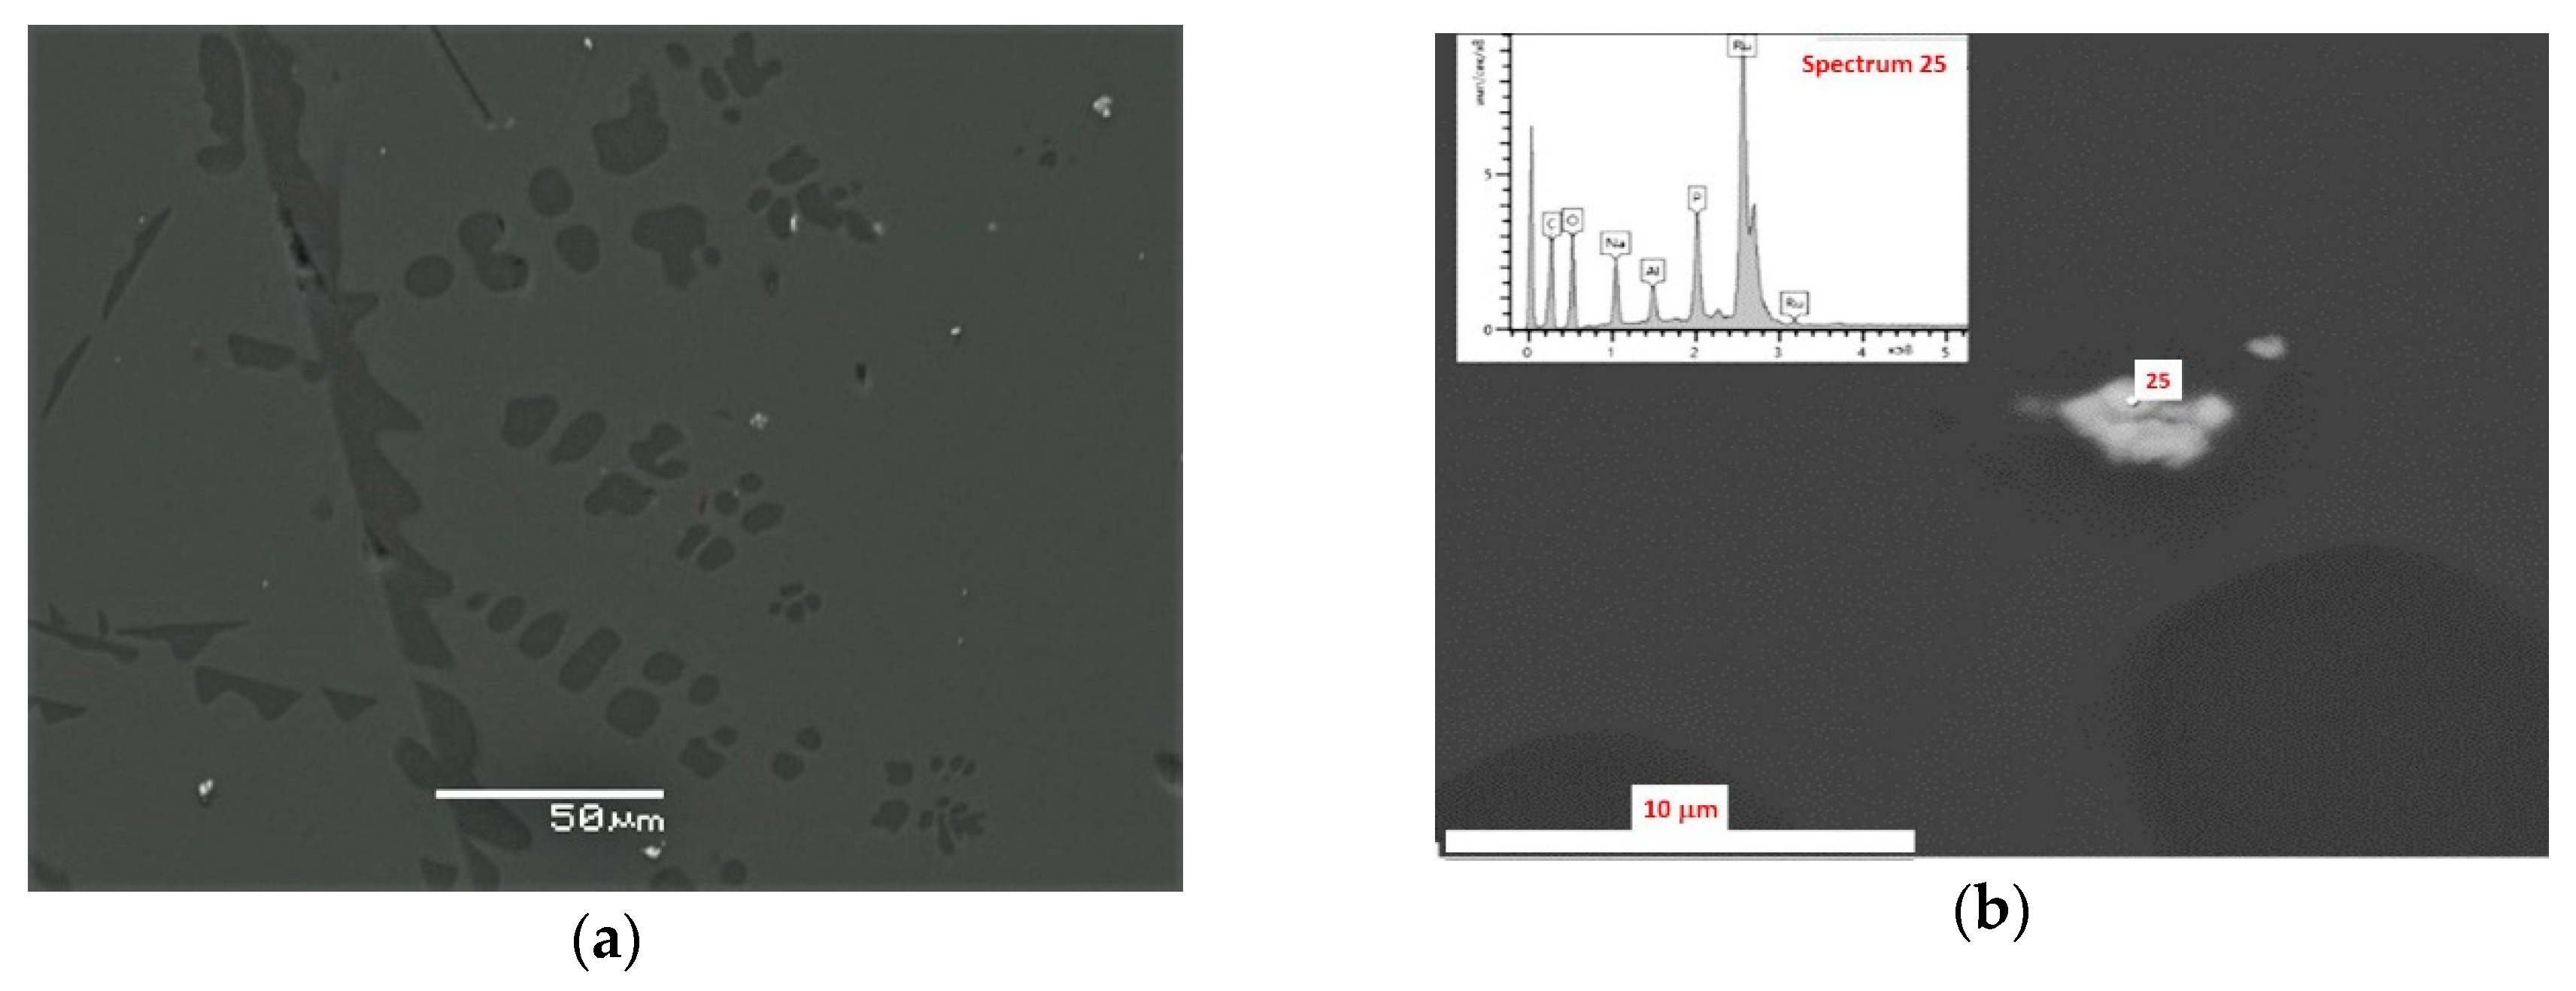
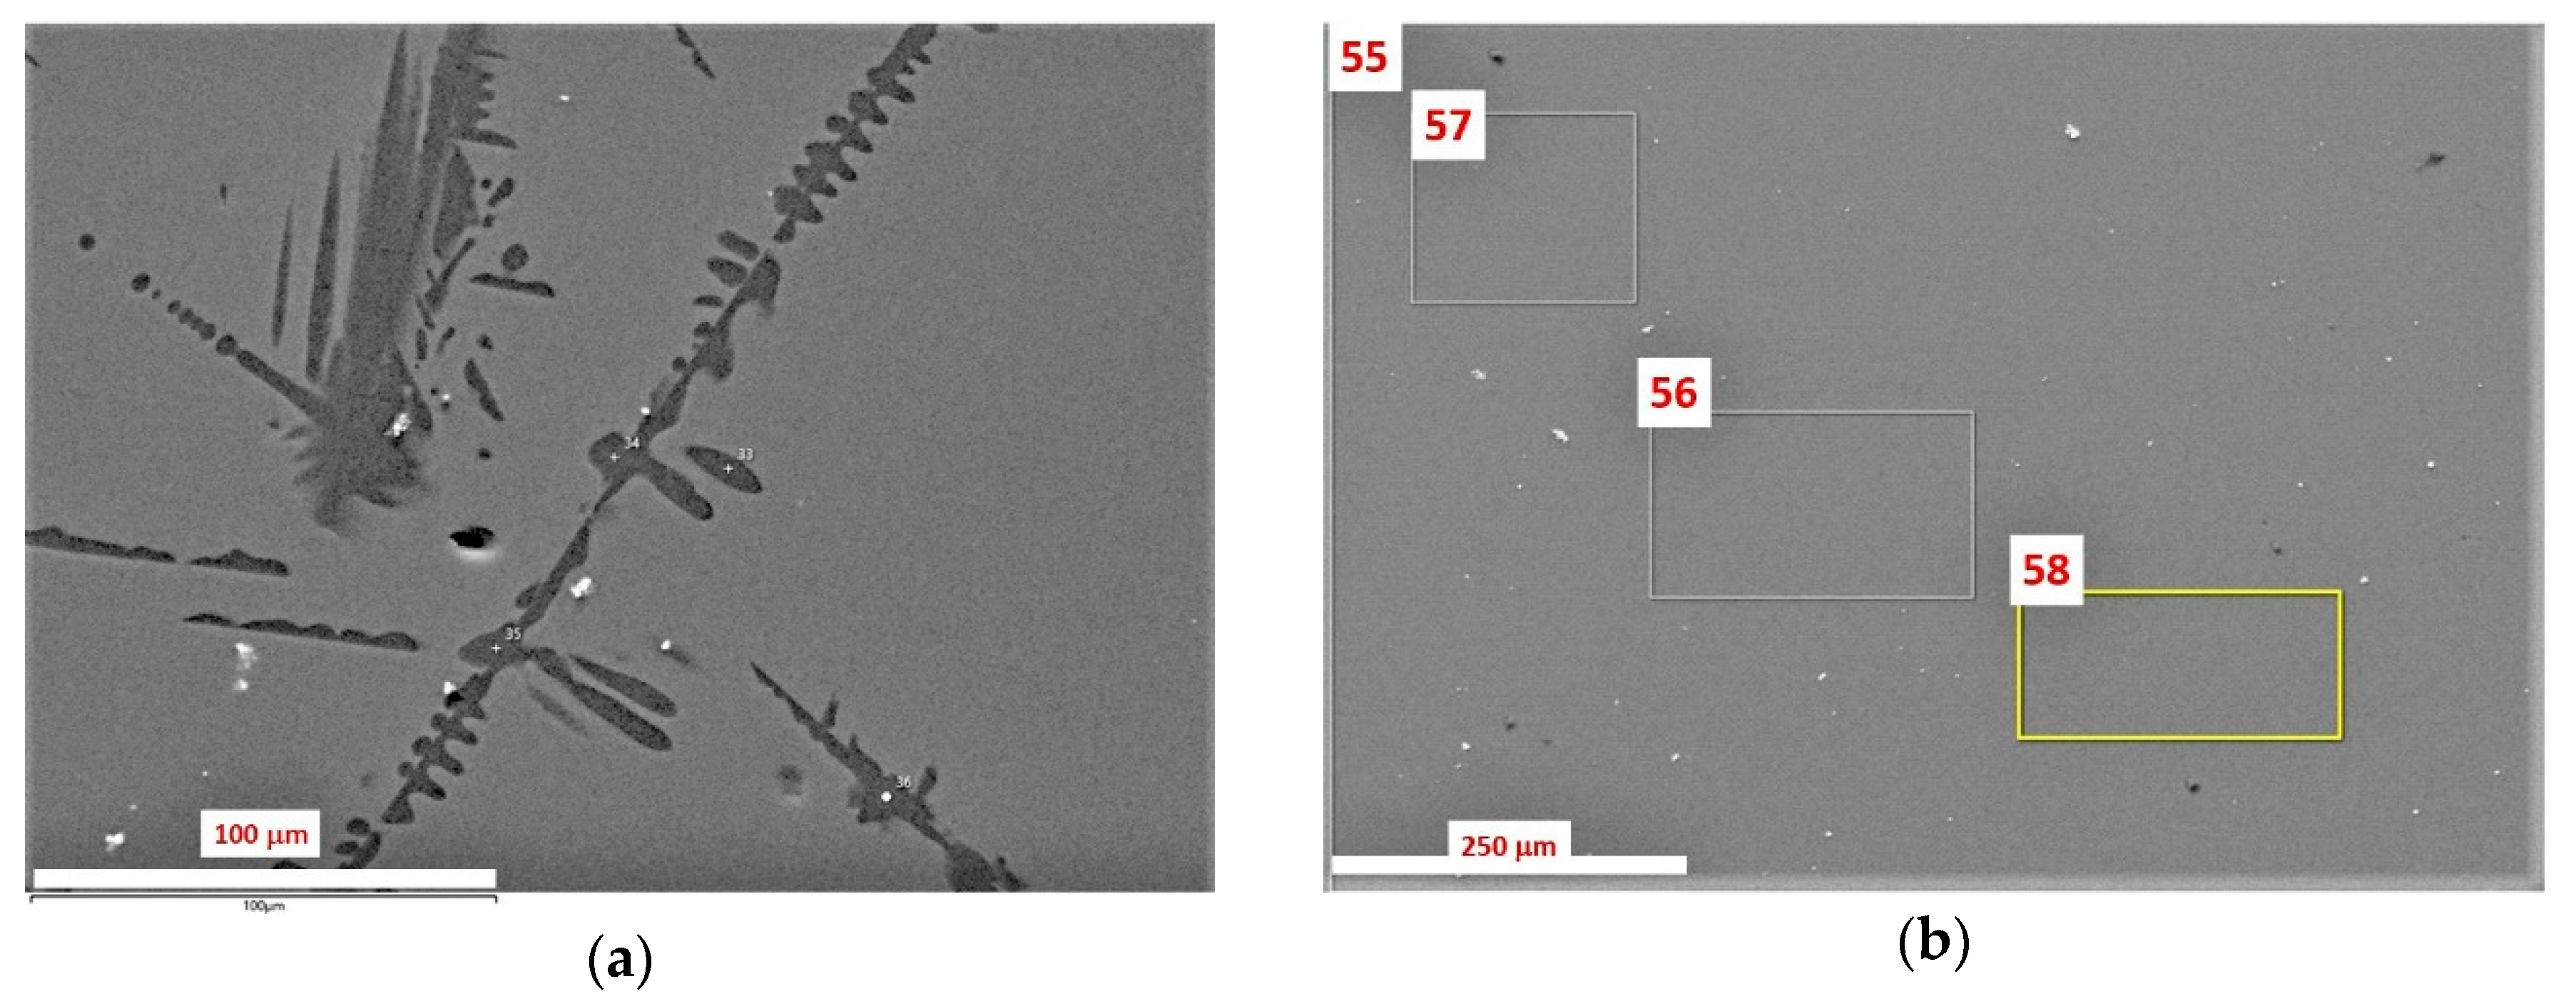
3.1. SEM/EDS Data

Samples of simple composition (NAPas0, NAPas1) before and after irradiation are composed only of the glassy phase, the composition of which does not change as a result of irradiation. According to SEM/EDS analysis, they comprise (in descending order): P2O5, Na2O, Fe2O3, Al2O3, the amount of SiO2 and K2O oxides is at the detection limit, that is, their presence in the samples shall be checked by more accurate methods. Samples of NAPas0 and NAPas1 glasses are homogeneous with only vitreous phase seen (Figure 2), whereas in samples of the complex composition (NAPcm0, NAPcm, NAP1, and NAP2) in addition to glassy phase, there are crystalline phases: aluminum orthophosphate and ruthenium dioxide (Figure 3 and Figure 4).
The compositions of the glassy phase of samples NAPas0 and NAPas1, measured in rectangular areas like those, as shown in Figure 2, are given in Table 2, Table 3 and Table 4. The detection limit of elements is 0.3–0.5 wt.% in light elements (Na, K, Al, Si) and 0.1–0.2 wt.% in heavy elements (Ru, Ln, U). No ruthenium was detected in the glass matrix (its amount is below the detection limit, 0.2 wt.%). Due to very low solubility in the glass [11,20], the main fraction of this element formed oxide precipitates. These particles, as well as Mo-based grains, can merge into large aggregates and settle to the bottom of the furnace, eventually leading to failure of the electrodes of the industrial vitrification furnace EP-500 at FSUE “Mayak”. They can also serve as centers for phosphate phases (monazite) crystallization in the glass matrix of HLW during storage and heating, due to the decay of short-lived radionuclides of fission products (Cs, Sr, Ln, etc.).
The composition of aluminum orthophosphate phase in the initial (unirradiated) glass NAPcm0, as shown in Figure 4a, is given in Table 5.
On the EDS spectra of ruthenium-rich particles (Figure 4b), low-intensity peaks of other elements of—C, Na, Al, P—are observed. Carbon is associated with its deliberate deposition on the surface of samples for analysis, whereas the presence of other elements is associated with a partial capture of the surrounding glass matrix by the electron beam. Oxygen is a component of these particles; that is, the ruthenium phase is represented by its oxide. This conclusion is confirmed by the XRD results. SEM investigations have not revealed any structural (Figure 5) and compositional (Table 6) difference between unirradiated and irradiated glasses.
Thus, the main difference in the structure of the initial (unirradiated) glasses of simple (NAPas0) and modified (NAPcm0) compositions is that the latter, in addition to the glass matrix, contains crystalline phases: aluminum–phosphate and ruthenium–oxide. The crystalline phases are clearly visible on the cleaved surface of the glass.
According to SEM studies, both samples of simple composition—pristine (NAPas0) and irradiated (NAPas1) are composed of homogeneous glass phase only. The modified compositions are characterized by the appearance of a small amount (<10 vol.%) of two crystalline phases—phosphotridmite (dominant) and ruthenium dioxide. The appearance of the latter is due to the extremely low solubility of this element in the studied aluminum–phosphate glass. The study of the evolution of the molten ternary system Na2O–Al2O3–P2O5 on cooling [34] showed the possibility of the formation of several polymorphs of the AlPO4 phase with different structures: P-cristobalite, P-tridimite, berlinite. Crystallization of AlPO4 can begin in the melt in the furnace with a Na2O content of less than 5 mol% and then continue when the melt (glass) cools down after pouring into canisters. In general, phosphotridimite and alkaline aluminum (iron) phosphates are typical products arising from the partial or complete crystallization of phosphate glass matrices [35,36,37,38,39,40,41,42,43,44,45]. At high contents of light rare earths (the Ce group), lanthanide phosphate with the structure of monazite appears, REE solubility in the aluminum–phosphate melt is determined as few wt.% [11,42,43].
Differences in the structure of irradiated (NAPas1, NAPcm) and unirradiated (NAPas0, NAPcm0) glasses of the same composition were not observed by scanning electron microscopy. The appearance of aluminum–phosphate and RuO2 is also characteristic of these glasses of the complex composition, both pristine (initial) and irradiated as well.

3.2. X-ray Diffraction

Despite adequate measurements duration and averaging over two or more independent experiments, the signal-to-noise ratio for most samples is relatively poor, which is explained by the small volume fraction of crystalline phases. High background signal level increasing with the diffraction angle is due to fluorescence of the iron admixture.
From the XRD data, the samples studied can be confidently divided into two groups. The first group includes glasses of simple composition—NAPas0 and NAPas1, in which no crystalline phases are observed. There is no noticeable difference between the irradiated and initial samples. All other samples with complex composition contain both an amorphous component (glass) and crystalline phases. Composition of the crystalline phases is the same for all studied samples (Figure 6). The predominant phase is orthorhombic AlPO4 (phosphotridimite) (ICDD card 00-048-0652); the second crystalline phase is ruthenium oxide (RuO2) (card 01-070-2662).
In general, according to the XRD data, no significant differences between glasses of the same composition before and after irradiation were revealed.

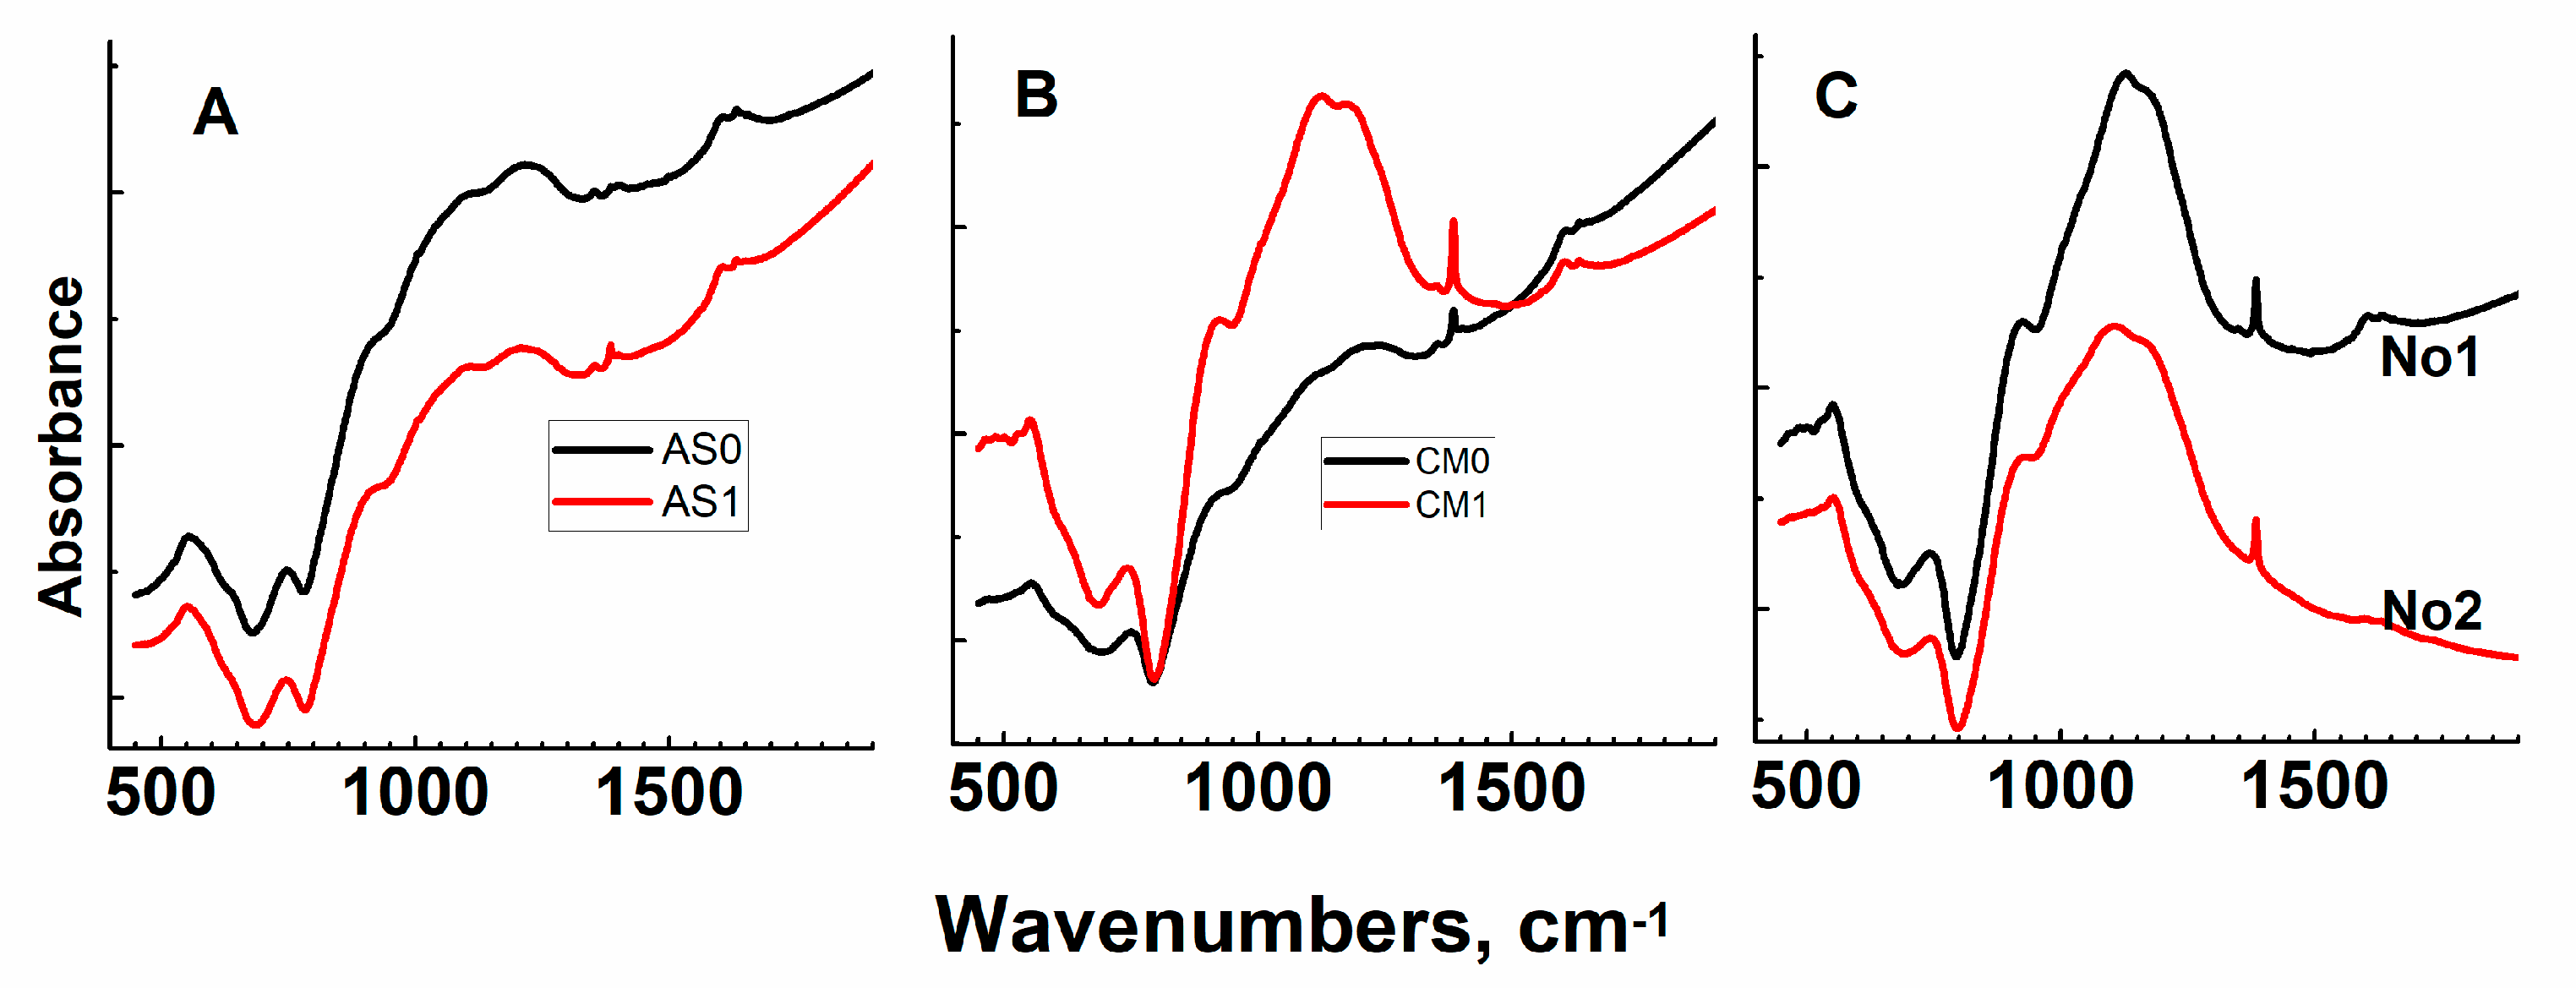
3.3. Raman and Infrared Spectroscopy

Both Raman and infrared spectra have revealed no differences between the spectra obtained on nonirradiated and irradiated samples, which indirectly indicates sufficiently high radiation stability of the material. Details are given in Appendix A.

4. Leaching and Dissolution

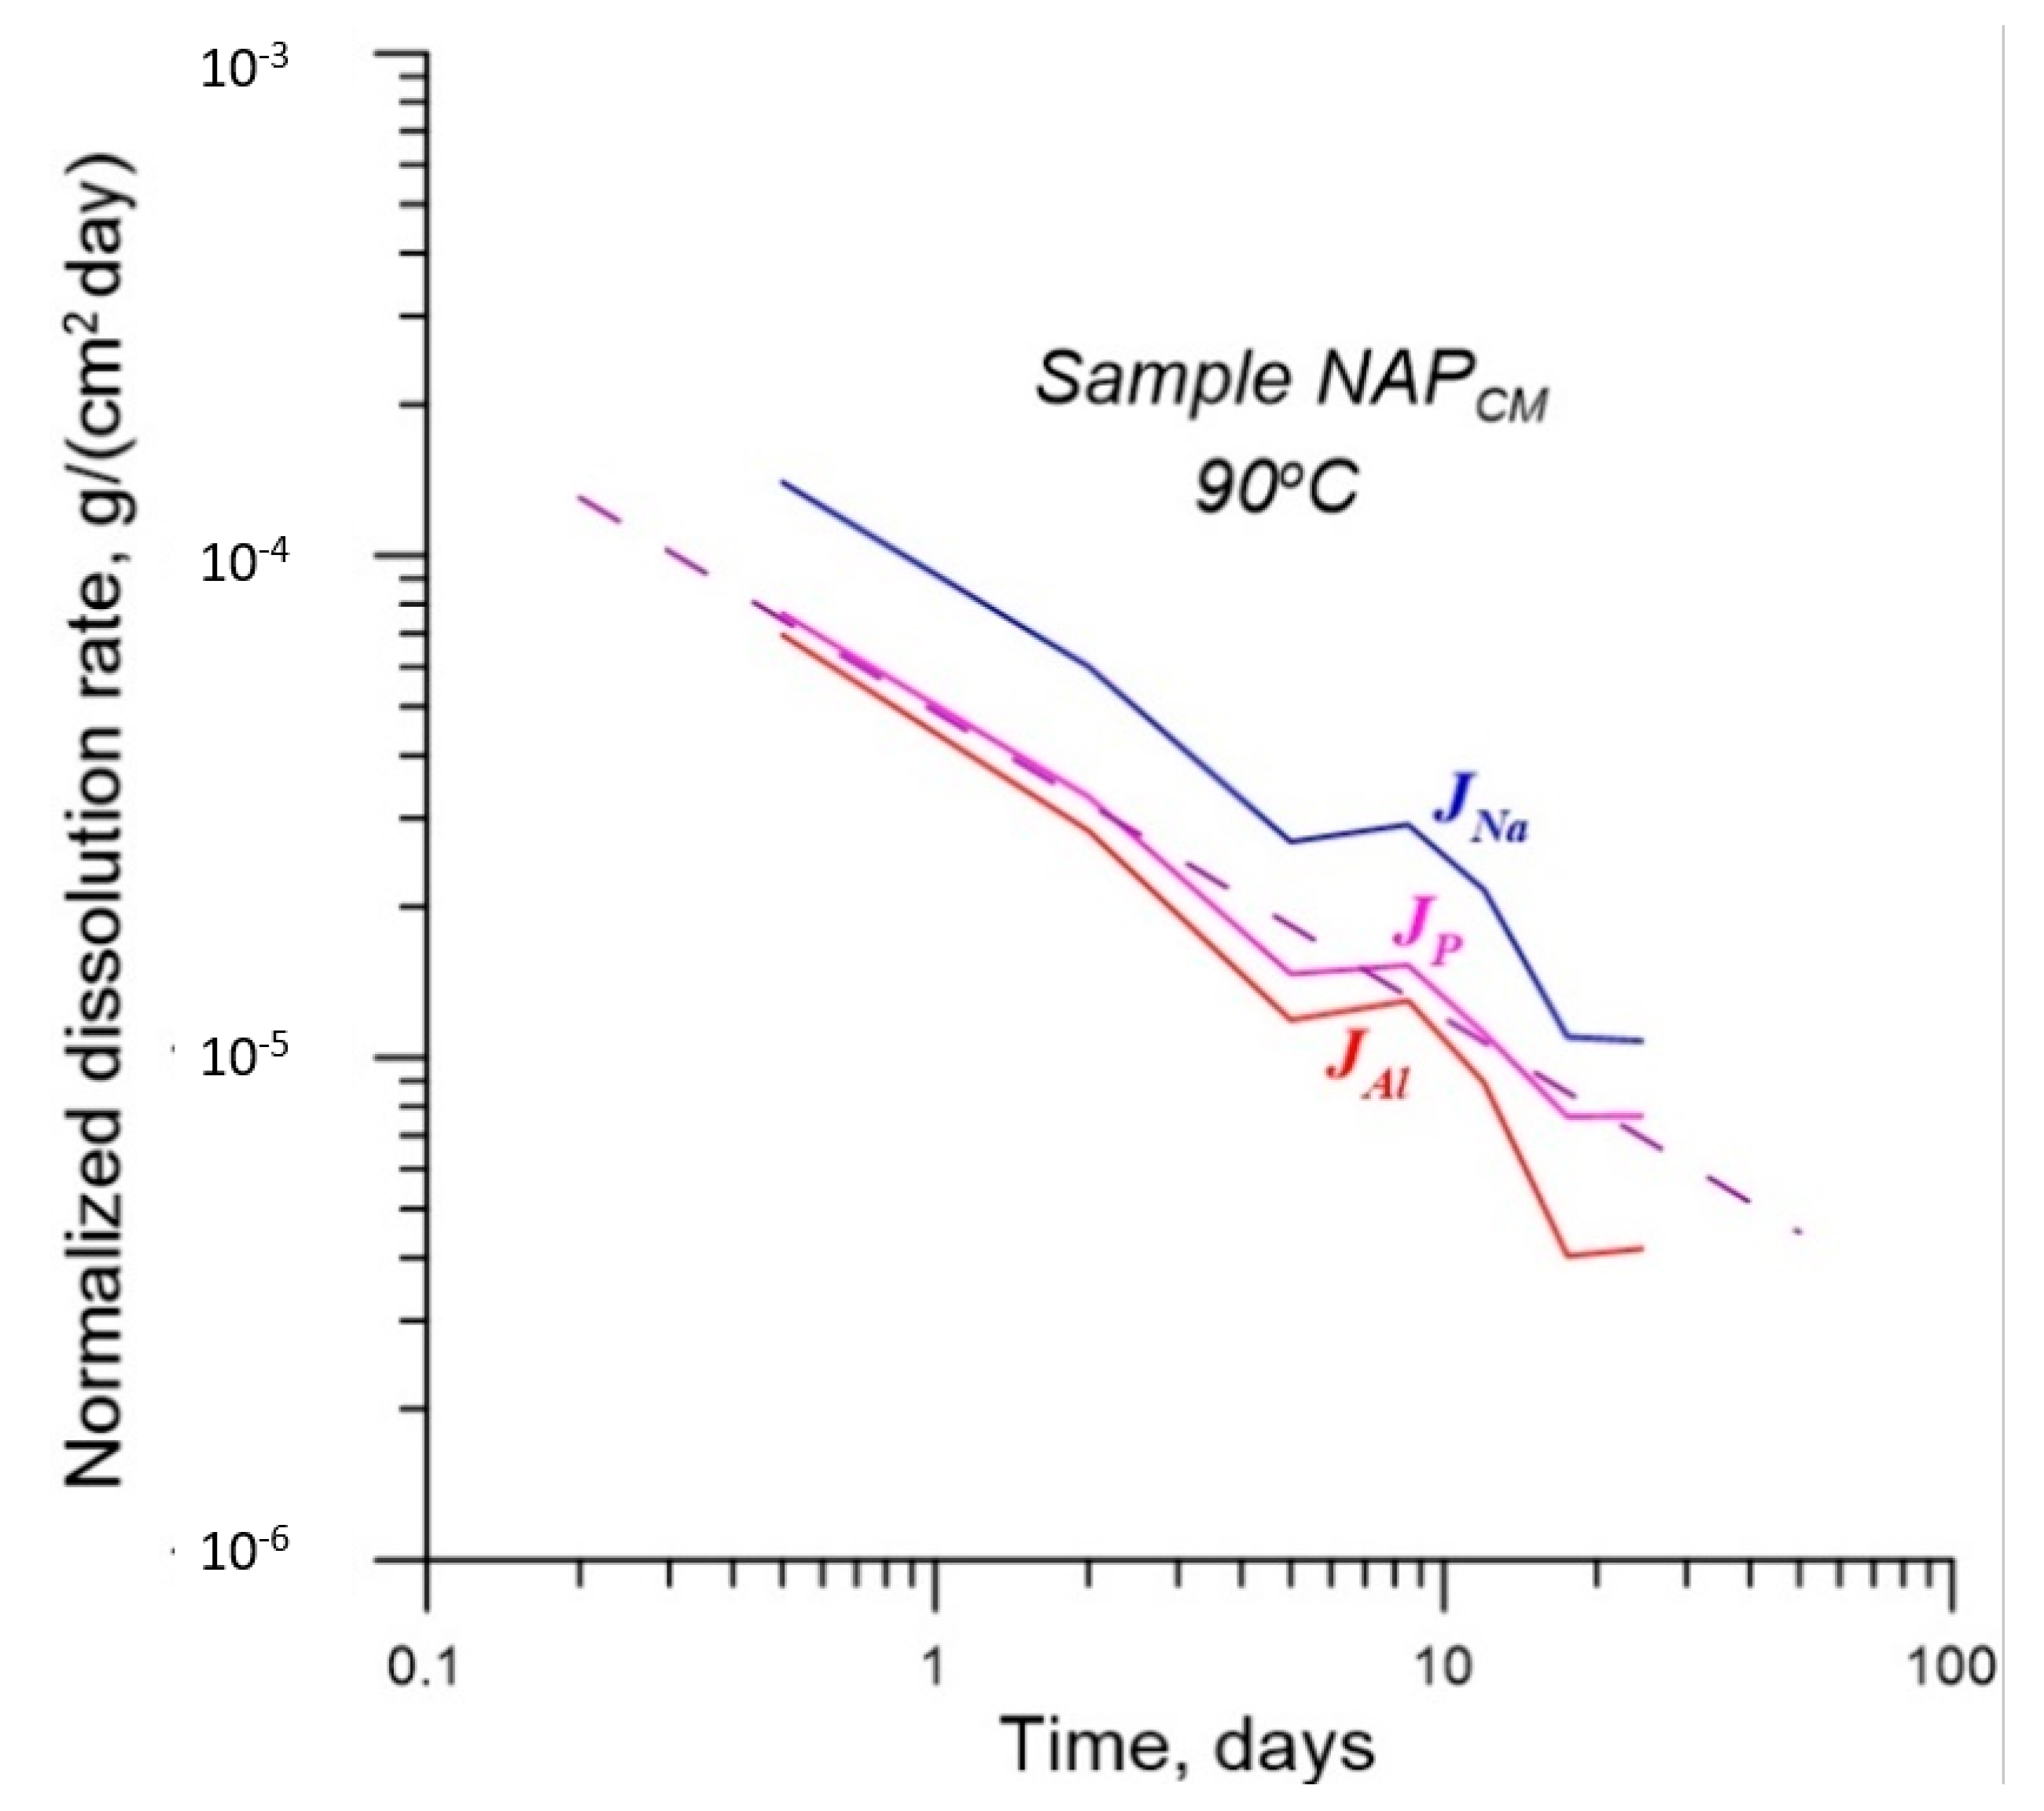
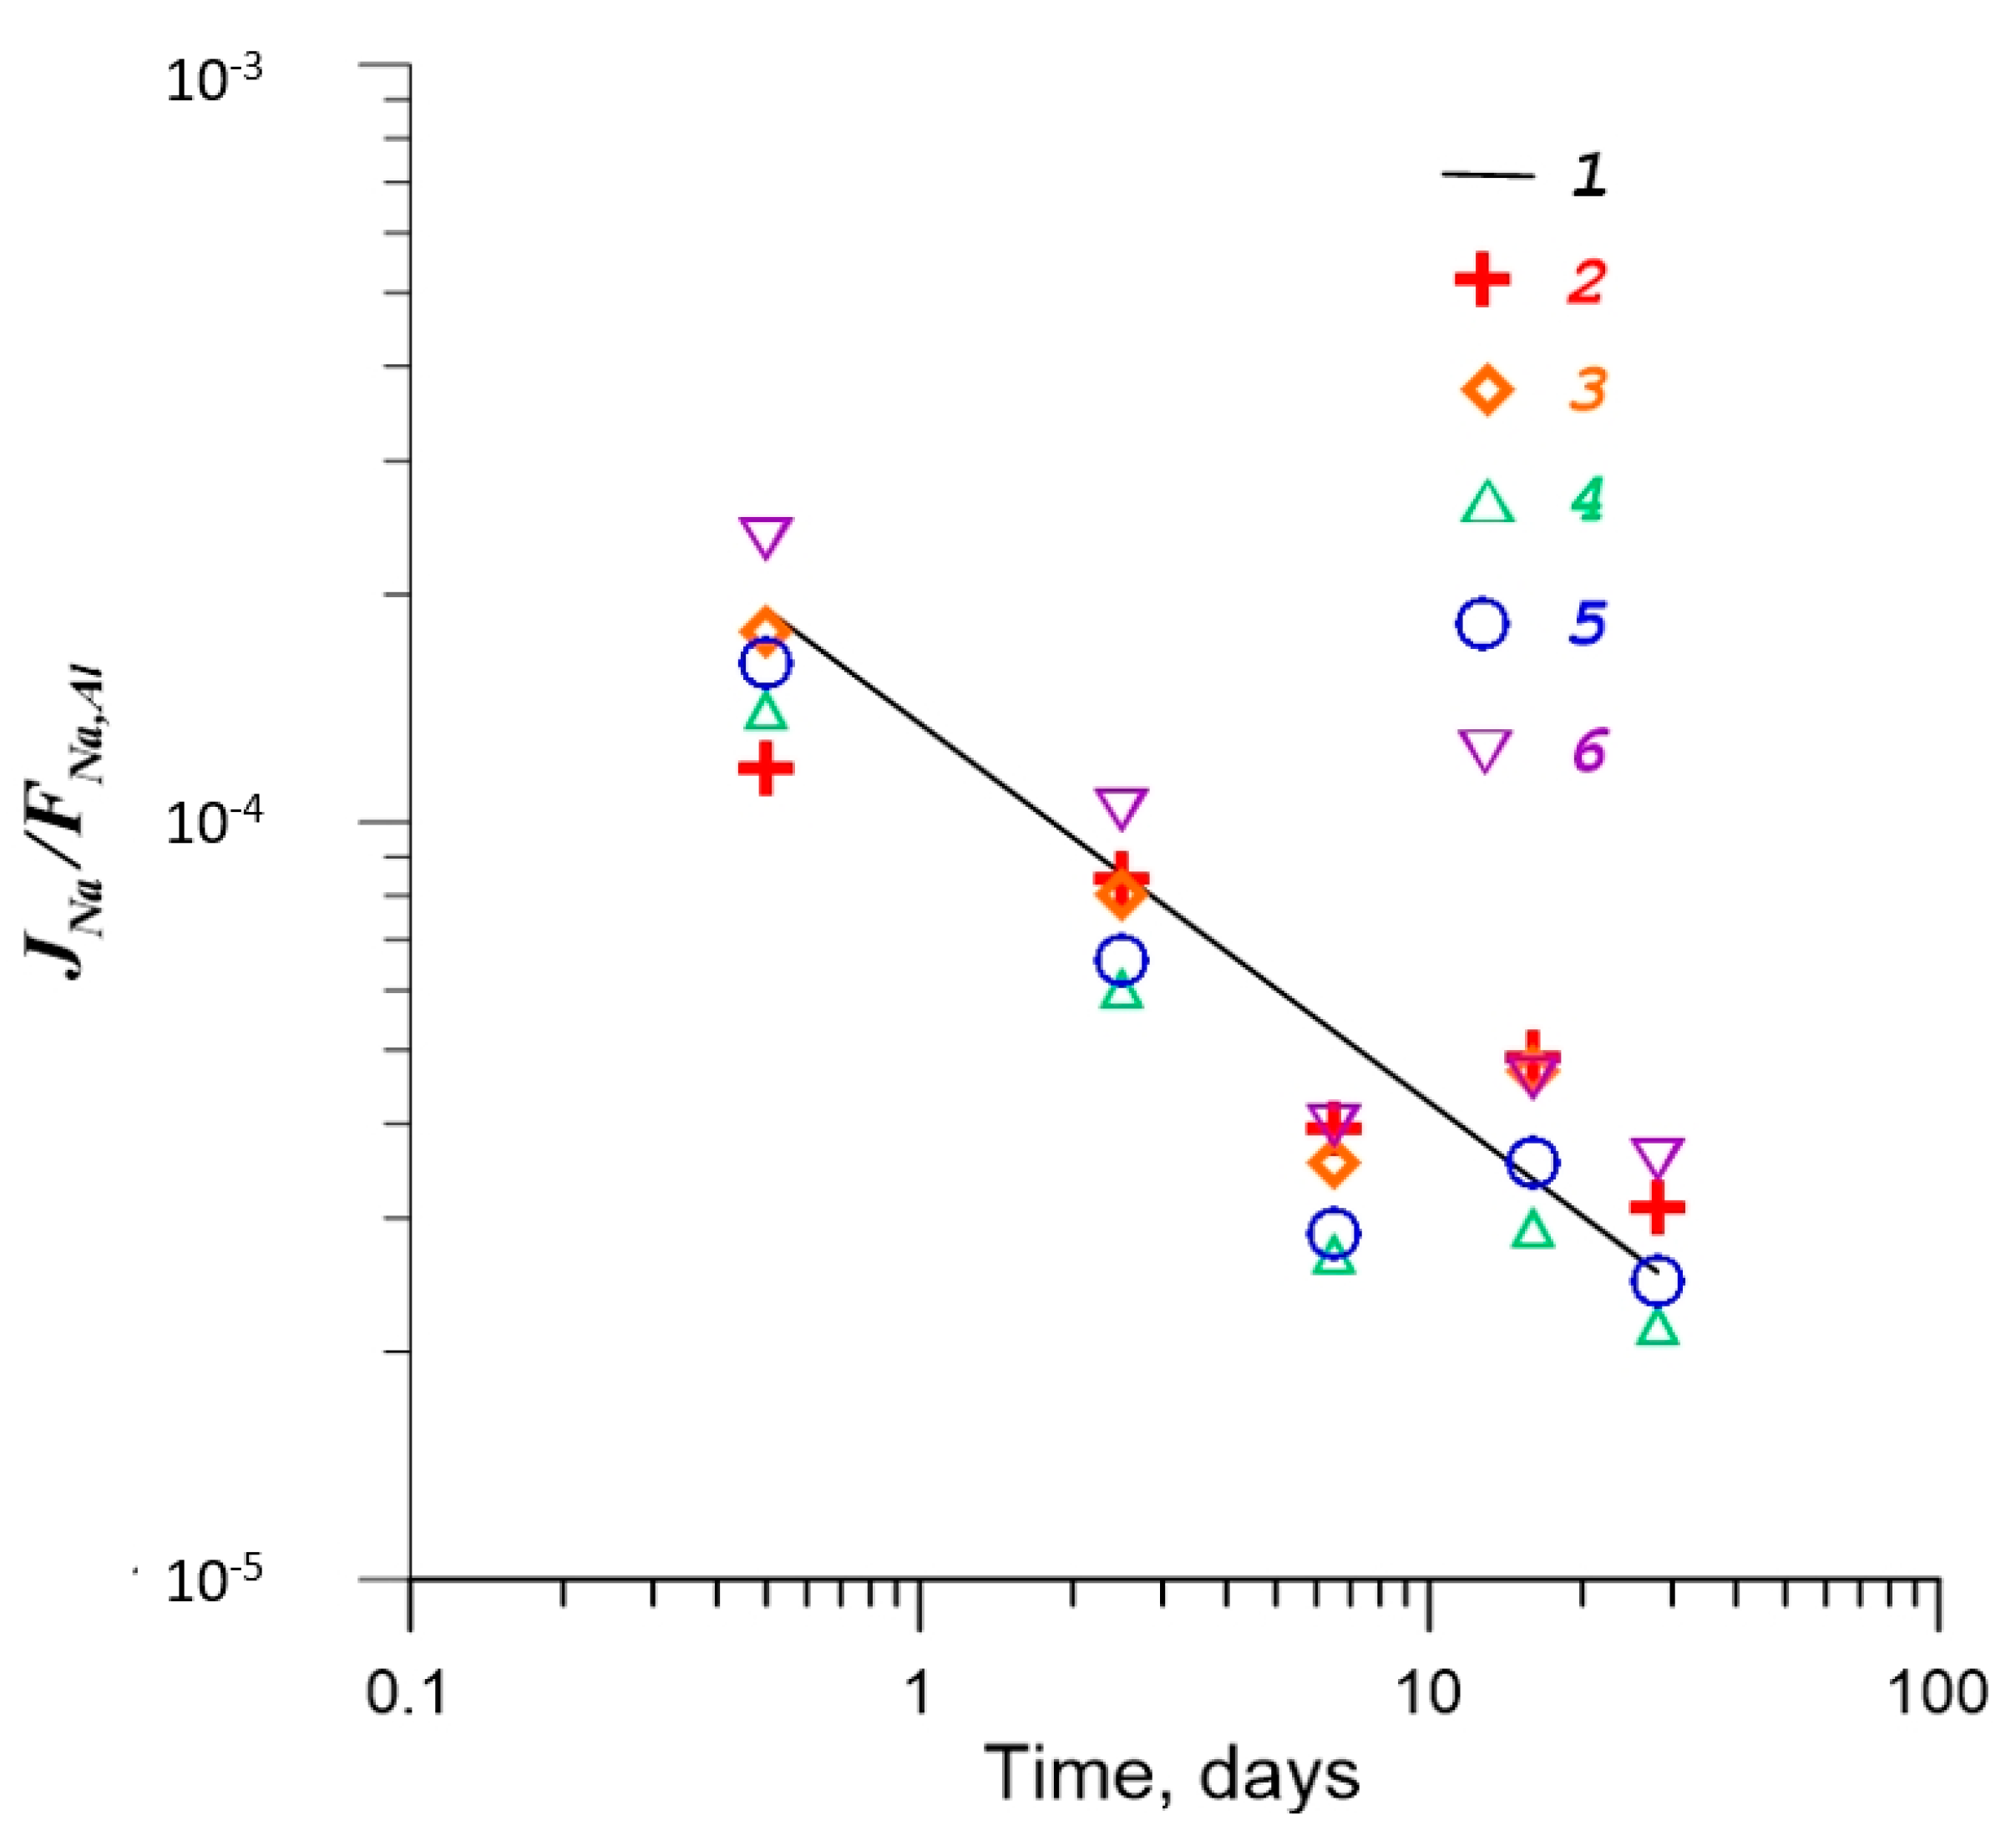
4.1. Hydrolytic Durability

Hydrolytic stability of aluminum–phosphate glass matrices was reported in References [11,44,45,46,47]. However, very few publications are devoted to the effect of self-irradiation of the glasses on structure and properties [11]. Therefore, analysis of the effect of irradiation on the leaching of glass matrices is the most important part of this work. To assess the chemical (hydrolytic) stability of glasses of different compositions, leaching experiments were performed. The leaching of glass samples (NAPas0, NAPas1, NAPcm0, NAPcm1, NAP1 and NAP2) was carried out in the water in autoclaves at 90°C; the solution was changed after 1, 3, 7, 10, 14, 21, and 28 days. Besides, similar leaching tests were carried out for samples NAPcm0 and NAPcm1 at 25°C. Due to the small amount of material and difficulties in the preparation of monolithic cubic or parallelepiped specimen, the samples were crushed. The particle size fraction in each sample was selected using sieves with mesh sizes of 0.16 mm and 0.071 mm. From average particles size, the surface area of the powdered glass (S) in runs was estimated to be 200 сm2.
Analysis of solutions after experiments on interaction with glass was carried out by inductively coupled plasma mass spectrometry on an X-Series instrument at the GEOKHI RAS (Vernadsky Institute of Geochemistry and Analytical Chemistry of Russian Academу of Sciences).
Let us denote the time at which the water was replaced (and the aliquot of the solution for analysis was taken) as {ti, i = 1, ..., 7}; t0 = 0. Then, for the time interval between ti−1 and ti, the differential dissolution rate of the glass, normalized by one of its main structural elements, is determined as
J E l = C E l V S ( t i t i 1 ) m E l ,
where CEl is the concentration of the glass element, which determines the normalized dissolution rate; V is the volume of the autoclave; S is the total surface area of the particles, mEl is the mass fraction of the element El in the glass. Since JEl is the average value of the normalized dissolution rate in the time interval between ti−1 and ti, when determining the function JEl(t), it is approximately attributed to the middle of this interval, i.e., at time τi = (ti−1 + ti)/2, since the smooth function is assumed.
Data on integral dissolution rates of the glasses investigated are presented in Appendix B. A typical dependence of the normalized dissolution rate of glasses on time is shown in Figure 7.
In general, all values of JEl decrease with time, which is consistent with the simplest diffusion models for the advancement of the leach front. However, at τi = 8.5 days, a local maximum occurs. Such jumps in JEl values were noted in many studies on the leaching of borosilicate glasses [26,48,49,50,51,52]; they are termed as leaching resumption stage. The presence of these events is typically explained by redeposition of sparingly soluble matrix components as secondary phases. The formation of these phases circumvents the protective effect of the altered glass layer, which acts as a barrier against leaching [53,54]. However, this explanation cannot be considered exhaustive, since in many works, the effect of leaching recovery was not observed, although secondary phases were also deposited on the glass surface. An alternative explanation is the formation of micro-cracks on glass surface [26]. In the case of investigated NAP glasses, the presence of the local maximum is neither an artifact nor a random deviation, as proved by maxima of JEl(t) in experiments with other glasses (Figure 8).
In all the samples studied the mass fraction of phosphorus is approximately the same. In addition to the presence of modifiers in samples NAPcm, NAPcm0, NAP1 and NAP2, significant differences of these four types of glasses from samples NAPas0 and NAPas1 relate only to the ratio of mass fractions of sodium and aluminum. Analysis of values of JEl (t) in these two groups of glasses shows that glasses with a higher mass content of aluminum dissolve more slowly in water, i.e., have smaller JEl(t) (Figure 8).
Analysis of JEl(t) over the entire range of time values shows that for all t, the ratio JEl(t) for sample NAPas1 and samples NAPcm, NAPcm0, NAP1, and NAP2 for all elements for which the normalized dissolution rate was calculated, has close values apart from the unreliable value of JEl(t) for NAPcm0. The dependence of JEl(t) on the ratio of sodium and aluminum in phosphate glasses has the form
J E l ( t ) = J E l 0 ( t ) f ( m N a / m A l ) ,
where J E l 0 ( t ) is a function that does not depend on the ratio mNa, mAl, e.g., mass fractions of sodium and aluminum in glasses.
Dependences JEl(t) are satisfactorily approximated by power functions of the form (see Figure 7):
J E l ( t ) = A t 0.6 ,
where A is a coefficient depending on a certain element by which the normalized dissolution rate of the glass is calculated, and on the ratio of the mass fractions of sodium and aluminum in the glass composition. Values of normalized dissolution rates calculated for different elements satisfy the inequalities:
J A l ( t ) < J P ( t ) < J N a ( t ) .
This seems to be well justified: Sodium passes into solution more easily than phosphorus, and that, in turn, is easier leached compared to aluminum. If values of JNa(t) are used in the estimate of the safety of repositories to calculate leaching rates, then this estimate will be conservative (i.e., pessimistic). In this regard, it seems appropriate to find such a form of the analytic function J N a a p p r ( t ) that approximates with satisfactory accuracy (with the mean-squared error of about 30%) the dependences obtained from experiments in the entire range of ratios mNa and mAl studied. Accounting for Equation (2), we seek this analytical approximating dependence in the form
J N a c a l c ( t , m N a / m A l , a , b ) = a t 0.6   e x p { b ( m N a / m A l 2.5 ) } ,
where a, b are unknown parameters that we will determine by the least-squares method [55] from the condition
Φ ( a , b ) = m N a / m A l     n = 1 5 [ J N a c a l c ( t n , m N a / m A l , a , b ) / J N a e x p e r ( t n , m N a / m A l ) 1 ] 2 m i n
The procedure for finding the minimum of the function Ф was carried out by the gradient method with the control of convergence as follows [53]. The initial approximation was set: a 0   = 9 · 10−5, b 0 = 0.8 Then, with the known n-th approximation—an, bn—the (n+1)-th approximation was determined by the formulae
a n + 1 = a n Φ a δ n ,                 b n + 1 = b n Φ b δ n      
Here we have
δ n = 1 2 m m i n { | a n | | Φ / a | ,     | b n | | Φ / b | }
where m is the minimum positive integer under which the condition for convergence of the method is satisfied:
Φ ( a n + 1 , b n + 1 ) < Φ ( a n , b n )
The minimum function Φ (a,b) found in this way from the data on the leaching rate of Al is reached at a = 1.183 · 10 4 ,   b = 0.75 . Therefore, if we substitute these values of the parameters into dependence (5), it will have the form
J N a c a l c ( t , m N a / m A l , a , b ) = 0.0001183 t 0.6   F N a , A l
where [JNa] = g/cm2 · day, [t] = day, F N a , A l = exp { 0.75 m N a / m A l 1.875 } . The calculated dependence (9) is compared with the experimental data on the leaching of glasses (Figure 9) and shows a satisfactory accuracy of the approximation of experimental data by power functions.
The temperature has a significant effect on the leaching of sodium–aluminum–phosphate glasses [54]. A comparison of the JEl(t) dependences obtained on the NAPcm0 sample in experiments at 90 °C and 25 °C for different structural elements of glass is shown in Figure 10.
The dependence of leaching rates on temperature, as well as the intensity of many chemical reactions, can be described by the Arrhenius formula:
J E l ( T ) = J · exp { E a R T } ,
where Ea is the activation energy, and R is the gas constant (R = 8.3 J/(mol · K)).
As noted above the final portion of JEl(t) dependences of NAPcm0 can be ignored. Thus, for calculating the JEl(t) ratios at different temperatures, only two time points remain, e.g., 5 and 8.5 days. The values of the relations JEl(t) at different temperatures T at these points are given in Table 7.
The average value over Table 7 is 3.62. Then we get from expression (11) ln   3.62 = E a R ( 1 363 + 1 298 ) , therefore for glass NAPcm0 we obtain E a = 17.7 кJ/(mol · К). In a similar manner, we consider the JEl(t) ratios at temperatures of 90 °C and 25 °C of NAPcm1 glass. These data are given in Table 8. The average over Table 8 value of the ratio of leaching rates at 90 °C and 25 °C, in this case, is 3.92. Hence, the activation energy of dissolution of glass NAPcm1 is Ea = 18.9 kJ/(mol · K). This value is close to the previously calculated value of 17.7 kJ/(mol · K) for NAPcm0, which supports the correctness of the results. Note, however, that these activation energies are significantly lower compared with those in borosilicate nuclear waste glasses, which are more durable in water [56].

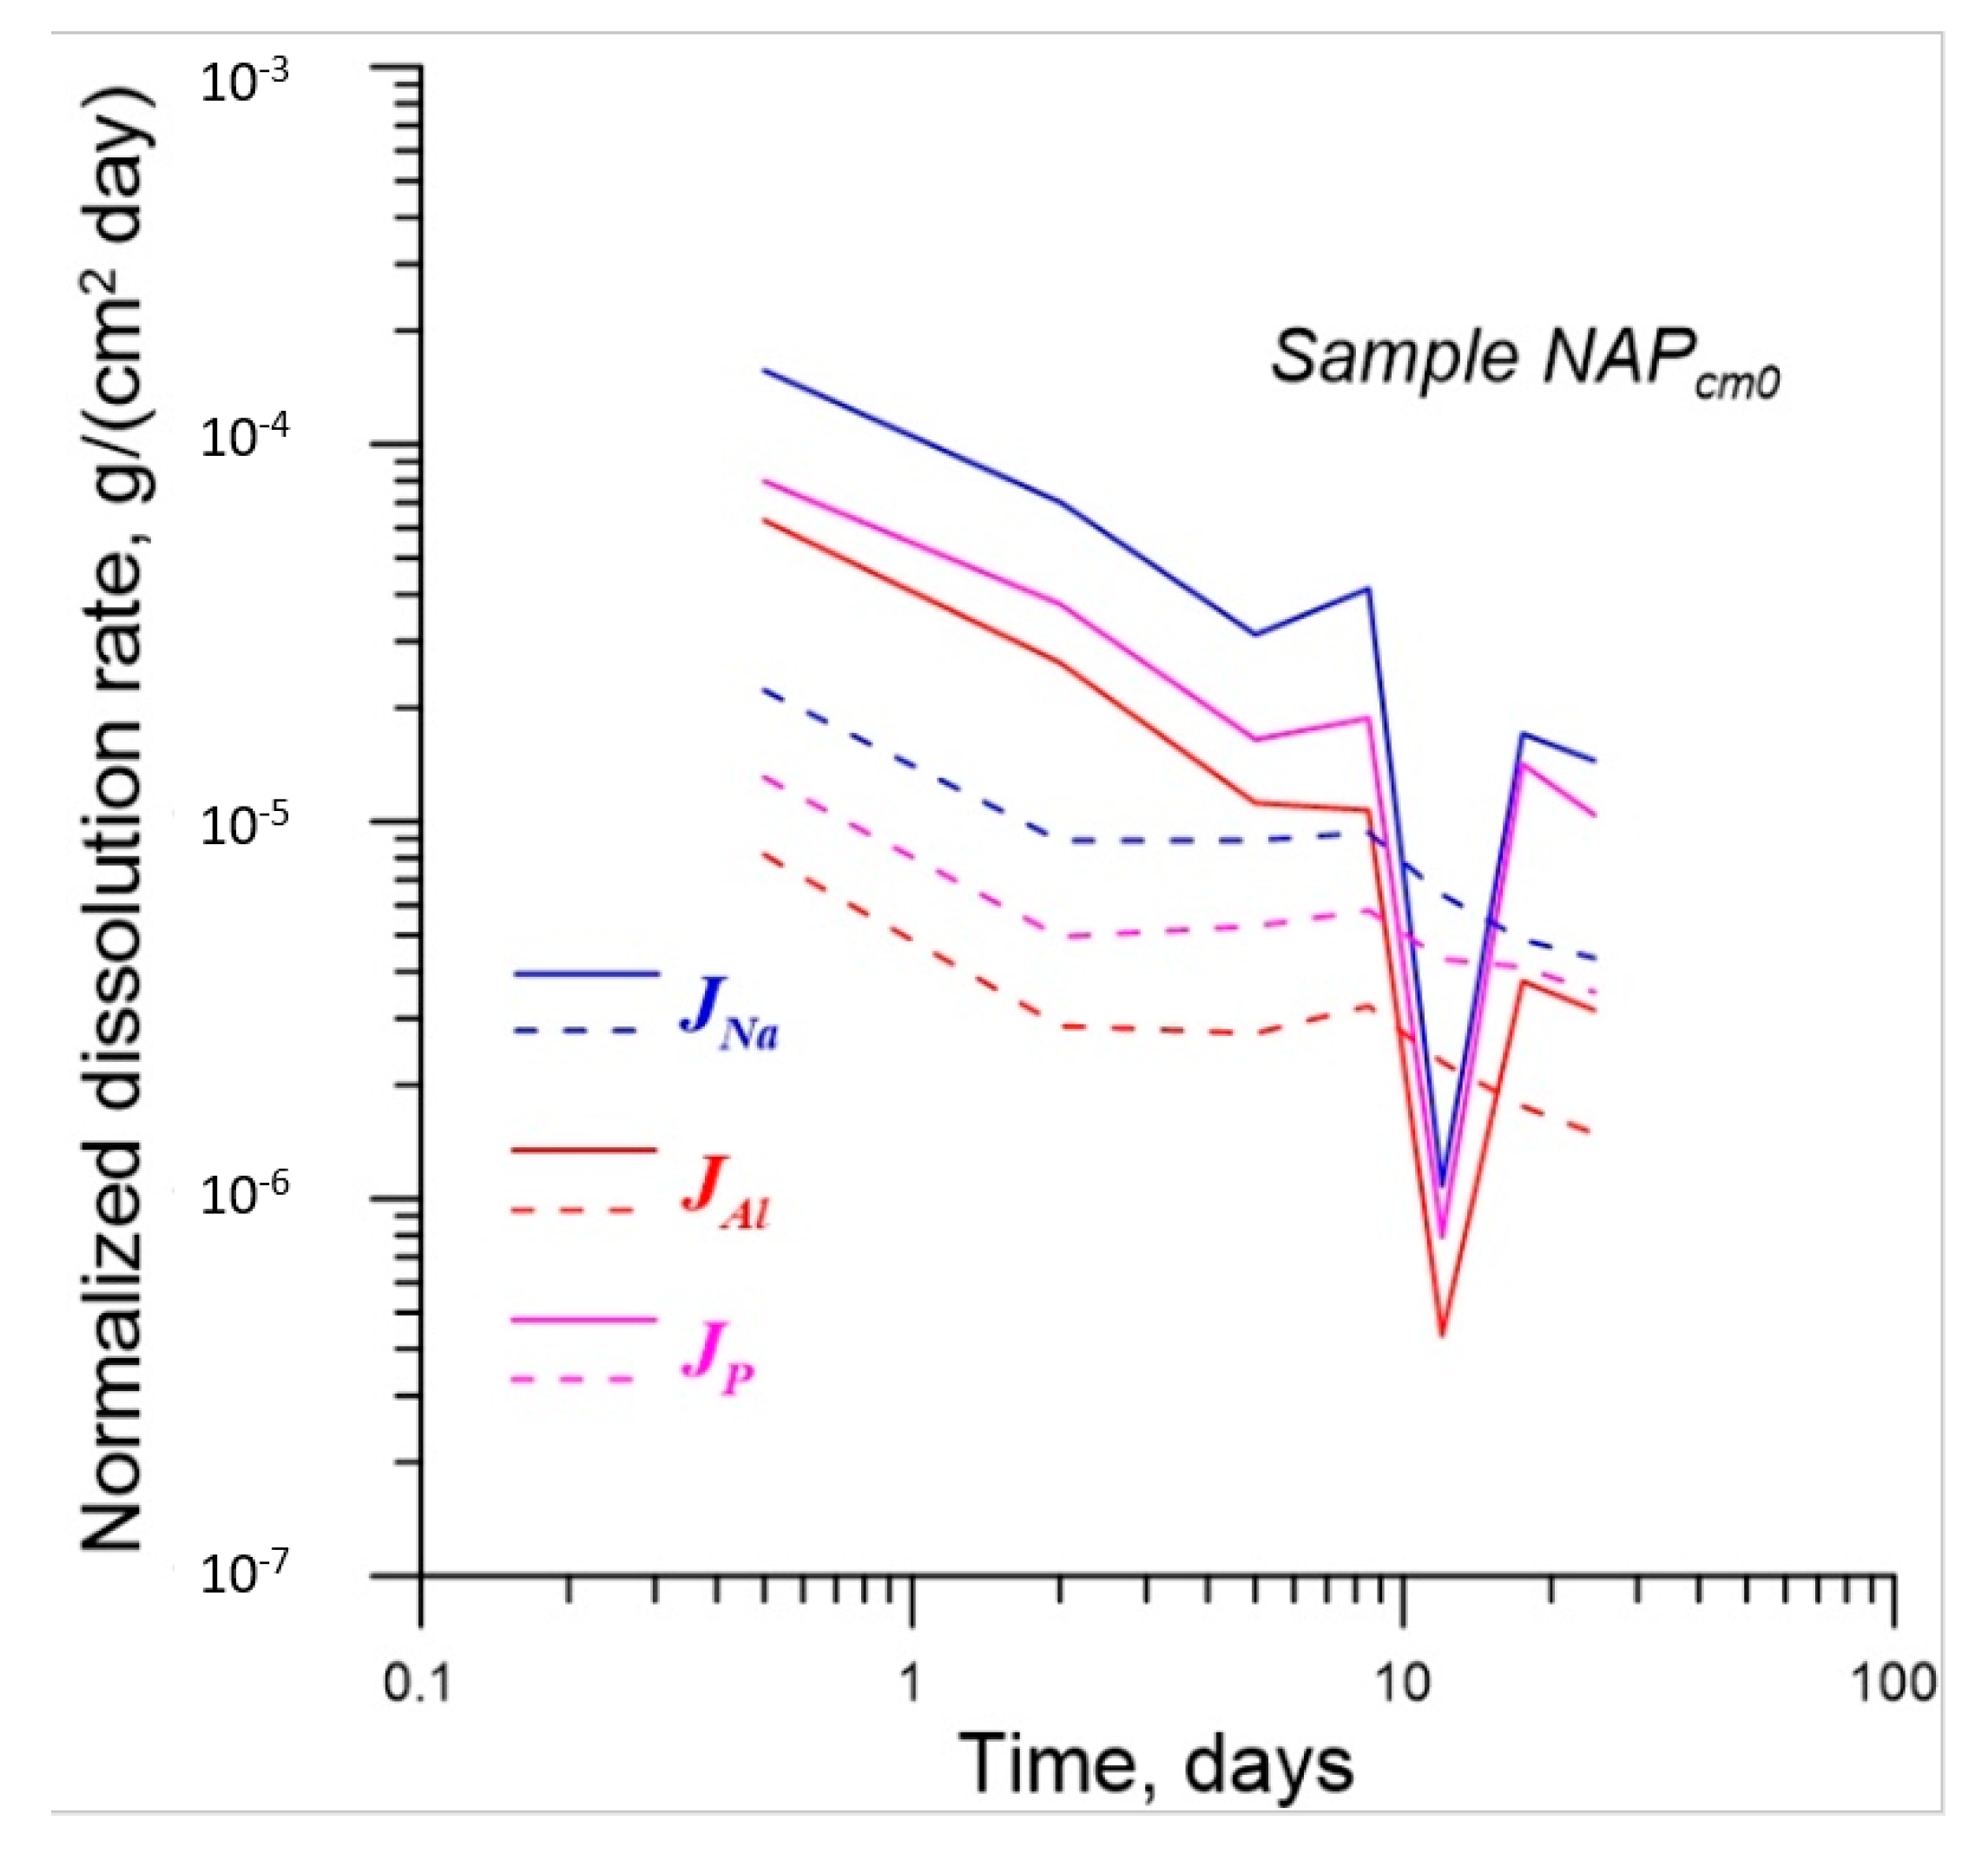
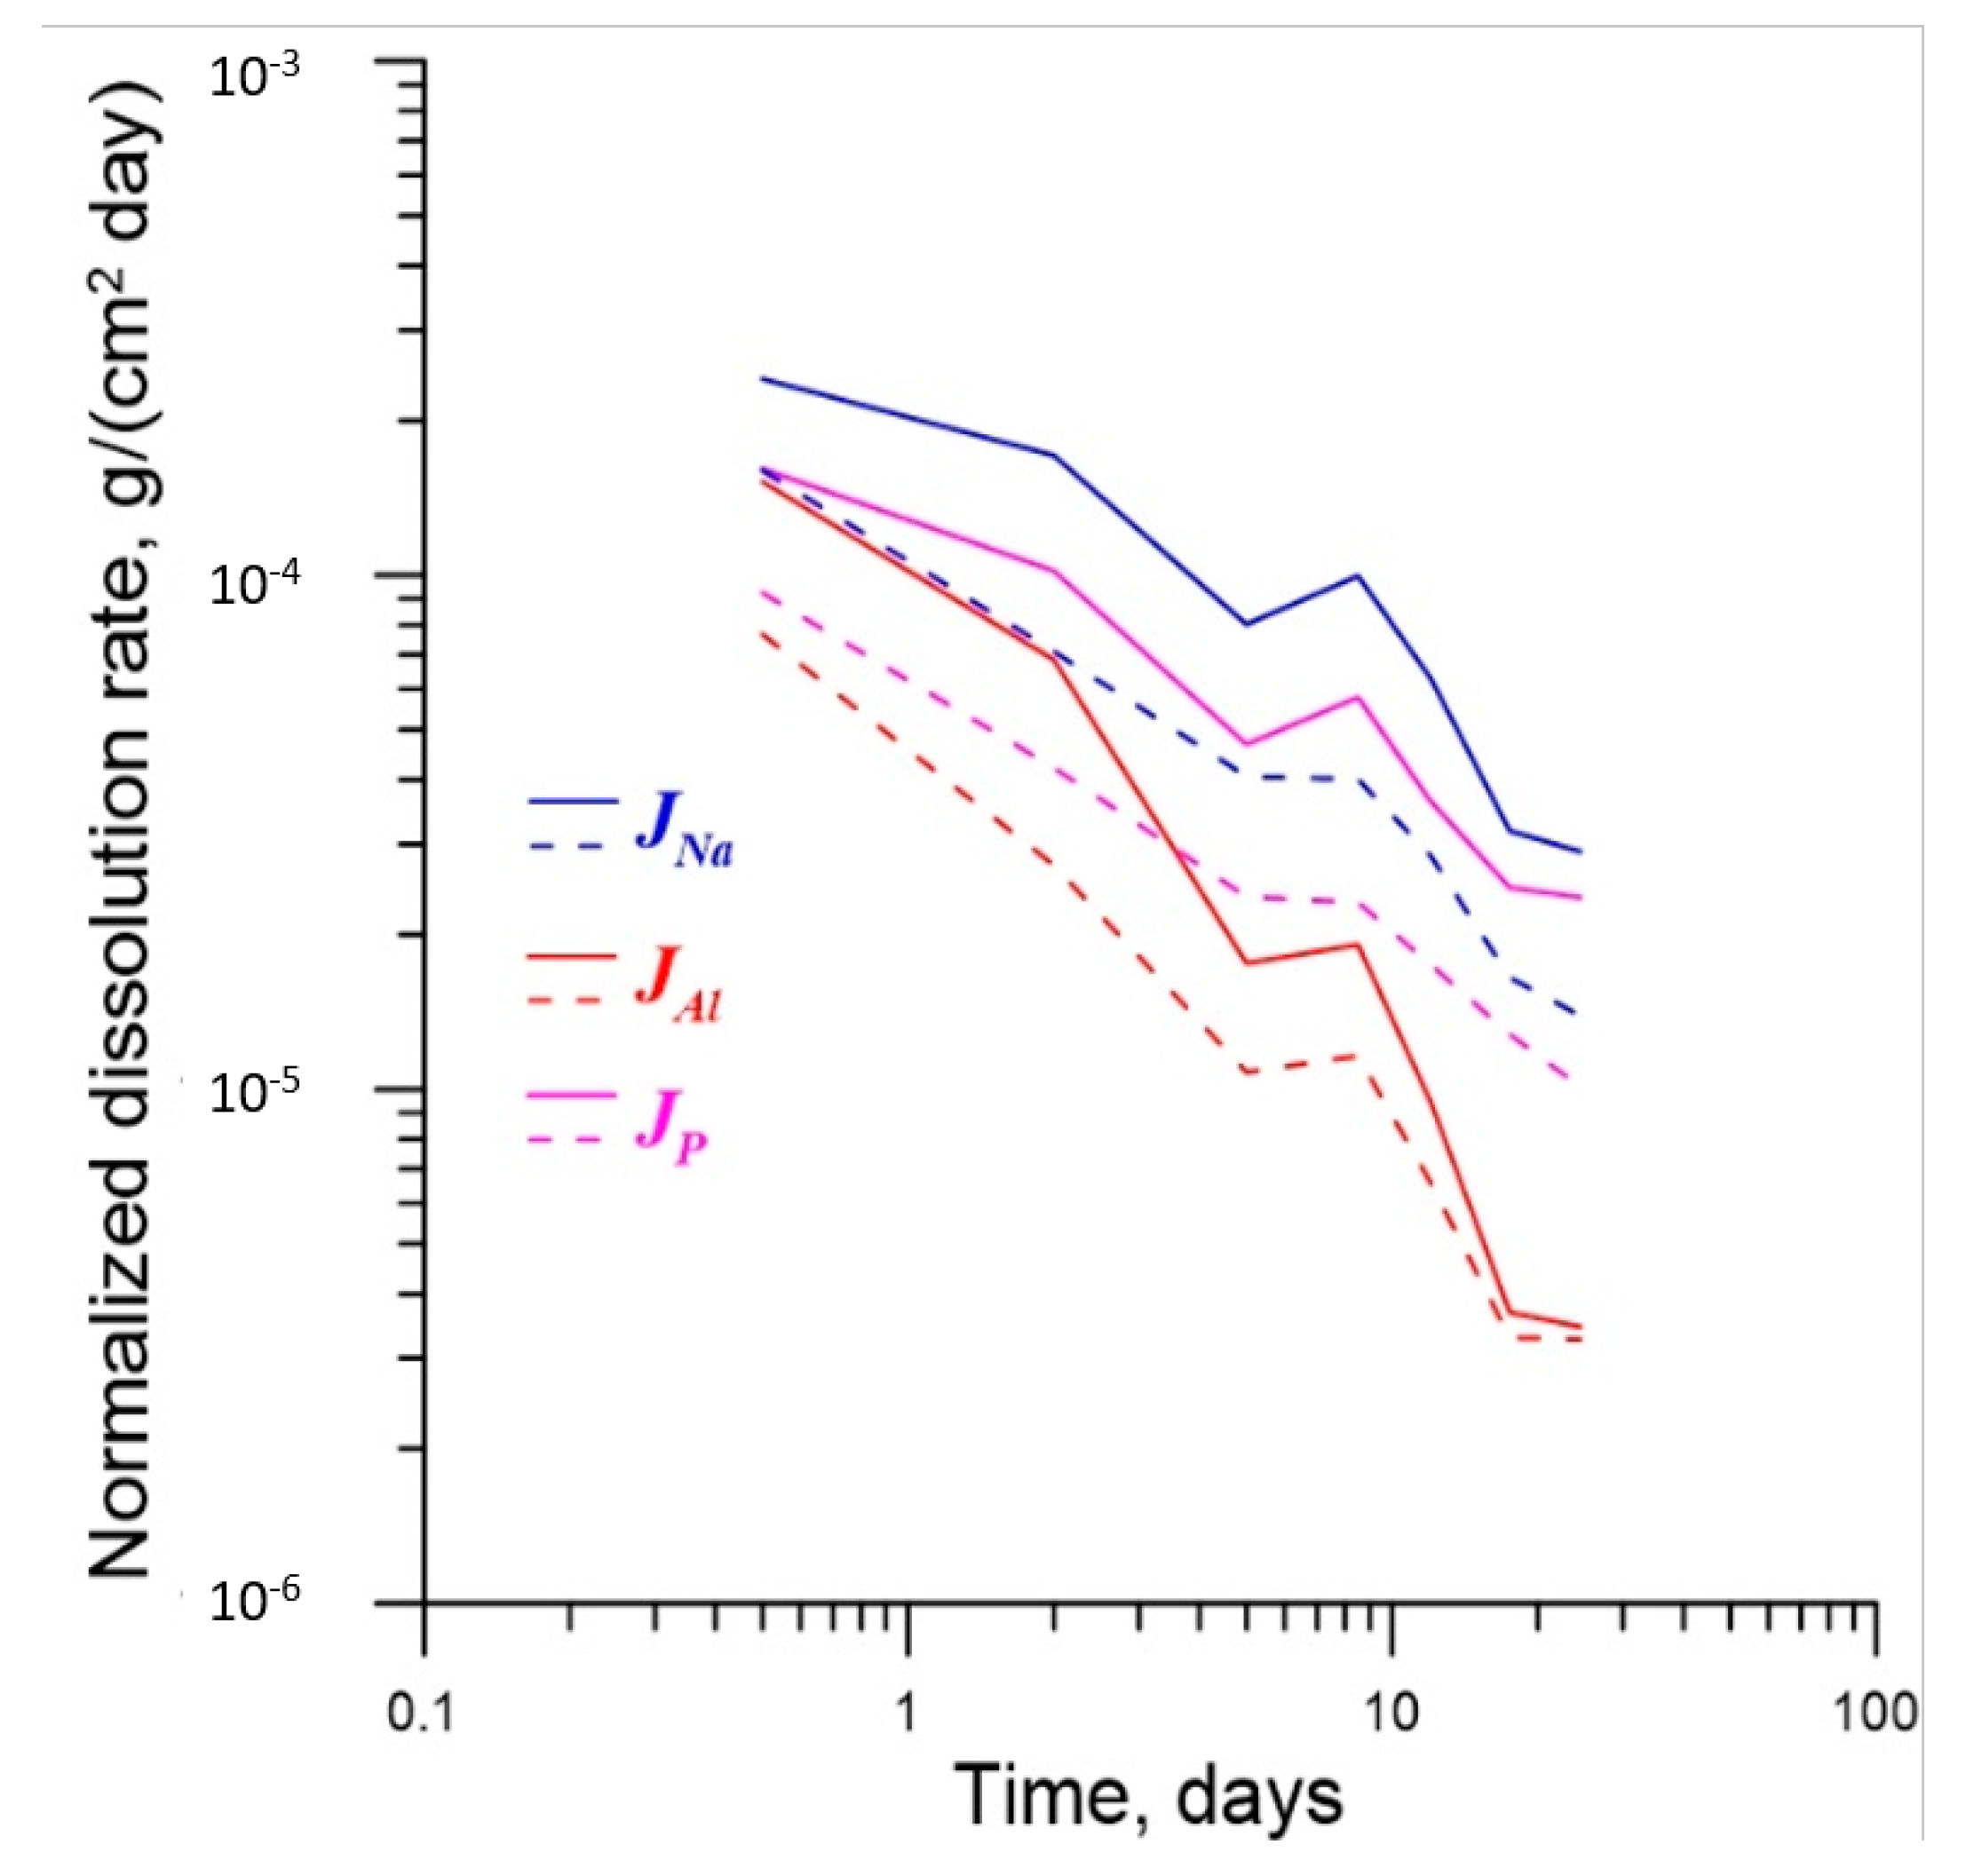
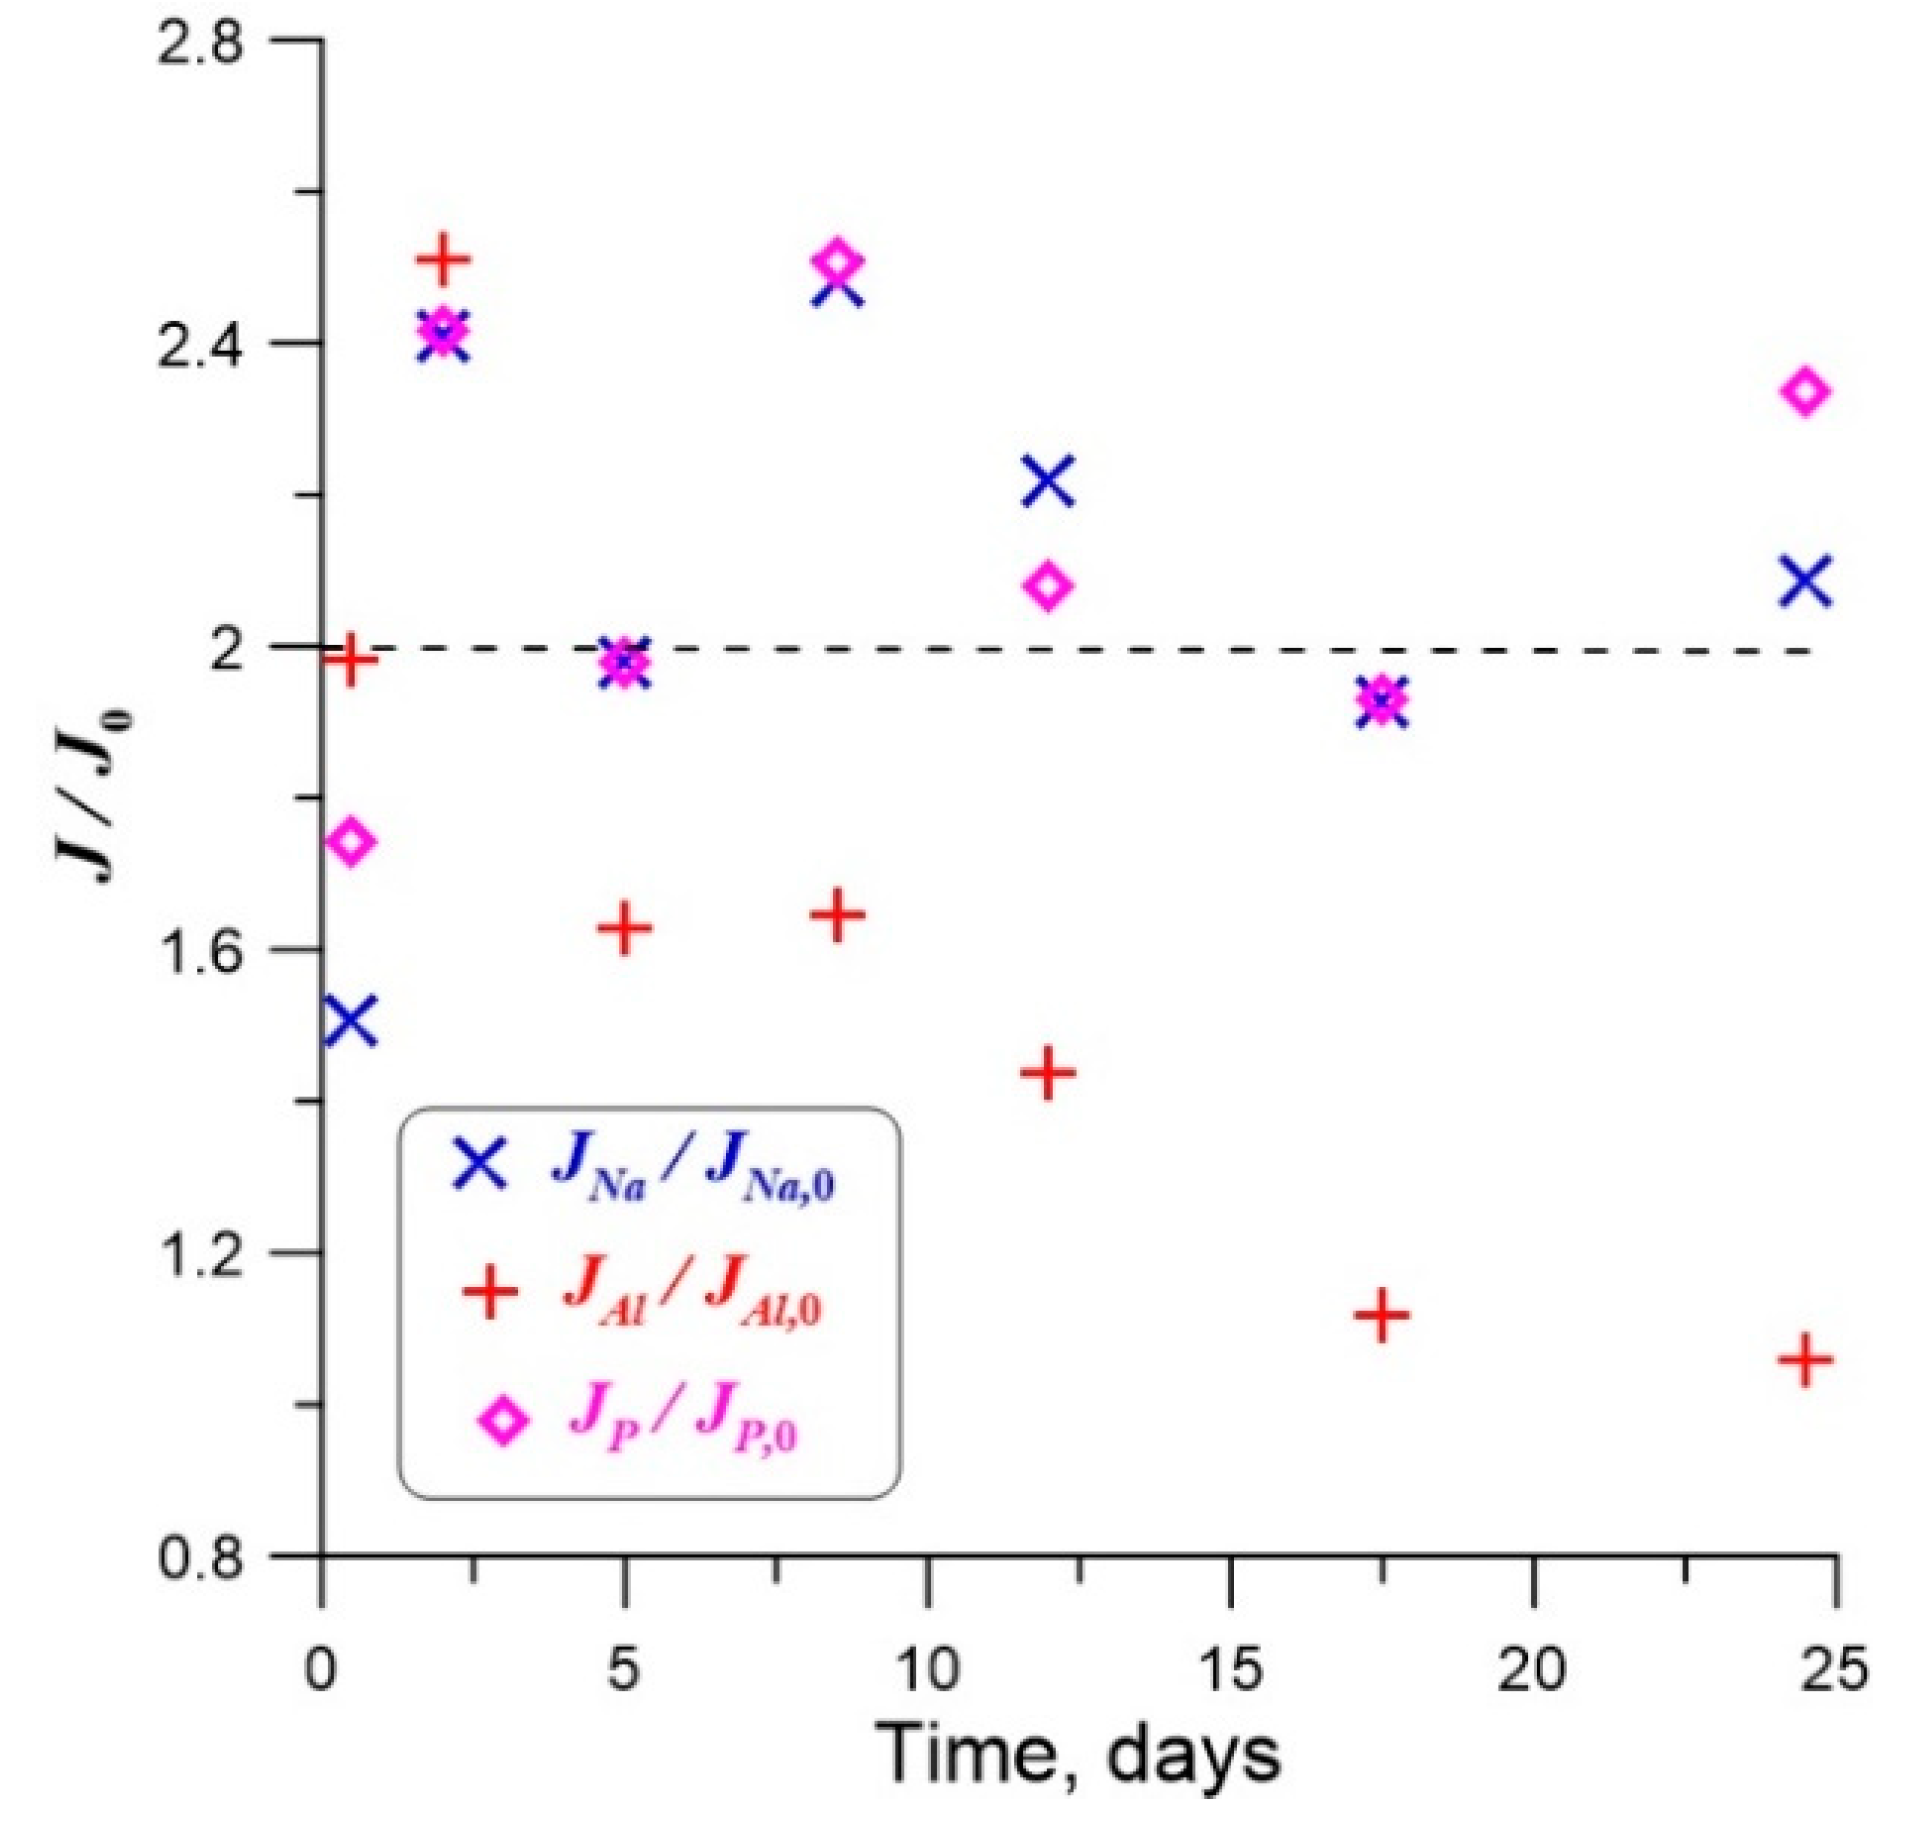
4.2. Effect of γ-Radiation on Dissolution of Glass

Effects of irradiation of glasses on their dissolution behavior remain insufficiently studied, but recent works on International Simple (borosilicate) Glass showed that it is indeed necessary to take into account radiation damage effects in the prediction of water-glass interaction in HLW repository [57]. The absolute majority of irradiation experiments employ much higher dose rates than is expected in real HLW. Whereas, the dose-rate effect is difficult to estimate consistently, one can reasonably expect that higher rates may alter the mechanism of radiation damage (e.g., cascade overlap vs. defects accumulation) and influence recovery kinetics. Presumably, in most cases, the influence of high dose rates on dissolution in irradiation experiments will be larger than in real HLW glasses.
Only very few studies addressed the effects of irradiation on properties of aluminum–phosphate glasses. In Reference [58] it was shown that during electron irradiation of aluminum–phosphate glass gas bubbles were formed even at low doses (0.8 · 1023 electrons/m2). As the absorbed dose increases, the bubbles grow, and they move towards the glass surface. At a dose of 2.2 · 1026 electrons/m2 (6.6 · 1011 Gy) all bubbles leave the glass sample. With further exposure of the glass to a dose of 4.5 · 1026 electrons/m2, areas enriched in Al and P appeared. Sodium–aluminum–phosphate glasses were irradiated to a dose of 108 Gy (electrons and γ-photons), and up to 2 · 1018 α-decays/cm3 [11]. These values are close to the radiation dose that real vitrified HLW will receive in 10,000 years. Study of the irradiated glass samples by x-ray diffraction analysis, nuclear magnetic resonance and electron paramagnetic resonance, showed absence of changes in the matrix structure [11]. It was also found that in experiments lasting one day, the rate of Na leaching at room temperature increases with the rise of radiation dose up to 108 Gy, but its value remains constant or slightly decreases after 30 days of interaction, amounting to 4 · 10−7 g/(cm2·day). The damage during gamma-irradiation is mostly due to Compton electrons, thus, the studies employing electrons mentioned above are fully relevant.
A comparison of data on the dissolution of NAPas0 and NAPas1 glass samples is shown in Figure 11. On a logarithmic scale, the dependency graphs JEl(t) for the same structural elements obtained on samples NAPas0 and NAPasa1 run approximately parallel to each other. This suggests that over the entire time range, the ratio JEl(t) obtained for the initial and irradiated glasses remains roughly the same. The ratios of values of JEl(t) obtained on samples of the pristine NAPas0 and irradiated NAPas1 glasses at 90 °C are given in Table 9. The average value over the whole table is 2.03; the data of Table 8 and Table 9 compared in Figure 11.
Figure 12 shows that the JEl/JEl0 ratios obtained on samples NAPas0 and NAPas1 remain close to 2 through the entire studied range of duration of runs.
Thus, as a result of γ-irradiation, the leaching rate of the sodium–aluminum–phosphate glass has averagely decreased by about 2 times. This can be caused by undetectable structural changes such as radiation-induced annealing that occurs in some other type of glasses [22]. Much higher effect on the deterioration of properties of the aluminum–phosphate vitreous waste form, including their solubility in hot water, is observed due to glass crystallization in temporary storage and after ultimate disposal in deep underground repository [11,14,15,36,37,38,39,40,43,44,45].

5. Conclusions

Six samples of glasses used in Russia for HLW immobilization were investigated before and after irradiation. The studied sodium–aluminum–phosphate glasses studied are divided into two compositional groups: Group 1—samples NAPas0 and NAPas1, which are glasses of simple composition (i.e., only principal oxides); group 2—samples NAPcm0, NAPcm, NAP1, NAP2—glasses of a modified composition with additives of radionuclide simulants. Each group contains one unirradiated sample and the same samples after their irradiation to a dose of 62 MGy at the gamma source of FSUE RADON.
Using SEM/EDS, XRD, Raman, and infrared spectroscopy, it was established that samples of the simple composition of group 1 are composed only of the glass matrix. In samples of group 2, in addition to dominating glass matrix, precipitates of the crystalline phases (up to 10 vol.%) of aluminum–phosphate, and a small amount (a fraction of vol.%) of ruthenium dioxide are observed. Dissolution behavior of glasses was analyzed at 25 and 90 °C. According to the results of comparison of pristine and irradiated glasses, it was found that irradiation with a dose of 6.2 · 107 Gy had practically no important effect on the structure and composition of samples. Simultaneously, it was found that the rate of leaching of elements from irradiated samples decreased by approximately two times.

Author Contributions

Conceptualization, A.V.L., V.A.P. and S.V.Y.; methodology, S.V.Y. and V.I.M.; software, V.I.M.; validation, S.V.Y., V.I.M. and M.I.O.; investigation, M.S.N., A.A.S., S.S.D. and E.E.O.; data curation, S.V.Y., V.I.M. and M.I.O.; writing—original draft preparation, S.V.Y. and V.I.M.; writing—review and editing, S.V.Y., V.I.M. and M.I.O.; visualization, S.V.Y., V.I.M. and M.I.O.; supervision, S.V.Y. and M.I.O.; project administration, S.V.Y.; funding acquisition, A.V.L., V.A.P. and S.V.Y. All authors have read and agreed to the published version of the manuscript.

Funding

The study was funded by the FSUE “Radon” under Agreement with State Corporation “Rosatom” and from the Federal budget within the framework of the state tasks of scientific investigations for the IGEM RAS.

Acknowledgments

The research was carried out under Agreement between FSUE “Radon” and State Corporation “Rosatom” and in according with topic of scientific research within the framework of the state task of the IGEM RAS funded from the Federal budget. We are indebted to O.I. Stefanovsky for assistance at synthesis of the samples investigated; to B.S. Nikonov for participation at SEM/EDS study and to A.A. Averin for help in Raman measurements. Authors are also grateful to anonymous reviewers whose valuable comments helped to improve this paper.

Conflicts of Interest

The authors declare no conflict of interest.

Appendix A. Raman and Infrared Spectra of Sodium–Aluminum–Phosphate Glasses Investigated

Appendix A1. Raman Spectroscopy

Raman spectra are shown in Figure A1. The measurements were performed in quasi-backscattering geometry without sample preparation on macroscopic glass samples. The size of the laser spot on the sample was 2–3 micrometers.
Figure A1. Raman spectra of the initial and irradiated samples: (A) With a simple composition (AS0—initial, AS1—after irradiation); (B) with a complex composition (CM0—initial, CM1—irradiated); (C) No1 and No2)irradiated).
Sustainability 12 04137 g0a1
The spectra contain bands because of the vibrations of the aluminum–phosphate groups. Narrow peaks due to crystalline phases are observed in many spectra, but their amount is small. There is no difference between the spectra obtained in these measurements, which indirectly indicates sufficiently high radiation stability of the material.

Appendix A2. Infrared Spectroscopy

Infrared spectra of samples are shown in Figure 8. The rise in the background with increasing wave number is due to light scattering by glass particles in the salt matrix. As for the Raman spectra, vibrational bands of Al–P groups are observed at the IR spectra of the glasses. The data obtained allow us to conclude that difference between the initial and irradiated glasses is not observed (Figure A2).
Figure A2. Infrared absorption spectra: (A) NAPas0—AS0 initial, AS1 after irradiation; (B) NAPcm0—CM0 initial and NAPcm1 (CM1)—irradiated; (C) NAP1 (No1) and NAP2 (No2)—irradiated. The narrow peak at 1384 cm−1 is due to KBr matrix.
Sustainability 12 04137 g0a2

Appendix B. Integral Dissolution Rates of Sodium–Aluminum–Phosphate Glasses Investigated

Table A1 presents the integral leaching rate (LR) of elements from samples NAPas0, NAPas1, NAPcm0, NAPcm, NAPcm1, NAP1, and NAP2. LR for contents below the detection limit were calculated for a value equal to the detection limit (Table A2). Ru was not detected.
Table A1. The integral leaching rate of elements from NAP glasses investigated, g/(cm2 ∙ day).
SampleTime, dNaAlFePCaCrMnNiLaU
NAPas0
(90°С)
12.41 × 10−41.52 × 10−41.75 × 10−61.61 × 10−4
31.94 × 10−49.64 × 10−57.09 × 10−71.22 × 10−4
71.29 × 10−45.14 × 10−53.49 × 10−77.91 × 10−5
101.20 × 10−44.17 × 10−52.89 × 10−77.28 × 10−5
141.04 × 10−43.25 × 10−52.83 × 10−76.24 × 10−5
217.99 × 10−52.29 × 10−52.05 × 10−74.98 × 10−5
286.72 × 10−51.80 × 10−51.55 × 10−74.32 × 10−5
NAPas1
(90°С)
11.60 × 10−47.67 × 10−51.34 × 10−59.24 × 10−5
31.01 × 10−44.37 × 10−56.12 × 10−65.89 × 10−5
76.63 × 10−52.49 × 10−53.03 × 10−63.88 × 10−5
105.84 × 10−52.09 × 10−52.40 × 10−63.41 × 10−5
144.99 × 10−51.68 × 10−51.83 × 10−62.93 × 10−5
213.88 × 10−51.23 × 10−51.32 × 10−62.38 × 10−5
283.25 × 10−51.01 × 10−51.13 × 10−62.04 × 10−5
NAPcm0
(90°С)
11.57 × 10−46.28 × 10−54.53 × 10−57.98 × 10−55.90 × 10−56.30 × 10−56.98 × 10−55.40 × 10−52.50 × 10−58.07 × 10−5
39.93 × 10−53.86 × 10−52.43 × 10−55.17 × 10−52.31 × 10−53.83 × 10−53.13 × 10−53.37 × 10−51.42 × 10−55.11 × 10−5
76.04 × 10−52.29 × 10−51.36 × 10−53.16 × 10−52.88 × 10−52.25 × 10−51.50 × 10−51.99 × 10−57.57 × 10−63.15 × 10−5
105.47 × 10−51.93 × 10−51.02 × 10−52.78 × 10−56.81 × 10−51.74 × 10−51.24 × 10−51.84 × 10−56.10 × 10−62.74 × 10−5
143.94 × 10−51.39 × 10−57.44 × 10−62.01 × 10−56.42 × 10−51.25 × 10−59.02 × 10−61.32 × 10−54.42 × 10−62.04 × 10−5
213.20 × 10−51.05 × 10−55.23 × 10−61.81 × 10−54.28 × 10−58.40 × 10−66.10 × 10−69.43 × 10−62.99 × 10−61.52 × 10−5
282.76 × 10−58.67 × 10−64.21 × 10−61.62 × 10−53.21 × 10−56.34 × 10−64.64 × 10−67.51 × 10−62.41 × 10−61.25 × 10−5
NAPcm0
(25°С)
12.23 × 10−58.16 × 10−67.37 × 10−61.31 × 10−59.72 × 10−51.14 × 10−67.86 × 10−67.03 × 10−66.25 × 10−61.19 × 10−5
31.34 × 10−54.64 × 10−63.96 × 10−67.67 × 10−65.09 × 10−57.58 × 10−74.82 × 10−64.21 × 10−62.40 × 10−67.94 × 10−6
71.08 × 10−53.56 × 10−62.93 × 10−66.30 × 10−62.83 × 10−54.87 × 10−74.90 × 10−64.40 × 10−61.17 × 10−65.10 × 10−6
101.04 × 10−53.46 × 10−62.86 × 10−66.16 × 10−62.67 × 10−54.55 × 10−76.34 × 10−65.20 × 10−61.48 × 10−64.76 × 10−6
149.24 × 10−63.13 × 10−62.56 × 10−65.63 × 10−62.75 × 10−54.06 × 10−76.14 × 10−64.91 × 10−61.41 × 10−64.25 × 10−6
217.78 × 10−62.67 × 10−62.08 × 10−65.13 × 10−61.85 × 10−53.25 × 10−75.84 × 10−64.50 × 10−69.84 × 10−73.40 × 10−6
286.93 × 10−62.38 × 10−61.80 × 10−64.73 × 10−61.40 × 10−52.84 × 10−75.77 × 10−64.24 × 10−67.73 × 10−72.98 × 10−6
NAPcm
(90°С)
11.40 × 10−46.96 × 10−53.85 × 10−57.67 × 10−54.31 × 10−66.26 × 10−53.40 × 10−58.89 × 10−52.89 × 10−56.01 × 10−5
38.68 × 10−54.21 × 10−52.05 × 10−54.76 × 10−53.36 × 10−43.79 × 10−51.67 × 10−55.49 × 10−51.49 × 10−53.89 × 10−5
75.26 × 10−52.48 × 10−51.10 × 10−52.88 × 10−51.48 × 10−42.16 × 10−58.14 × 10−63.20 × 10−58.14 × 10−62.38 × 10−5
104.55 × 10−52.13 × 10−58.70 × 10−62.48 × 10−51.04 × 10−41.83 × 10−56.17 × 10−62.74 × 10−56.61 × 10−62.06 × 10−5
143.87 × 10−51.77 × 10−56.78 × 10−62.09 × 10−51.01 × 10−41.51 × 10−54.40 × 10−62.26 × 10−55.13 × 10−61.73 × 10−5
212.95 × 10−51.32 × 10−54.73 × 10−61.65 × 10−56.73 × 10−51.09 × 10−53.04 × 10−61.63 × 10−53.48 × 10−61.25 × 10−5
282.48 × 10−51.09 × 10−53.82 × 10−61.43 × 10−55.06 × 10−58.96 × 10−62.31 × 10−61.34 × 10−53.03 × 10−61.02 × 10−5
NAPcm1
(25°С)
12.13 × 10−58.53 × 10−67.96 × 10−61.26 × 10−55.56 × 10−51.09 × 10−66.06 × 10−61.04 × 10−52.76 × 10−69.92 × 10−6
31.29 × 10−55.02 × 10−64.63 × 10−67.75 × 10−65.29 × 10−57.25 × 10−73.88 × 10−65.98 × 10−61.09 × 10−66.61 × 10−6
79.57 × 10−63.55 × 10−63.13 × 10−65.83 × 10−62.38 × 10−54.66 × 10−72.73 × 10−64.60 × 10−65.43 × 10−74.25 × 10−6
109.02 × 10−63.29 × 10−62.82 × 10−65.57 × 10−61.71 × 10−54.35 × 10−72.85 × 10−65.08 × 10−64.32 × 10−73.97 × 10−6
148.32 × 10−62.86 × 10−62.38 × 10−64.95 × 10−61.73 × 10−53.88 × 10−73.03 × 10−65.13 × 10−63.46 × 10−73.54 × 10−6
216.62 × 10−62.21 × 10−61.79 × 10−64.19 × 10−61.17 × 10−53.11 × 10−72.55 × 10−64.12 × 10−62.55 × 10−72.83 × 10−6
285.74 × 10−61.87 × 10−61.35 × 10−63.80 × 10−68.93 × 10−62.72 × 10−72.31 × 10−63.65 × 10−62.10 × 10−72.48 × 10−6
NAP111.67 × 10−47.31 × 10−55.49 × 10−59.11 × 10−54.17 × 10−69.61 × 10−55.40 × 10−57.45 × 10−53.34 × 10−51.13 × 10⁻⁴
31.01 × 10−44.25 × 10−52.90 × 10−55.58 × 10−52.78 × 10−65.73 × 10−52.54 × 10−54.42 × 10−51.44 × 10−56.40 × 10−5
76.02 × 10−52.43 × 10−51.58 × 10−53.33 × 10−53.75 × 10−53.35 × 10−51.22 × 10−52.52 × 10−57.11 × 10−63.72 × 10−5
105.31 × 10−52.10 × 10−51.25 × 10−52.92 × 10−53.28 × 10−52.85 × 10−58.95 × 10−62.08 × 10−55.42 × 10−63.21 × 10−5
144.53 × 10−51.76 × 10−51.05 × 10−52.52 × 10−53.21 × 10−52.42 × 10−57.34 × 10−61.67 × 10−54.93 × 10−62.66 × 10−5
213.44 × 10−51.26 × 10−57.20 × 10−62.02 × 10−52.16 × 10−51.72 × 10−54.95 × 10−61.17 × 10−53.31 × 10−61.90 × 10−5
282.91 × 10−51.00 × 10−55.41 × 10−61.78 × 10−51.64 × 10−51.35 × 10−53.75 × 10−69.10 × 10−62.51 × 10−61.50 × 10−5
NAP2
(90°С)
11.78 × 10−48.75 × 10−55.01 × 10−59.77 × 10−51.21 × 10−57.95 × 10−54.58 × 10−56.98 × 10−51.68 × 10−57.76 × 10−5
31.12 × 10−45.59 × 10−53.12 × 10−56.34 × 10−54.03 × 10−65.18 × 10−52.90 × 10−54.69 × 10−51.56 × 10−55.05 × 10−5
76.51 × 10−53.15 × 10−51.60 × 10−53.68 × 10−51.73 × 10−62.85 × 10−51.44 × 10−52.64 × 10−57.78 × 10−62.94 × 10−5
105.59 × 10−52.67 × 10−51.27 × 10−53.15 × 10−51.69 × 10−52.40 × 10−51.10 × 10−52.24 × 10−56.01 × 10−62.55 × 10−5
144.77 × 10−52.25 × 10−59.82 × 10−62.67 × 10−52.13 × 10−51.97 × 10−58.38 × 10−61.85 × 10−54.69 × 10−62.14 × 10−5
213.55 × 10−51.63 × 10−56.81 × 10−62.04 × 10−51.48 × 10−51.41 × 10−55.64 × 10−61.33 × 10−53.16 × 10−61.54 × 10−5
282.93 × 10−51.33 × 10−55.37 × 10−61.72 × 10−51.12 × 10−51.12 × 10−54.27 × 10−61.06 × 10−52.55 × 10−61.23 × 10−5
Table A2. The limits of detection of elements by ICP-AS and ICP-MS, in mg/kg of water (10−4 wt.%).
AlCaCrFeLaMnNaNiPRuU
0.010.010.0010.010.0010.0010.010.0010.020.050.05

References

  1. IAEA. Energy, Electricity and Nuclear Power Estimates for the Period. up to 2050, 2019th ed.; IAEA: Vienna, Austria, 2019; p. 139. [Google Scholar]
  2. NEA. Nuclear Energy Data; OECD, NEA: Paris, France, 2019; p. 117. [Google Scholar]
  3. Batorshin, G.S.; Kirillov, S.N.; Smirnov, I.V.; Sarychev, G.A.; Tananaev, I.G.; Fedorova, O.V.; Myasoedov, B.F. Integrated separation of valuable components from technogenic radioactive waste as an option to create a cost-effective nuclear fuel cycle. Radiat. Saf. Issues 2015, 3, 30–36. (in Russian). [Google Scholar]
  4. IAEA PRIS. The Power Reactor Information System. Available online: https://pris.iaea.org/PRIS/home.aspx (accessed on 6 April 2020).
  5. IAEA. Status and Trends in Spent Fuel and Radioactive Waste Management; IAEA: Vienna, Austria, 2018; p. 59. [Google Scholar]
  6. Ojovan, M.I.; Lee, W.E.; Kalmykov, S.N. An. Introduction to Nuclear Waste Immobilisation, 3rd ed.; Elsevier: Amsterdam, The Netherlands, 2005; p. 497. [Google Scholar]
  7. Phillips, J.R.; Korinny, A.; Depisch, F.; Drace, Z. Update of the INPRO methodology in the area of waste management. Sustainability 2018, 10, 9. [Google Scholar] [CrossRef] [Green Version]
  8. Diaz-Maurin, F.; Ewing, R.C. Mission Impossible? Socio-technical integration of nuclear waste geological disposal systems. Sustainability 2018, 10, 39. [Google Scholar] [CrossRef] [Green Version]
  9. Fedorov, Y.S.; Zil’berman, B.Y.; Aloi, A.S.; Puzikov, E.A.; Shadrin, A.Y.; Alyapyshev, M.Y. Problems of modernization of spent nuclear fuel extraction processing. Russ. J. Gen. Chem. 2011, 81, 1932–1948. [Google Scholar] [CrossRef]
  10. Kopyrin, A.A.; Karelin, A.I.; Karelin, V.A. Technology for the Production and Radio-Chemical Processing of Nuclear Fuel; Atomizdat Publishing House CJSC: Moscow, Russia, 2008; p. 576. [Google Scholar]
  11. Vashman, A.A.; Demine, A.V.; Krylova, N.V.; Kushnikov, V.V.; Matyunin, Y.I.; Poluektov, P.P.; Polyakov, A.S.; Teterin, E.G. Phosphate Glasses with Radioactive Waste; CNIIatominform: Moscow, Russia, 1997; p. 172. [Google Scholar]
  12. Remizov, M.B.; Kozlov, P.V.; Logunov, M.V.; Koltyshev, V.K.; Korchenkin, K.K. Conceptual and technical solutions for the creation of Mayak plants for vitrification of current and accumulated liquid HLW. Radiat. Saf. Issues 2014, 3, 17–25. [Google Scholar]
  13. Kozlov, P.V.; Remizov, M.B.; Belanova, E.A.; Vlasova, N.V.; Orlova, V.A.; Martynov, K.V. Modification of the composition of aluminophosphate glasses with HLW simulators to increase their stability. 1. The effect of modifiers on the viscosity and crystallization ability of melts. Probl. Radiat. Saf. 2019, 1, 3–15. (in Russian). [Google Scholar]
  14. Laverov, N.P.; Yudintsev, S.V.; Kochkin, B.T.; Malkovsky, V.I. The Russian strategy of using crystalline rock as a repository for nuclear waste. Elements 2016, 12, 253–256. [Google Scholar] [CrossRef]
  15. Kochkin, B.T.; Malkovsky, V.I.; Yudintsev, S.V. Scientific Basis for Assessing the Safety of the Geological Isolation of Long-Lived Radioactive Waste (Yenisei Project); IGEM RAS: Moscow, Russia, 2017; p. 384. [Google Scholar]
  16. Lutze, W. Radioactive Waste Forms for the Future; Elsevier Science Publishers, B.V.: Amsterdam, The Netherlands, 1988; pp. 1–160. [Google Scholar]
  17. Donald, I.W. Waste Immobilisation in Glass and Ceramic Based Hosts; Wiley: Chichester, UK, 2010. [Google Scholar]
  18. Jantzen, C.M. Development of glass matrices for HLW radioactive wastes. In Handbook of Advanced Radioactive Waste Conditioning Technologies; Woodhead: Cambridge, UK, 2011; pp. 230–292. [Google Scholar]
  19. Sobolev, I.A.; Ojovan, M.I.; Scherbatova, T.D.; Batyukhnova, O.G. Glasses for Radioactive Waste; Energoatomizdat: Moscow, Russia, 1999. [Google Scholar]
  20. Gin, S.; Jollivet, P.; Tribet, M.; Peuget, S.; Schuller, S. Radionuclides containment in nuclear glasses: An overview. Radiochim. Acta 2017, 105, 927–959. [Google Scholar] [CrossRef]
  21. Laverov, N.P.; Velichkin, V.I.; Omelyanenko, B.I.; Yudintsev, S.V.; Petrov, V.A.; Bychkov, A.V. Isolation of Spent Nuclear Materials: Geological and Geochemical Foundations; IFZ RAS: Moscow, Russia, 2008; p. 280. [Google Scholar]
  22. Ojovan, M.I.; Lee, W.E. New Developments in Glassy Nuclear Wasteforms; Nova: New York, NY, USA, 2007; p. 131. [Google Scholar]
  23. Caurant, D.; Loiseau, P.; Majérus, O.; Aubin-Cheval-donnet, V.; Bardez, I.; Quintas, A. Glasses, Glass-Ceramics and Ceramics for Immobilization of Highly Radioactive Nuclear Wastes; Nova: New York, NY, USA, 2009; p. 445. [Google Scholar]
  24. Jantzen, C.M.; Ojovan, M.I. On selection of matrix (wasteform) material for higher activity nuclear waste immobilization (Review). Russ. J. Inorg. Chem. 2019, 64, 1611–1624. [Google Scholar] [CrossRef]
  25. Gin, S.; Abdelouas, A.; Criscenti, L.J.; Ebert, W.L.; Ferrand, K.; Geisler, T.; Harrison, M.T.; Inagaki, Y.; Mitsui, S.; Mueller, K.T.; et al. An international initiative on long-term behavior of high-level nuclear waste glass. Mater. Today 2013, 16, 243–248. [Google Scholar] [CrossRef]
  26. Ojovan, M.I. On alteration rate renewal stage of nuclear waste glass corrosion. MRS Adv. 2020, 5, 111–120. [Google Scholar] [CrossRef]
  27. The Fifth National Report of the Russian Federation on the Fulfillment of Obligations Arising from the Joint Convention on the Safety of Spent Fuel Management and on the Safety of Radioactive Waste Management. Moscow. 2017. Available online: http://www.gosnadzor.ru/activity/international/national%20reports/Russian_Federation_rus.pdf (accessed on 6 April 2020). (In Russian).
  28. Dorogov, V.I.; Ponizov, A.V.; Khaperskaya, A.V. On the preparation of the fifth national report of the Russian Federation on the fulfillment of obligations arising from the Joint Convention on the Safety of Spent Fuel Management and on the Safety of Radioactive Waste Management. Radioact. Waste 2017, 1, 100–107. (In Russian) [Google Scholar]
  29. Kryukov, O.V.; Khaperskaya, A.V.; Dorofeev, A.N.; Ferapontov, A.V.; Kudryavtsev, E.G.; Linge, I.I.; Utkin, S.S.; Dorogov, V.I.; Sharafutdinov, R.B.; Ponizov, A.V.; et al. Fulfillment of Russia’s obligations under the Joint Convention on the Safety of Spent Fuel Management and on the Safety of Radioactive Waste Management. Radioact. Waste 2019, 1, 25–36. (In Russian) [Google Scholar]
  30. Kenneth, L.N.; Gregg, J.L. Advanced Separation Techniques for Nuclear Fuel Reprocessing and Radioactive Waste Treatment; Woodhead Publishing Limited: Cambridge, UK, 2011; p. 492. [Google Scholar]
  31. State Standard of Russian Federation. Waste Highly Radioactive Solidified. General Technical Requirements; GOST Р 50926-96; Standards Publishing: Moscow, Russia, 2013; p. 5. Available online: http://docs.cntd.ru/document/gost-r-50926-96 (accessed on 6 April 2020).
  32. State Standard of Russian Federation. Radioactive Waste. Determination of Chemical Resistance of Solidified High-Level Waste by Continuous Leaching; GOST Р 52126-2003; Standards Publishing: Moscow, Russia, 2003; p. 6. Available online: http://docs.cntd.ru/document/gost-r-52126-2003 (accessed on 6 April 2020).
  33. American Society for Testing and Materials. Standard Test. Method for Static Leaching of Monolithic Waste Forms for Disposal of Radioactive Waste; ASTM C 1220—98; ASTM International: West Conshohocken, PA, USA, 2004; p. 16. [Google Scholar]
  34. Martynov, K.V.; Nekrasov, A.N.; Kotelnikov, A.R.; Shiryaev, A.A.; Stefanovsky, S.V. Subliquidus phase relations in the low-alumina section of the Na2O–Al2O3–P2O5 system and the radioactive waste vitrification. Glas. Phys. Chem. 2018, 44, 591–600. [Google Scholar] [CrossRef]
  35. Remizov, M.B.; Myasoedov, B.F.; Nikonov, B.S.; Stefanovsky, S.V.; Belanova, E.A. Phase composition and structure of molybdenum-, copper- and cesium-containing sodium-aluminum-phosphate glass materials for immobilization of highly active waste from nuclear reactors. Phys. Chem. Glass 2014, 40, 707–717. [Google Scholar] [CrossRef]
  36. Yudintsev, S.V.; Malkovsky, V.I.; Mokhov, A.V. Hydrothermal transformations in an aluminophosphate glass matrix containing simulators of high-level radioactive wastes. Dokl. Earth Sci. 2016, 468, 503–506. [Google Scholar] [CrossRef]
  37. Stefanovsky, S.V.; Stefanovsky, O.; Remizov, M.; Kozlov, P.V.; Belanova, E.; Makarovsky, R.; Myasoedov, B. Sodium–aluminum–iron phosphate glasses as legacy high level waste forms. Prog. Nucl. Energy 2017, 94, 229–234. [Google Scholar] [CrossRef]
  38. Stefanovsky, S.V.; Stefanovsky, O.; Myasoedov, B.; Vinikurov, S.; Danilov, S.S.; Nikonov, B.; Maslakov, K.I.; Teterin, Y.A. The phase composition, structure, and hydrolytic durability of sodium-aluminum-(iron)-phosphate glassy materials doped with lanthanum, cerium, europium, and gadolinium oxides. J. Non-Cryst. Solids 2017, 471, 421–428. [Google Scholar] [CrossRef]
  39. Malkovsky, V.I.; Yudintsev, S.V.; Mokhov, A.V.; Pervukhina, A.M. Leaching of degraded matrices—Preservatives of highly radioactive waste based on Na-Al-P-glasses. At. Energy 2018, 123, 3–177. [Google Scholar]
  40. Malkovsky, V.I.; Yudintsev, S.V.; Aleksandrova, E.V. Influence of Na-Al-Fe-P glass alteration in hot non-saturated vapor on leaching of vitrified radioactive wastes in water. J. Nucl. Mater. 2018, 508, 212–218. [Google Scholar] [CrossRef]
  41. Stefanovsky, S.V.; Prusakov, I.L.; Stefanovsky, O.I.; Kadyko, M.I.; Averin, A.A.; Makarenkov, V.I.; Trigub, A.L.; Nikonov, B.S. The structure of rhenium-containing sodium alumino (iron) phosphate glasses. Int. J. Appl. Glass Sci. 2019, 10, 479–487. [Google Scholar] [CrossRef]
  42. Stefanovsky, S.V.; Stefanovsky, O.I.; Danilov, S.S.; Kadyko, M.I. Phosphate-based glasses and glass ceramics for immobilization of lanthanides and actinides. Ceram. Int. 2019, 45, 9331–9338. [Google Scholar] [CrossRef]
  43. Matyunin, Y.I. The Dissertation for the Degree of Candidate of Chemical Sciences; VNIINM: Moscow, Russia, 2000. [Google Scholar]
  44. Stefanovsky, S.V.; Stefanovskaya, O.I.; Vinokurov, S.E.; Danilov, S.S.; Myasoedov, B.F. Phase composition, structure, and hydrolytic durability of glasses in the Na2O-Al2O3-(Fe2O3)-P2O5 system at replacement of Al2O3 by Fe2O3. Radiochemistry 2015, 57, 348–355. [Google Scholar] [CrossRef]
  45. Danilov, S.S.; Vinokurov, S.E.; Stefanovsky, S.V.; Myasoedov, B.F. Hydrolytic stability of uranium-containing sodium aluminum (iron) phosphate glasses. Radiochemistry 2017, 59, 259–263. [Google Scholar] [CrossRef]
  46. Poluektov, P.P.; Schmidt, O.V.; Kascheev, V.A.; Ojovan, M.I. Modelling aqueous corrosion of nuclear waste phosphate glass. J. Nucl. Mater. 2017, 484, 357–366. [Google Scholar] [CrossRef]
  47. Boldyrev, K.A.; Martynov, K.V.; Kryuchkov, D.V.; Zakharova, E.V.; Ermolaev, V.M. Numerical modeling of leaching of aluminophosphate glass in the batch mode in the presence of bentonite. Radiochemistry 2019, 61, 612–618. [Google Scholar] [CrossRef]
  48. Van Iseghem, P.; Grambow, B. The long-term corrosion and modeling of two simulated Belgian reference high-level waste glasses. Res. Soc. Symp. Proc. 1988, 176, 631–639. [Google Scholar]
  49. Frugier, P.; Chave, T.; Gin, S.; Lartigue, J.-E. Application of the GRAAL model to leaching experiments with SON68 nuclear glass in initially pure water. J. Nucl. Mater. 2009, 392, 552–567. [Google Scholar] [CrossRef]
  50. Ojovan, M.I. Mass spectrometric evidencing on modified random network microstructure and medium range order in silicate glasses. J. Non-Cryst. Solids 2016, 434, 71–78. [Google Scholar] [CrossRef]
  51. Gin, S.; Ribet, I.; Peuget, S.; Delaye, J.-M. Long-term behavior of glasses. In Nuclear Waste Conditioning; CEA: Paris, France, 2009; pp. 51–64. [Google Scholar]
  52. Fournier, M.; Gin, S.; Frugier, P. Resumption of nuclear glass alteration: State of the art. J. Nucl. Mater. 2014, 448, 348–363. [Google Scholar] [CrossRef]
  53. Gill, P.E.; Murray, W.; Wright, M.H. Practical Optimization; Academic Press Inc.: London, UK, 1981; p. 401. [Google Scholar]
  54. Zotov, A.V.; Levin, K.A.; Magazina, L.O.; Mukhamet-Galeev, A.P.; Omelianenko, B.I.; Samotoin, N.D.; Shapovalov, Y.B. Interaction of aluminophosphate glass with water at elevated temperatures. Geochem. Int. 1996, 34, 805–817. [Google Scholar]
  55. Charnes, A.; Frome, E.L.; Yu, P.L. The equivalence of generalized least squares and maximum likelihood estimates in the exponential family. J. Am. Stat. Assoc. 1976, 71, 169–171. [Google Scholar] [CrossRef]
  56. Ojovan, M.I.; Pankov, A.S.; Lee, W.E. The ion exchange phase in corrosion of nuclear waste glasses. J. Nucl. Mater. 2006, 358, 57–68. [Google Scholar] [CrossRef]
  57. Peuget, S.; Tribet, M.; Mougnaud, S.; Miro, S.; Jégou, C. Radiations effects in ISG glass: From structural changes to long-term aqueous behavior. NPJ Mater. Degrad. 2018, 2, 23. [Google Scholar] [CrossRef]
  58. Sun, K.; Wang, L.M.; Ewing, R.C. Microstructure and chemistry of an aluminophosphate glass waste form under electron beam irradiation. Mater. Res. Soc. Symp. Proc. 2004, 807, 121–126. [Google Scholar] [CrossRef]
Figure 1. Photos of samples investigated (monolithic and powdered for analysis): NAPas0, NAPas1, NAPcm0—pristine, and NAPcm1, NAP1, NAP2—irradiated. The scale is in cm.
Sustainability 12 04137 g001aSustainability 12 04137 g001b
Figure 2. SEM images of NAPas0 glasses: (a) Image showing the homogeneity of glass; (b) sections of glass where the composition is analyzed (Table 2).
Sustainability 12 04137 g002
Figure 3. SEM images of the samples: (a) NAPas1 glass that is seen practically homogeneous; (b) NAPcm glass with gray areas that belong to vitreous phase, dark gray—to aluminum orthophosphate (AlPO4, phosphotridimite), and small white particles—to ruthenium dioxide, RuO2. These phases are confirmed by joint data of SEM/EDS analysis and XRD investigation.
Sustainability 12 04137 g003
Figure 4. SEM images of NAPcm0 glass: (a) AlPO4 grains are dark areas in the glass (grey color), whereas white fine grains are ruthenium dioxide; (b) particles of RuO2 in the glass matrix confirmed by joint data of SEM/EDS analysis. Scale bar is equal to 10 μm.
Sustainability 12 04137 g004
Figure 5. SEM images of the irradiated NAP1 and NAP2 glasses: (a) NAP1 glass, where gray—glass, dark—AlPO4 (phosphotridimite), small white particles—ruthenium dioxide; (b) NAP2 glass with white colored RuO2 particles in gray glass. Rectangles indicate measurements areas.
Sustainability 12 04137 g005
Figure 6. XRD patterns of samples: (a) With a simple composition (AS0—initial, AS1—after irradiation); (b) with a complex composition (CM0—initial, CM1—irradiated); (c) No1 and No2—irradiated).
Sustainability 12 04137 g006
Figure 7. Time dependences of normalized dissolution rate of irradiated glass NAPcm at 90 °C. An approximation of time dependence of dissolution rate normalized by phosphorus by power function 0.489 · 10−4/t0.61 (values of parameters of the power function were obtained from least-squares fit) is shown by the dashed purple line.
Sustainability 12 04137 g007
Figure 8. Dependences JEl(t) for the pristine (unirradiated) glasses with high (NAPas0) and low (NAPcm0) values of the ratios of the mass fractions of sodium and aluminum in the glass composition.
Sustainability 12 04137 g008
Figure 9. Comparison of the calculated approximating line by Equation (9) and experimental data of glasses studied in this work. (1) 1.183 · 10 4 / t 0.6 , (2) NAPas0, (3) NAPcm0, (4) NAPcm1, (5) NAP1, (6) NAP2.
Sustainability 12 04137 g009
Figure 10. Normalized leaching rates of glass NAPcm0 at 25 °C (dashed lines) and 90 °C (solid lines).
Sustainability 12 04137 g010
Figure 11. Comparison of the normalized dissolution rates of unirradiated glass NAPas0 (solid lines) with irradiated glass NAPas1 (dashed lines) at 90 °C.
Sustainability 12 04137 g011
Figure 12. Time dependence of ratios JEl/JEl0 obtained on samples NAPas0 and NAPas1.
Sustainability 12 04137 g012
Table 1. Compositions of the NAP glasses investigated, wt.% (SEM/EDS)*. NAPas0 (NAPcm0)—pristine glass of simple and complex (in brackets) composition. NAPas1 (NAPcm, NAP1, NAP2)—the same samples after gamma irradiation up to a dose of 6.2 × 107 Gy by 60Co source.
No.Na2OAl2O3Fe2O3P2O5CaONiOLa2O3Cr2O3MnORuO2UO2
NAPas022.39.215.652.1-------
NAPas122.19.215.252.4-------
NAPcm026.215.61.353.40.90.40.30.30.30.5 *1.4
NAPcm26.414.41.354.20.90.30.50.40.20.5 *1.3
NAP126.714.71.453.80.90.30.40.20.30.5 *1.3
NAP224.916.21.553.60.90.40.40.40.40.5 *1.2
Mayak 123.515.81.653.31.00.30.10.4---
* 0.4–0.7 wt% of SiO2 and 0.4–0.5 wt.% K2O are also present in all samples. Dash—not added, the ruthenium content in the samples according to SEM/EDS is below the detection limit (0.2 wt.%). The value of 0.5 wt.% is estimated from the data on the area fraction of the RuO2 phase in SEM images, see text. 1 model composition of vitrified HLW of FSUE “Mayak” [13]. Other elements, in wt.%: 0.5 Cs2O, 0.5 ZrO2, 0.6 Се2О3, 0.5 Nd2O3, 0.5 MoO3, 0.4 SO2.
Table 2. Composition of NAPas0 glass (before irradiation), SEM-EDS data (Σ = 100 wt.%). The accuracy of the determinations is 3–5 rel.%.
Oxide, wt.%Spectrum 9Spectrum 10Spectrum 11Spectrum 12Spectrum 13
Na2O22.322.422.422.322.6
Al2O39.29.59.29.49.2
SiO20.40.40.40.40.4
P2O552.151.851.751.951.7
K2O0.50.50.50.50.5
Fe2O315.615.415.815.515.7
Table 3. Composition of NAPas1 glass (after irradiation), SEM-EDS data (Σ = 100 wt.%).
Oxide, wt.%Spectrum 1Spectrum 2Spectrum 3Spectrum 5Spectrum 6
Na2O22.122.422.422.322.8
Al2O39.29.49.39.39.3
SiO20.71.20.30.40.2
P2O552.451.851.851.951.5
K2O0.50.40.50.50.6
Fe2O315.214.815.715.715.6
Table 4. Composition of NAPcm0 glass (before irradiation), SEM-EDS data (Σ = 100 wt.%).
Oxide, wt.%Spectrum 15Spectrum 16Spectrum 17Spectrum 18Spectrum 19
Na2O26.226.726.126.726.7
Al2O315.615.015.215.114.9
SiO2bdl *bdlbdl0.3bdl
P2O553.453.753.953.453.2
CaO0.90.90.81.01.1
Cr2O30.30.20.30.40.3
MnO0.30.40.30.40.3
Fe2O31.31.21.21.21.4
NiO0.40.40.40.40.4
La2O30.30.30.50.30.6
UO21.41.21.31.01.1
* bdlbelow detection limit (0.3 wt.%).
Table 5. Composition of orthophosphate phase particles in NAPcm0 glass (before irradiation).
Oxide, wt.%Spectrum 20Spectrum 21Spectrum 22Spectrum 23Spectrum 24
Na2O0.40.30.20.20.4
Al2O341.841.442.142.041.5
P2O557.458.257.557.857.8
Fe2O30.30.20.20.00.3
Table 6. Compositions of irradiated NAP1 (Spectra 27–31) and NAP2 (Spectra 55–58) glasses, SEM/EDS data (Σ. = 100 wt.%).
Oxide, wt.%Sp. 27Sp. 28Sp. 29Sp. 30Sp. 31Sp. 55Sp. 56Sp. 57Sp. 58
Na2O26.726.826.726.926.524.925.225.024.9
Al2O314.714.814.914.614.916.216.716.016.5
P2O553.853.753.953.453.253.253.253.253.2
CaO0.90.90.90.90.90.90.90.91.0
Cr2O30.20.40.40.30.30.40.30.40.3
MnO0.30.30.30.20.30.40.30.30.3
Fe2O31.41.31.21.51.21.51.41.51.2
NiO0.30.30.30.50.40.40.40.40.5
La2O30.40.70.60.50.50.40.50.20.5
UO21.31.31.30.91.41.21.41.31.2
Table 7. JEl(t) ratios at temperatures of 90 °C and 25 °C for NAPcm0 glass.
Elementt = 5 Dayst = 8.5 Days
Al4.073.30
Na3.514.50
P3.123.23
Table 8. JEl(t) ratios at temperatures of 90 °C and 25 °C for NAPcm1 glass.
Elementt = 5 Dayst = 8.5 Dayst = 12 Days
Al4.834.855.04
Na3.803.753.28
P3.353.063.30
Table 9. Ratios of dissolution rates JEl(t) of nonirradiated NAPas0 and irradiated NAPas1 glasses.
Elementt = 0.5 Dayst =2 Dayst = 5 Dayst = 8.5 Dayst = 12 Days
Al1.982.511.631.641.44
Na1.512.411.982.482.22
P1.742.411.982.512.08

