An Interdisciplinary Approach to the Sustainable Management of Territorial Resources in Hodh el Chargui, Mauritania

 ,
,  ,
,  ,
,  , ,
, ,
Abstract
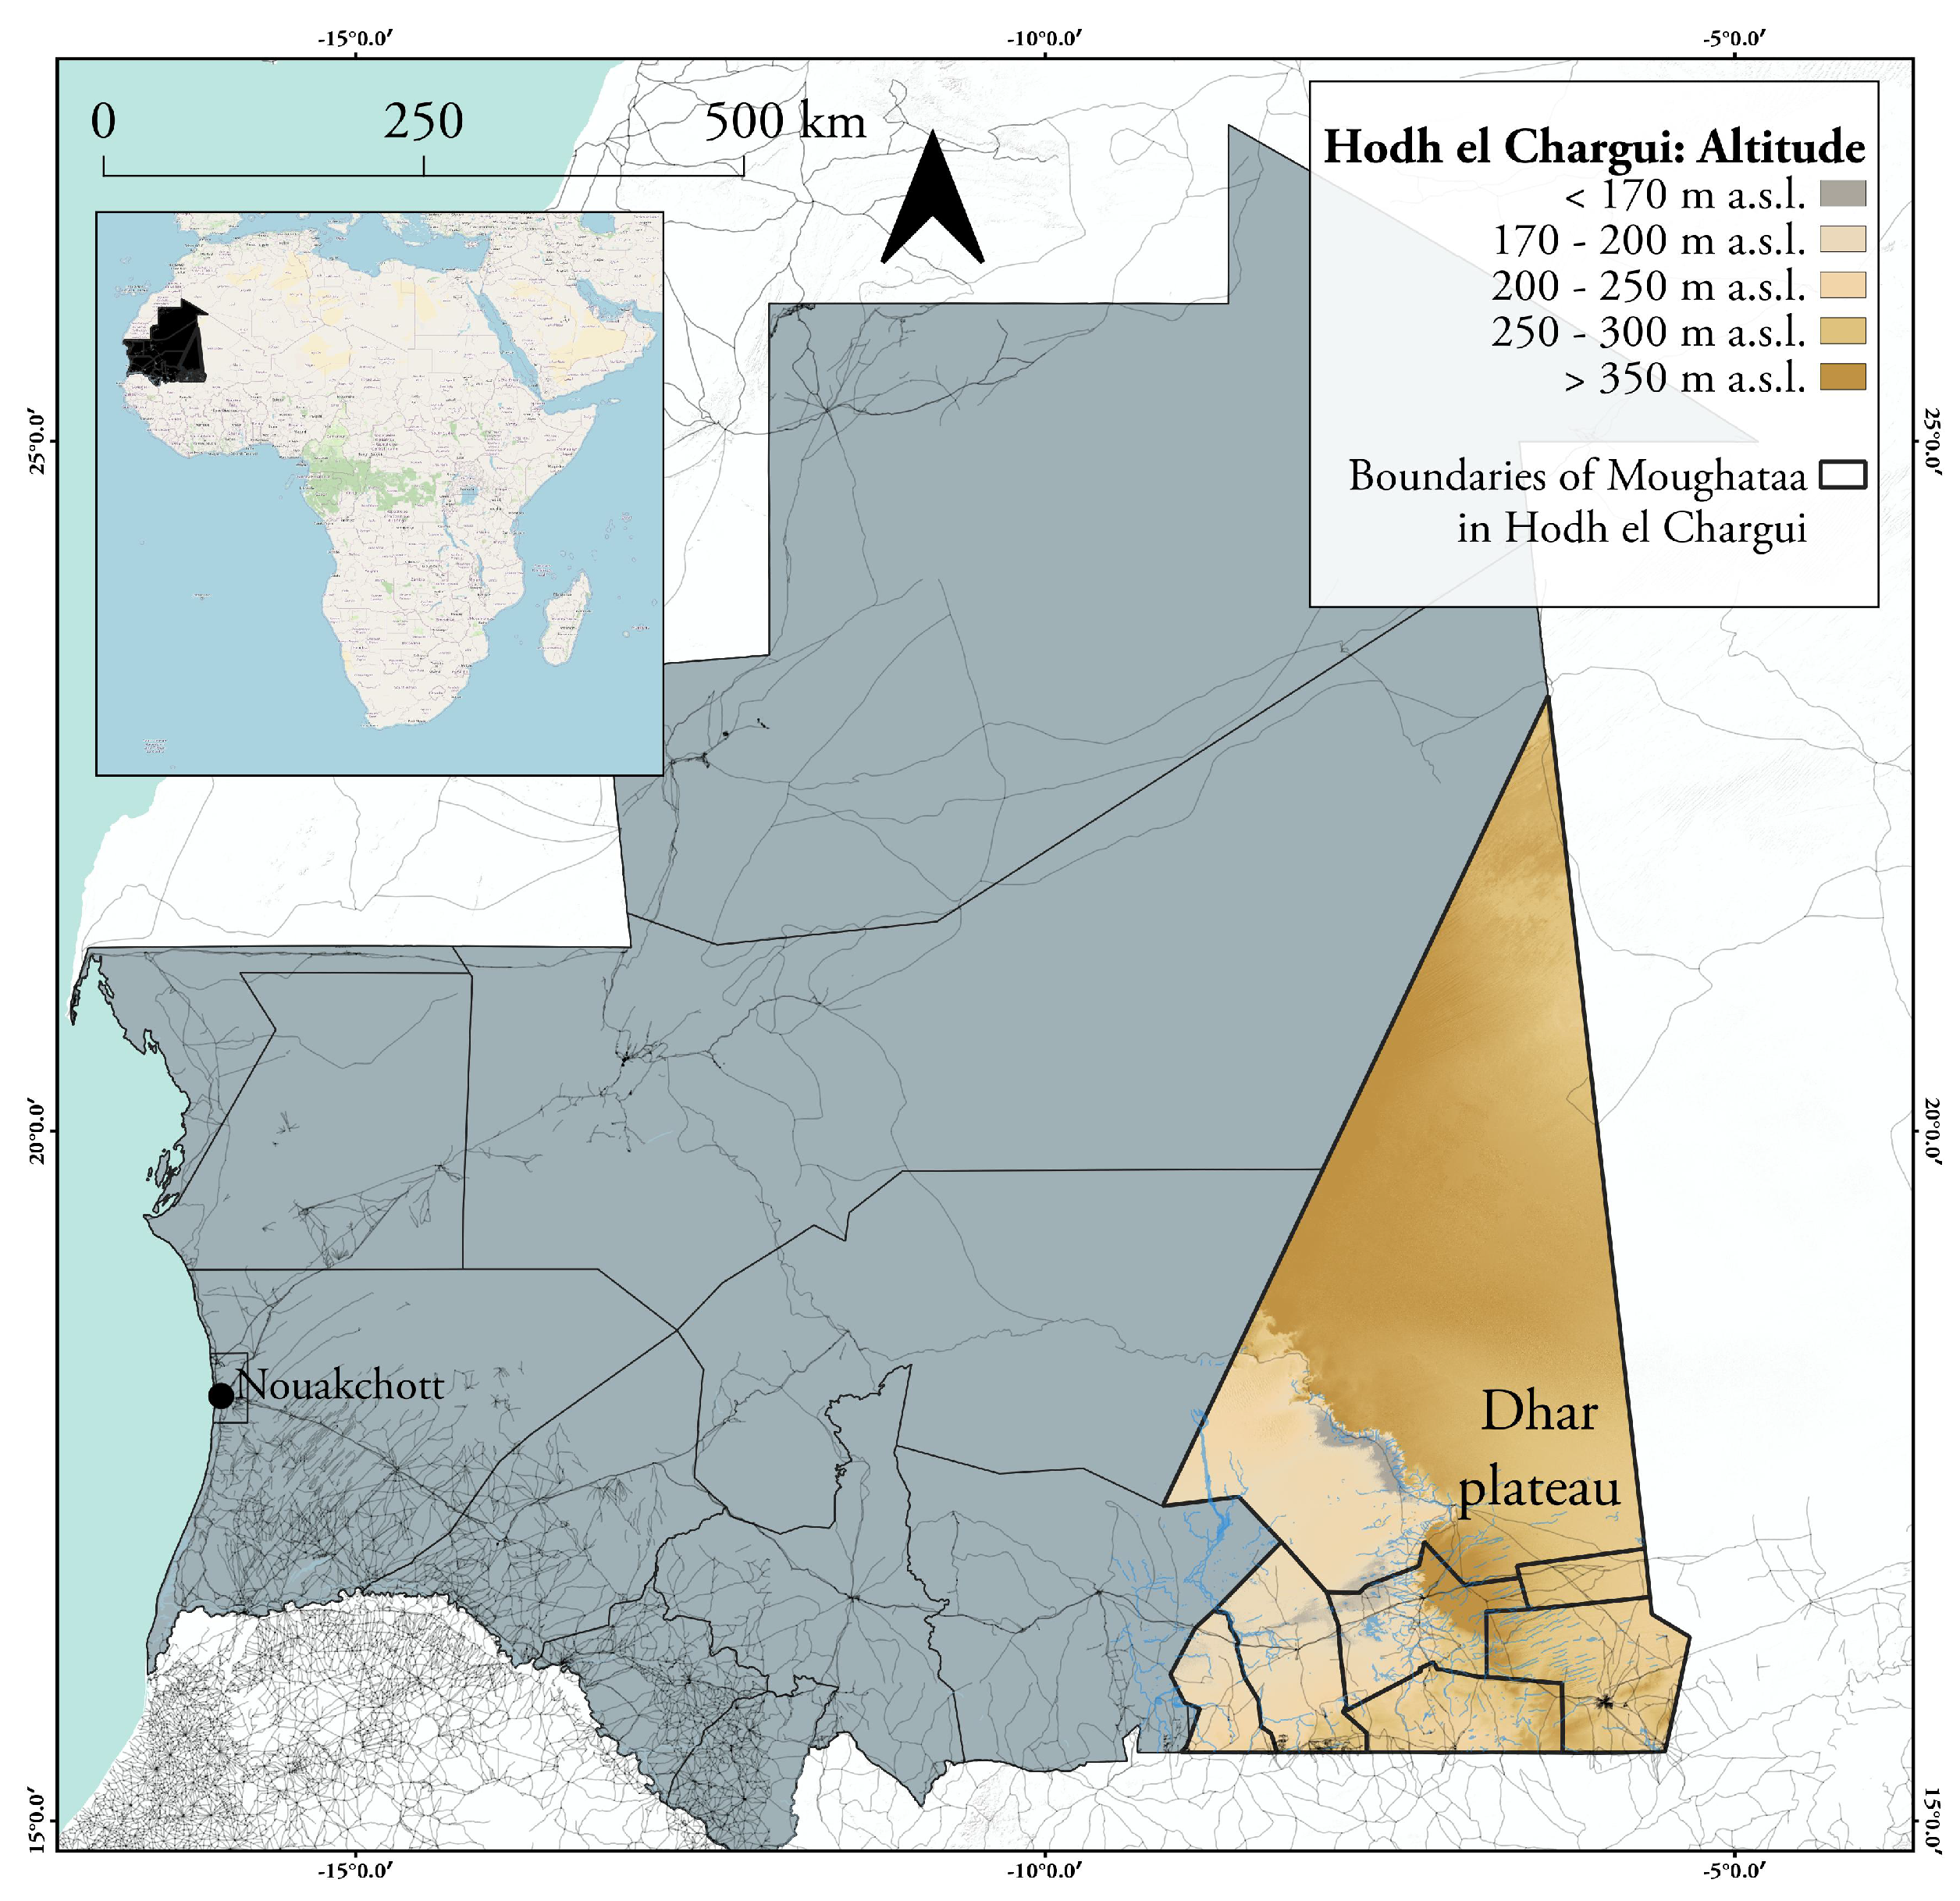
:1. Introduction
2. Materials and Methods
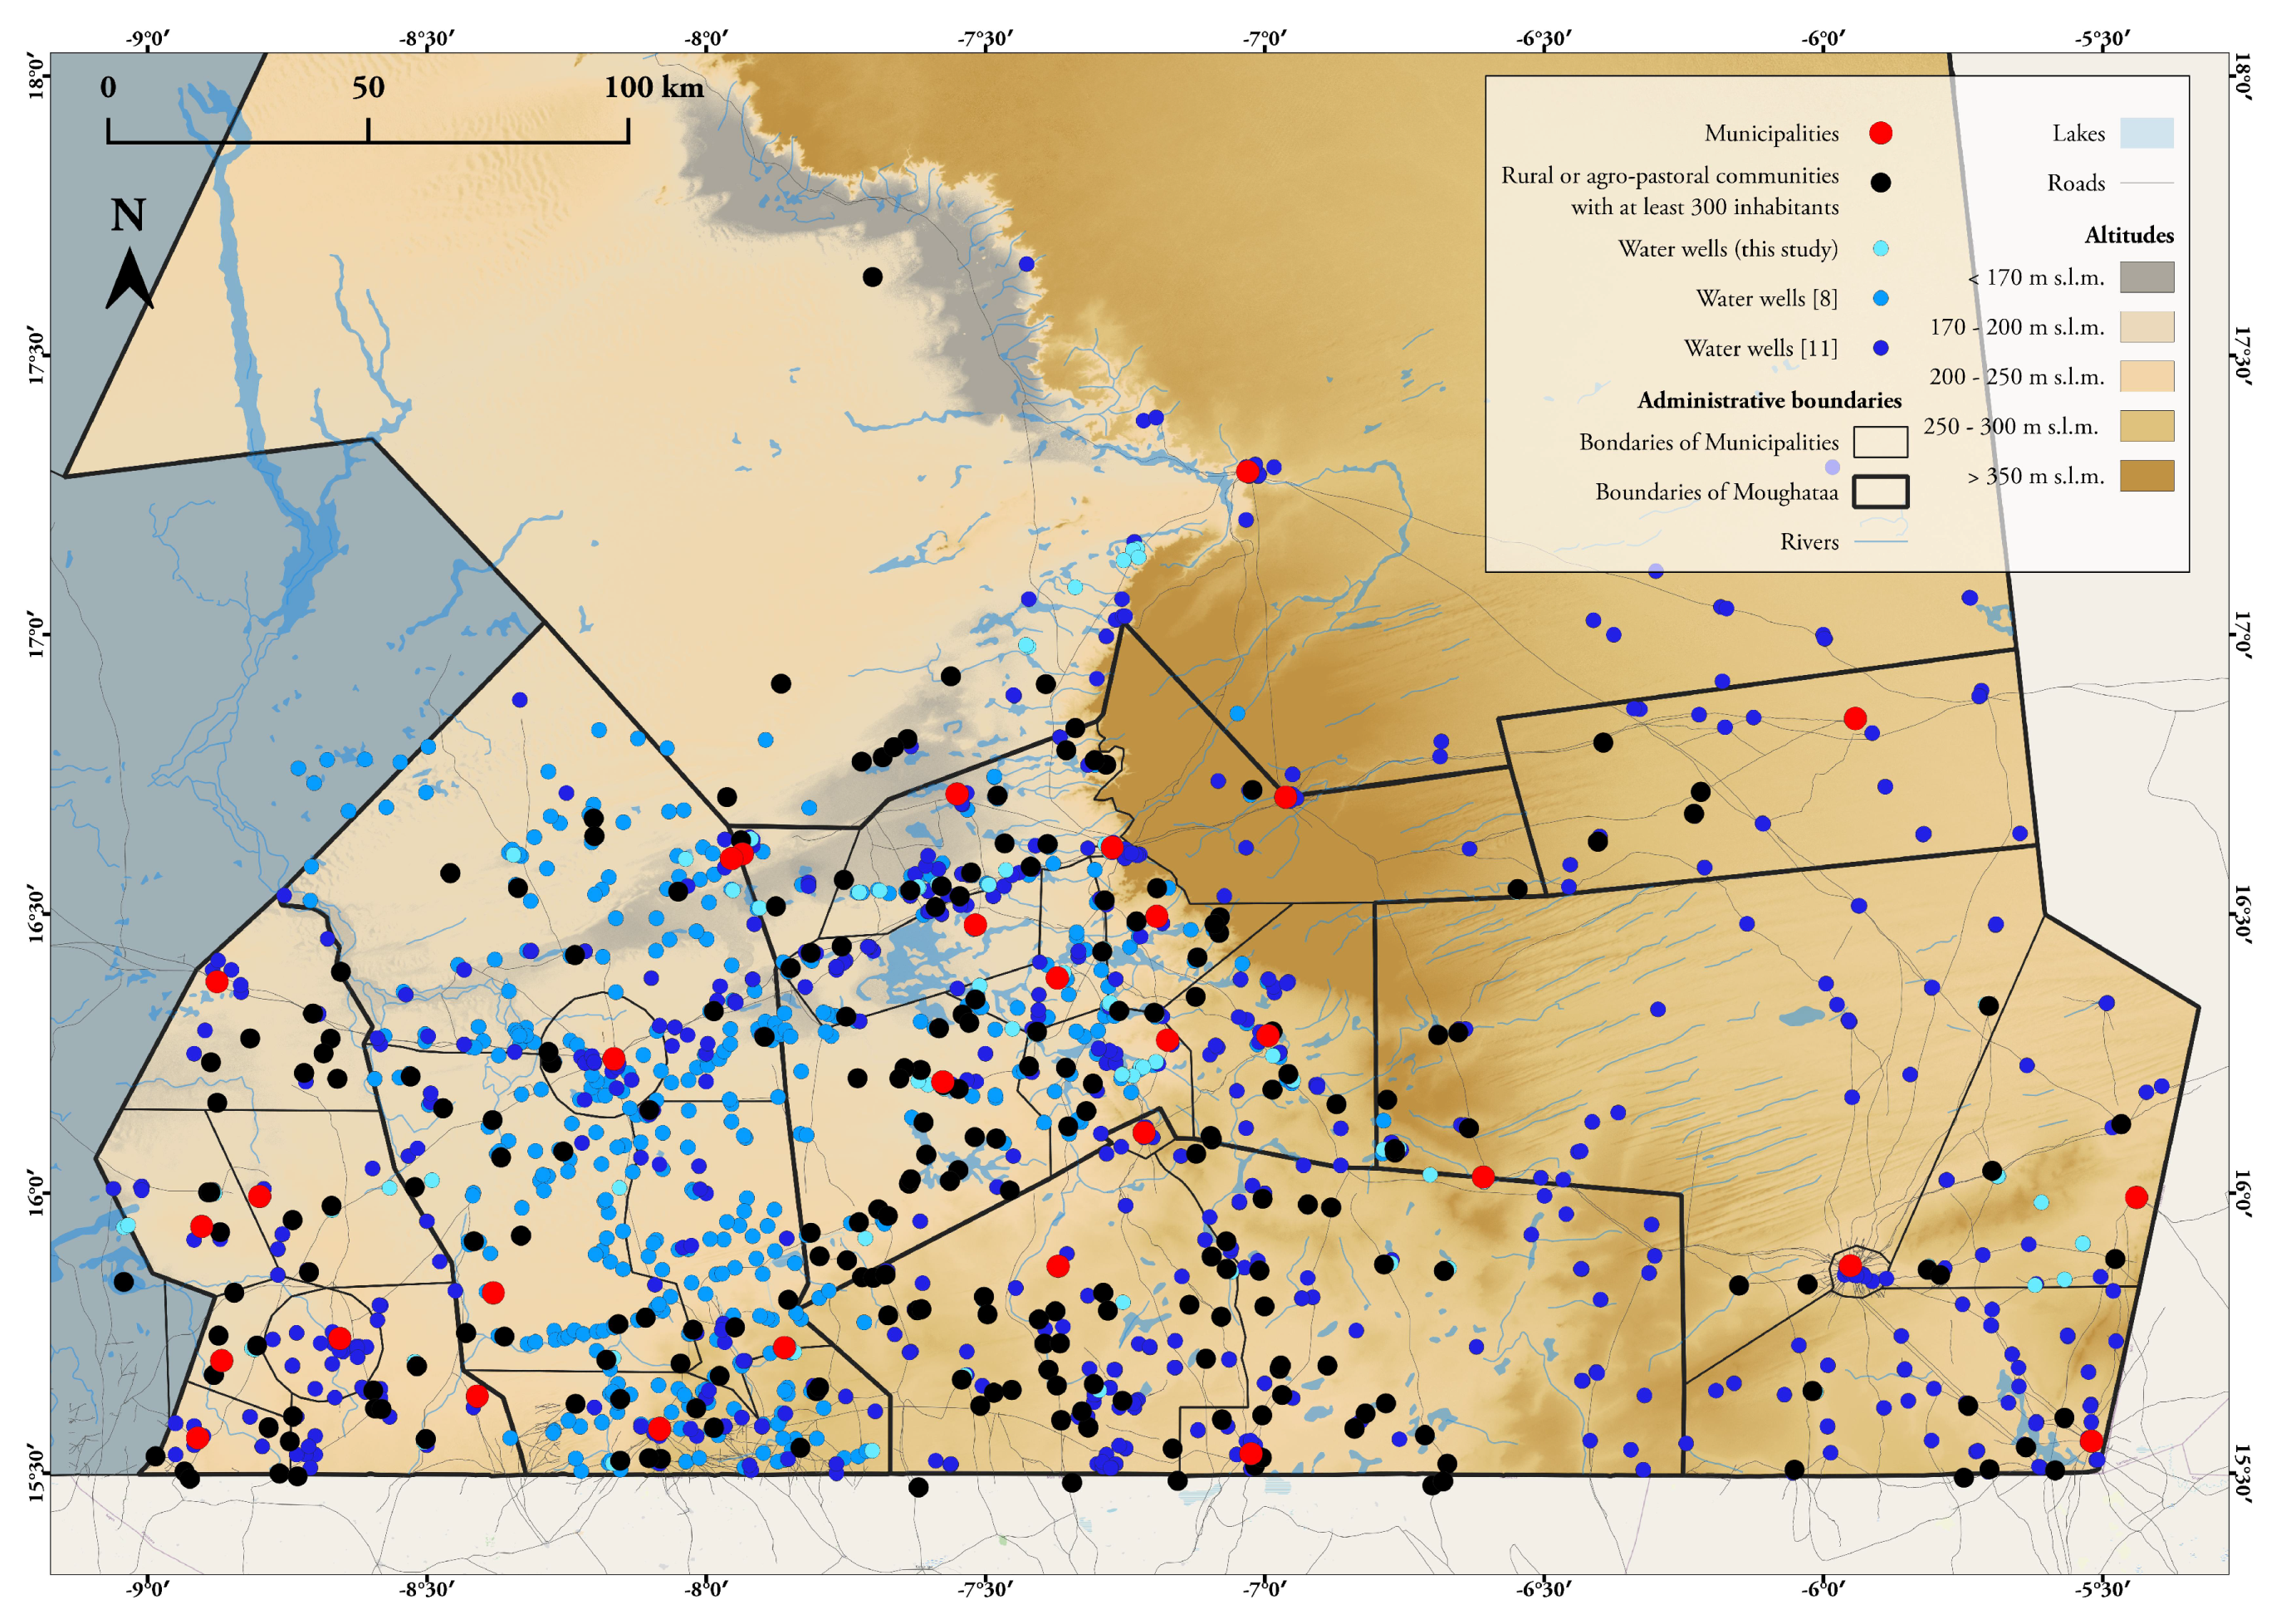
2.1. Onsite Survey
2.2. Integration of Collected Information with EO Data
- a cartographic base for specific data collection and interpretation;
- hydrological analysis of the surface water finalised to the creation of a watershed basins map;
- a reconstruction of the land use of the project area, focusing on vegetation cover in different seasons.
2.3. Publication of Results on a Webmap for Dissemination and Evaluation
3. Results
3.1. Onsite Survey
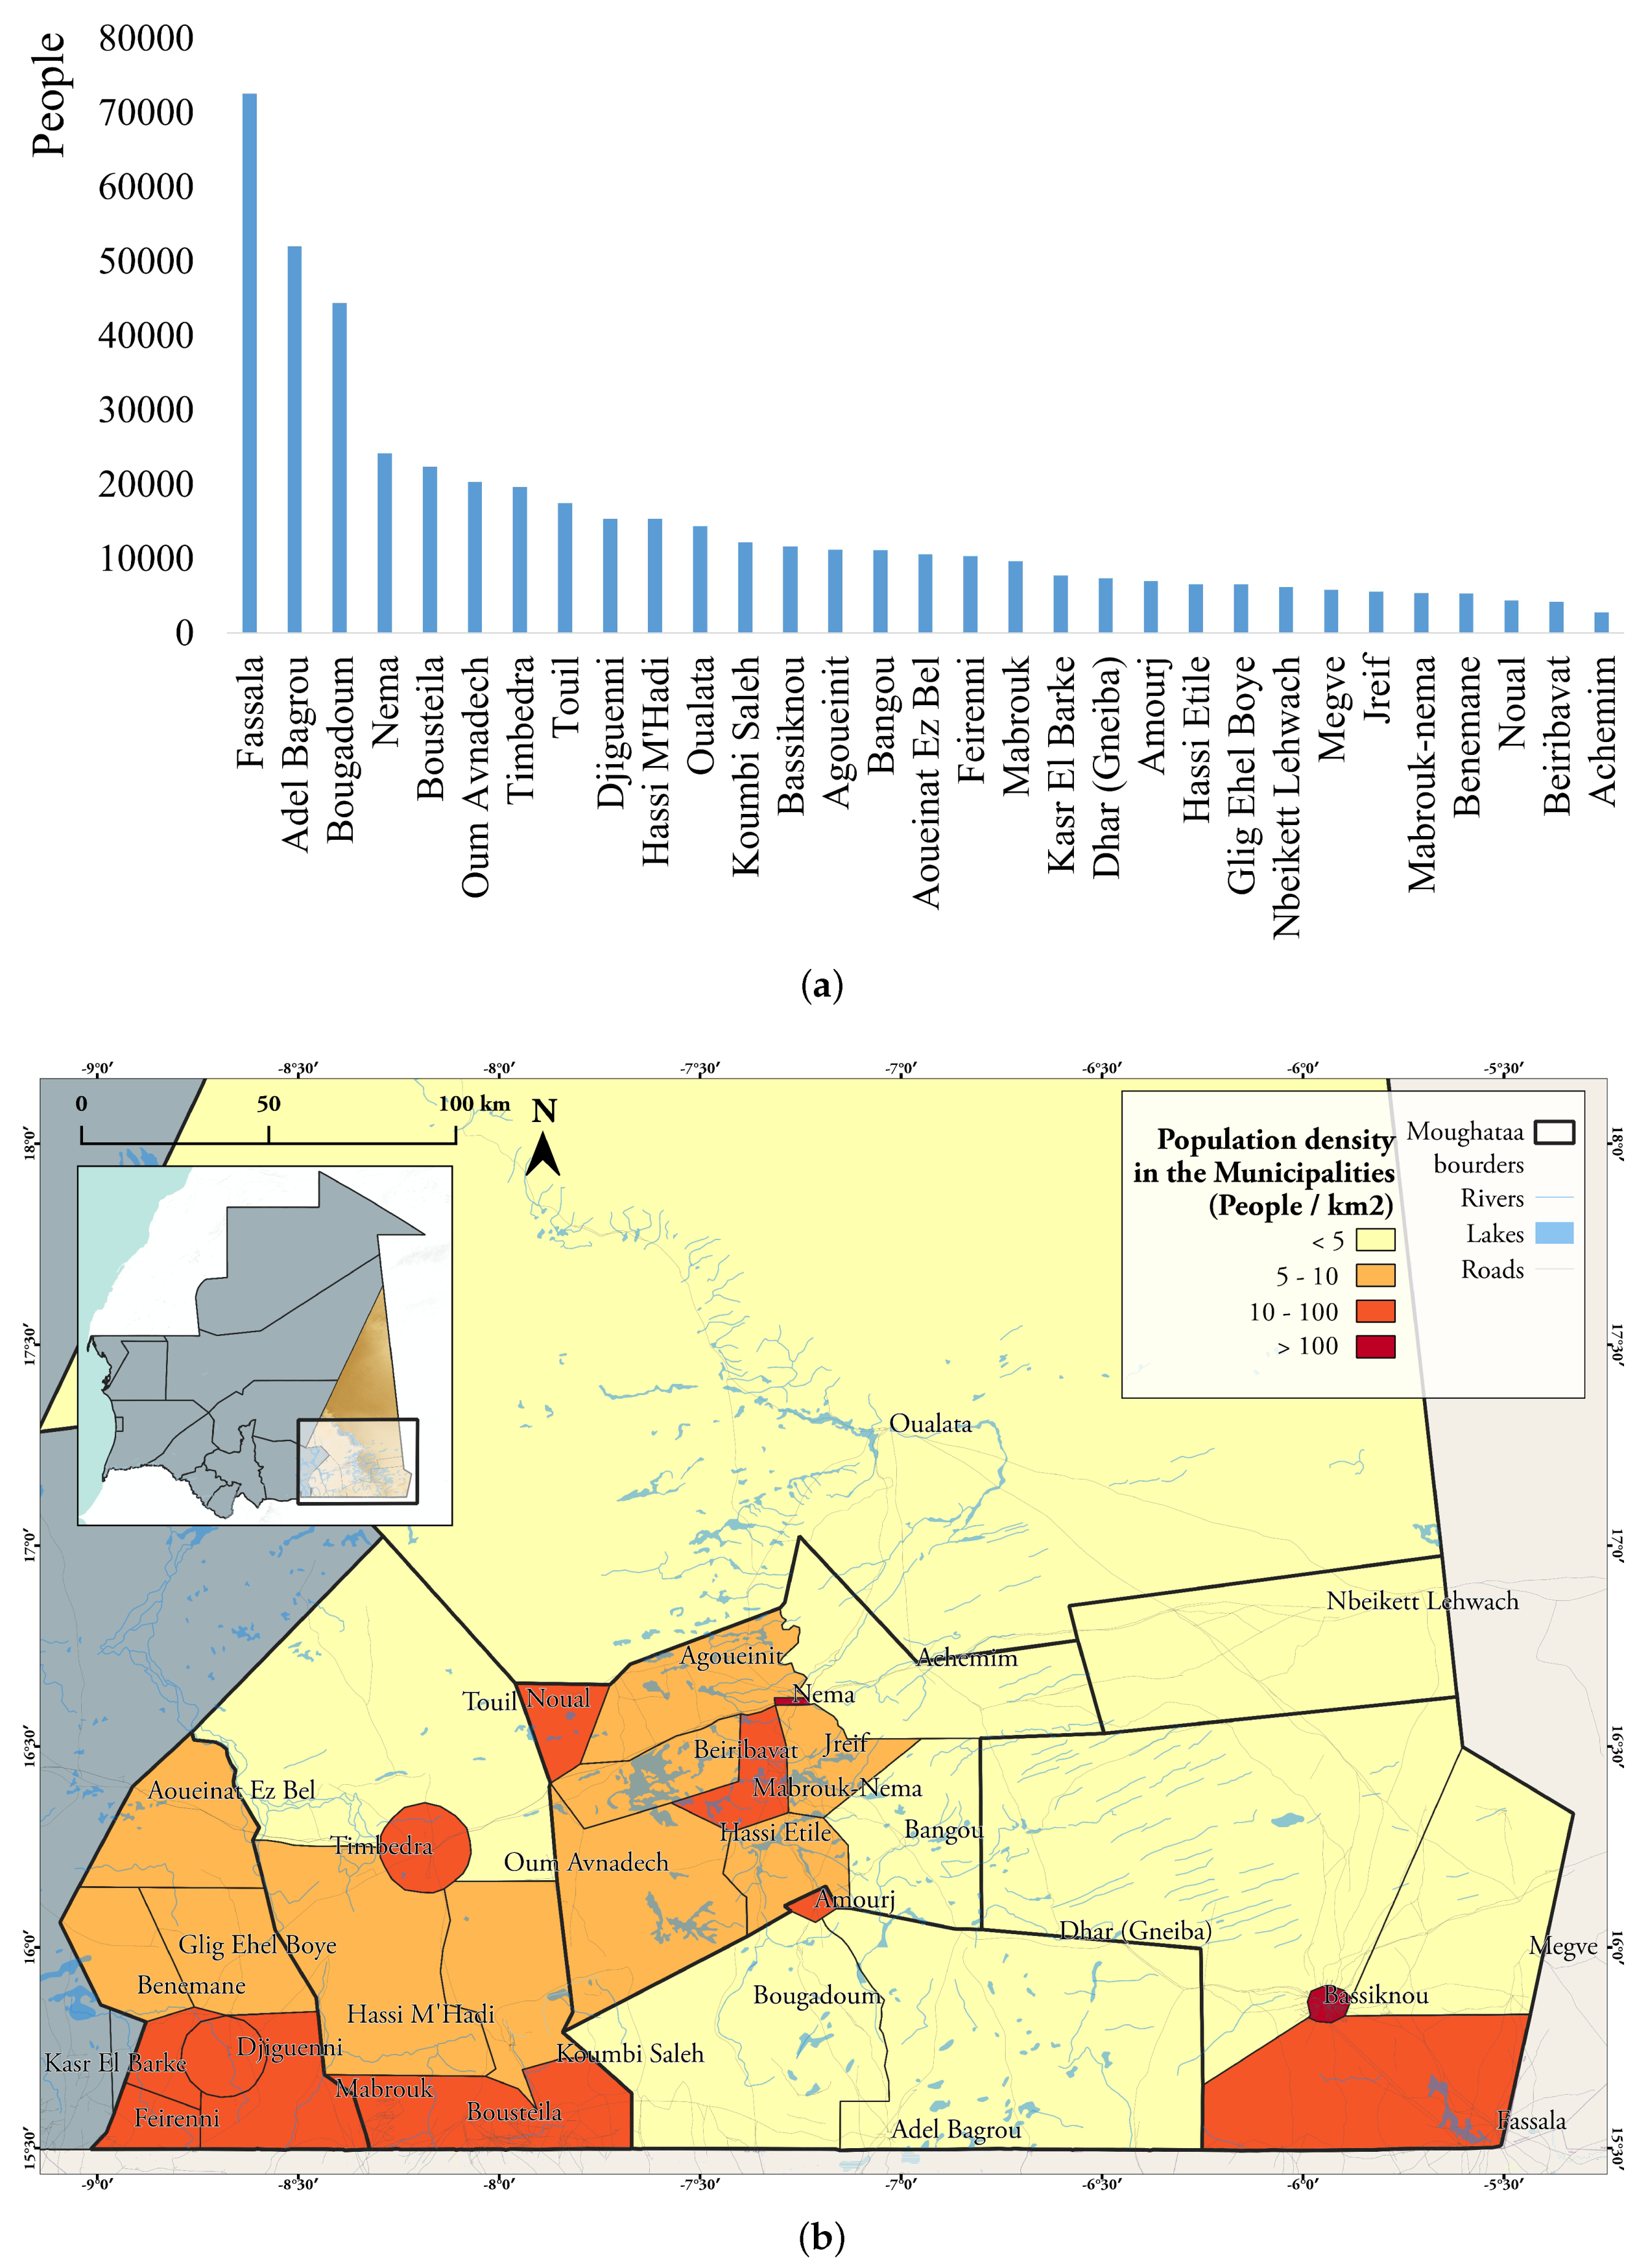
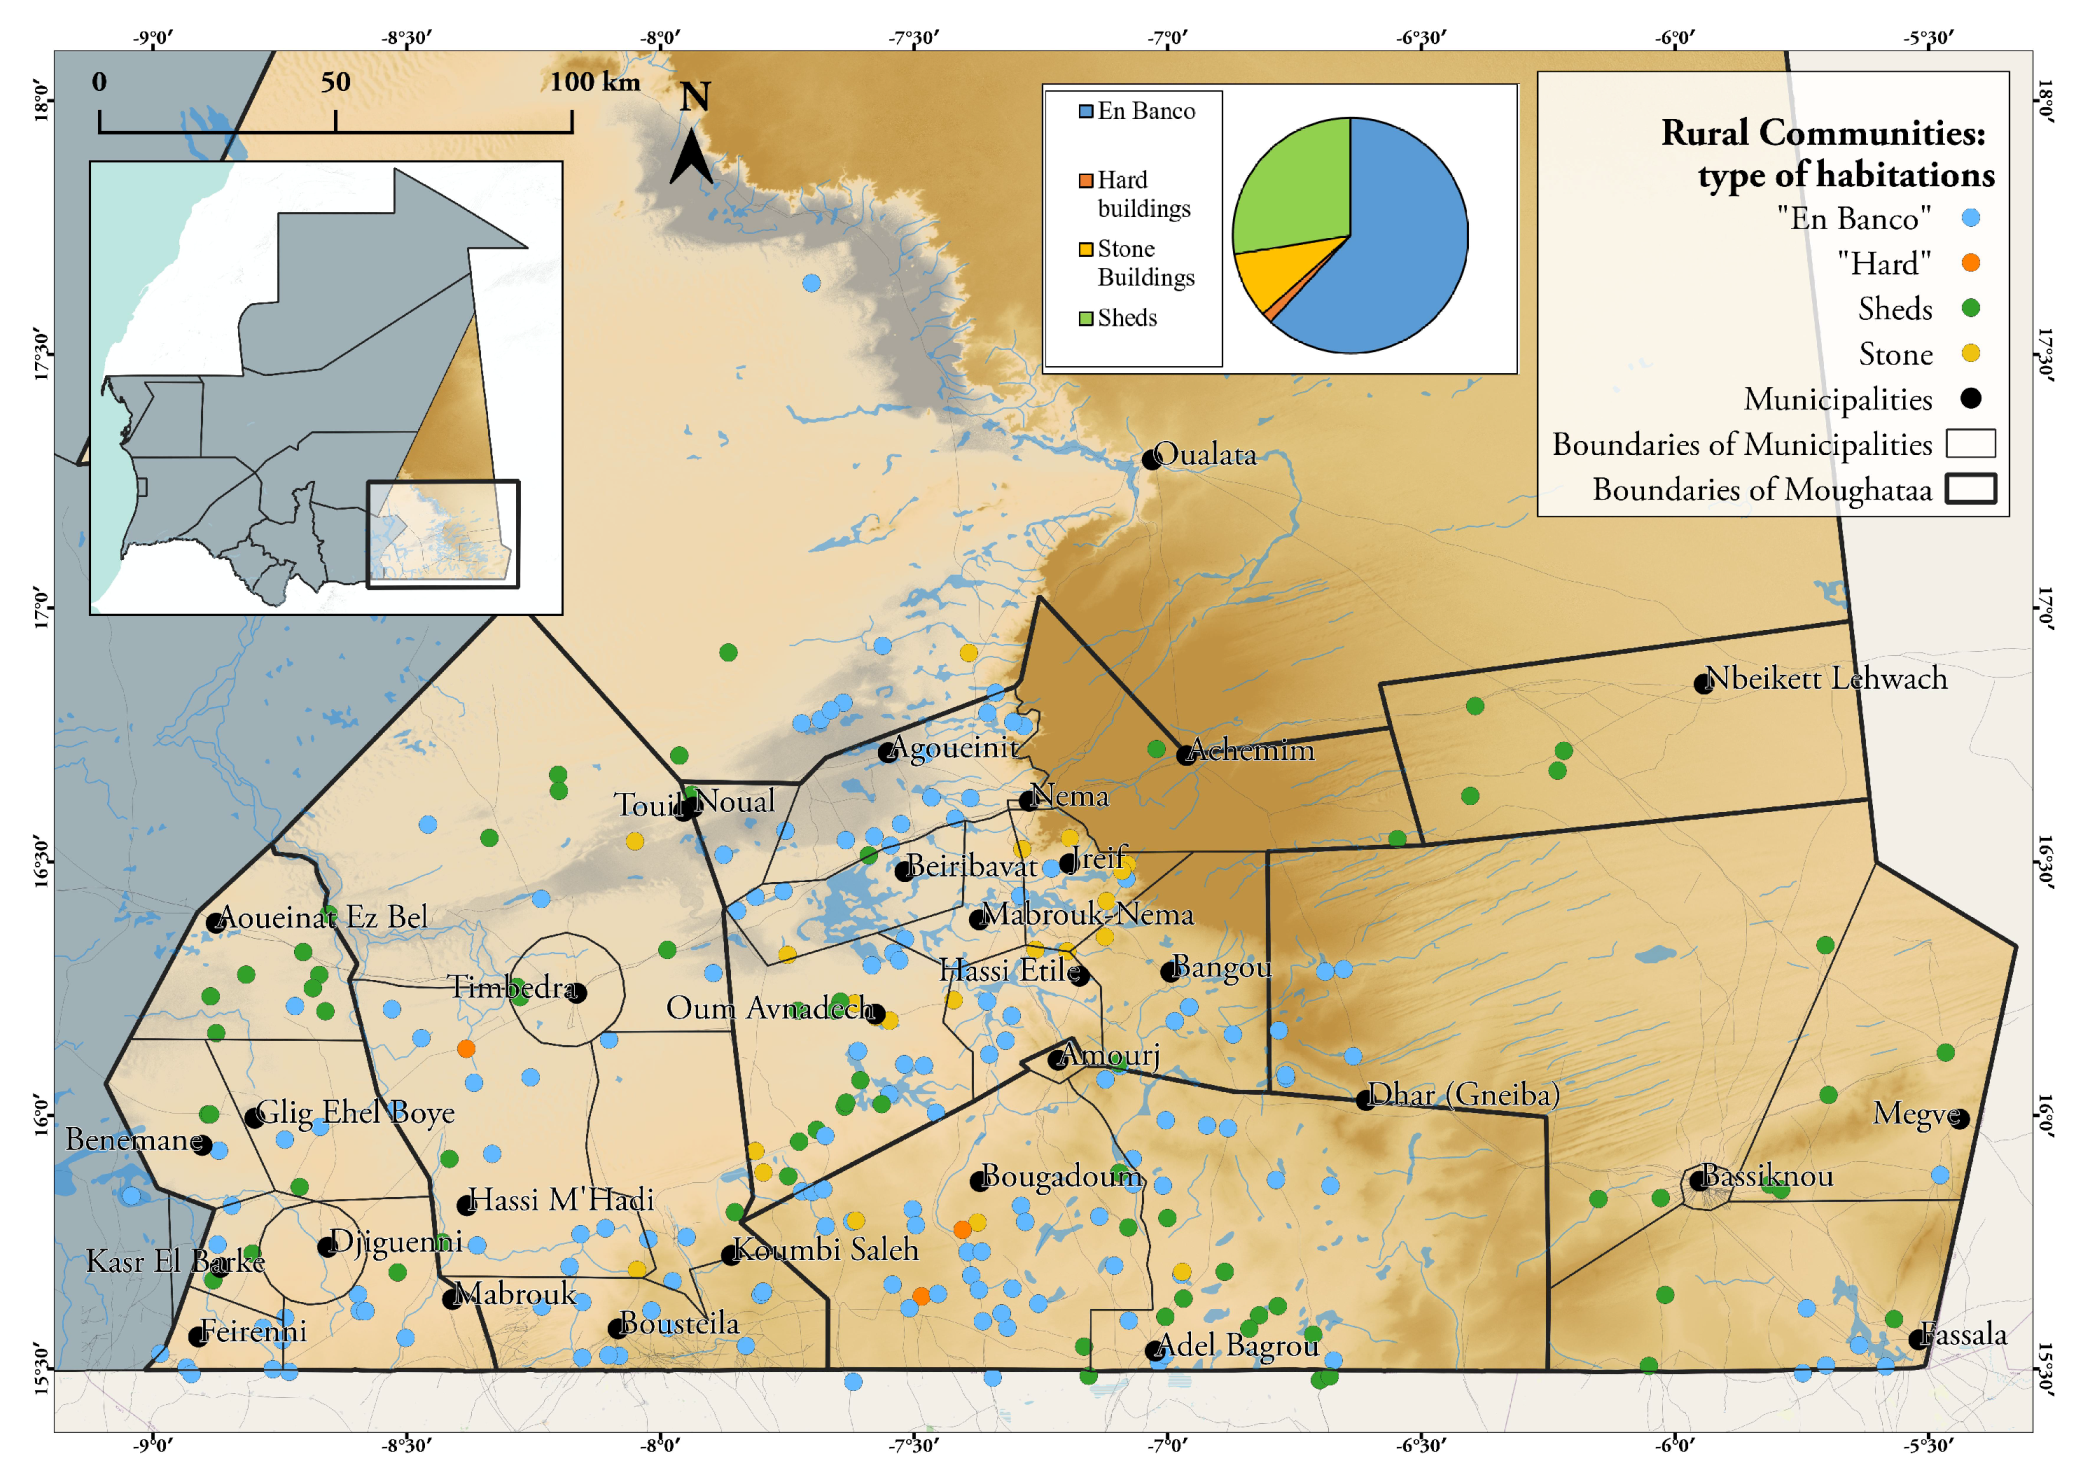
3.1.1. Demography and General Information
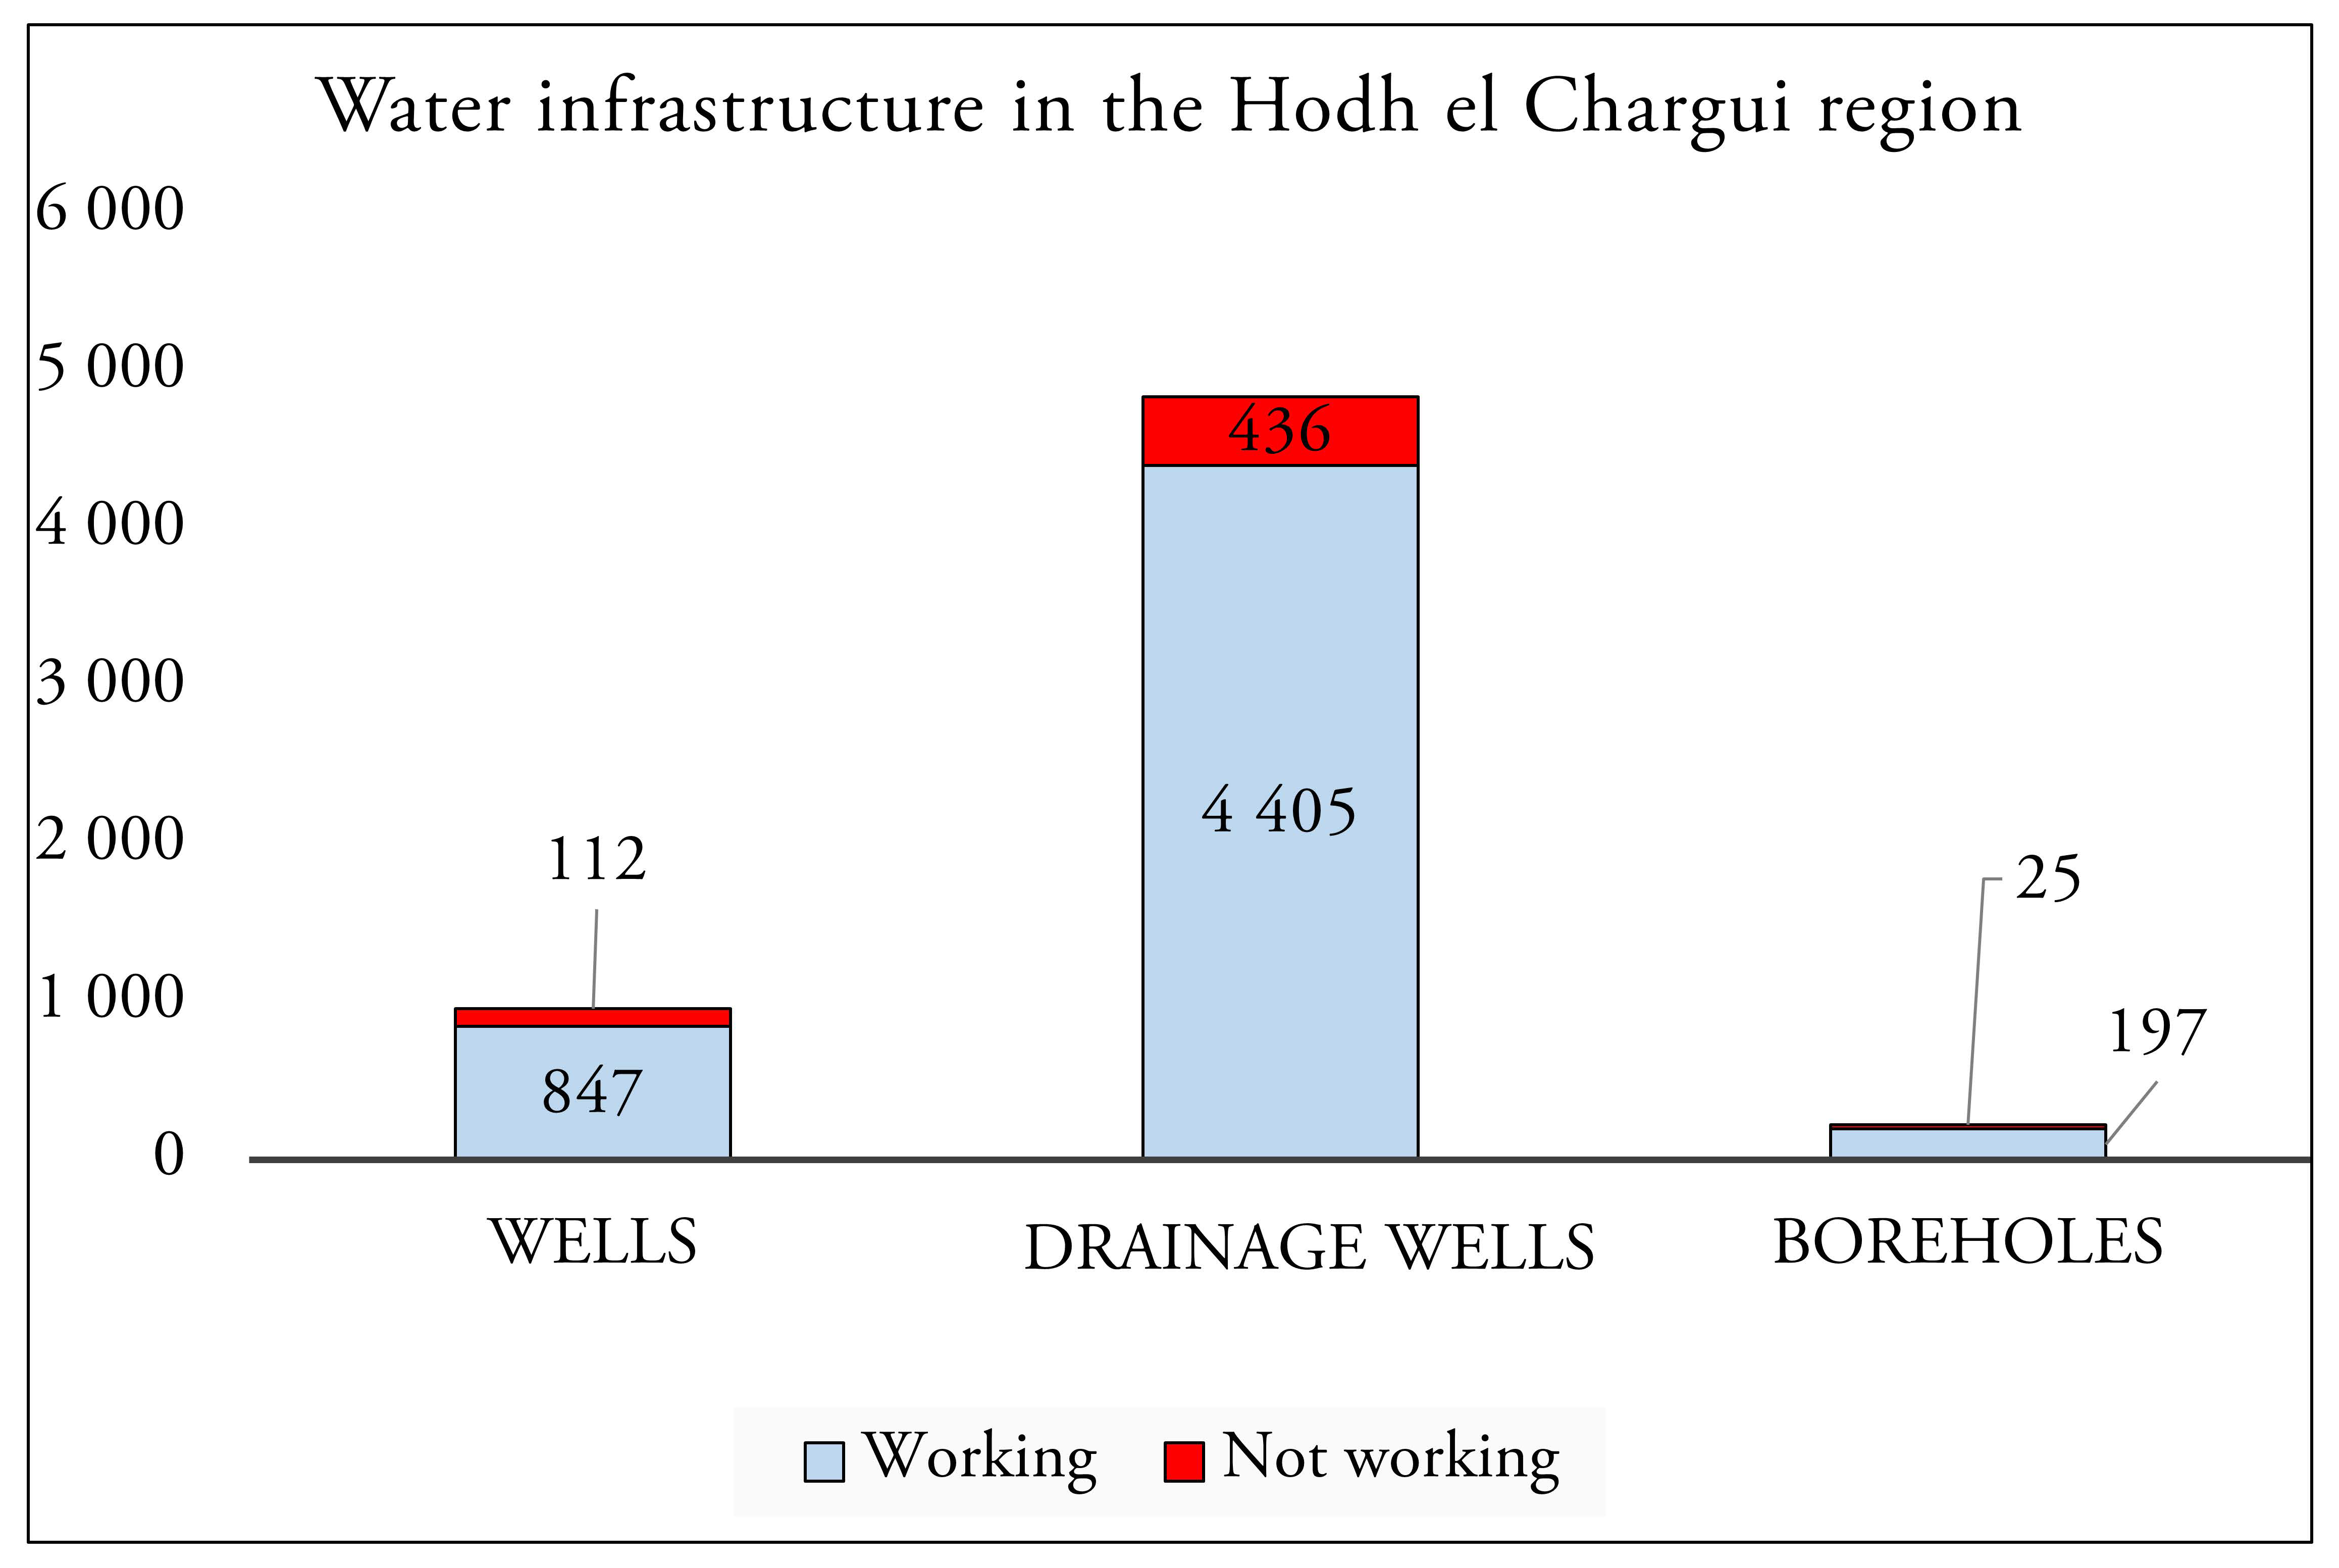
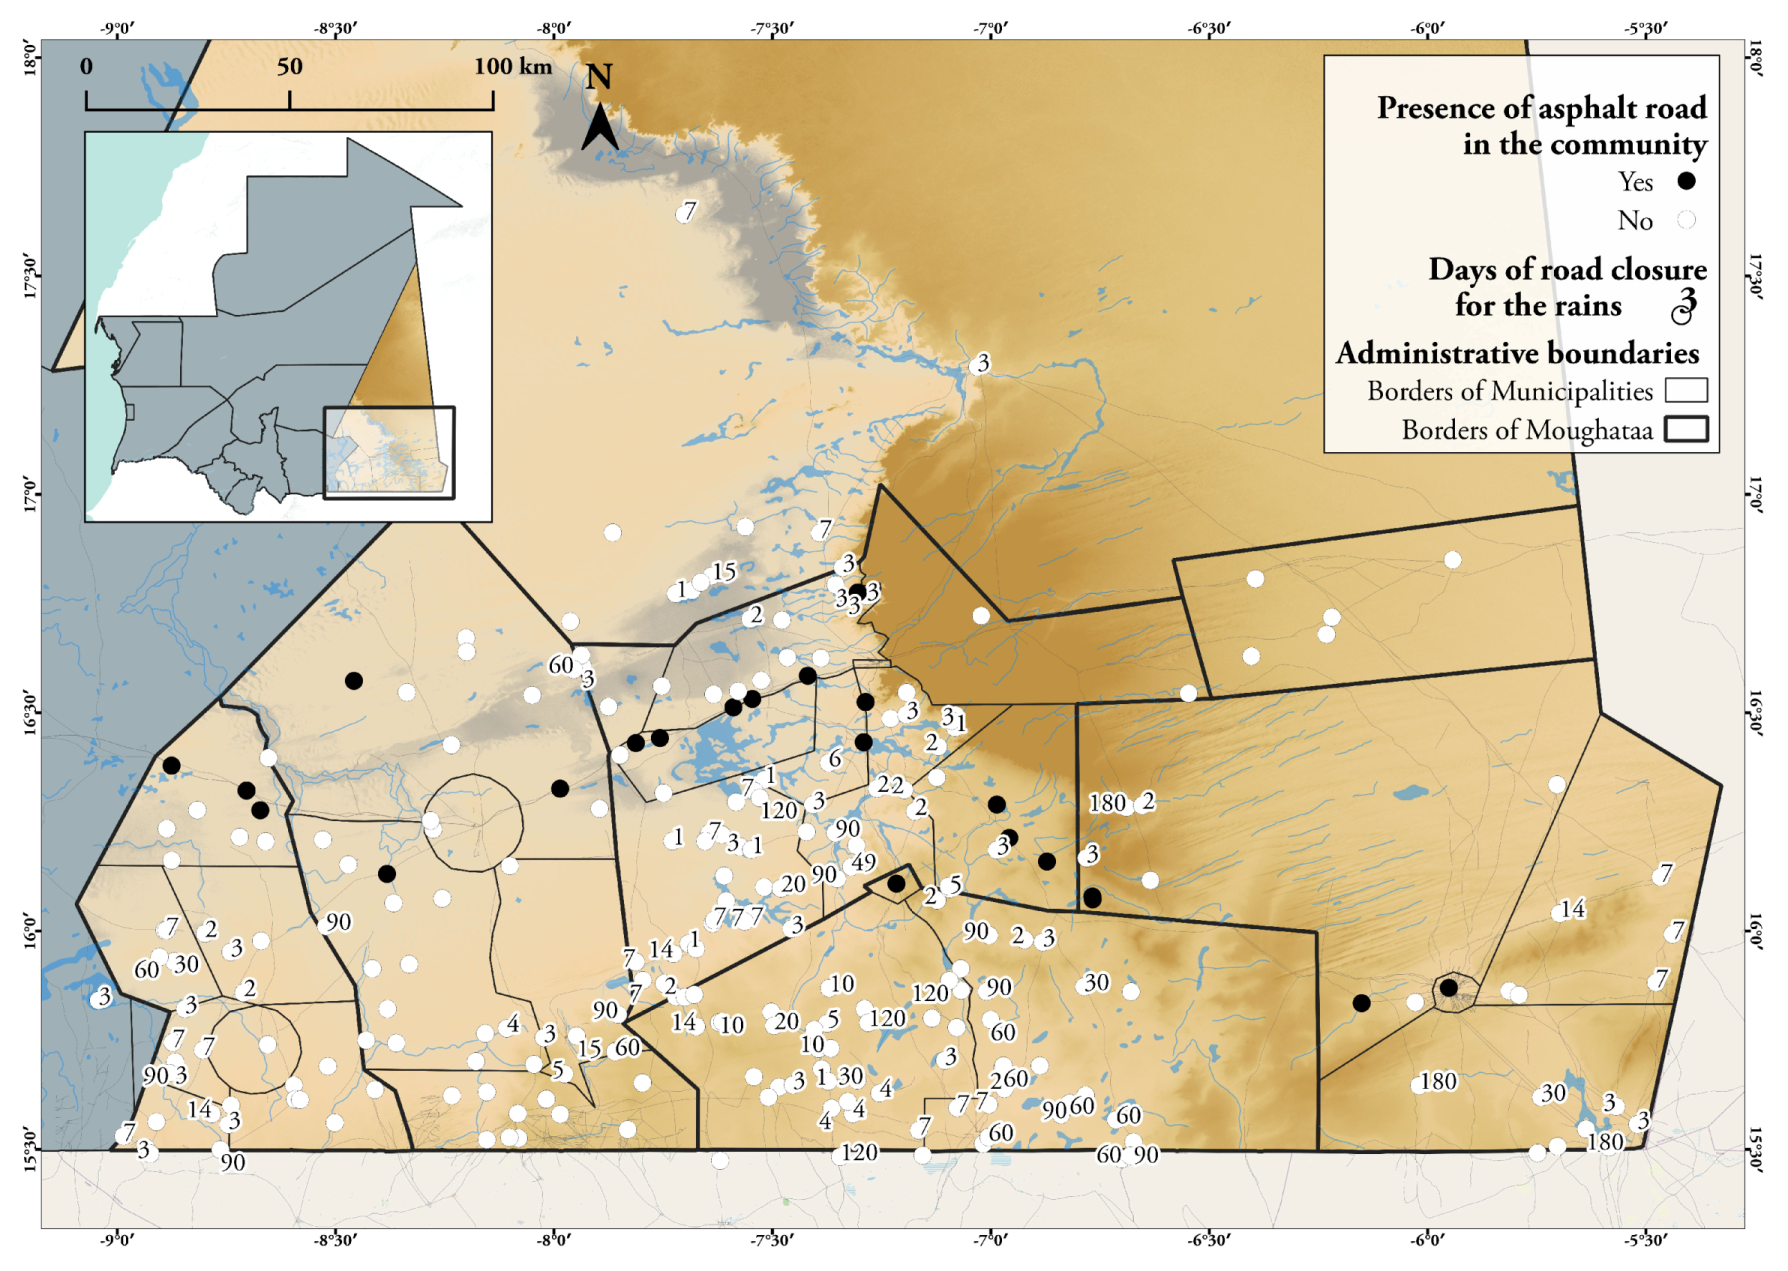
3.1.2. Infrastructure
- well: hand-excavated wells and, therefore, generally shallow, with manual systems for the water extraction;
- drainage well: large diameter wells (1–2 m), shallow, hand-dug, where the groundwater flows by gravity;
- borehole: small-diameter hole advanced below the ground surface by various drilling rigs, mostly equipped with a pump.
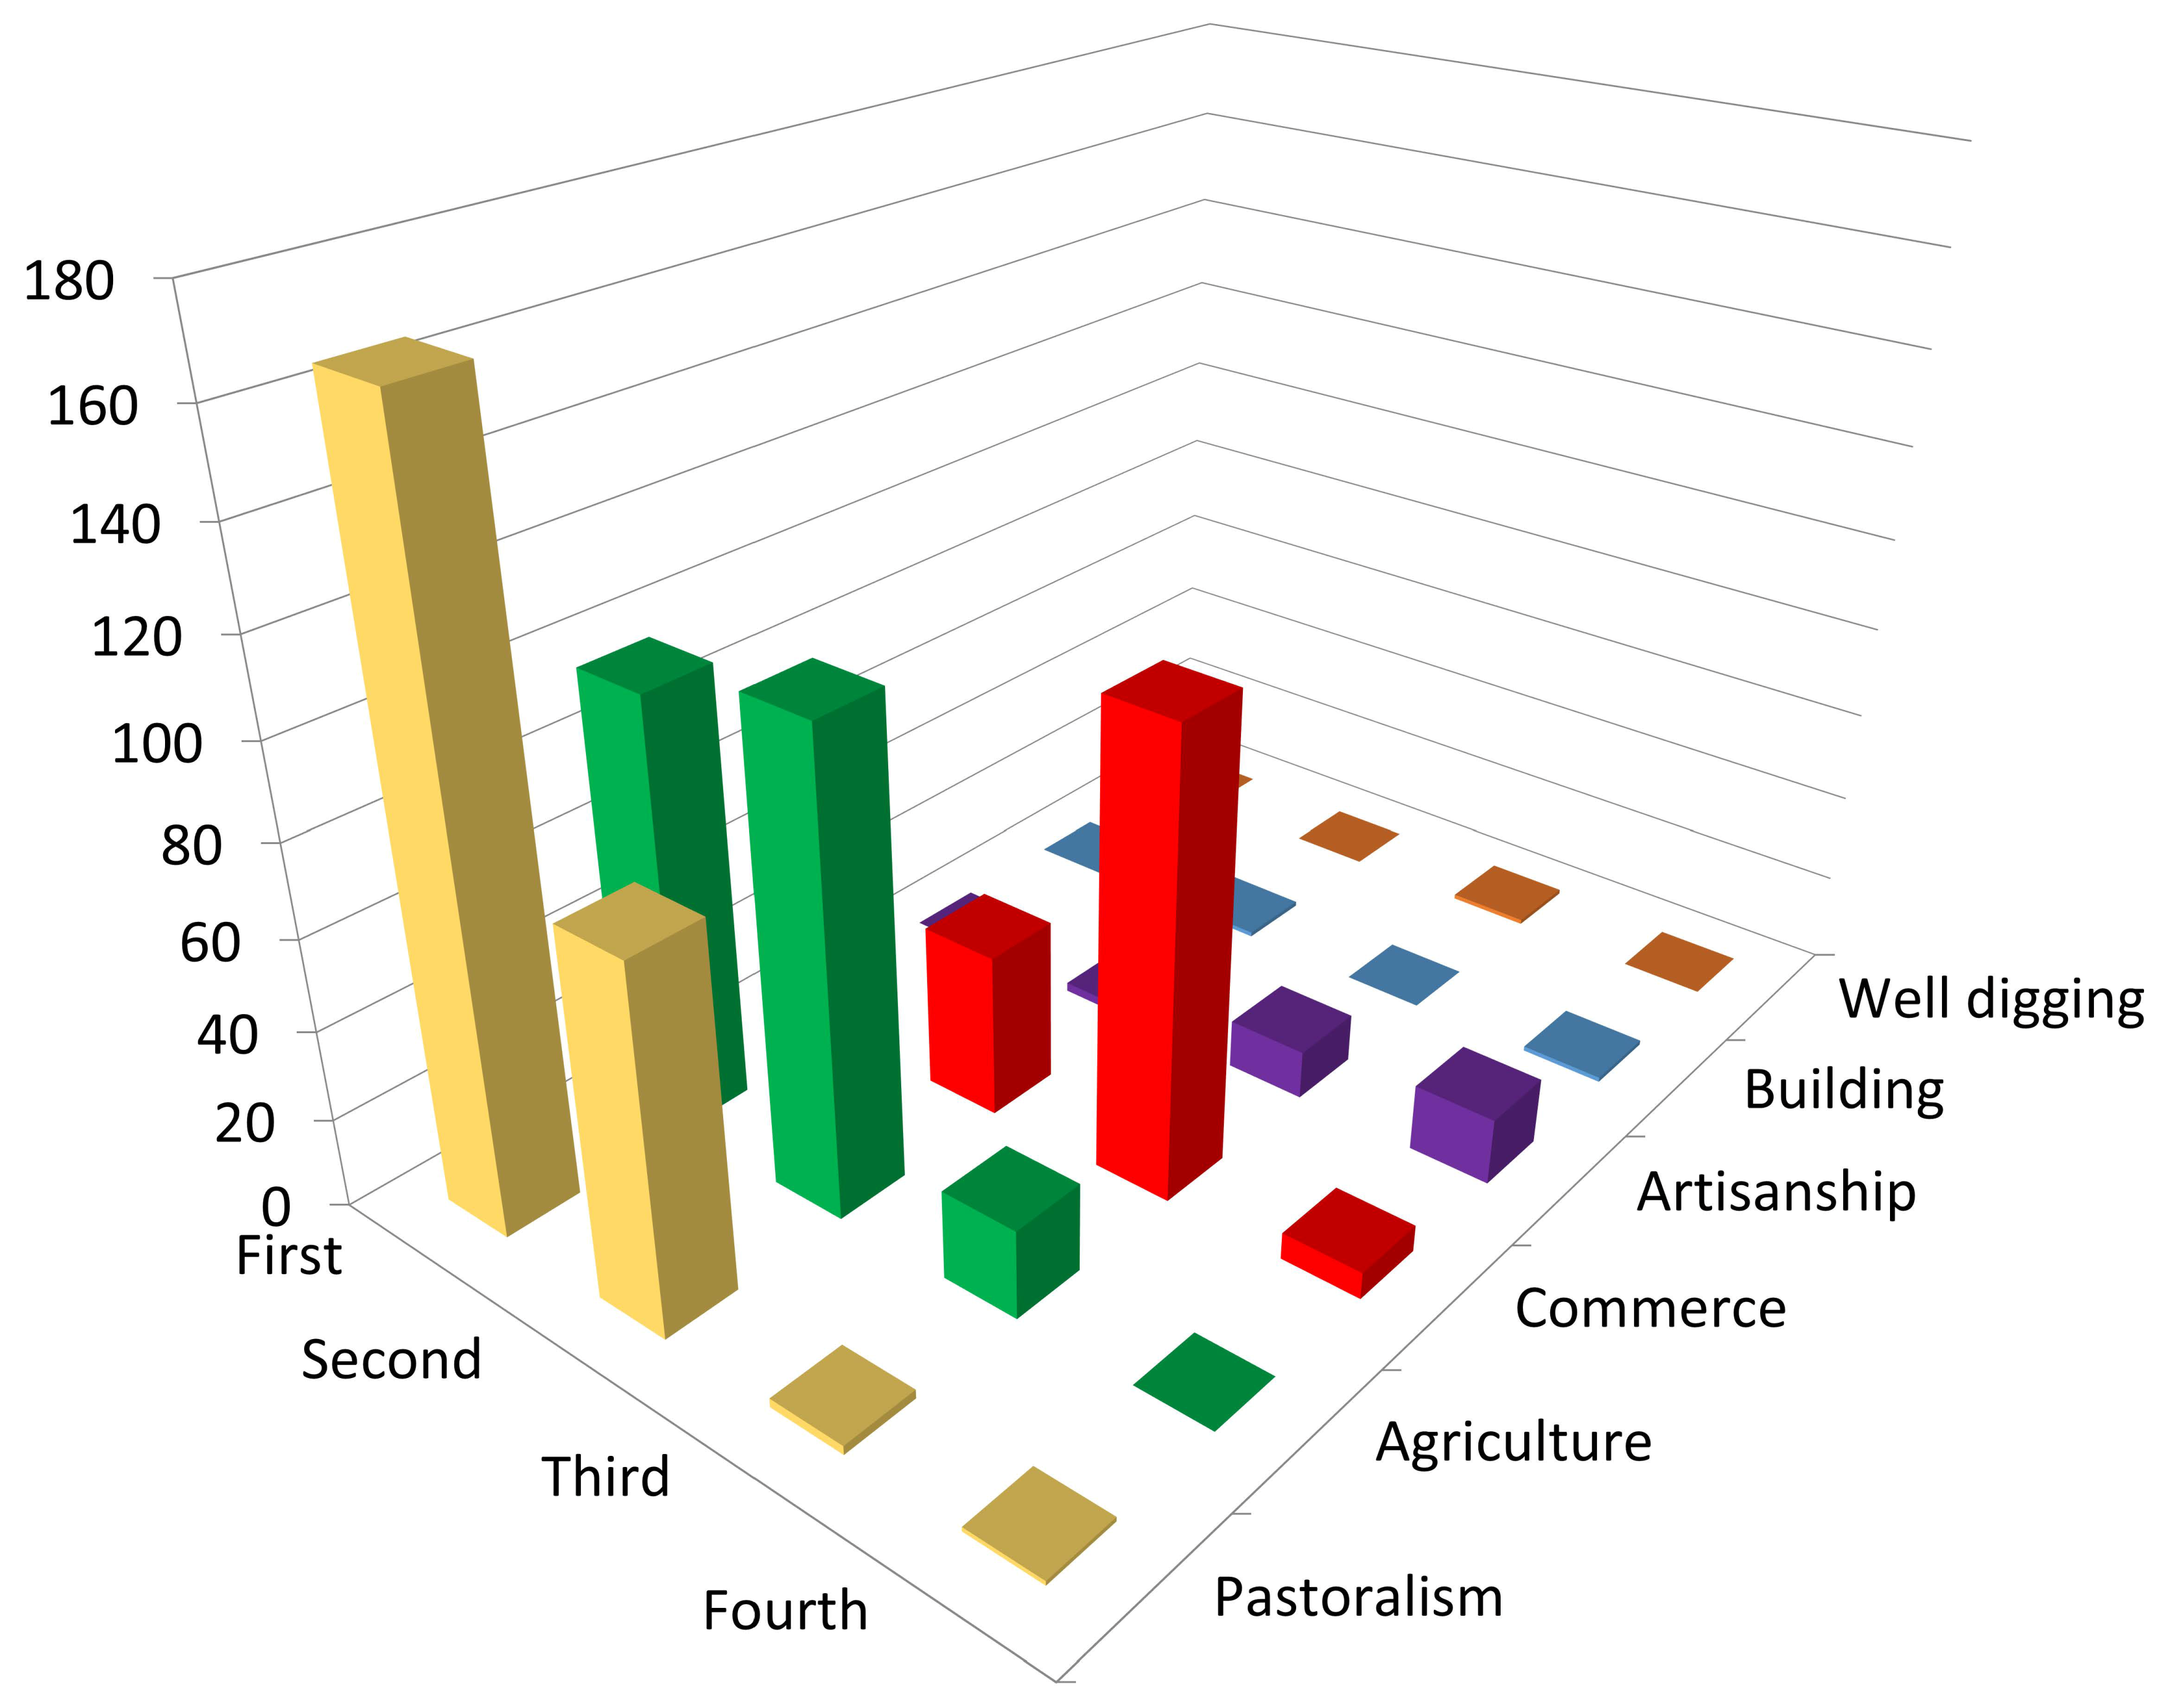
3.1.3. Principal Economic Activities
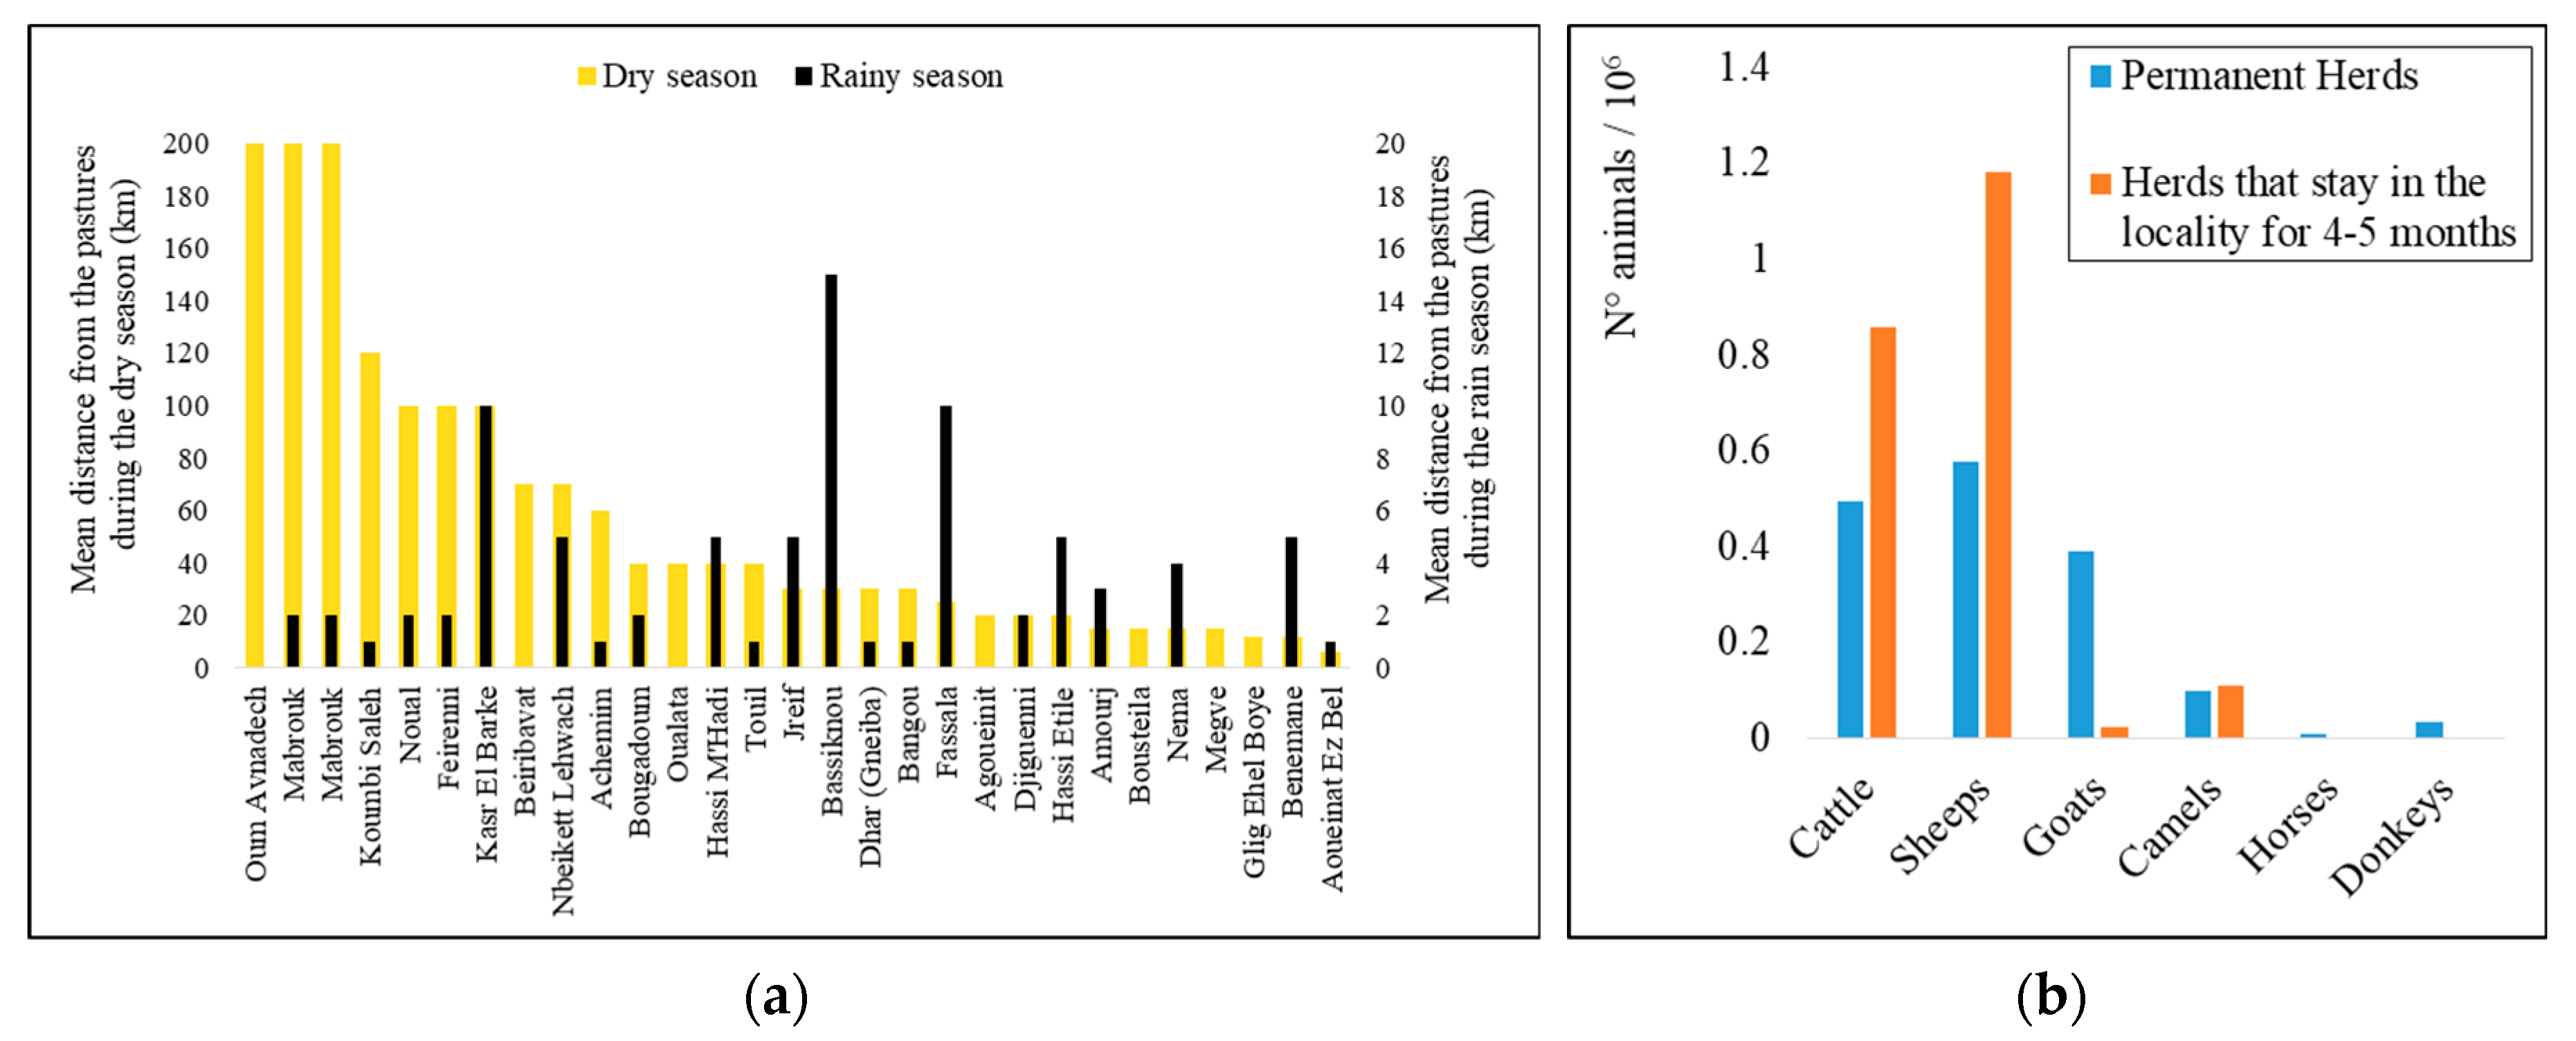
3.1.4. Natural Resources
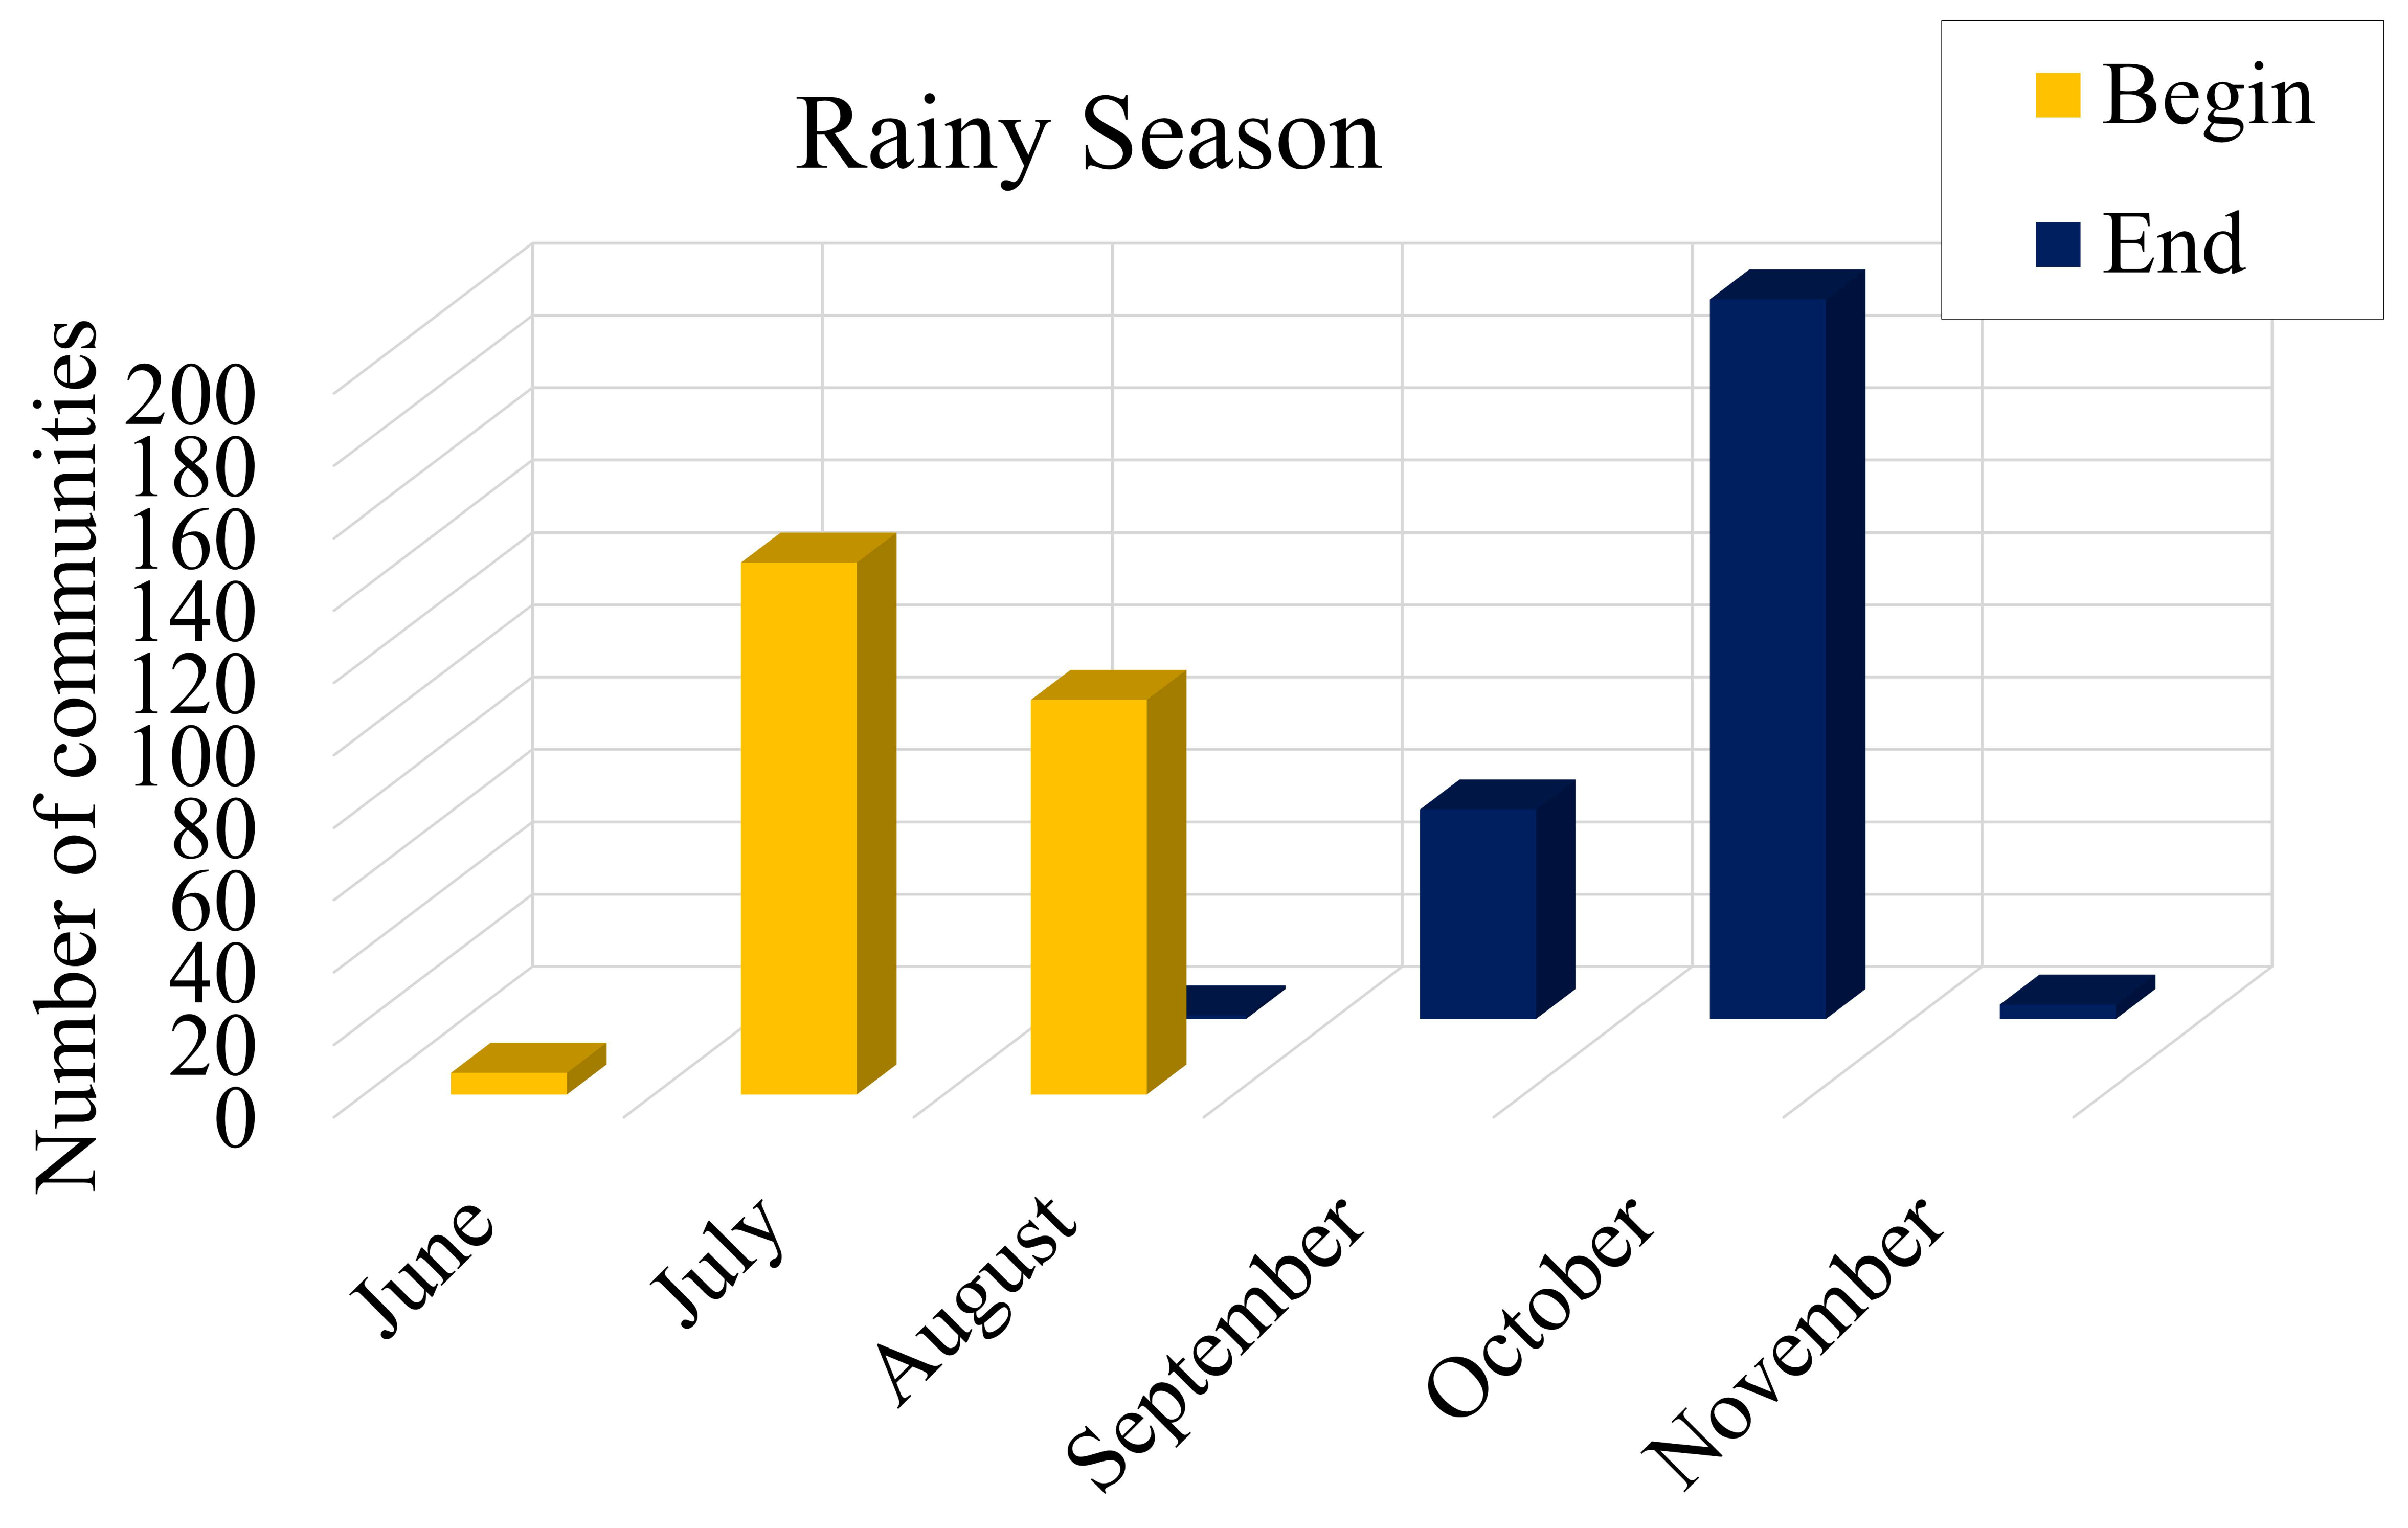
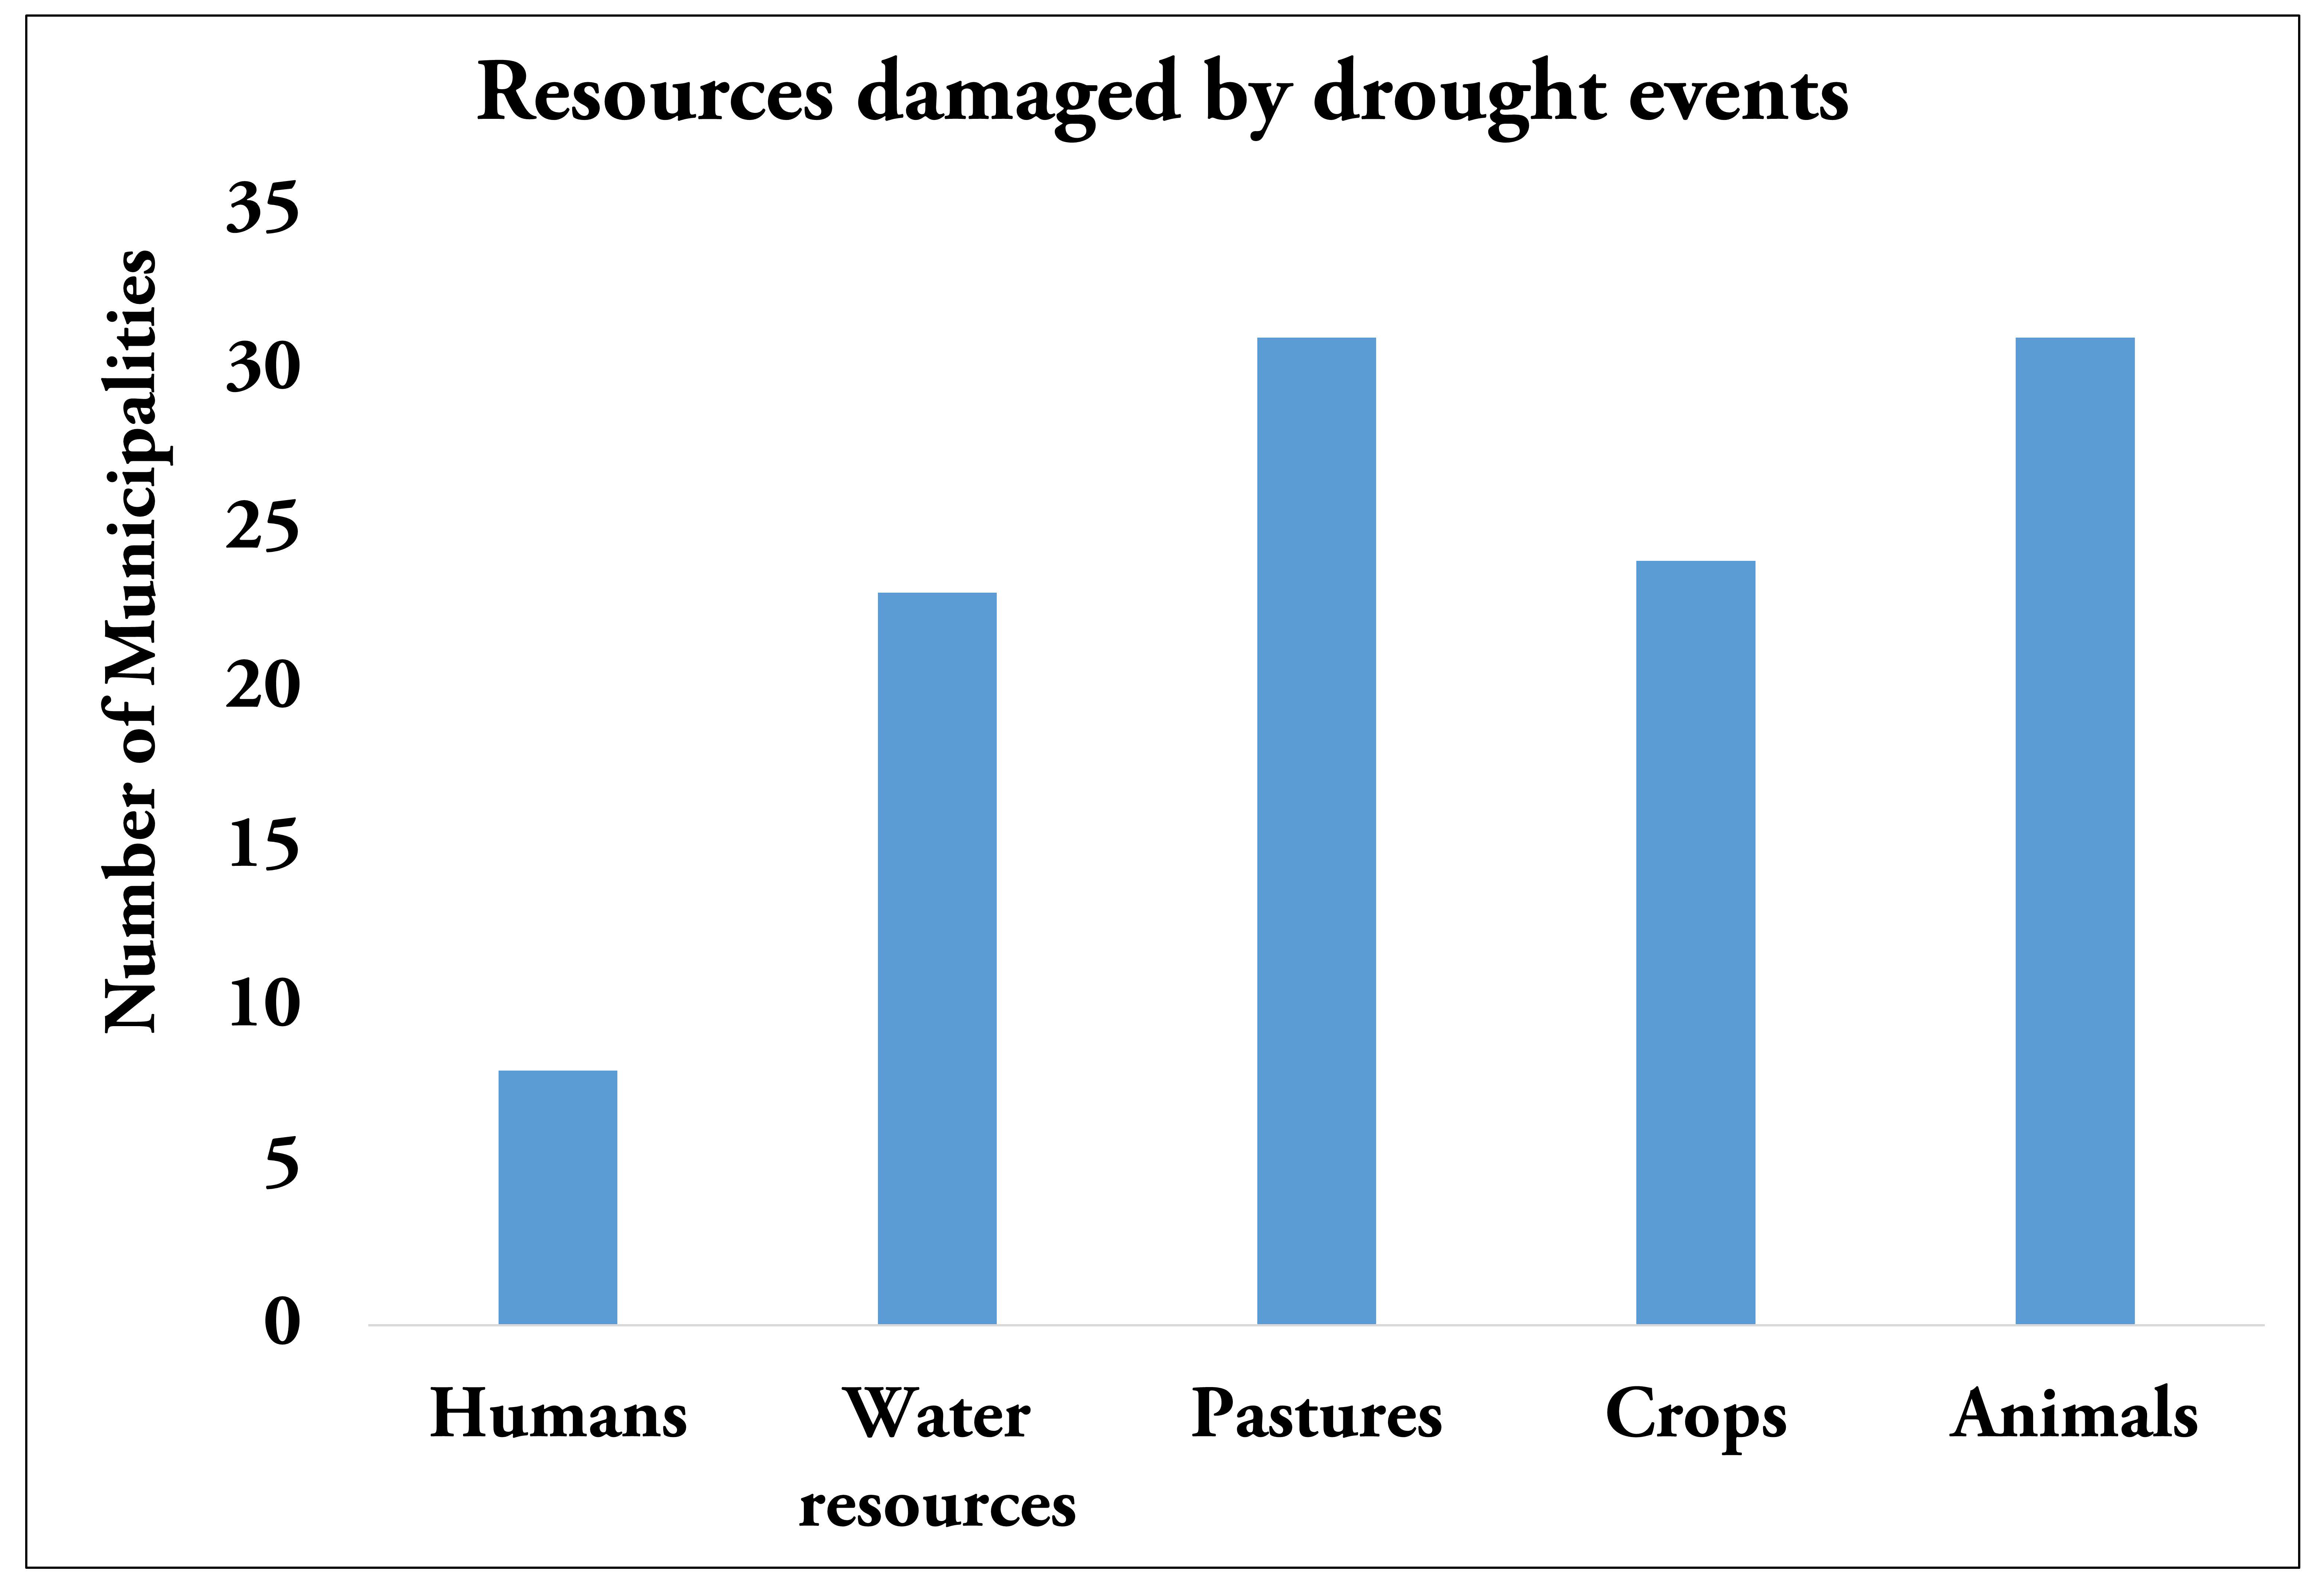
3.1.5. Influence of Climatic Change
3.2. Additional Analyses with EO Satellite Data
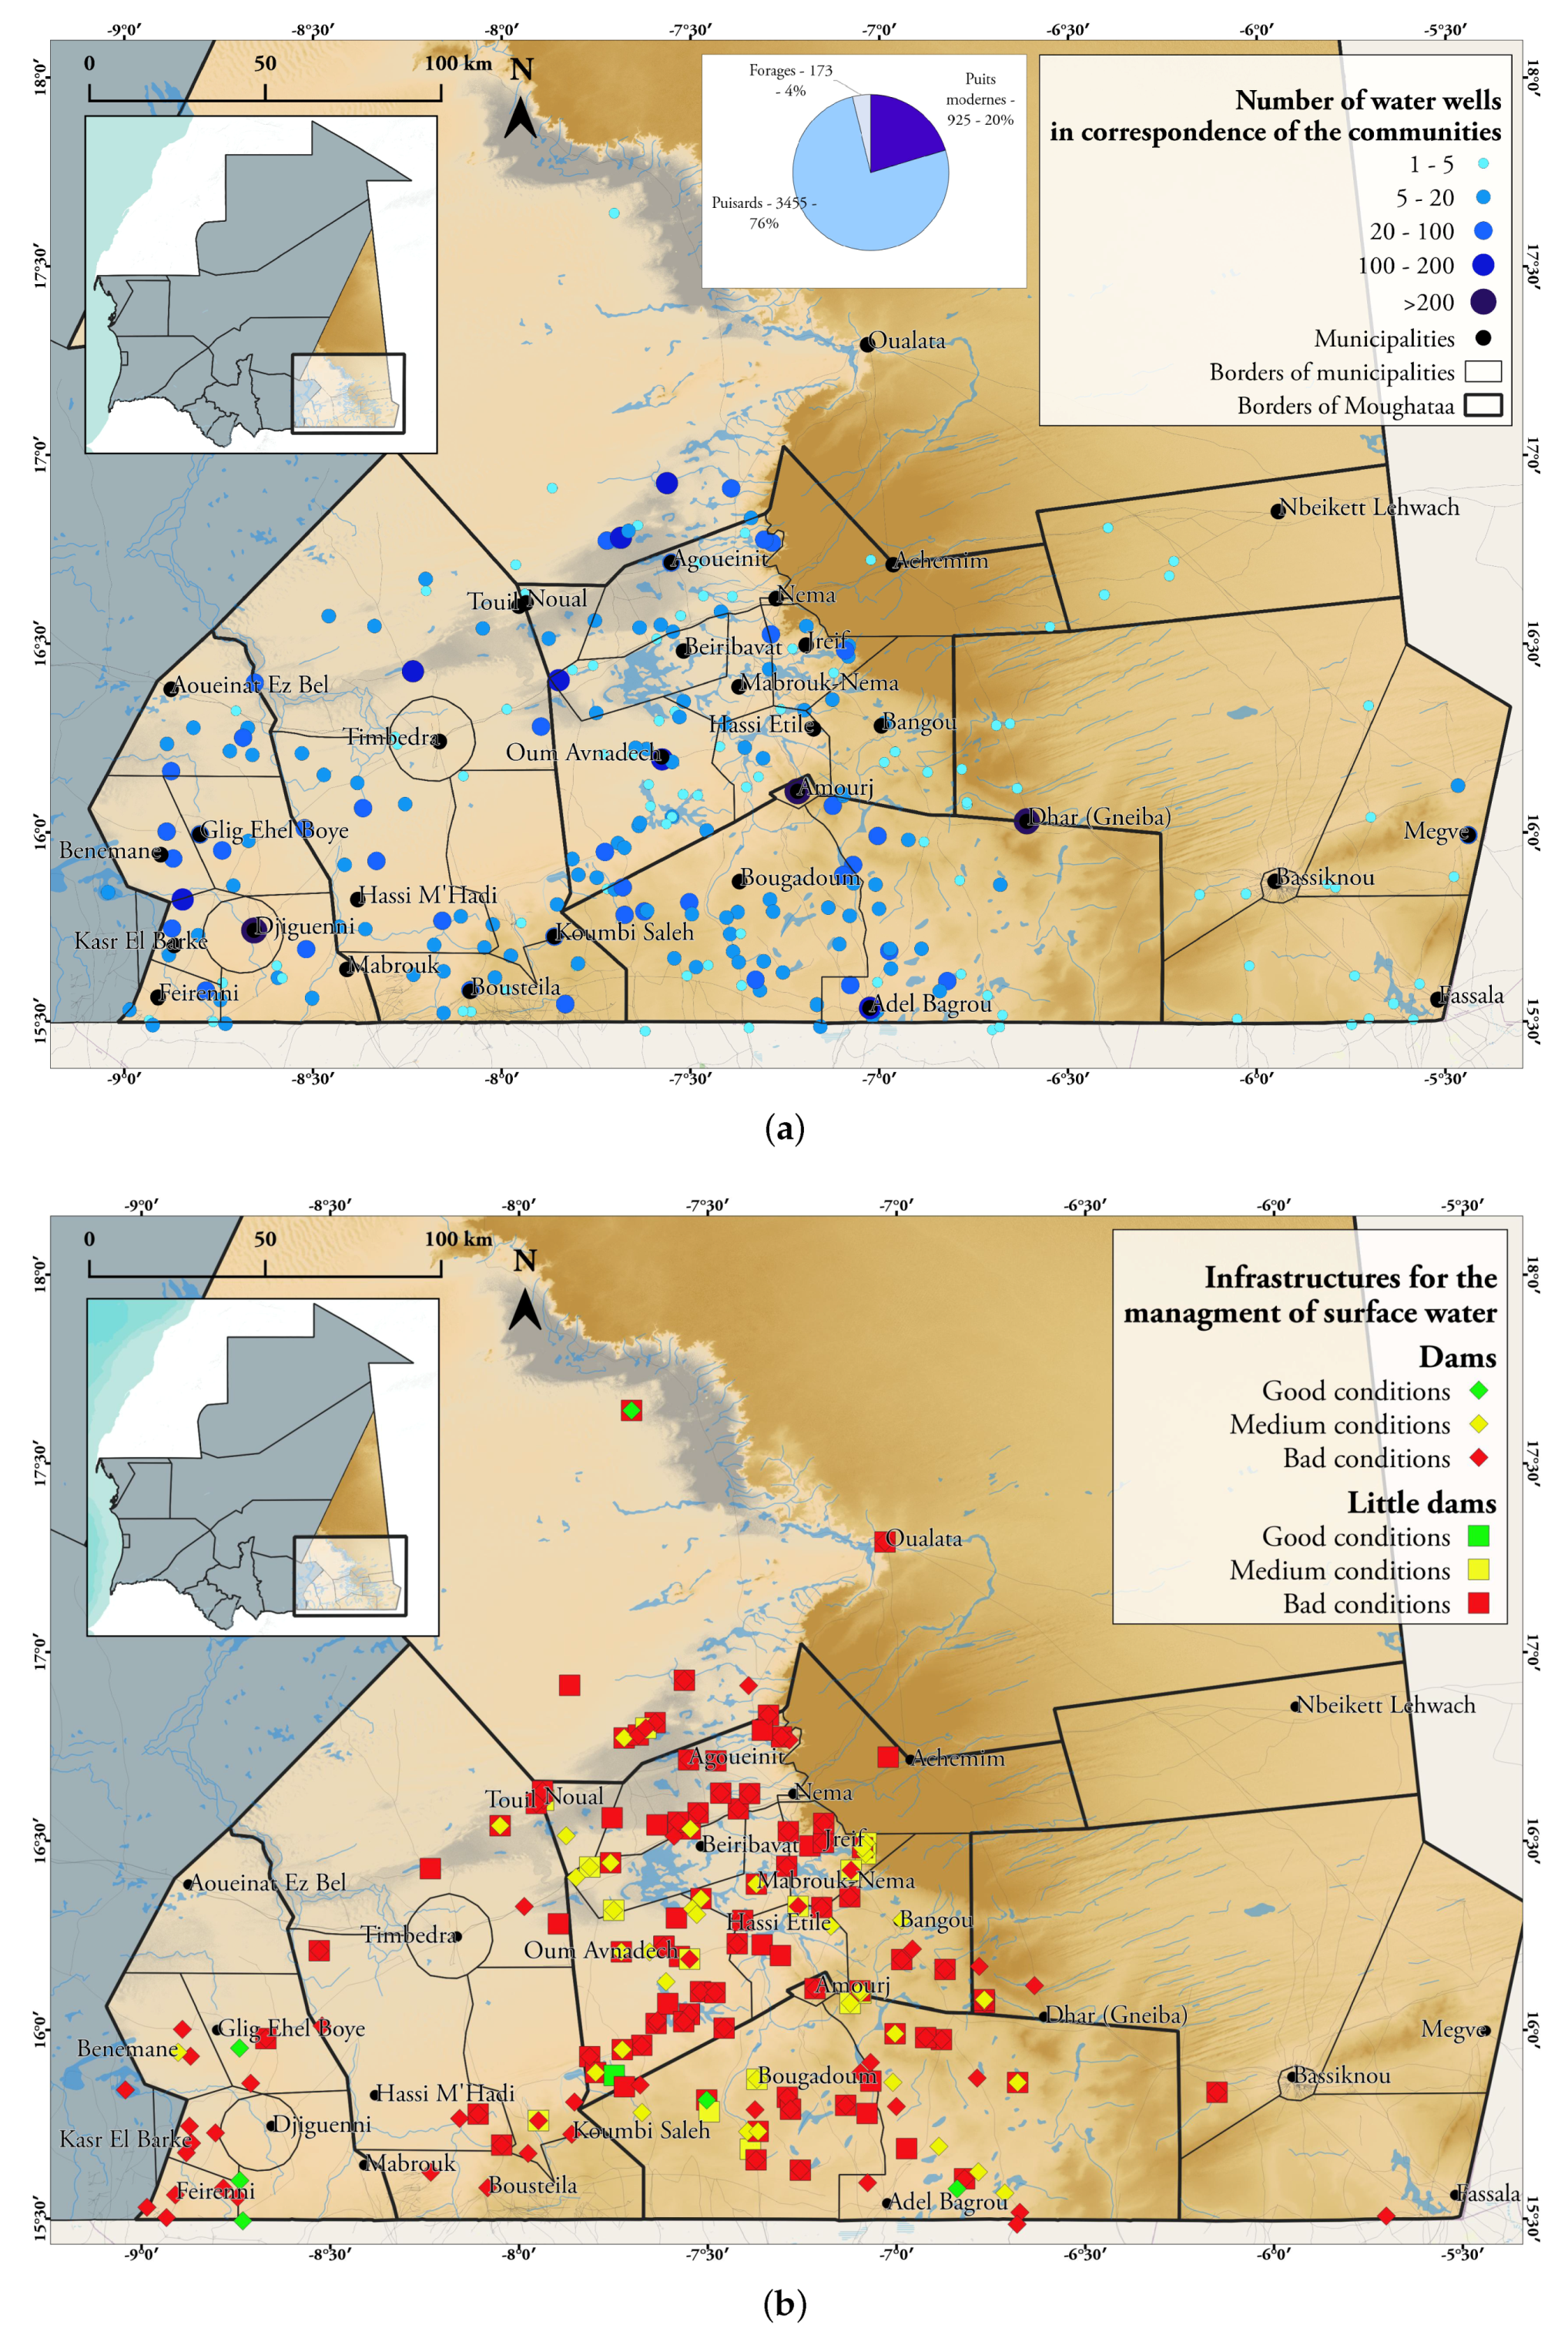
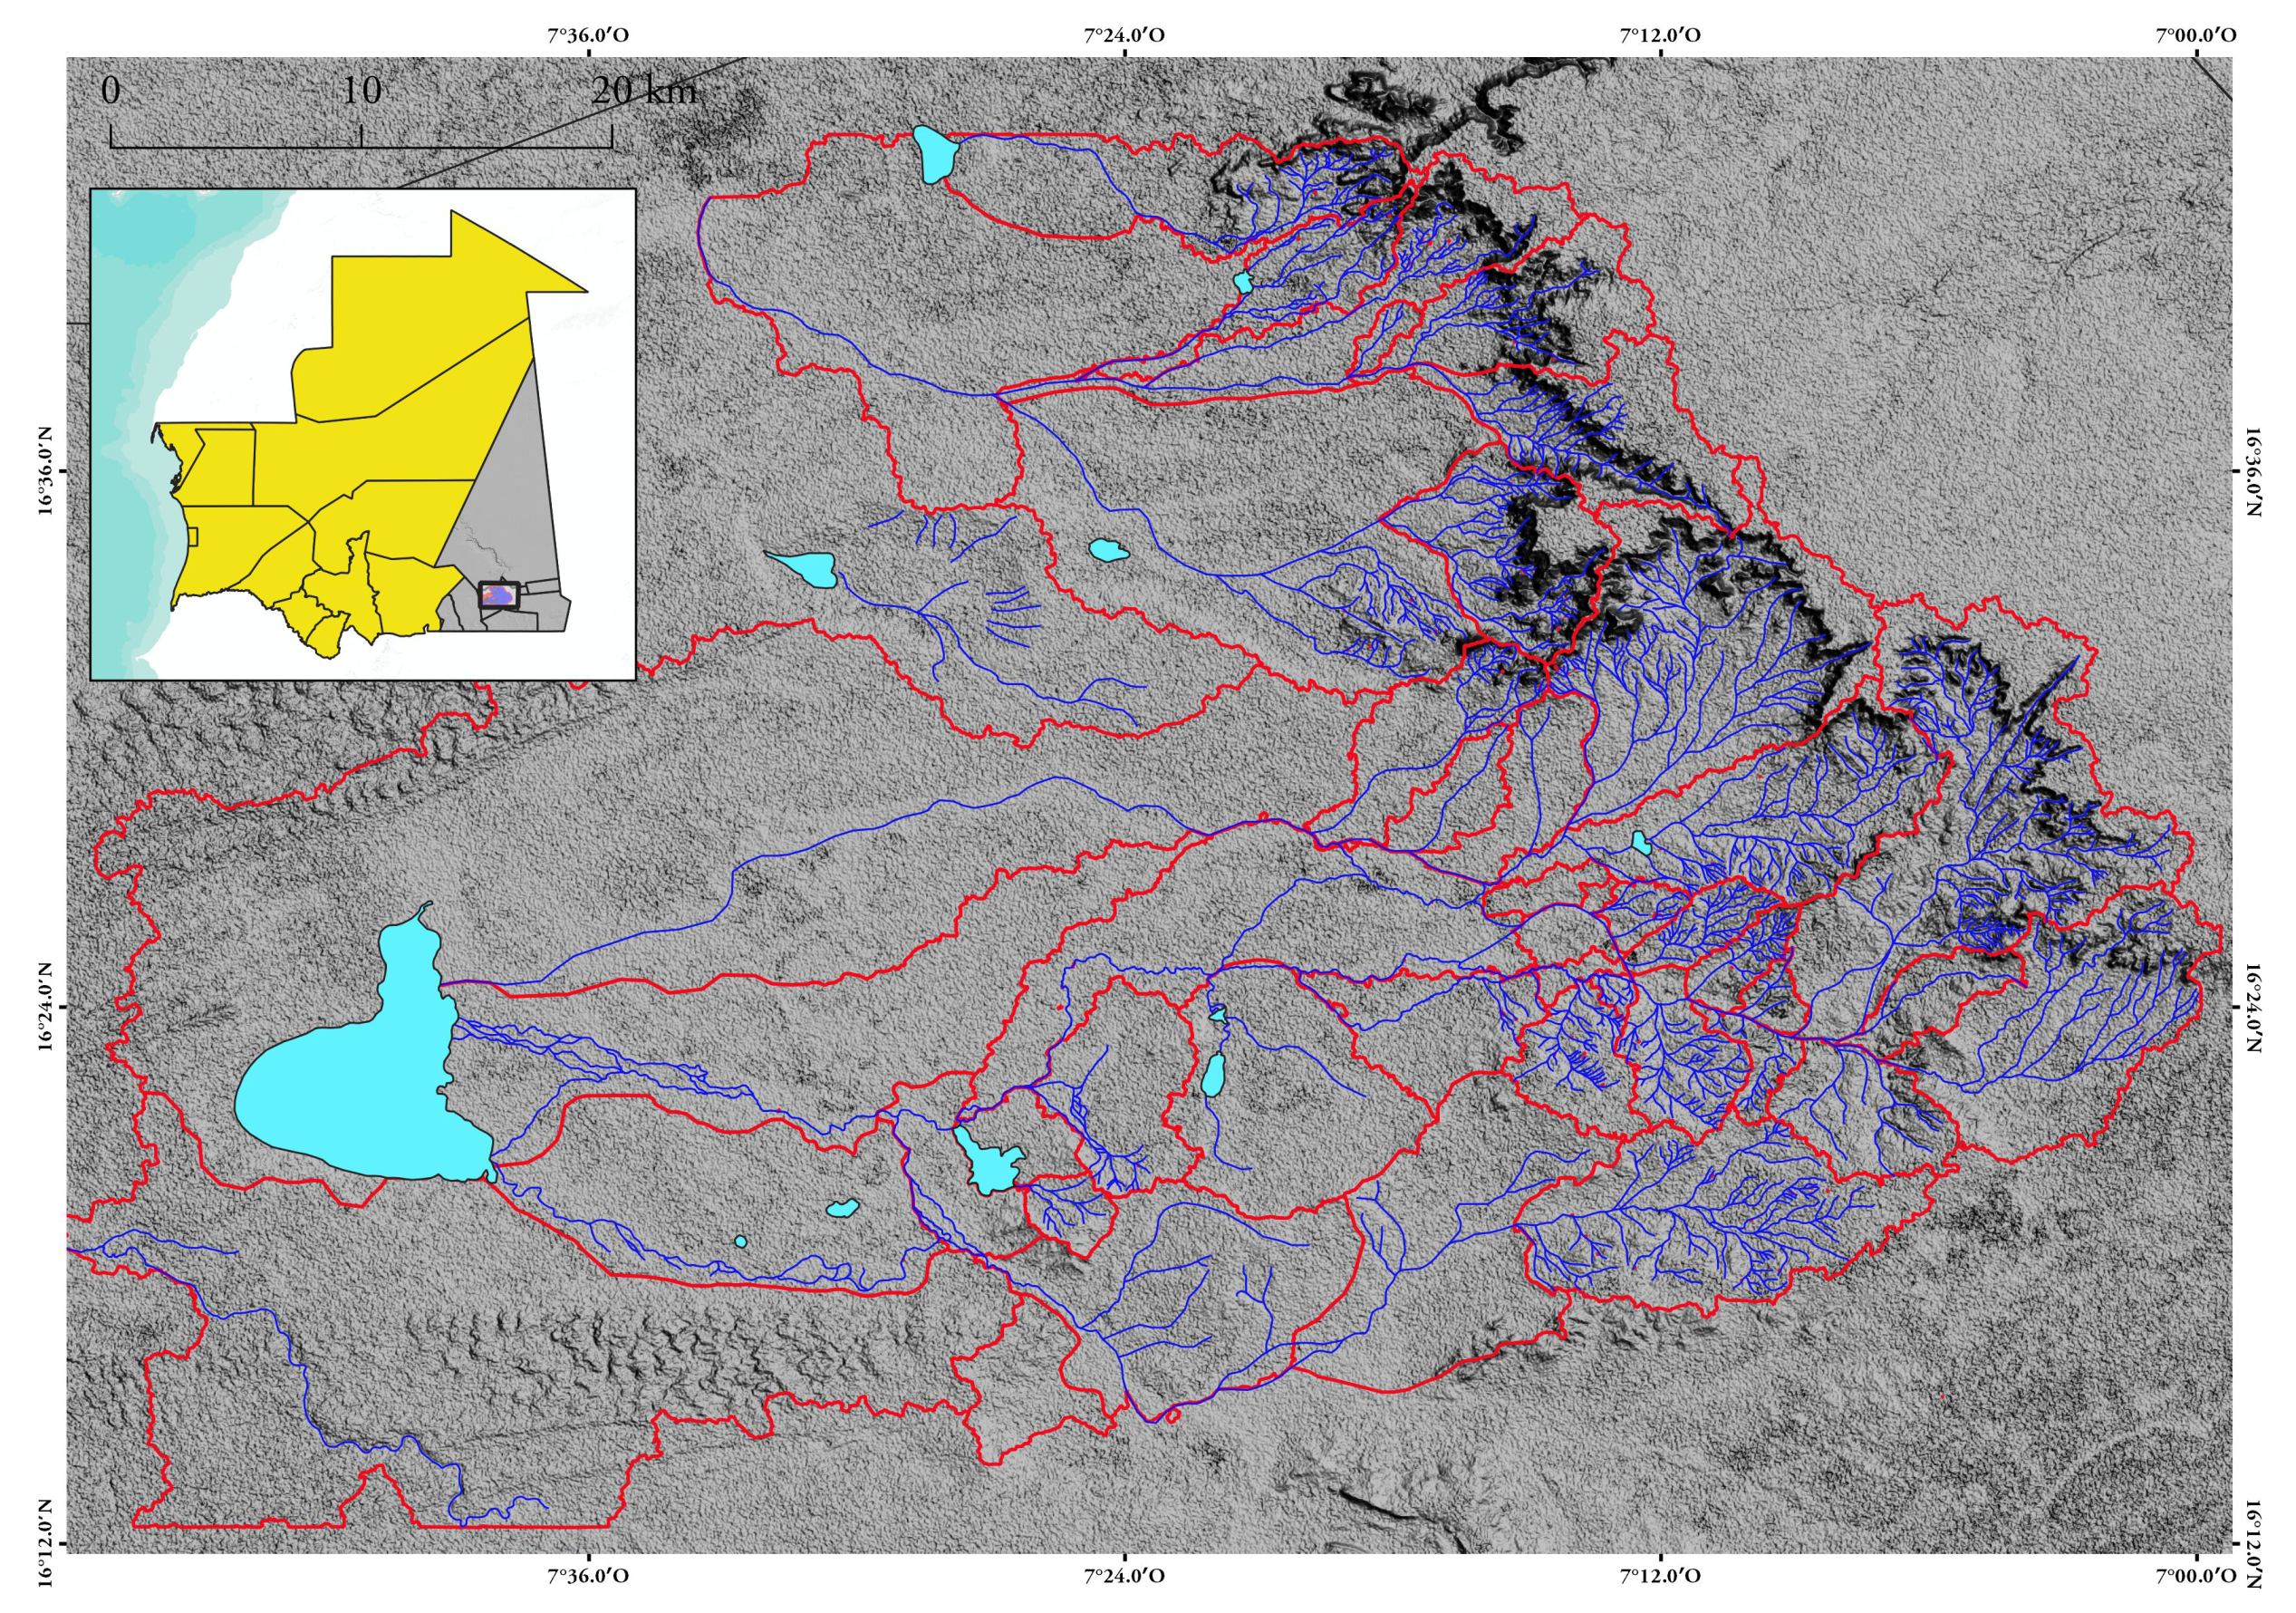
3.2.1. Watershed Basins
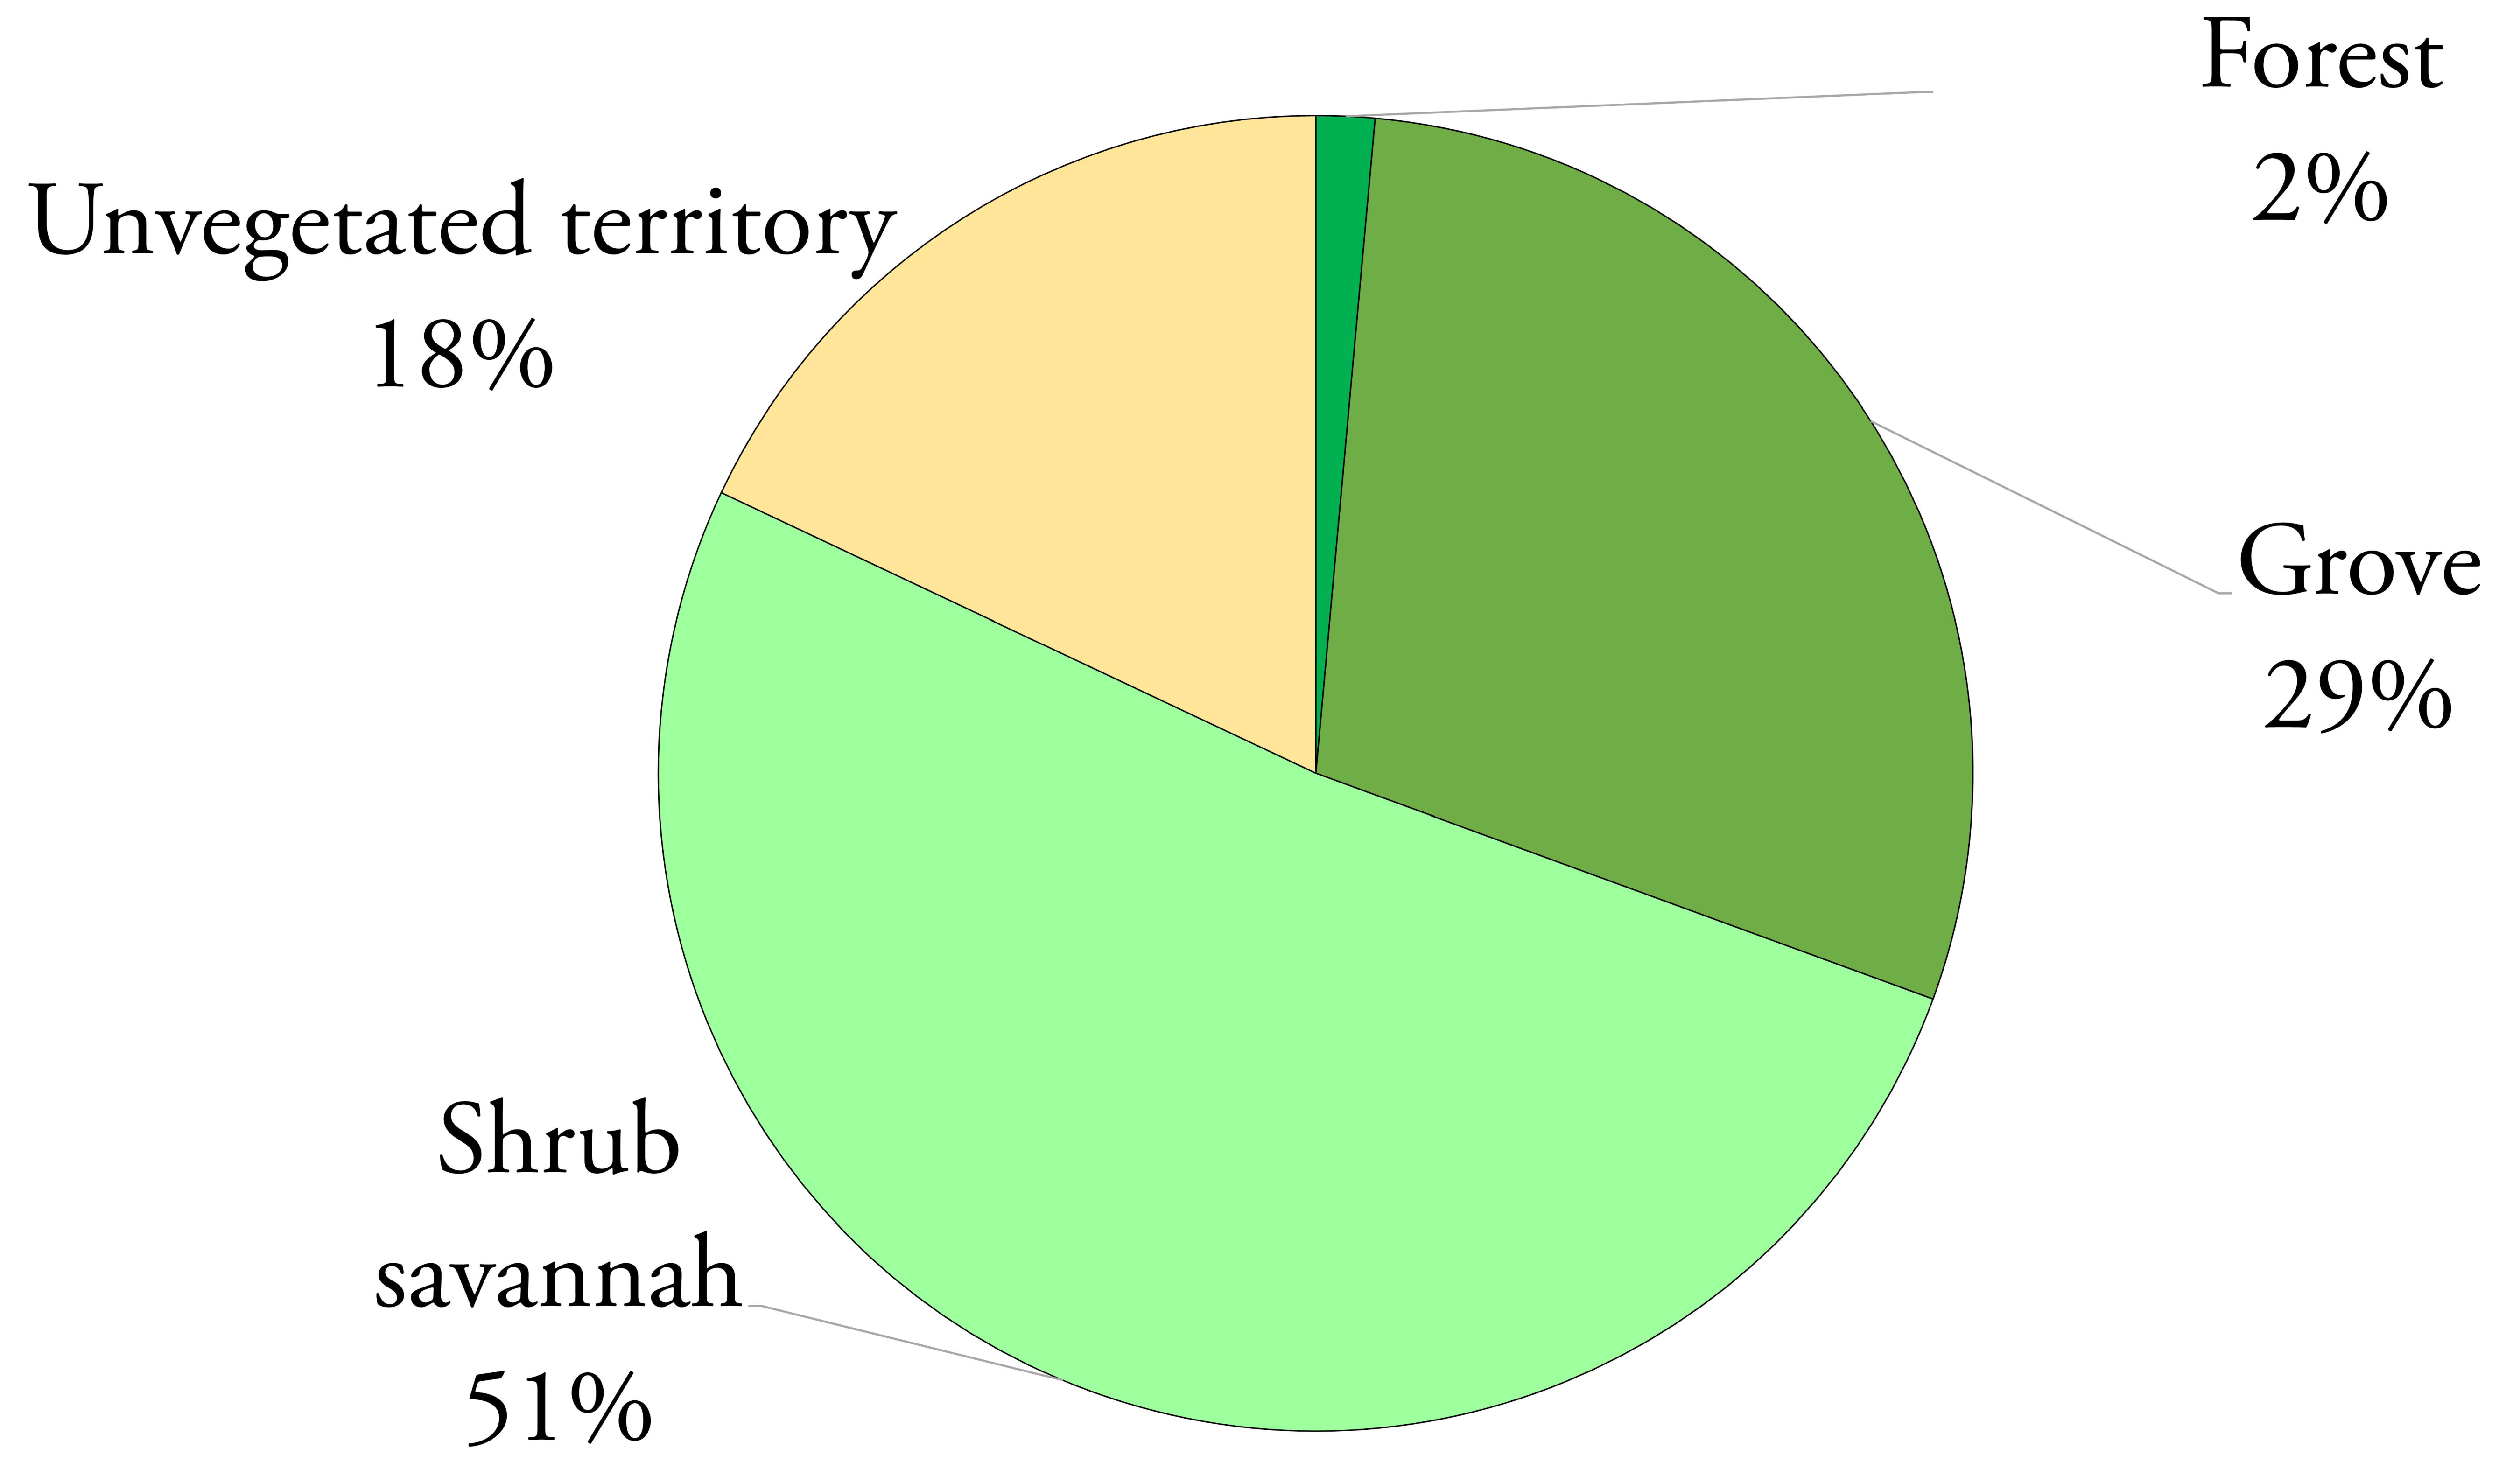
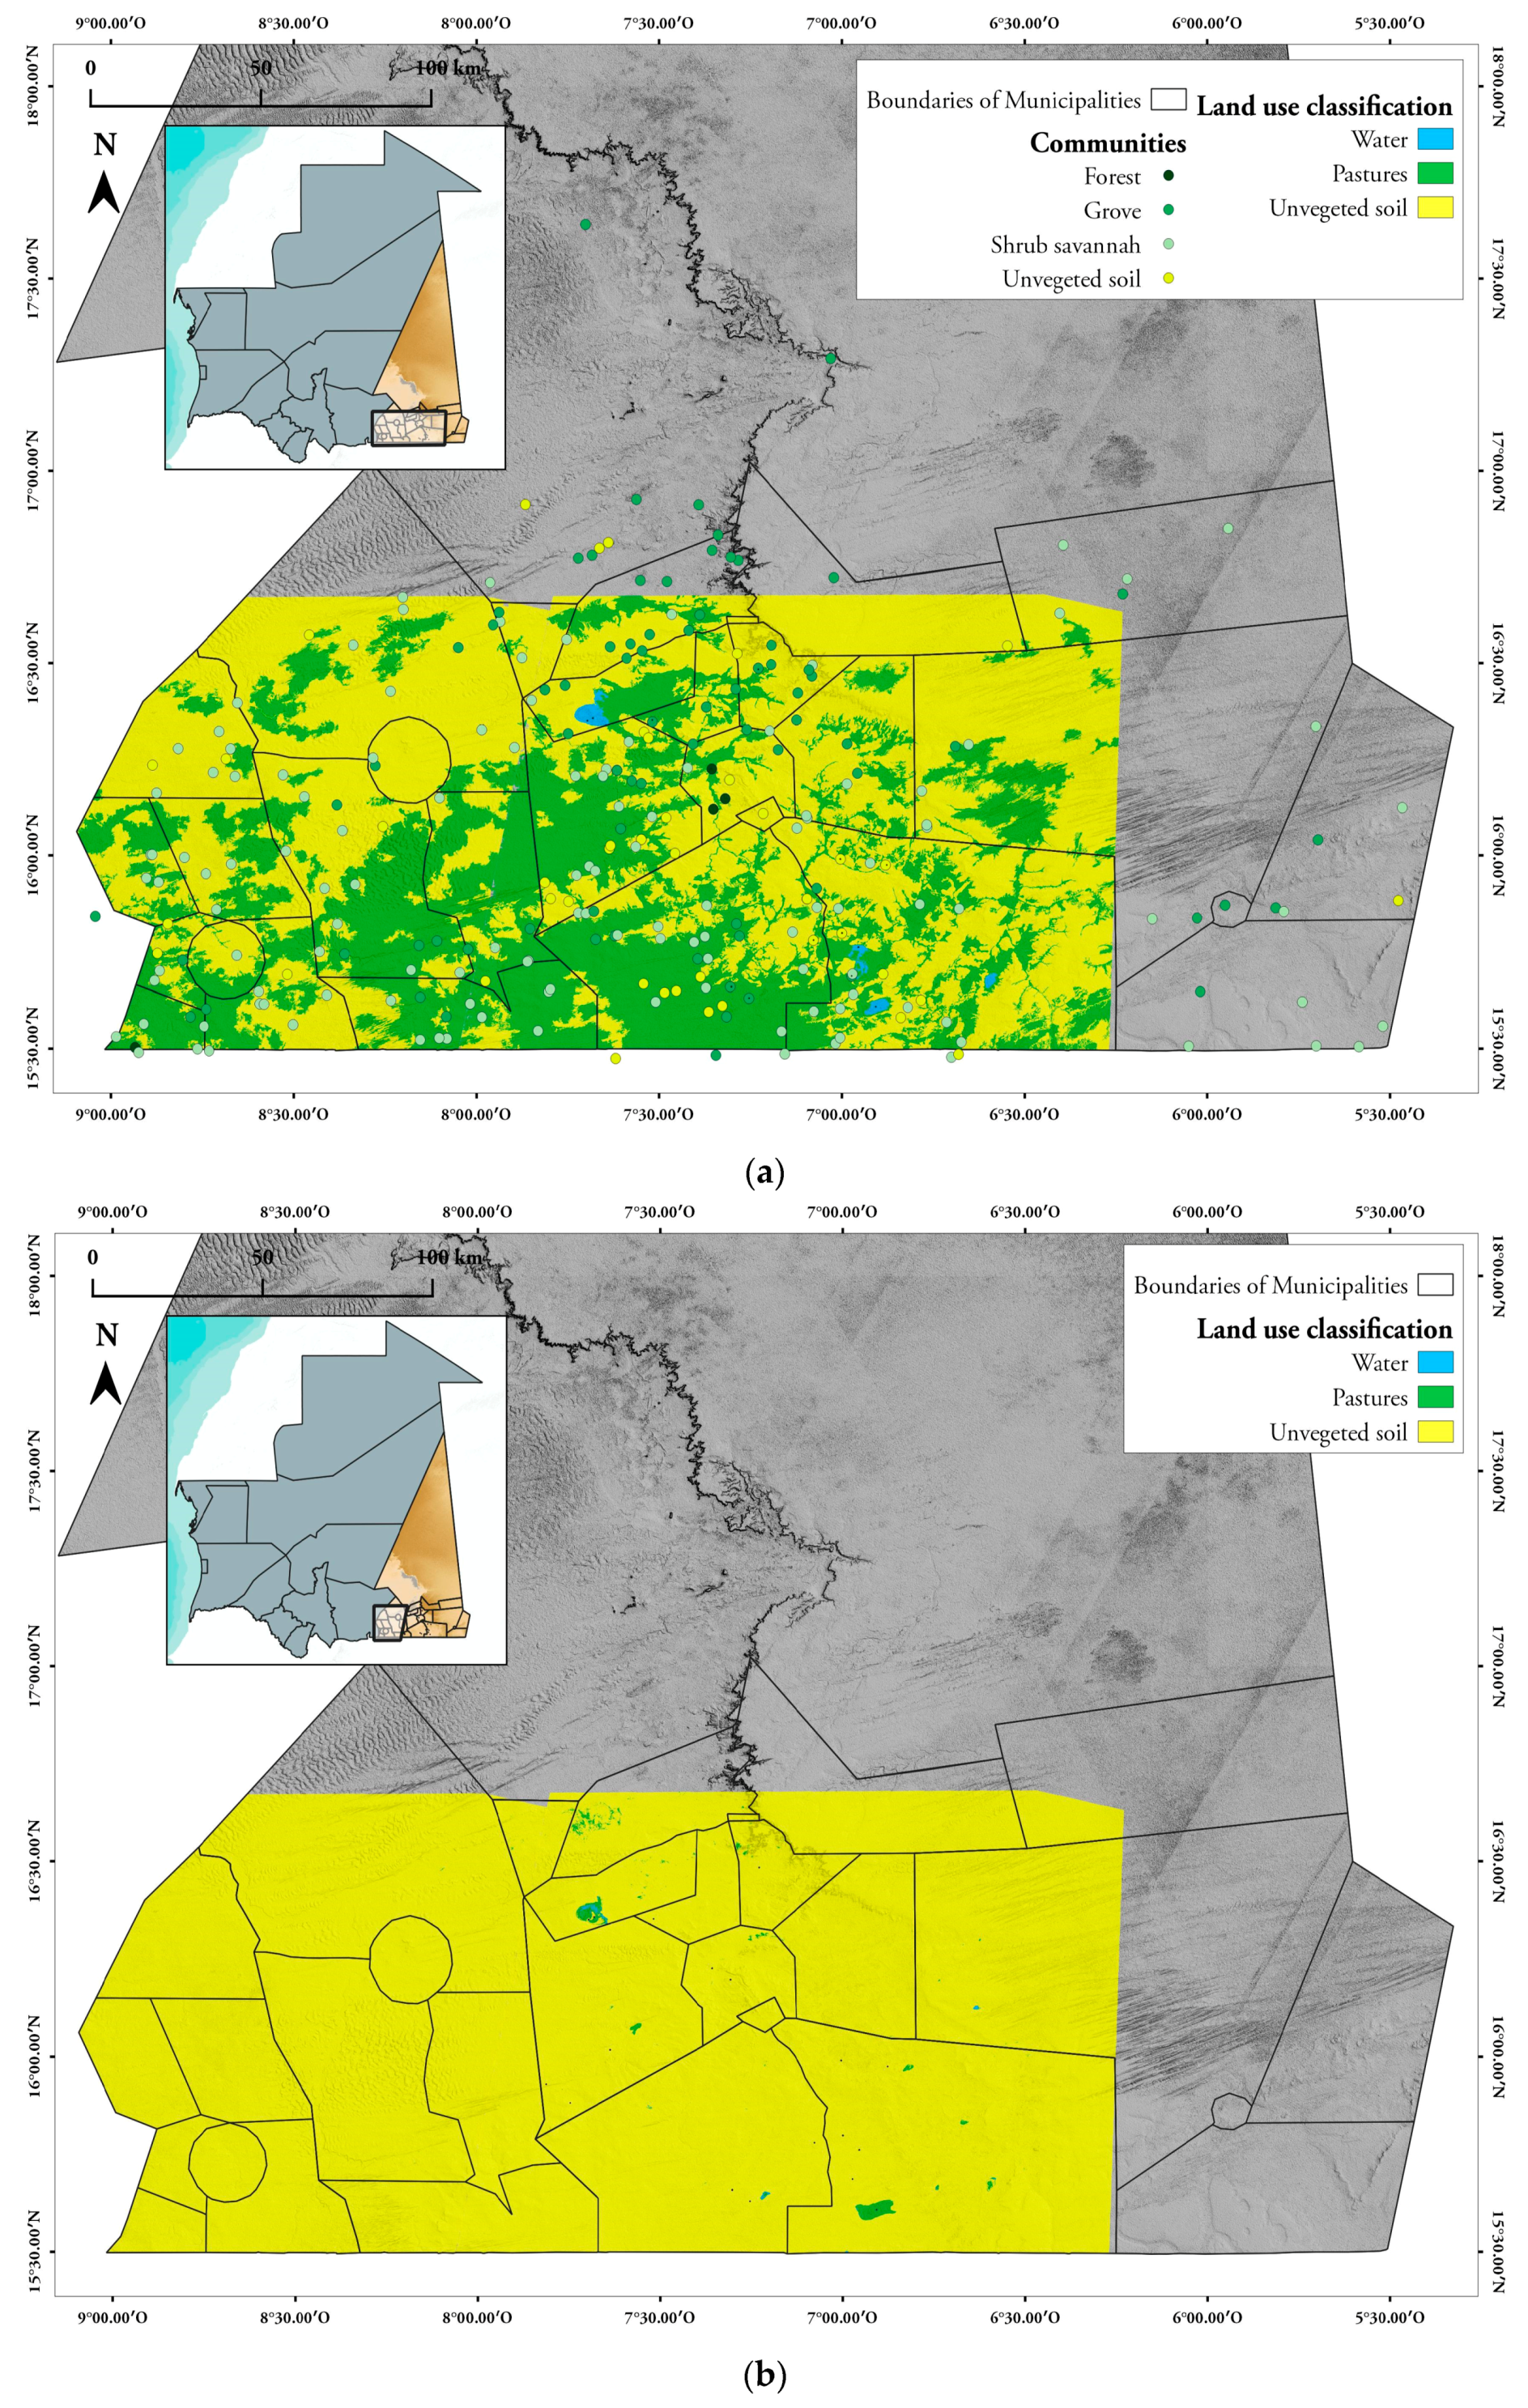
3.2.2. Use of Land Cover Classification Maps
3.3. Publication of Results on a Webmap for Dissemination and Evaluation
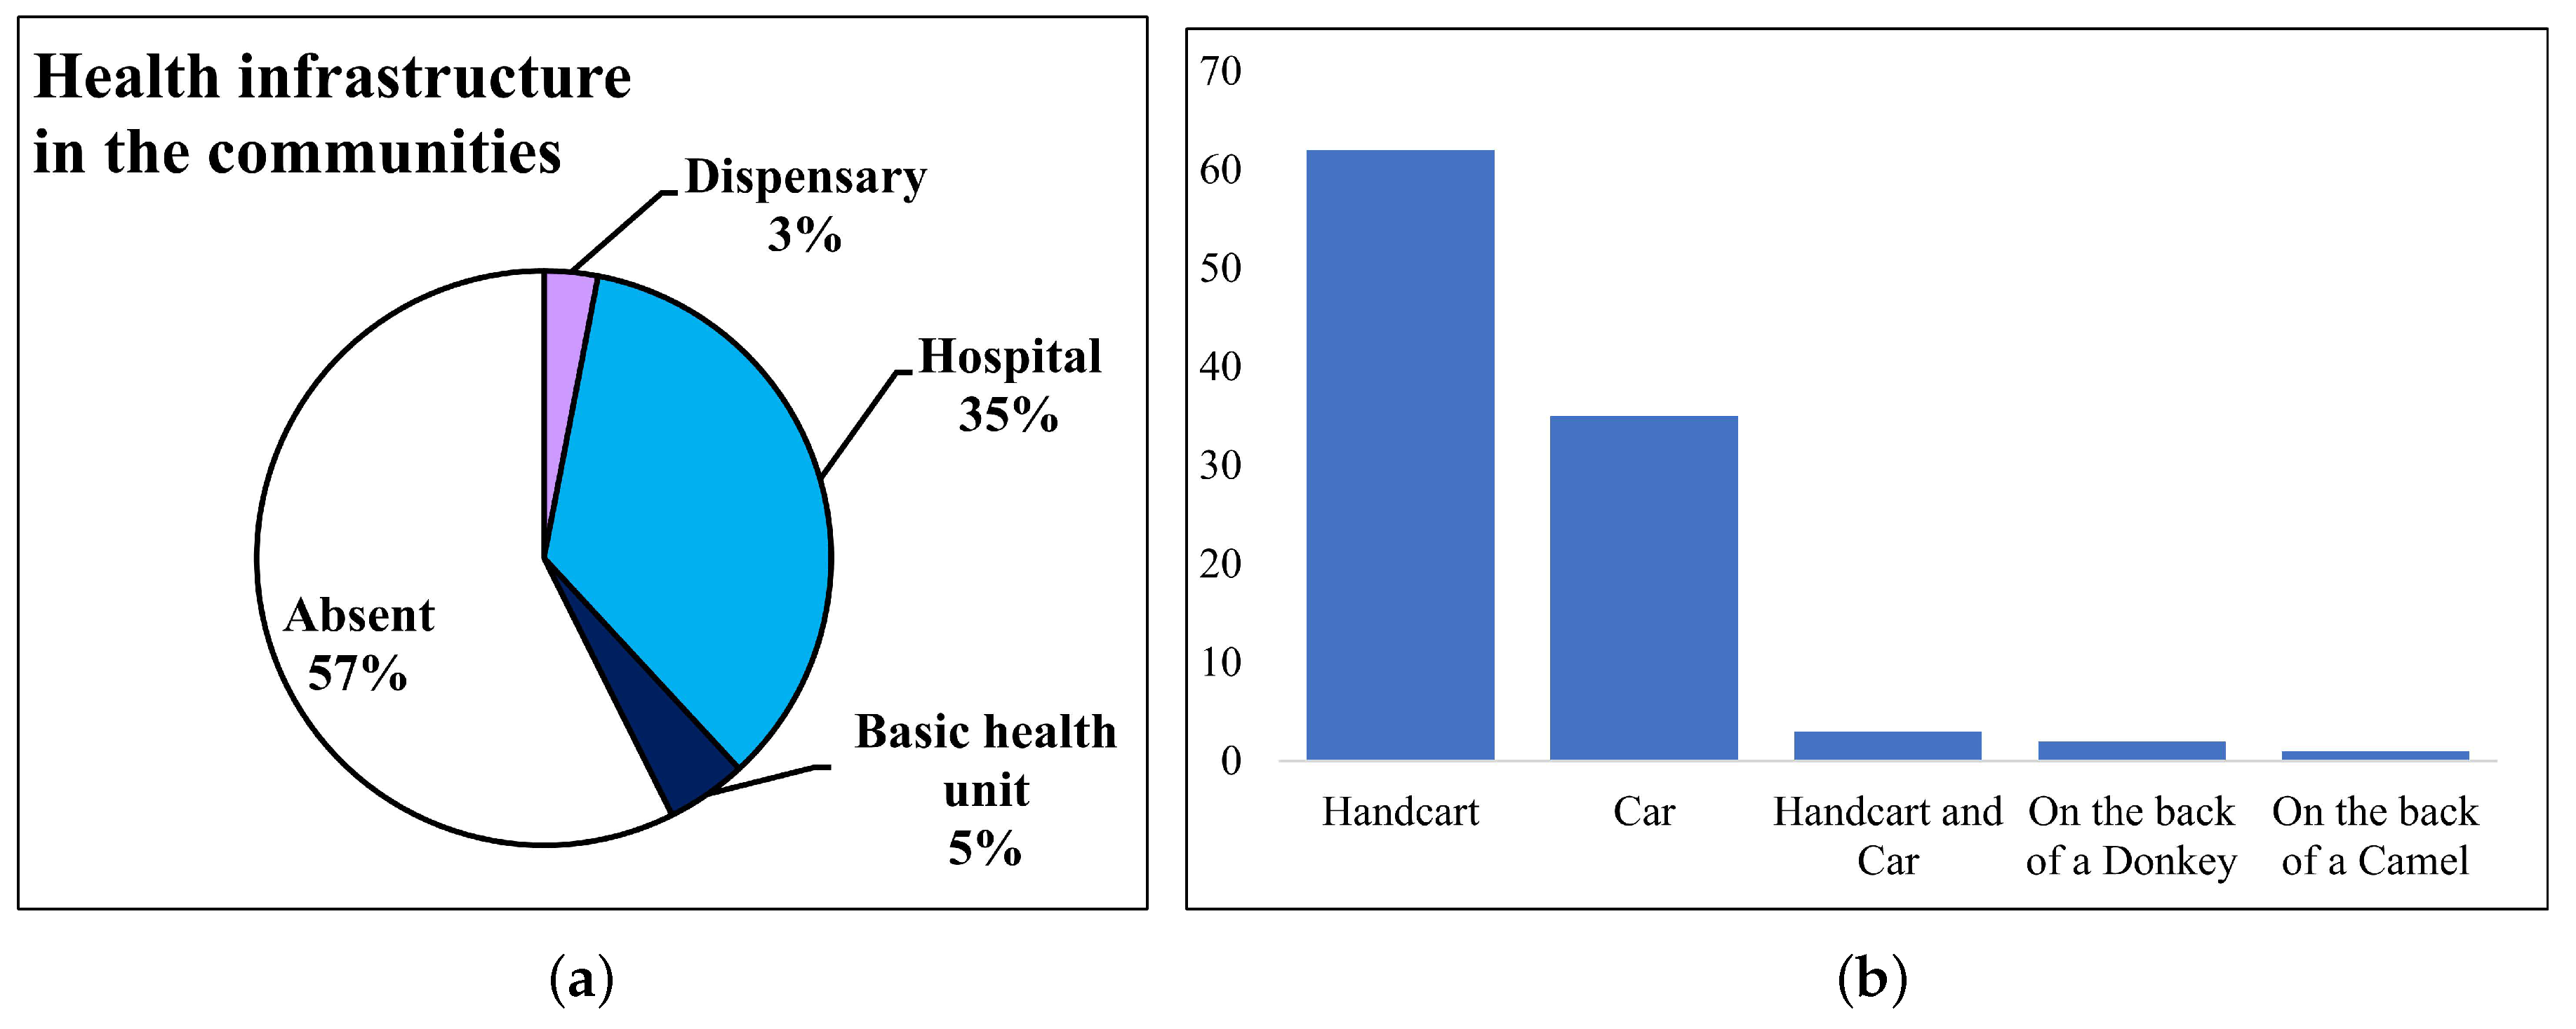
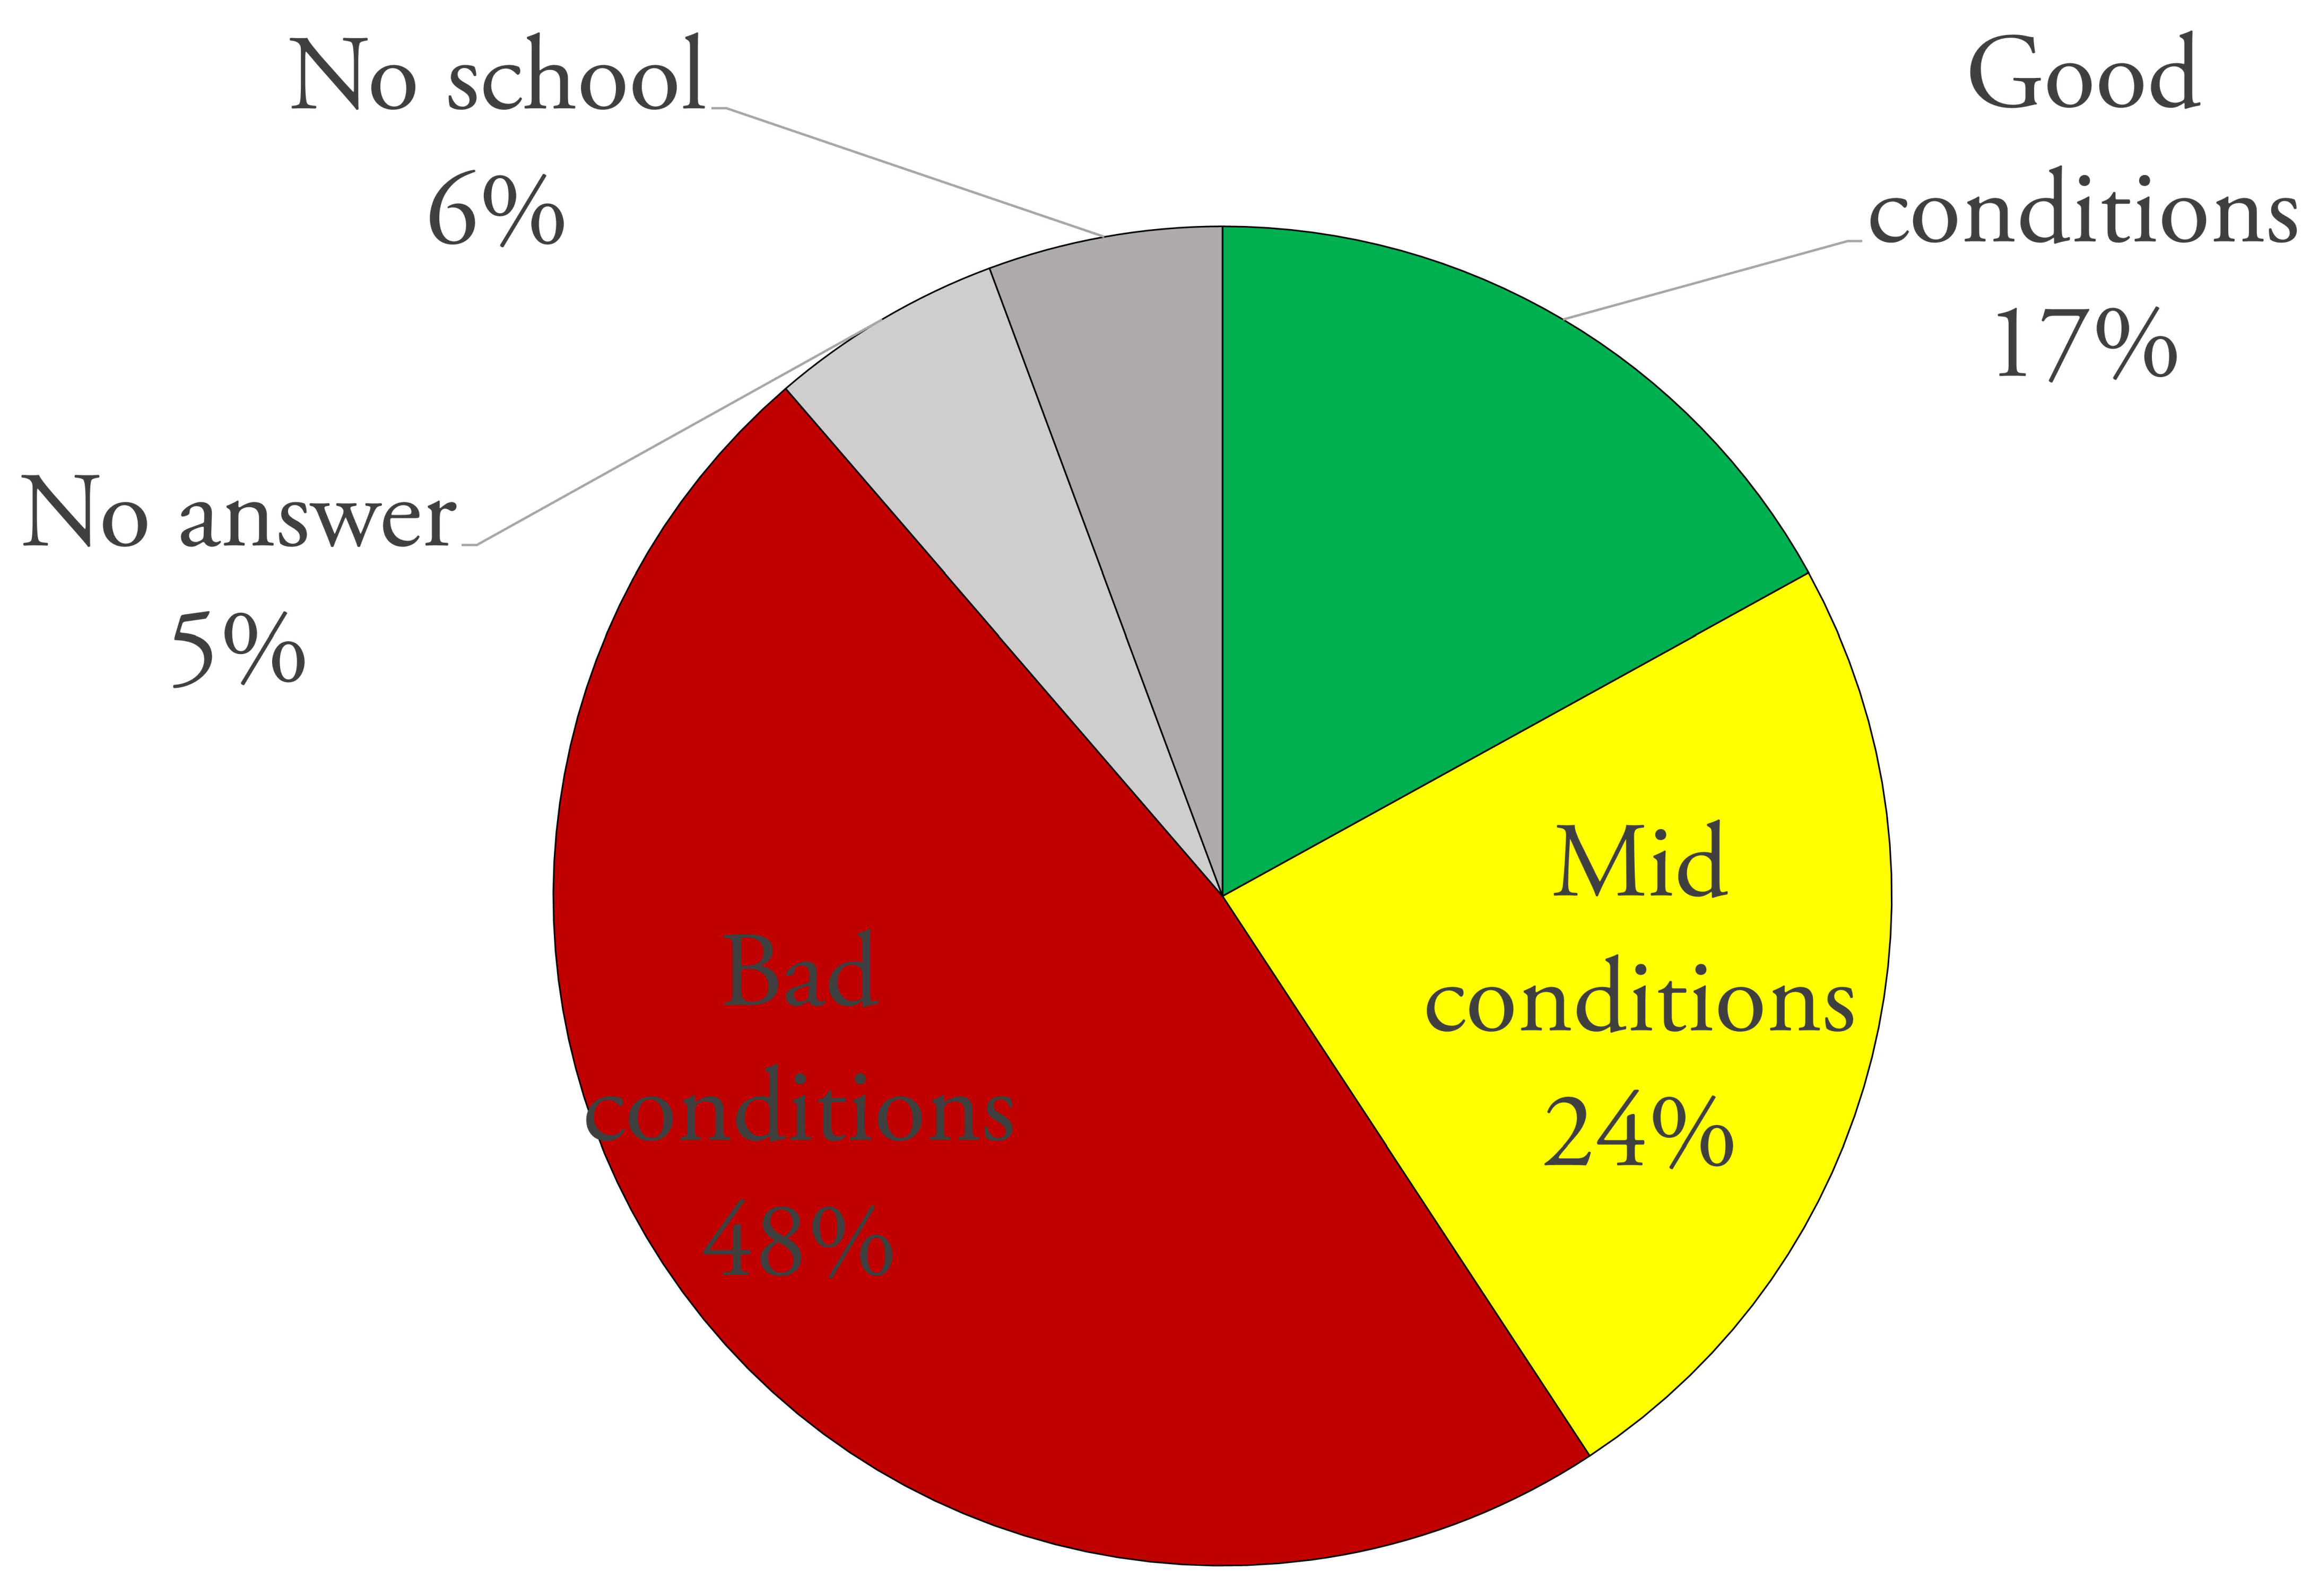
- information on the schools and hospitals available in the area;
- the surveyed wells, classified in terms of the state of activity, with an interactive form reporting the main information about the well features (depth, perennity, distance from the village, modality of water extraction) and the water features (temperature, electrical conductivity, taste);
- the location of the 265 surveyed rural communities, classified in terms of population, with an interactive form, including some basic information (e.g., name of the village, principal economic activity);
- a record of the improvement interventions performed in the framework of the RIMRAP project.
4. Conclusions
Supplementary Materials
Author Contributions
Funding
Acknowledgments
Conflicts of Interest
References
- Bonetto, S.M.R.; De Luca, D.A.; Lasagna, M.; Lodi, R. Groundwater distribution and fluoride content in the west arsi zone of the oromia region (Ethiopia). In Engineering Geology for Society and Territory; Springer Science and Business Media LLC: Cham, Switzerland, 2014; Volume 3, pp. 579–582. [Google Scholar]
- Lasagna, M.; Dino, G.A.; Perotti, L.; Spadafora, F.; De Luca, D.A.; Yadji, G.; Dan-Badjo, A.T.; Moussa, I.; Harouna, M.; Konaté, M.; et al. Georesources and environmental problems in niamey city (Niger): A preliminary sketch. Energy Procedia 2015, 76, 67–76. [Google Scholar] [CrossRef] [Green Version]
- Perotti, L.; Dino, G.A.; Lasagna, M.; Moussa, K.; Spadafora, F.; Yadji, G.; Dan-Badjo, A.T.; De Luca, D.A. Monitoring of urban growth and its related environmental impacts: Niamey case study (Niger). Energy Procedia 2016, 97, 37–43. [Google Scholar] [CrossRef] [Green Version]
- Bonetto, S.M.R.; Facello, A.; Cristofori, E.I.; Camaro, W.; Demarchi, A. An approach to use earth observation data as support to water management issues in the ethiopian rift. In Climate Change Management; Springer Science and Business Media LLC: Cham, Switzerland, 2017; Volume 316, pp. 357–374. [Google Scholar]
- Fonjong, L.N.; Emmanuel, N.N.; Fonchingong, C.C. Rethinking the contribution of indigenous management in small-scale water provision among selected rural communities in Cameroon. Environ. Dev. Sustain. 2005, 6, 429–451. [Google Scholar] [CrossRef]
- Del Amo-Rodríguez, S.; Tenorio, M.D.C.V.; Ramos-Prado, J.M.; Porter-Bolland, L. Community landscape planning for rural areas: A model for biocultural resource management. Soc. Nat. Resour. 2010, 23, 436–450. [Google Scholar] [CrossRef]
- Bechis, S.; Bonetto, S.M.R.; Bucci, A.; Canone, D.; Isotta Cristofori, E.; De Luca, D.A.; Demarchi, A.; Garnero, G.; Guerreschi, P.; Lasagna, M.; et al. Improving governance of access to water resources and their sustainable use in Hodh el Chargui communities (South East Mauritania). In Proceedings of the EGU General Assembly Conference Abstracts, Vienna, Austria, 4–13 April 2018. [Google Scholar]
- Ghiglieri, G.; Carletti, A. Integrated approach to choosing suitable areas for the realization of productive wells in rural areas of sub-Saharan Africa. Hydrol. Sci. J. 2010, 55, 1357–1370. [Google Scholar] [CrossRef] [Green Version]
- Tiepolo, M.; Bacci, M.; Braccio, S.; Bechis, S. Multi-hazard risk assessment at community level integrating local and scientific knowledge in the Hodh Chargui, Mauritania. Sustainability 2019, 11, 5063. [Google Scholar] [CrossRef] [Green Version]
- Demarchi, A.; Bechis, S.; Perotti, L.; Garnero, G.; Isotta Cristofori, E.; Alunno, L.; Facello, A.; Semita, C.; Bonetto, S.M.R.; Guerreschi, P.; et al. An interdisciplinary approach to the analysis of agro pastoral resilience in the Hodh el Chargui region (Mauritania). In Proceedings of the EGU General Assembly Conference Abstracts, Vienna, Austria, 4–13 April 2018. [Google Scholar]
- Friedel, M.J. Inventory and review of existing PRISM hydrogeologic data for the Islamic Republic of Mauritania, Africa; Open File Report 2008-1138; U. S. Geological Survey: Reston, VA, USA, 2008.
- Zhang, H.K.; Roy, D.P.; Yan, L.; Li, Z.; Huang, H.; Vermote, E.; Skakun, S.; Roger, J.-C. Characterization of Sentinel-2A and Landsat-8 top of atmosphere, surface, and nadir BRDF adjusted reflectance and NDVI differences. Remote Sens. Environ. 2018, 215, 482–494. [Google Scholar] [CrossRef]
- Yang, L.; Meng, X.; Zhang, X. SRTM DEM and its application advances. Int. J. Remote Sens. 2011, 32, 3875–3896. [Google Scholar] [CrossRef]
- USGS the Shuttle Radar Topography Mission (SRTM) Collection User Guide. 2015. Available online: https://lpdaac.usgs.gov/documents/179/SRTM_User_Guide_V3.pdf (accessed on 25 May 2020).
- Radwan, F.; Alazba, A.; Mossad, A. Watershed morphometric analysis of Wadi Baish Dam catchment area using integrated GIS-based approach. Arab. J. Geosci. 2017, 10, 256. [Google Scholar] [CrossRef]
- Lai, Z.; Li, S.; Lv, G.; Pan, Z.; Fei, G. Watershed delineation using hydrographic features and a DEM in plain river network region. Hydrol. Process. 2015, 30, 276–288. [Google Scholar] [CrossRef]
- Liu, X.; Wang, N.; Shao, J.; Chu, X. An automated processing algorithm for flat areas resulting from DEM Filling and interpolation. ISPRS Int. J. Geo Inf. 2017, 6, 376. [Google Scholar] [CrossRef] [Green Version]
- Djokic, D.; Ye, Z.; Dartiguenave, C. Arc Hydro Tools Overview, Version 2.0; ESRI Press: Redlands, CA, USA, 2011. [Google Scholar]
- Arc Hydro Geoprocessing Tools-Tutorial-Version 2.0; ESRI Press: Redlands, CA, USA, 2011.
- Congedo, L. Semi-automatic classification plugin documentation. Release 2016, 4, 29. [Google Scholar]
- Ghiraldi, L.; Giordano, E.; Perotti, L.; Giardino, M. Digital tools for collection, promotion and visualisation of geoscientific data: Case study of seguret valley (Piemonte, NW Italy). Geoheritage 2014, 6, 103–112. [Google Scholar] [CrossRef]
- Giuffrida, S.; Gagliano, F.; Giannitrapani, E.; Marisca, C.; Napoli, G.; Trovato, M.R. Promoting research and landscape experience in the management of the archaeological networks. A project-valuation experiment in Italy. Sustainability 2020, 12, 4022. [Google Scholar] [CrossRef]
- Dan-Badjo, A.T.; Diadie, H.O.; Bonetto, S.M.R.; Semita, C.; Cristofori, E.I.; Facello, A. Using improved varieties of pearl millet in rainfed agriculture in response to climate change: A case study in the tillabéri region in Niger. In Climate Change Research at Universities; Springer International Publishing: Cham, Switzerland, 2017; pp. 345–358. [Google Scholar]
- World Health Organization (WHO). Drinking Water Parameter Cooperation Project. Support to the Revision of Annex I Council Directive 98/83/EC on the Quality of Water Intended for Human Consumption (Drinking Water Directive); WHO: Geneva, Switzerland, 2017. [Google Scholar]
- Agriculture and Food. Water Quality for Livestock. Available online: https://www.agric.wa.gov.au/livestock-biosecurity/water-quality-livestock (accessed on 15 May 2020).


| Profession | Men (%) | Women (%) |
|---|---|---|
| Baker | 96 | 4 |
| Butcher | 55 | 45 |
| Trader | 61 | 39 |
| Carpenter | 100 | 0 |
| Tailor | 82 | 18 |
| Weaver | 8 | 92 |
| Ironworker | 100 | 0 |
| Tanner | 0 | 100 |
| Builder | 100 | 0 |
| Digger | 100 | 0 |
| Taste | Number of Water Wells |
|---|---|
| Very salty | 1 |
| Salty | 2 |
| Slightly salty | 39 |
| Heavy | 12 |
| Sweet | 44 |
| First Answer | Second Answer | Third Answer | |
|---|---|---|---|
| Rainy season | Shorter (92%) | As usual (3%) | Longer (2%) |
| Dry season | Longer (96%) | As usual (3.5%) | Shorter (0.5%) |
| Temperatures | Higher (96%) | As usual (4%) | Longer (2%) |
| More Frequent (% of Answers) | As Usual (% of Answers) | Less Frequent (% of Answers) | |
|---|---|---|---|
| Storms (strong wind) | 83 | 10 | 6 |
| Floods | 5 | 58 | 37 |
| Flood damages | 3 | 58 | 39 |
| Drought | 88 | 11 | 2 |
| Drought damages | 83 | 16 | 2 |
| Reference Data | |||||
|---|---|---|---|---|---|
| Classified Data | Soil | Pastures | Water | Row Total | User’s Accuracy |
| Unclassified | 0 | 0 | 1112 | 1112 | |
| Soil | 2854 | 0 | 693 | 3547 | 80.46% |
| Pastures | 0 | 3511 | 418 | 3929 | 89.36% |
| Water | 0 | 0 | 1120 | 1120 | 100.00% |
| Column Total | 2854 | 3511 | 3343 | 9708 | |
| Producer’s Accuracy | 100.00% | 100.00% | 33.50% | Overall Accuracy = 77.10% | |
| Overall Kappa Index = 0.68 | |||||
| Reference Data | |||||
|---|---|---|---|---|---|
| Classified Data | Soil | Pastures | Water | Row Total | User’s Accuracy |
| Unclassified | 0 | 0 | 0 | 0 | |
| Soil | 2854 | 338 | 180 | 3372 | 84.64% |
| Pastures | 0 | 3017 | 636 | 3653 | 82.59% |
| Water | 0 | 156 | 2527 | 2683 | 94.91% |
| Column Total | 2854 | 3511 | 3343 | 9708 | |
| Producer’s Accuracy | 100.00% | 85.93% | 75.59% | Overall Accuracy = 86.51% | |
| Overall Kappa Index = 0.80 | |||||
© 2020 by the authors. Licensee MDPI, Basel, Switzerland. This article is an open access article distributed under the terms and conditions of the Creative Commons Attribution (CC BY) license (http://creativecommons.org/licenses/by/4.0/).
Share and Cite
Caselle, C.; Bonetto, S.M.R.; De Luca, D.A.; Lasagna, M.; Perotti, L.; Bucci, A.; Bechis, S. An Interdisciplinary Approach to the Sustainable Management of Territorial Resources in Hodh el Chargui, Mauritania. Sustainability 2020, 12, 5114. https://doi.org/10.3390/su12125114
Caselle C, Bonetto SMR, De Luca DA, Lasagna M, Perotti L, Bucci A, Bechis S. An Interdisciplinary Approach to the Sustainable Management of Territorial Resources in Hodh el Chargui, Mauritania. Sustainability. 2020; 12(12):5114. https://doi.org/10.3390/su12125114
Chicago/Turabian StyleCaselle, Chiara, Sabrina Maria Rita Bonetto, Domenico Antonio De Luca, Manuela Lasagna, Luigi Perotti, Arianna Bucci, and Stefano Bechis. 2020. "An Interdisciplinary Approach to the Sustainable Management of Territorial Resources in Hodh el Chargui, Mauritania" Sustainability 12, no. 12: 5114. https://doi.org/10.3390/su12125114
APA StyleCaselle, C., Bonetto, S. M. R., De Luca, D. A., Lasagna, M., Perotti, L., Bucci, A., & Bechis, S. (2020). An Interdisciplinary Approach to the Sustainable Management of Territorial Resources in Hodh el Chargui, Mauritania. Sustainability, 12(12), 5114. https://doi.org/10.3390/su12125114