Sustainable Smartphone-Based Healthcare Systems: A Systems Engineering Approach to Assess the Efficacy of Respiratory Monitoring Apps


Abstract
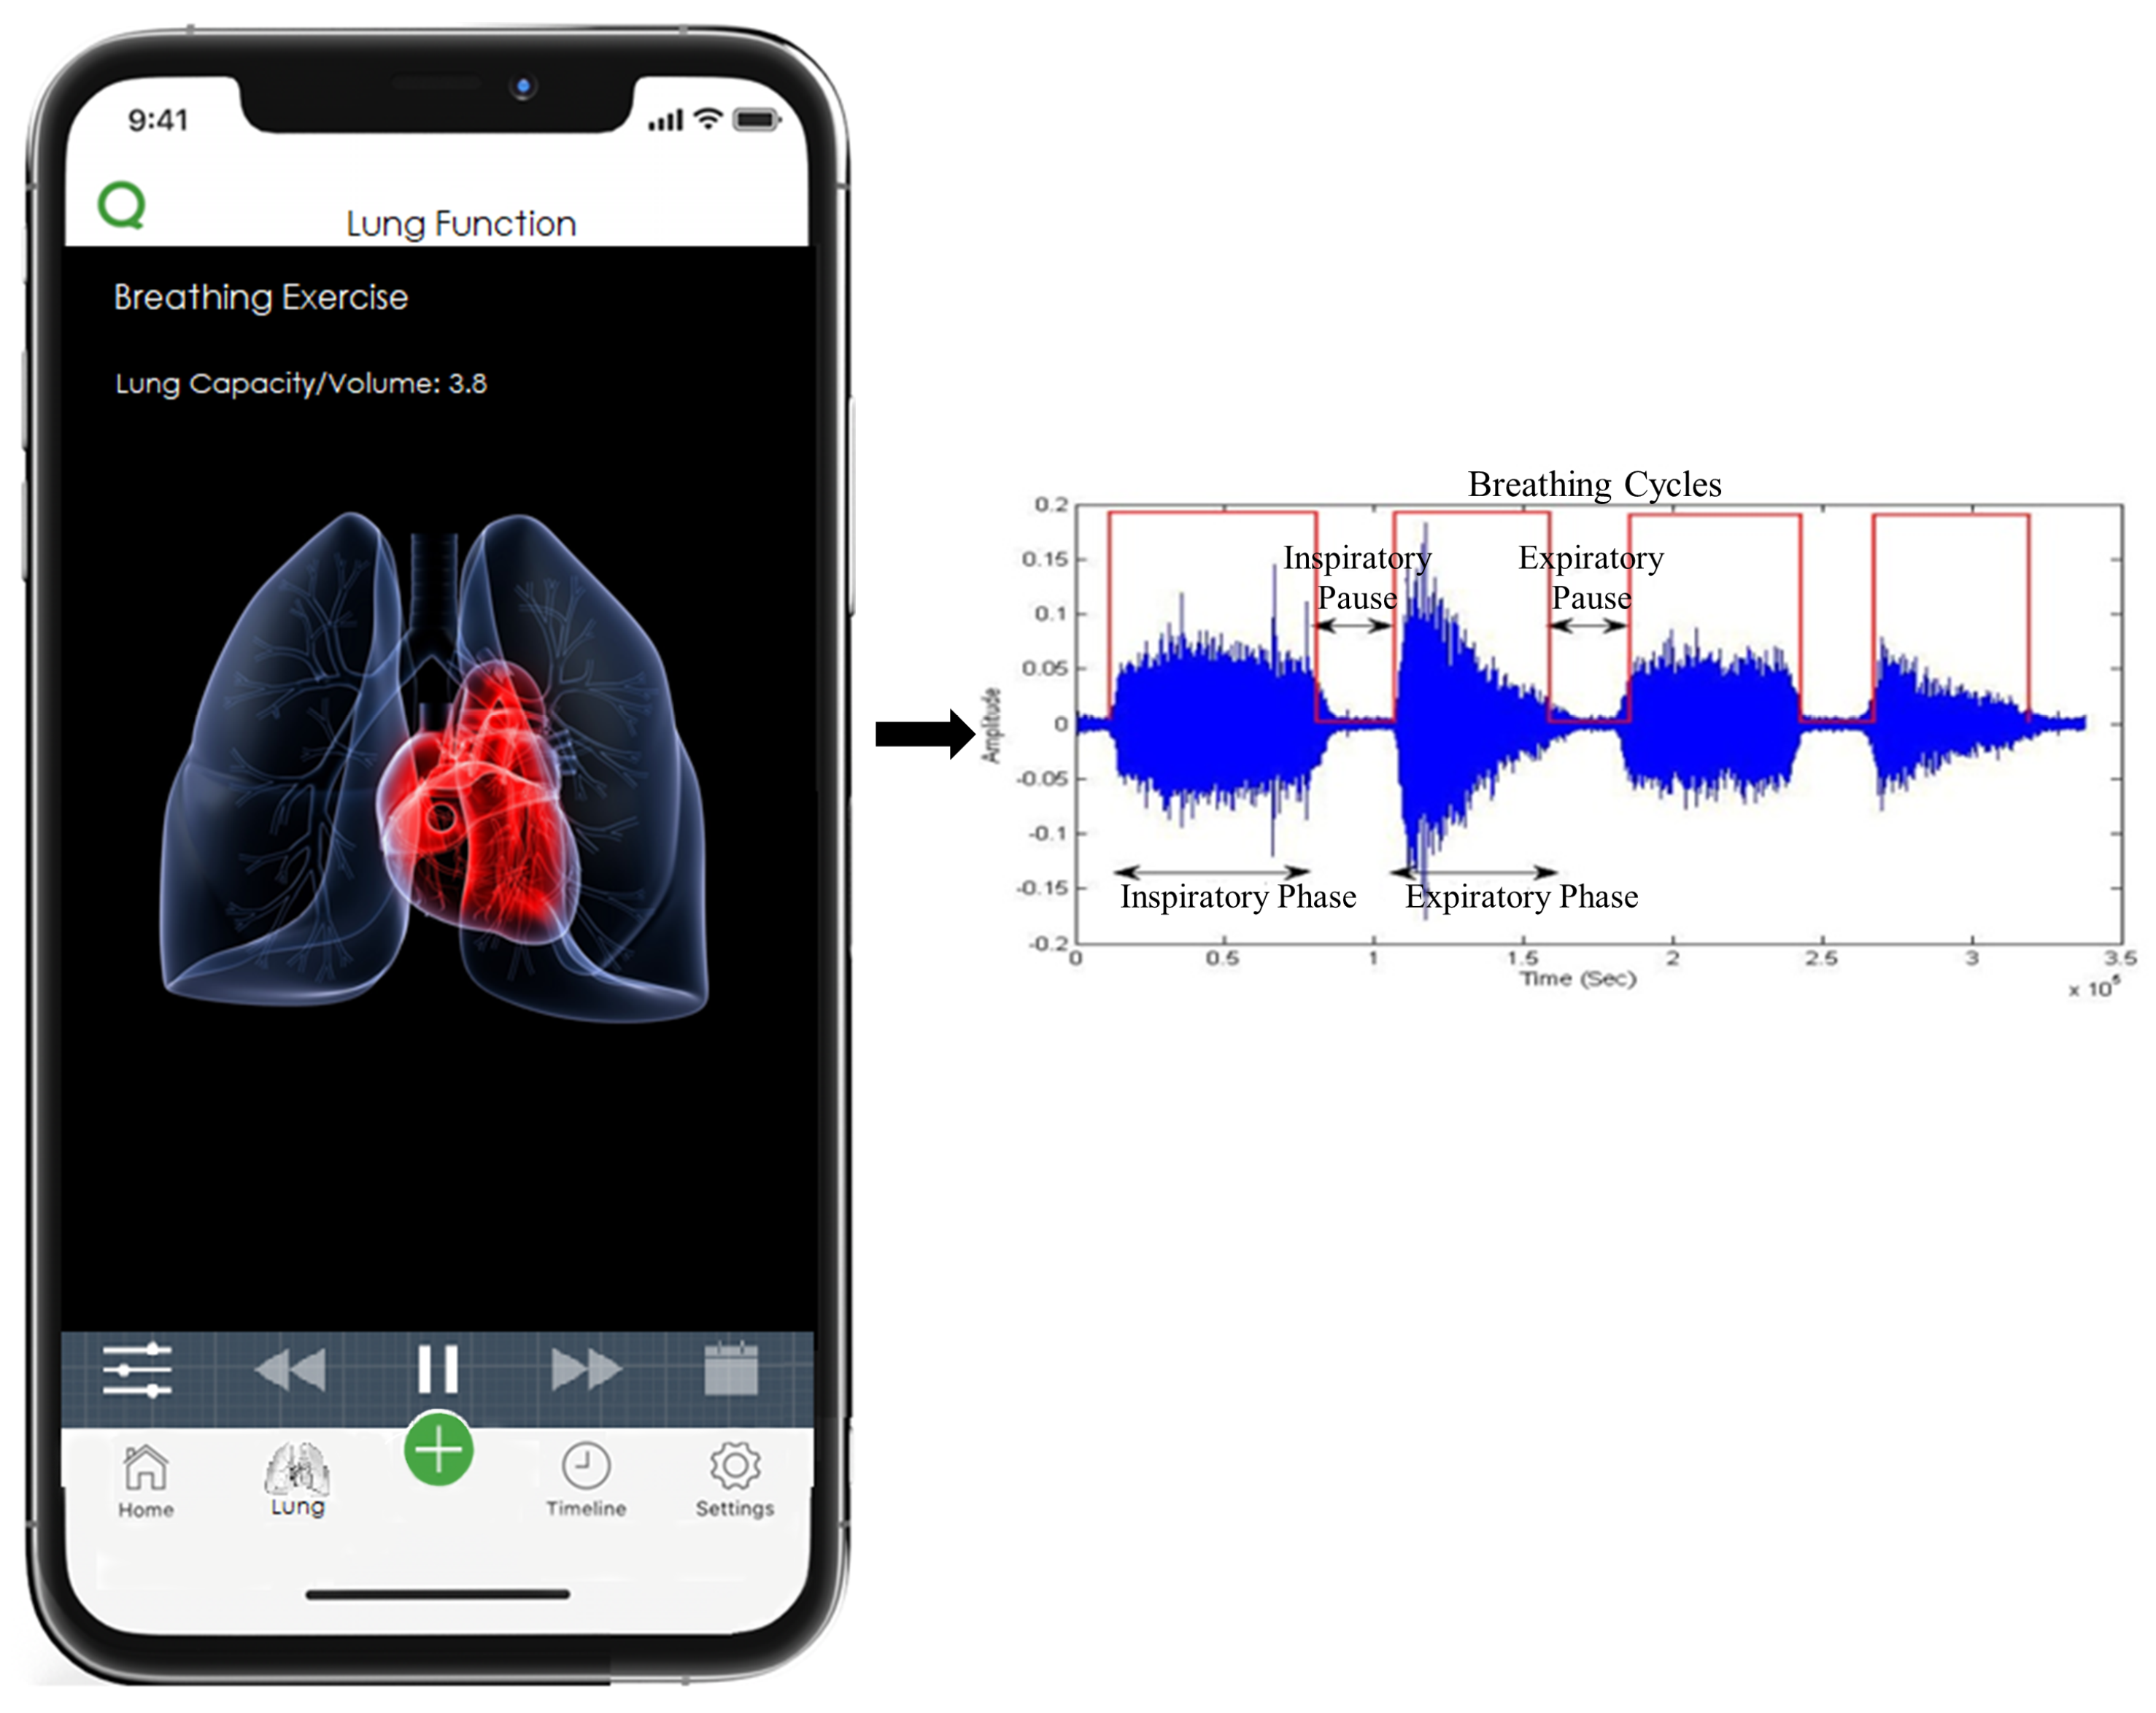
1. Introduction
1.1. Background
1.2. Contribution
1.3. Paper Organization
2. Proposed Methodology
2.1. Causal Model
2.2. Categories of Sustainability
2.3. System Dynamics Model
3. Validation and Simulation Results
3.1. Model Validation
3.1.1. Structural Tests
3.1.2. Behavior Tests
3.1.3. Policy Tests
3.2. Testing Scenarios and Simulation Runs
3.2.1. Baseline
3.2.2. Scenario 1
3.2.3. Scenario 2
3.2.4. Scenario 3
3.2.5. Scenario 4
3.2.6. Scenario 5
3.2.7. Scenario 6
4. Conclusions and Future Directions
Author Contributions
Funding
Conflicts of Interest
References
- Vinay, K.; Vishal, K. Smartphone applications for medical students and professionals. Nitte Univ. J. Health Sci. 2013, 3, 59. [Google Scholar]
- Kratzke, C.; Cox, C. Smartphone technology and apps: Rapidly changing health promotion. Glob. J. Health Educ. Promot. 2012, 15, 72–82. [Google Scholar]
- Kim, J.; Campbell, A.S.; de Ávila, B.E.F.; Wang, J. Wearable biosensors for healthcare monitoring. Nat. Biotechnol. 2019, 37, 389–406. [Google Scholar] [CrossRef] [PubMed]
- Gupta, G. Are Medical Apps the future of medicine? Med. J. Armed Forces India 2013, 69, 105. [Google Scholar] [CrossRef] [PubMed][Green Version]
- Bradway, M.; Carrion, C.; Vallespin, B.; Saadatfard, O.; Puigdomènech, E.; Espallargues, M.; Kotzeva, A. mHealth assessment: Conceptualization of a global framework. JMIR MHealth UHealth 2017, 5, e60. [Google Scholar] [CrossRef]
- Aljaaf, A.J.; Van Tonder, L.; Mallucci, C.; Al-Jumeily, D.; Hussain, A.; Alloghani, M. Patients Attitude to Technology. J. Med. Syst. 2019, 43, 295. [Google Scholar] [CrossRef]
- Aljaaf, A.J.; Al-Jumeily, D.; Asman, T.K.; Hussain, A.J.; Baker, T.; Alloghani, M.; Mustafina, J. H-Diary: Mobile application for headache diary and remote patient monitoring. In Proceedings of the 2018 11th International Conference on Developments in eSystems Engineering (DeSE), Cambridge, UK, 2–5 September 2018; IEEE: Piscataway, NJ, USA, 2018; pp. 18–22. [Google Scholar]
- Bright, T.; Pallawela, D. Validated smartphone-based apps for ear and hearing assessments: A review. JMIR Rehabil. Assist. Technol. 2016, 3, e13. [Google Scholar] [CrossRef]
- Chao, E.; Meenan, C.K.; Ferris, L.K. Smartphone-based applications for skin monitoring and melanoma detection. Dermatol. Clin. 2017, 35, 551–557. [Google Scholar] [CrossRef]
- Abushakra, A.; Faezipour, M. Augmenting breath regulation using a mobile driven virtual reality therapy framework. IEEE J. Biomed. Health Inform. 2014, 18, 746–752. [Google Scholar] [CrossRef]
- Yang, G.; Yang, B.; Li, Y.; Sheffler, E.; Gao, W.; Chen, W.; Forno, E. Smartphone-Based Ultrasonic Respiratory Evaluation (SURe) in Pediatric Asthma Patients: A Pilot Study. In D60. Improving Health Care Delivery in Pediatric Pulmonary; American Thoracic Society: NewYork, NY, USA, 2020; p. A7226. [Google Scholar]
- Moschovis, P.; Sampayo, E.; Porter, P.; Abeyratne, U.; Doros, G.; Swarnkar, V.; Sharan, R.; Carl, J. A cough analysis smartphone application for diagnosis of acute respiratory illnesses in children. In A27. Pediatric Lung Infection and Critical Care Around the World; American Thoracic Society: NewYork, NY, USA, 2019; p. A1181. [Google Scholar]
- Alsos, O.A.; Das, A.; Svanæs, D. Mobile health IT: The effect of user interface and form factor on doctor–patient communication. Int. J. Med. Inform. 2012, 81, 12–28. [Google Scholar] [CrossRef]
- Faezipour, M.; Saeed, A.; Bulusu, S.C.; Nourani, M.; Minn, H.; Tamil, L. A patient-adaptive profiling scheme for ECG beat classification. IEEE Trans. Inf. Technol. Biomed. 2010, 14, 1153–1165. [Google Scholar] [CrossRef] [PubMed]
- Aboalayon, K.A.I.; Faezipour, M.; Almuhammadi, W.S.; Moslehpour, S. Sleep stage classification using EEG signal analysis: A comprehensive survey and new investigation. Entropy 2016, 18, 272. [Google Scholar] [CrossRef]
- Khedekar, A.; Devarajan, B.; Ramasamy, K.; Muthukkaruppan, V.; Kim, U. Smartphone-based application improves the detection of retinoblastoma. Eye 2019, 33, 896–901. [Google Scholar] [CrossRef]
- Aloudat, M.; Faezipour, M.; El-Sayed, A. Automated Vision-Based High Intraocular Pressure Detection Using Frontal Eye Images. IEEE J. Transl. Eng. Health Med. 2019, 7, 1–13. [Google Scholar] [CrossRef]
- Abuzaghleh, O.; Barkana, B.D.; Faezipour, M. Noninvasive real-time automated skin lesion analysis system for melanoma early detection and prevention. IEEE J. Transl. Eng. Health Med. 2015, 3, 1–12. [Google Scholar] [CrossRef]
- Louw, C.; Swanepoel, D.W.; Eikelboom, R.H.; Myburgh, H.C. Smartphone-based hearing screening at primary health care clinics. Ear Hear. 2017, 38, e93–e100. [Google Scholar] [CrossRef] [PubMed]
- Centers for Disease Control and Prevention, National Center for Health Statistics. Available online: http://www.cdc.gov/nchs (accessed on 29 March 2020).
- American Lung Association. Available online: http://www.lung.org (accessed on 24 May 2020).
- World Health Organisation. The Global Impact of Respiratory Disease. Available online: https://www.who.int/gard/publications/The_Global_Impact_of_Respiratory_Disease.pdf (accessed on 24 May 2020).
- U.S. National Institutes of Health, National Heart, Lung and Blood Institute, Health Topics, Disease Statistics. Available online: http://www.nhlbi.nih.gov (accessed on 25 January 2020).
- Heron, M. Deaths: Leading Causes for 2017; National Vital Statistics Reports; National Center for Health Statistics: Hyattsville, MD, USA, 2019; Volume 68.
- Respiratory Disease Death Rates Have Soared. Available online: https://www.webmd.com/lung/copd/news/20170929/respiratory-disease-death-rates-have-soared#1 (accessed on 24 May 2020).
- World Health Organization. Available online: https://www.who.int/ (accessed on 17 June 2020).
- Johns Hopkins Coronavirus Resource Center. Available online: https://coronavirus.jhu.edu (accessed on 17 June 2020).
- IHME COVID-19 Projections. Available online: https://covid19.healthdata.org/projections (accessed on 17 June 2020).
- Brown, M.S.; Goldin, J.G.; Suh, R.D.; McNitt-Gray, M.F.; Sayre, J.W.; Aberle, D.R. Lung Micronodules: Automated Method for Detection at Thin-Section CT-Initial Experience. Radiology 2003, 226, 256–262. [Google Scholar] [CrossRef]
- Ostadabbas, S.; Sebkhi, N.; Zhang, M.; Rahim, S.; Anderson, L.J.; Lee, F.E.H.; Ghovanloo, M. A vision-based respiration monitoring system for passive airway resistance estimation. IEEE Trans. Biomed. Eng. 2016, 63, 1904–1913. [Google Scholar] [CrossRef]
- Ostadabbas, S.; Bulach, C.; Ku, D.N.; Anderson, L.J.; Ghovanloo, M. A passive quantitative measurement of airway resistance using depth data. In Proceedings of the Engineering in Medicine and Biology Society (EMBC), 2014 36th Annual International Conference of the IEEE, Chicage, IL, USA, 26–30 August 2014; IEEE: Piscataway, NJ, USA, 2014; pp. 5743–5747. [Google Scholar]
- Rezaei, B.; Lowe, J.; Yee, J.R.; Porges, S.; Ostadabbas, S. Non-contact automatic respiration monitoring in restrained rodents. In Proceedings of the 2016 IEEE 38th Annual International Conference of the Engineering in Medicine and Biology Society (EMBC), Orlando, FL, USA, 16–20 August 2016; IEEE: Piscataway, NJ, USA, 2016; pp. 4946–4950. [Google Scholar]
- Sovijärvi, A.; Vanderschoot, J.; Earis, J. Standardization of computerized respiratory sound analysis. Crit Care Med. 1997, 156, 974–987. [Google Scholar]
- Reichert, S.; Gass, R.; Brandt, C.; Andrès, E. Analysis of respiratory sounds: State of the art. Clin. Med. Insights Circ. Respir. Pulm. Med. 2008, 2, 45. [Google Scholar] [CrossRef]
- Azam, M.A.; Shahzadi, A.; Khalid, A.; Anwar, S.M.; Naeem, U. Smartphone based human breath analysis from respiratory sounds. In Proceedings of the 2018 40th Annual International Conference of the IEEE Engineering in Medicine and Biology Society (EMBC), Honolulu, HI, USA, 17–21 July 2018; IEEE: Piscataway, NJ, USA, 2018; pp. 445–448. [Google Scholar]
- Abushakra, A.; Faezipour, M. Acoustic signal classification of breathing movements to virtually aid breath regulation. IEEE J. Biomed. Health Inform. 2013, 17, 493–500. [Google Scholar] [CrossRef] [PubMed]
- COVID-19 Sounds App. Available online: https://www.covid-19-sounds.org/en/# (accessed on 24 May 2020).
- Asthma App to Improve Self Monitoring. Available online: https://healthcare-in-europe.com/en/news/asthma-app-to-improve-self-monitoring.html (accessed on 29 March 2020).
- App Lets you Monitor Lung Health Using Only a Smartphone. Available online: https://www.washington.edu/news/2012/09/18/app-lets-you-monitor-lung-health-using-only-a-smartphone/ (accessed on 29 March 2020).
- Shih, C.H.; Tomita, N.; Lukic, Y.X.; Reguera, Á.H.; Fleisch, E.; Kowatsch, T. Breeze: Smartphone-based Acoustic Real-time Detection of Breathing Phases for a Gamified Biofeedback Breathing Training. Proc. ACM Interact. Mob. Wearable Ubiquitous Technol. 2019, 3, 1–30. [Google Scholar] [CrossRef]
- Wu, A.C.; Tse, S.M.; Balli, F. Mobile Applications and Wearables for Chronic Respiratory Disease Monitoring. In Precision in Pulmonary, Critical Care, and Sleep Medicine; Springer: Berlin/Heidelberg, Germany, 2020; pp. 291–304. [Google Scholar]
- Alafeef, M.; Fraiwan, M. Smartphone-based respiratory rate estimation using photoplethysmographic imaging and discrete wavelet transform. J. Ambient Intell. Humaniz. Comput. 2020, 11, 693–703. [Google Scholar] [CrossRef]
- Cho, Y.; Bianchi-Berthouze, N.; Julier, S.J.; Marquardt, N. ThermSense: Smartphone-based breathing sensing platform using noncontact low-cost thermal camera. In Proceedings of the 2017 Seventh International Conference on Affective Computing and Intelligent Interaction Workshops and Demos (ACIIW), San Antonio, TX, USA, 23–26 October 2017; IEEE: Piscataway, NJ, USA, 2017; pp. 83–84. [Google Scholar]
- Abushakra, A.; Faezipour, M.; Abumunshar, A. Efficient frequency-based classification of respiratory movements. In Proceedings of the 2012 IEEE International Conference on Electro/Information Technology (EIT), Indianapolis, IN, USA, 6–8 May 2012; IEEE: Piscataway, NJ, USA, 2012; pp. 1–5. [Google Scholar]
- Faezipour, M.; Abuzneid, A. Smartphone-Based Self-Testing of COVID-19 Using Breathing Sounds. Telemed. e-Health 2020. [Google Scholar] [CrossRef] [PubMed]
- Abushakra, A.; Faezipour, M. Estimating Lung Capacity from Acoustic Signal of Respiration. In Proceedings of the IEEE EMBS Micro and Nanotechnology in Medicine (MNM’12), Maui, HI, USA, 3–7 December 2012; IEEE: Piscataway, NJ, USA, 2012; p. 19. [Google Scholar]
- Abushakra, A.; Faezipour, M. Lung capacity estimation through acoustic signal of breath. In Proceedings of the 2012 IEEE 12th International Conference on Bioinformatics & Bioengineering (BIBE), Larnaca, Cyprus, 11–13 November 2012; IEEE: Piscataway, NJ, USA, 2012; pp. 386–391. [Google Scholar]
- Sandbrook, R.; Borrini, G. The Wealth of Communities: Stories of Success in Local Environmental Management; Earthscan: London, UK, 1994. [Google Scholar]
- Brundtland, G.H.; Khalid, M.; Agnelli, S.; Al-Athel, S.; Chidzero, B. Our Common Future; Butterworth-Heinemann: New York, NY, USA, 1987; p. 8. [Google Scholar]
- Assembly, U.G. Resolution Adopted by the General Assembly on 16 September 2005. 60/1: 2005 World Summit Outcome; Technical Report, Document A/RES/60/1; United Nations: New York, NY, USA, 2005. [Google Scholar]
- Faggini, M.; Cosimato, S.; Nota, F.D.; Nota, G. Pursuing Sustainability for Healthcare through Digital Platforms. Sustainability 2019, 11, 165. [Google Scholar] [CrossRef]
- Walden, D.D.; Roedler, G.J.; Forsberg, K.; Hamelin, R.D.; Shortell, T.M. Systems Engineering Handbook: A Guide for System Life Cycle Processes and Activities; John Wiley & Sons: Hoboken, NJ, USA, 2015. [Google Scholar]
- Runciman, B.; Walton, M. Safety and Ethics in Healthcare: A Guide to Getting It Right; Ashgate Publishing, Ltd.: Farnham, UK, 2007. [Google Scholar]
- Baxter, G. White paper: Complexity in health care. In The UK National Research & Training Initiative in Large Scale Complex IT Systems; University of St. Andrews: Scotland, UK, 2010. [Google Scholar]
- World Health Organization. WHO Patient Safety Curriculum Guide for Medical Schools. 2009. Available online: https://apps.who.int/iris/bitstream/handle/10665/44091/9789241598316_eng.pdf (accessed on 18 June 2020).
- Sterman, J. System Dynamics: Systems Thinking and Modeling for a Complex World; ESD Working Papers; ESD-WP-2003-01.13-ESD Internal Symposium; Massachusetts Institute of Technology, Engineering Systems Division: Cambridge, MA, USA, 2002. [Google Scholar]
- Forrester, J.W. System dynamics, systems thinking, and soft OR. Syst. Dyn. Rev. 1994, 10, 245–256. [Google Scholar] [CrossRef]
- Faezipour, M.; Ferreira, S. Applying systems thinking to assess sustainability in healthcare system of systems. Int. J. Syst. Syst. Eng. 2011, 2, 290–308. [Google Scholar] [CrossRef]
- Faezipour, M.; Ferreira, S. A System Dynamics Perspective of Patient Satisfaction in Healthcare. Procedia Comput. Sci. 2013, 16, 148–156. [Google Scholar] [CrossRef]
- Faezipour, M.; Ferreira, S. A system dynamics approach for sustainable water management in hospitals. IEEE Syst. J. 2018, 12, 1278–1285. [Google Scholar] [CrossRef]
- De Andrade, L.; Lynch, C.; Carvalho, E.; Rodrigues, C.G.; Vissoci, J.R.N.; Passos, G.F.; Pietrobon, R.; Nihei, O.K.; de Barros Carvalho, M.D. System dynamics modeling in the evaluation of delays of care in ST-segment elevation myocardial infarction patients within a tiered health system. PLoS ONE 2014, 9, e103577. [Google Scholar] [CrossRef]
- Lane, N.D.; Mohammod, M.; Lin, M.; Yang, X.; Lu, H.; Ali, S.; Doryab, A.; Berke, E.; Choudhury, T.; Campbell, A. Bewell: A smartphone application to monitor, model and promote wellbeing. In Proceedings of the 5th International ICST Conference on Pervasive Computing Technologies for Healthcare, Dublin, Ireland, 23–26 May 2011; pp. 23–26. [Google Scholar]
- Graf, J.; Moreno, B.; Wallwiener, M.; Menzel, K.; Brucker, S.Y.; Simoes, E. Practicability and Efficiency of E-health Applications in Patient-Reported Outcomes: State of and Need for Research; Gesundheitswesen (Bundesverband Der Arzte Des Offentlichen Gesundheitsdienstes (Germany)): Berlin, Germany, 2018; Volume 80, pp. 953–962. [Google Scholar]
- Ware, J.; Kosinski, M.; Gandek, B. SF-36 Health Survey: Manual and Interpretation Guide LINCOLN; QualityMetric Incorporated: Lincoln, RI, USA, 2000. [Google Scholar]
- Pascoe, G.C. Patient satisfaction in primary health care: A literature review and analysis. Eval. Program Plan. 1983, 6, 185–210. [Google Scholar] [CrossRef]
- Vensim Software. Available online: https://vensim.com/vensim-software/#professional-amp-dss (accessed on 25 January 2020).
- Sterman, J.D. Appropriate summary statistics for evaluating the historical fit of system dynamics models. Dynamica 1984, 10, 51–66. [Google Scholar]


| Reference | Data Acquisition | Purpose/Respiratory Monitoring Capability | Breathing Data Analysis Accuracy | Cost to Customer |
|---|---|---|---|---|
| [10] | Breathing sounds | Lung augmentation and animation, breathing phases and lung volume estimation, breathing regulation aid | 90% | N/A |
| [11] | Breathing sounds | Pediatric asthma detection | within 5% ± 1.5 of sprirometry | N/A |
| [12] | Cough sounds | Diagnosing acute respiratory illnesses in children | ≈77% on average | N/A |
| [35] | Breathing sounds | Differentiating normal and abnormal lung sounds for various respiratory diseases | ≈75% | N/A |
| [37] | Breathing sounds, cough sounds and voice of speaking | Detect COVID-19 | In progress, not reported | Free once App is launched |
| [38] | Wireless spirometer | Monitor asthma | Not reported | Free App + $100 Spirometer |
| [39] | Breathing sound blow | Estimate lung air volume | within 5% of commercial devices | Free |
| [40] | Breathing sounds | Breathing phases detection and breathing training | 75.5% | N/A |
| [41] | Wearable biosensors | Chronic Respiratory Disease Monitoring | Not reported | N/A |
| [42] | Photoplethysmographic (PPG) imaging | Respiratory rate estimation | 97.8% | N/A |
| [43] | Thermal camera | Respiration training | Not reported | N/A |
| Category | Patient | Resource | Environment | Finance | Quality |
|---|---|---|---|---|---|
| Smartphone performance metrics | ✔ | ✔ | |||
| Patient status factors | ✔ | ✔ | |||
| Cost related factors | ✔ | ||||
| Resource related factors | ✔ | ✔ |
| Sustainability Category | Patient | Resource | Environment | Finance | Quality |
|---|---|---|---|---|---|
| Smartphone performance metric factors: | |||||
| respiratory data acquisition feasibility level | ✔ | ✔ | |||
| breathing data analysis algorithm | ✔ | ✔ | |||
| and software management level | |||||
| respiratory monitoring level | ✔ | ✔ | |||
| ease of use level | ✔ | ✔ | |||
| response rate | ✔ | ✔ | |||
| performance level of breathing App | ✔ | ✔ | |||
| data security and privacy level | ✔ | ✔ | |||
| Patient status factors: | |||||
| Patient wellbeing | ✔ | ✔ | |||
| rate of wellbeing and care | ✔ | ✔ | |||
| reliability level | ✔ | ✔ | |||
| general health rate | ✔ | ✔ | |||
| level of patient satisfaction | ✔ | ✔ | |||
| Cost related factors: | |||||
| cost to customers | ✔ | ||||
| level of product advertisement | ✔ | ||||
| rate of need | ✔ | ✔ | |||
| level of demand | ✔ | ✔ | |||
| cost of service level | ✔ | ||||
| Resource related factors: | |||||
| internet connectivity level | ✔ | ✔ | ✔ | ||
| GPS/location tracking level | ✔ | ✔ | ✔ | ||
| Battery life | ✔ | ✔ | |||
| batter rate | ✔ | ✔ |
| Parameter | Ease of Use Level | Respiratory Monitoring Level | Breathing Data Analysis Algorithm and Software Management Level | Respiratory Data Acquisition Feasibility Level | Cost to Customer | All Other Input Variables |
|---|---|---|---|---|---|---|
| Baseline | 50% | 50% | 50% | 50% | 50% | 50% |
| Scenario 1 | 50% | 50% | 90% | 50% | 50% | 50% |
| Scenario 2 | 50% | 30% | 50% | 50% | 50% | 50% |
| Scenario 3 | 50% | 50% | 50% | 50% | 80% | 50% |
| Scenario 4 | 80% | 80% | 80% | 80% | 50% | 50% |
| Scenario 5 | 30% | 40% | 70% | 90% | 50% | 50% |
| Scenario 6 | 40% | 40% | 40% | 40% | 50% | 50% |
| Time (Day) | 0 | 1 | 2 | 10 | 20 | 25 |
|---|---|---|---|---|---|---|
| Baseline | 0.5 | 0.500 | 0.501 | 0.511 | 0.529 | 0.540 |
| Scenario 1 | 0.501 | 0.502 | 0.504 | 0.521 | 0.554 | 0.577 |
| Scenario 2 | 0.499 | 0.4999 | 0.500 | 0.506 | 0.516 | 0.523 |
| Scenario 3 | 0.499 | 0.500 | 0.501 | 0.511 | 0.534 | 0.550 |
| Scenario 4 | 0.508 | 0.5136 | 0.519 | 0.587 | 0.744 | 0.874 |
| Scenario 5 | 0.500 | 0.501 | 0.502 | 0.513 | 0.535 | 0.550 |
| Scenario 6 | 0.499 | 0.499 | 0.499 | 0.503 | 0.510 | 0.515 |
© 2020 by the authors. Licensee MDPI, Basel, Switzerland. This article is an open access article distributed under the terms and conditions of the Creative Commons Attribution (CC BY) license (http://creativecommons.org/licenses/by/4.0/).
Share and Cite
Faezipour, M.; Faezipour, M. Sustainable Smartphone-Based Healthcare Systems: A Systems Engineering Approach to Assess the Efficacy of Respiratory Monitoring Apps. Sustainability 2020, 12, 5061. https://doi.org/10.3390/su12125061
Faezipour M, Faezipour M. Sustainable Smartphone-Based Healthcare Systems: A Systems Engineering Approach to Assess the Efficacy of Respiratory Monitoring Apps. Sustainability. 2020; 12(12):5061. https://doi.org/10.3390/su12125061
Chicago/Turabian StyleFaezipour, Misagh, and Miad Faezipour. 2020. "Sustainable Smartphone-Based Healthcare Systems: A Systems Engineering Approach to Assess the Efficacy of Respiratory Monitoring Apps" Sustainability 12, no. 12: 5061. https://doi.org/10.3390/su12125061
APA StyleFaezipour, M., & Faezipour, M. (2020). Sustainable Smartphone-Based Healthcare Systems: A Systems Engineering Approach to Assess the Efficacy of Respiratory Monitoring Apps. Sustainability, 12(12), 5061. https://doi.org/10.3390/su12125061