The Links between Proactive Environmental Strategy, Competitive Advantages and Firm Performance: An Empirical Study in Vietnam


Abstract
:1. Introduction
2. Literature Review and Hypotheses Development
2.1. Theoretical Approach
2.2. Classifications of Environmental Strategies
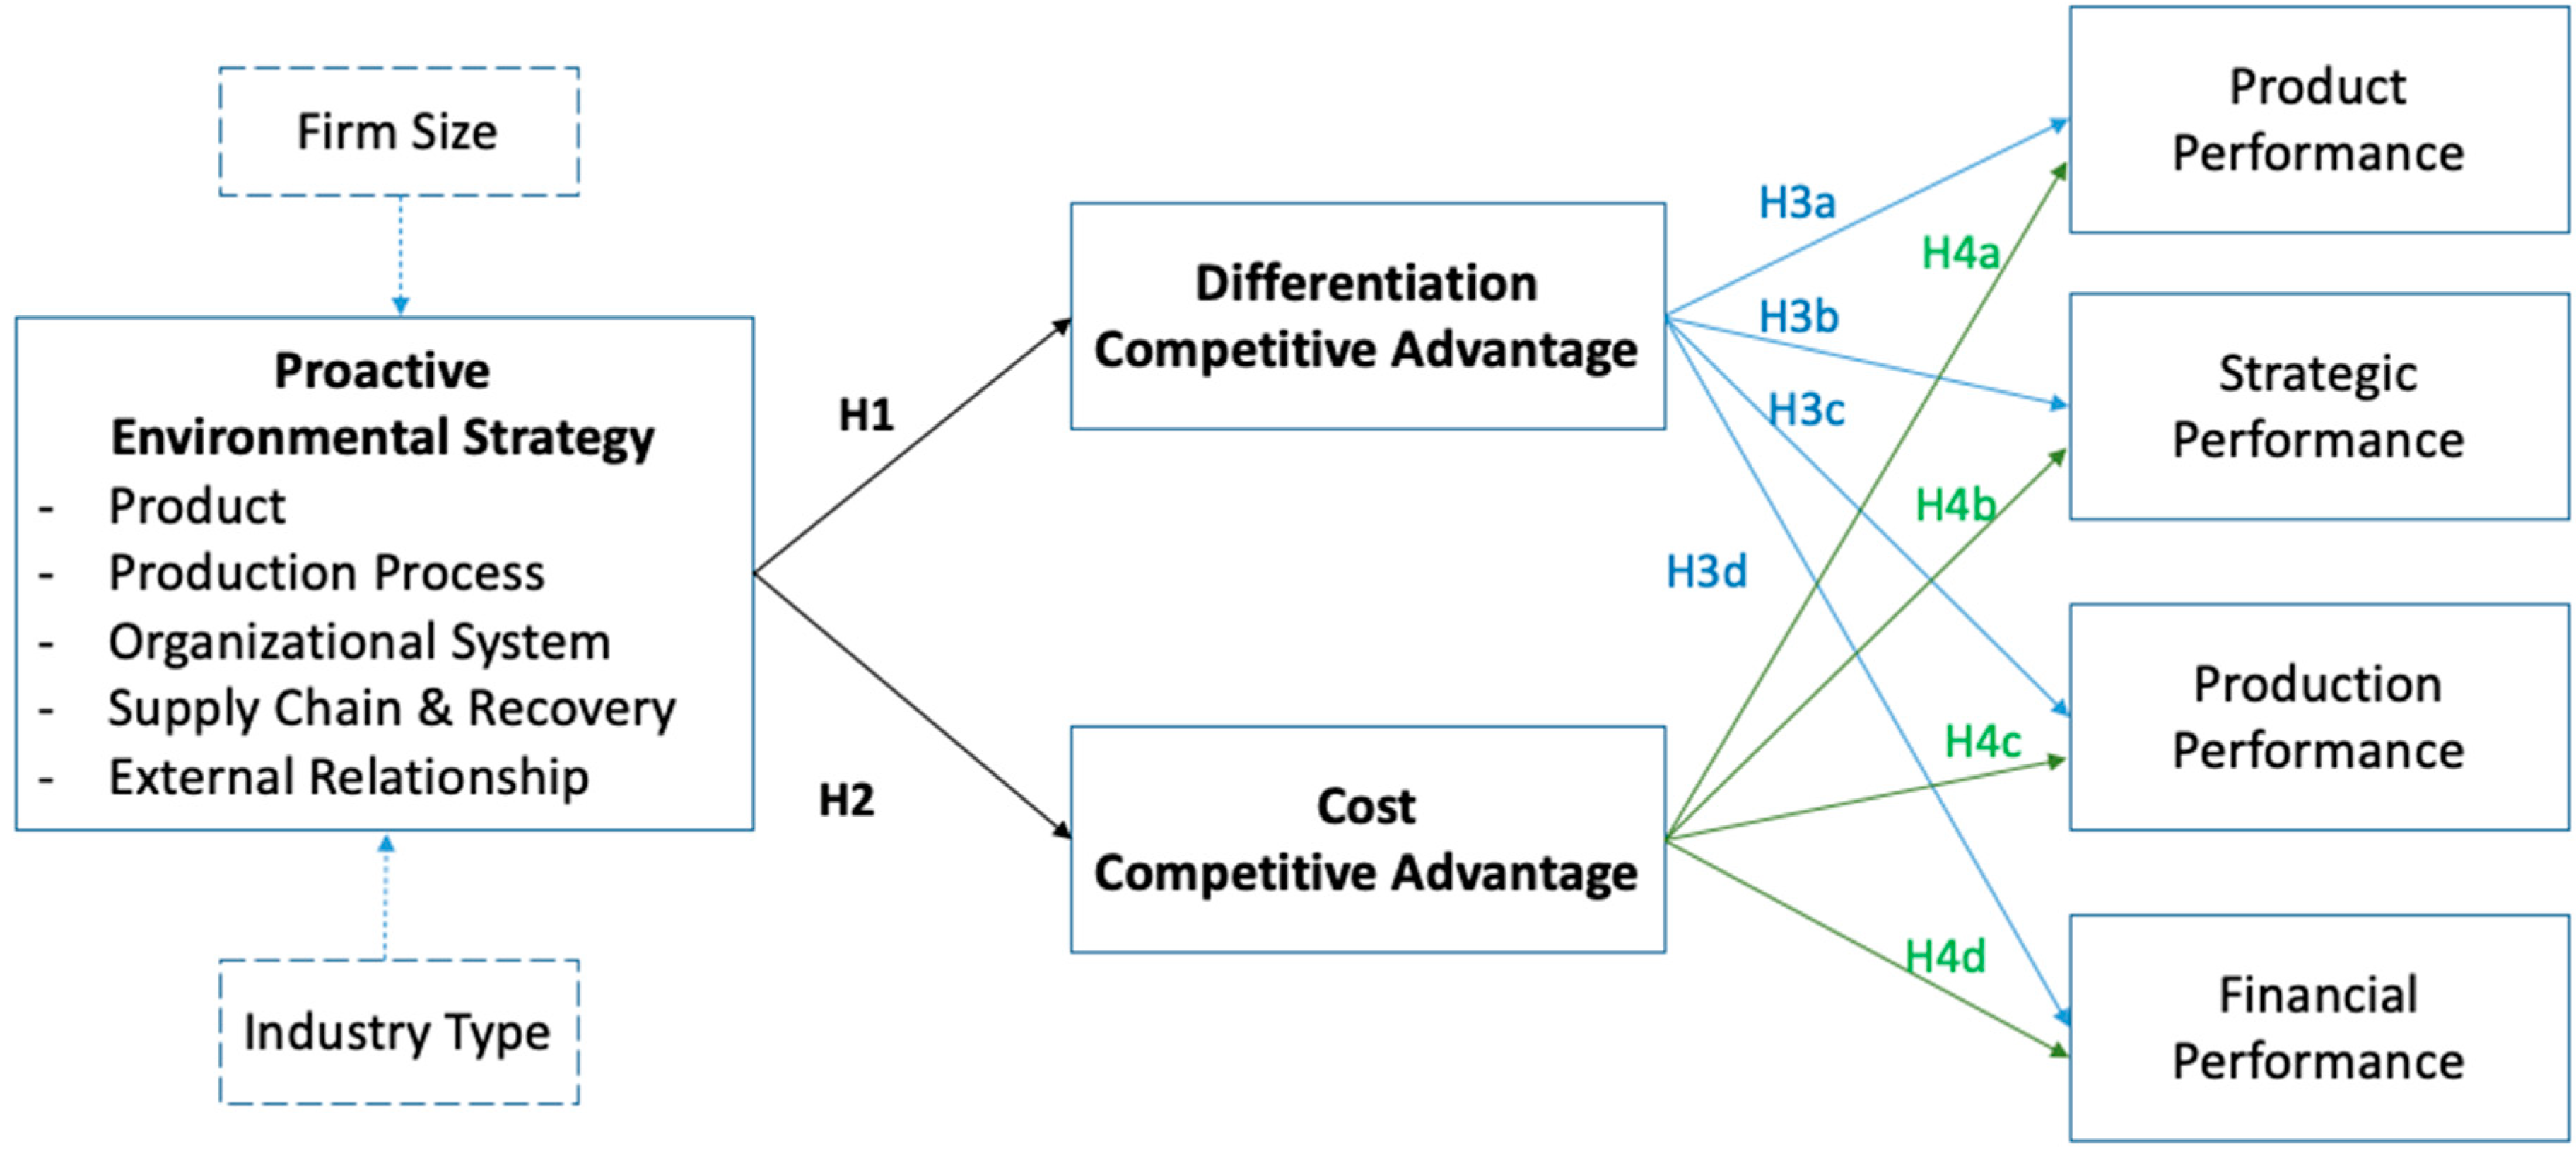
2.3. Proactive Environmental Strategy and Competitive Advantages
2.4. Competitive Advantages and Firm Performance
2.5. Control Variables: Firm Size and Industry Types
3. Methodology
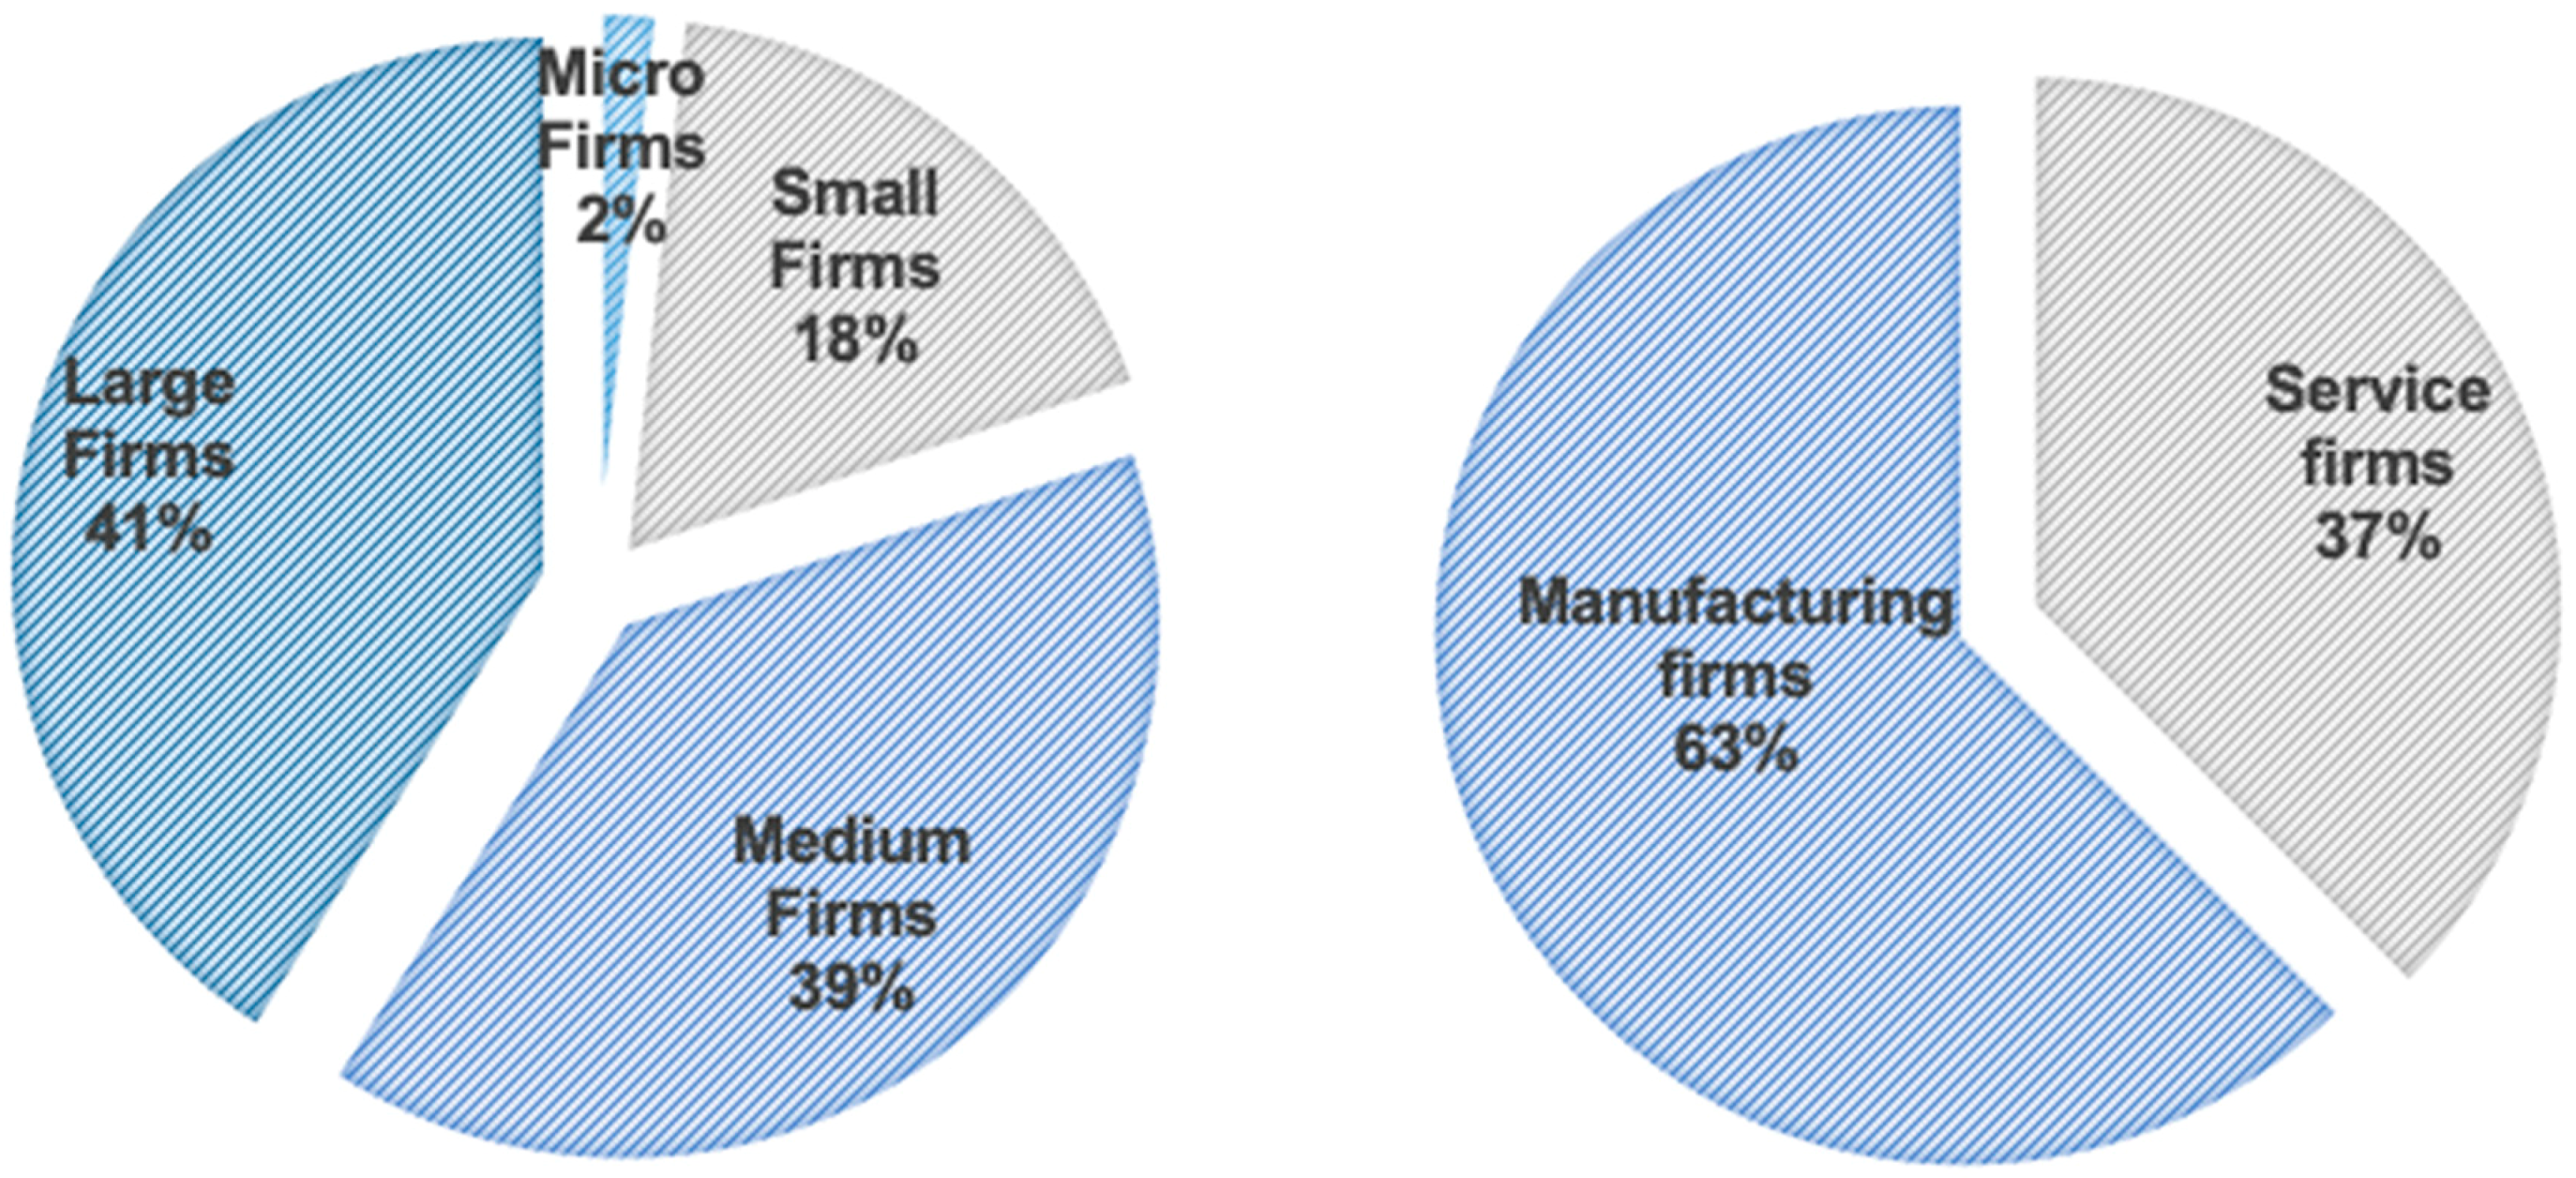
3.1. Data Collection
3.2. Measures
3.2.1. Proactive Environmental Strategy
- Product (PR) comprises three items relating like green concurrent engineering in new product environment, life cycle assessment and green marketing for green products.
- Production process (PP) consists of three items relating to pollution reduction practices, green production technologies and procedures for the evaluation of environmental impact in production process.
- Organizational system (OS) was measured by three items that reflects educational and training programs, organizational structure and performance assessment in response to environmental issues.
- Supply chain and recovery (SCR) were measured using three items relating to green procurement, cooperation with suppliers in environmental programs, and end-of-life product recycling programs.
- External relationship (EXR) was operationalized using three items relating to firm’s relationships to key stakeholders in participating in and implementing environmental strategies. Each surveyed representative was asked to evaluate implementation degree of each decision area ranging from (1)—Strongly disagree to (7)—Strongly agree according to seven-point Likert scale.
3.2.2. Competitive Advantages
- Differentiation competitive advantage (DCA) was measured by four items relating to green brand image, quality of environmentally friendly products, higher customer values product innovativeness.
- Cost competitive advantage (CCA) was measured by three items reflecting firm’s efforts to minimize costs.
3.2.3. Firm Performance
- Product performance (PRP) was measured by six items of higher quality, higher reliability, greater customer support, more added values, higher product flexibility and more reasonable price as compared to key rivals of the firm.
- Strategic performance (SP) was measured by five items relating to higher customer satisfaction, greater growth, higher market share, more positive effect to the environment and more saving costs.
- Production performance (PPE) was measured by three items that reflects efficiencies in production systems, shorter time for product launch and higher quality of operating processes.
- Financial performance (FP) was measured by three items relating to better profit margins, shareholder value and cash flow.
3.2.4. Control Variables
3.3. Methods for Data Analysis
4. Results and Discussion
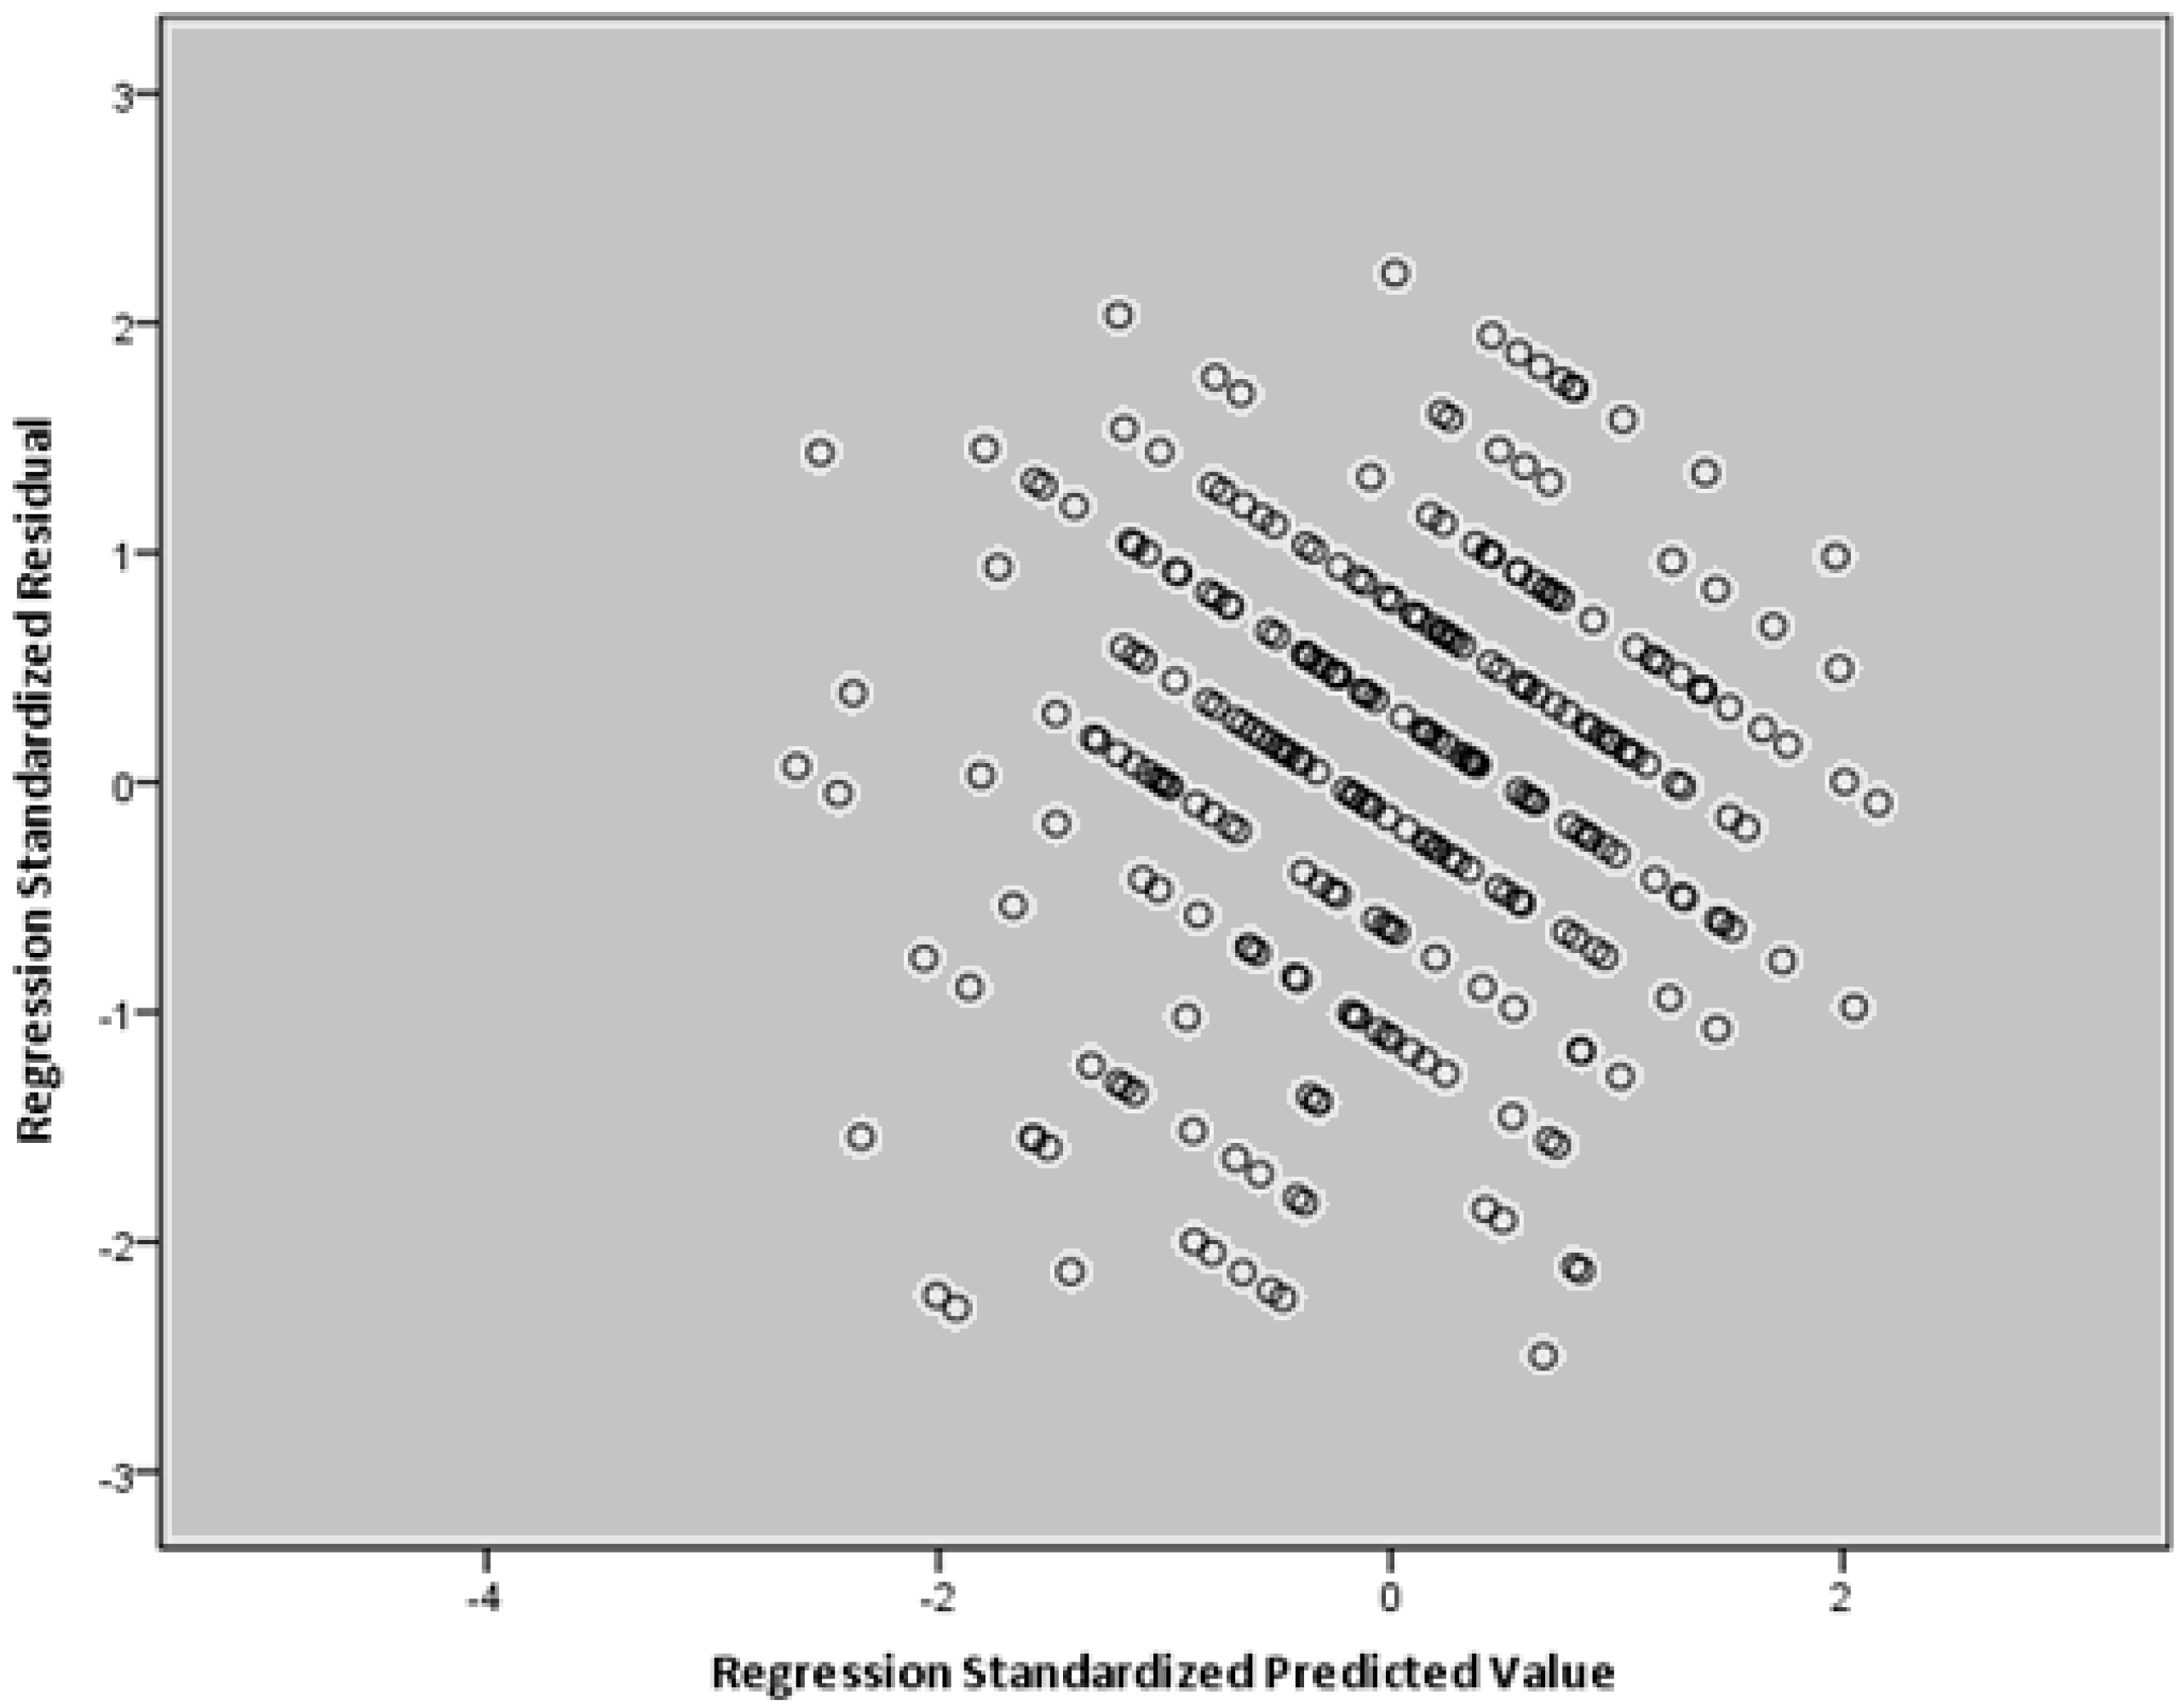
4.1. Multivariate Diagnostic Tests
4.2. Common Method Effects
4.3. Measure Validation
4.4. Hypotheses Testing
4.5. Effects of Control Variables
5. Conclusions and Implications
Author Contributions
Funding
Conflicts of Interest
Appendix A

| Constructs | Item | Item Description | Source |
|---|---|---|---|
| Product | PR1 | We use concurrent engineering in new product development to improve our products’ environmental performance | Adapted from Lee and Rhee [13] |
| PR2 | We have life cycle assessment system for our products | ||
| PR3 | We have green marketing program for our products | ||
| Production Process | PP1 | We have programs and practices that reduce environmental pollution in our production area | |
| PP2 | We have greener technologies in our production processes | ||
| PP3 | We have official procedures for environmental evaluation | ||
| Organizational System | OS1 | We provide environmental training and educational programs to our employees | |
| OS2 | We have a specialized division to deal with our firm’s environmental issues | ||
| OS3 | We have programs to measure and assess our environmental performance | ||
| Supply chain and recovery | CAF1 | Our procurement is concerned with environmentally friendly products | |
| CAF2 | We provide environmental support and collaborative works to our suppliers | ||
| CAF3 | We conduct product re-use programs | ||
| External Relationship | EXR1 | We have good relationships with communities, local authorities, NGOs, socio-political organizations | |
| EXR2 | We voluntarily implement environmental protection programs | ||
| EXR3 | We periodically publish transparent environmental information about our firm | ||
| Differentiation competitive advantage | DCA1 | We create a green brand image to identify the firm in the market | Adapted from Leonidou et al. [29] and Molina-Azorín et al. [36] |
| DCA2 | Our environmentally friendly products have better quality than our rivals | ||
| DCA3 | Our environmentally friendly products add more value for customers | ||
| DCA4 | Our environmentally friendly products are highly innovative | ||
| Cost leadership competitive advantage | CCA1 | Our environmentally friendly products focus on minimizing costs | |
| CCA2 | We focus on improving our productivity | ||
| CCA3 | We utilize economies of scale | ||
| Product performance | PRP1 | Higher quality | Adapted from Nadkarni and Narayanan [40] |
| PRP2 | Higher reliability | ||
| PRP3 | Greater customer support | ||
| PRP4 | More added value to products | ||
| PRP5 | Higher product flexibility | ||
| PRP6 | More reasonable price | ||
| Strategic performance (in the last 3 years) | SP1 | Higher customer satisfaction level | |
| SP2 | Greater growth | ||
| SP3 | Higher market share | ||
| SP4 | More positive effects to environment | ||
| SP5 | Lower cost | ||
| Production Performance | PPE1 | More efficient production systems | |
| PPE2 | Shorter time for launching new products | ||
| PPE3 | Higher quality of production processes | ||
| Financial performance | FP1 | Better profit margins | |
| FP2 | Better value for shareholders | ||
| FP3 | More efficient cash flow |
Appendix B

References
- Olson, E.G. Creating an enterprise-level “green” strategy. J. Bus. Strategy 2008, 29, 22–30. [Google Scholar] [CrossRef]
- Katsikeas, C.S.; Leonidou, C.N.; Zeriti, A. Eco-friendly product development strategy: Antecedents, outcomes, and contingent effects. J. Acad. Mark. Sci. 2016, 44, 660–684. [Google Scholar] [CrossRef] [Green Version]
- De Marchi, V.; Di Maria, E.; Micelli, S. Environmental strategies, upgrading and competitive advantage in global value chains. Bus. Strategy Environ. 2013, 22, 62–72. [Google Scholar] [CrossRef]
- Gupta, H.; Barua, M.K. A framework to overcome barriers to green innovation in smes using bwm and fuzzy topsis. Sci. Total Environ. 2018, 633, 122–139. [Google Scholar] [CrossRef]
- Blanco, E.; Rey-Maquieira, J.; Lozano, J. The economic impacts of voluntary environmental performance of firms: A critical review. J. Econ. Surv. 2009, 23, 462–502. [Google Scholar] [CrossRef]
- Clarkson, P.M.; Li, Y.; Richardson, G.D.; Vasvari, F.P. Does it really pay to be green? Determinants and consequences of proactive environmental strategies. J. Account. Public Policy 2011, 30, 122–144. [Google Scholar] [CrossRef]
- King, A.A.; Lenox, M.J. Does it really pay to be green? J. Ind. Ecol. 2001, 5, 105–116. [Google Scholar] [CrossRef] [Green Version]
- Orsato, R.J. Competitive environmental strategies: When does it pay to be green? Calif. Manag. Rev. 2006, 48, 127–143. [Google Scholar] [CrossRef] [Green Version]
- Stefan, A.; Paul, L. Does it pay to be green? A systematic overview. Acad. Manag. Perspect. 2008, 22, 45–62. [Google Scholar] [CrossRef] [Green Version]
- Bıçakcıoğlu, N. Green business strategies of exporting manufacturing firms: Antecedents, practices, and outcomes. J. Glob. Mark. 2018, 31, 246–269. [Google Scholar] [CrossRef]
- Fousteris, A.; Didaskalou, E.; Tsogas, M.-M.; Georgakellos, D. The environmental strategy of businesses as an option under recession in greece. Sustainability 2018, 10, 4399. [Google Scholar] [CrossRef] [Green Version]
- Ko, W.W.; Liu, G. Environmental Strategy and Competitive Advantage: The Role of Small- and Medium-Sized enterprises’ Dynamic Capabilities. Bus. Strategy Environ. 2017, 26, 584–596. [Google Scholar] [CrossRef] [Green Version]
- Lee, S.Y.; Rhee, S.K. The change in corporate environmental strategies: A longitudinal empirical study. Manag. Decis. 2007, 45, 196–216. [Google Scholar] [CrossRef]
- Murillo-Luna, J.L.; Garcés-Ayerbe, C.; Rivera-Torres, P. Barriers to the adoption of proactive environmental strategies. J. Clean. Prod. 2011, 19, 1417–1425. [Google Scholar] [CrossRef]
- Bae, H.S. The effect of environmental capabilities on environmental strategy and environmental performance of korean exporters for green supply chain management. Asian J. Shipp. Logist. 2017, 33, 167–176. [Google Scholar] [CrossRef]
- Delmas, M.; Hoffmann, V.H.; Kuss, M. Under the tip of the iceberg: Absorptive capacity, environmental strategy, and competitive advantage. Bus. Soc. 2011, 50, 116–154. [Google Scholar] [CrossRef] [Green Version]
- Do, B.; Nguyen, U.; Nguyen, N.; Johnson, L.W. Exploring the proactivity levels and drivers of environmental strategies adopted by vietnamese seafood export processing firms: A qualitative approach. Sustainability 2019, 11, 3964. [Google Scholar] [CrossRef] [Green Version]
- Ge, B.; Yang, Y.; Jiang, D.; Gao, Y.; Du, X.; Zhou, T. An empirical study on green innovation strategy and sustainable competitive advantages: Path and boundary. Sustainability 2018, 10, 3631. [Google Scholar] [CrossRef] [Green Version]
- López-Gamero, M.D.; Molina-Azorín, J.F.; Claver-Cortés, E. The whole relationship between environmental variables and firm performance: Competitive advantage and firm resources as mediator variables. J. Environ. Manag. 2009, 90, 3110–3121. [Google Scholar] [CrossRef] [Green Version]
- Jiang, Y.; Xue, X.; Xue, W. Proactive corporate environmental responsibility and financial performance: Evidence from chinese energy enterprises. Sustainability 2018, 10, 964. [Google Scholar] [CrossRef] [Green Version]
- Junquera, B.; Barba-Sánchez, V. Environmental proactivity and firms’ performance: Mediation effect of competitive advantages in spanish wineries. Sustainability 2018, 10, 2155. [Google Scholar] [CrossRef] [Green Version]
- Molina-Azorín, J.F.; Claver-Cortés, E.; López-Gamero, M.D.; Tarí, J.J. Green management and financial performance: A literature review. Manag. Decis. 2009, 47, 1080–1100. [Google Scholar] [CrossRef]
- Primc, K.; Čater, T. The influence of organizational life cycle on environmental proactivity and competitive advantage: A dynamic capabilities view. Organ. Environ. 2015, 29, 212–230. [Google Scholar] [CrossRef]
- Sambasivan, M.; Bah, S.M.; Jo-Ann, H. Making the case for operating “green”: Impact of environmental proactivity on multiple performance outcomes of malaysian firms. J. Clean. Prod. 2013, 42, 69–82. [Google Scholar] [CrossRef]
- Leonidou, L.C.; Christodoulides, P.; Kyrgidou, L.P.; Palihawadana, D. Internal drivers and performance consequences of small firm green business strategy: The moderating role of external forces. J. Bus. Ethics 2017, 140, 585–606. [Google Scholar] [CrossRef] [Green Version]
- Roy, M. Environmental performance as a basis for competitive strategy: Opportunities and threats. Corp. Environ. Strategy 2002, 8, 339–347. [Google Scholar] [CrossRef]
- Ryszko, A. Proactive environmental strategy, technological eco-innovation and firm performance-case of poland. Sustainability 2016, 8, 156. [Google Scholar] [CrossRef] [Green Version]
- Dai, J.; Cantor, D.E.; Montabon, F.L. Examining corporate environmental proactivity and operational performance: A strategy-structure-capabilities-performance perspective within a green context. Int. J. Prod. Econ. 2017, 193, 272–280. [Google Scholar] [CrossRef]
- Leonidou, L.C.; Fotiadis, T.A.; Christodoulides, P.; Spyropoulou, S.; Katsikeas, C.S. Environmentally friendly export business strategy: Its determinants and effects on competitive advantage and performance. Int. Bus. Rev. 2015, 24, 798–811. [Google Scholar] [CrossRef]
- Leonidou, L.C.; Katsikeas, C.S.; Fotiadis, T.A.; Christodoulides, P. Antecedents and consequences of an eco-friendly export marketing strategy: The moderating role of foreign public concern and competitive intensity. J. Int. Mark. 2013, 21, 22–46. [Google Scholar] [CrossRef]
- López-Gamero, M.D.; Molina-Azorín, J.F. Environmental management and firm competitiveness: The joint analysis of external and internal elements. Long Range Plan. 2016, 49, 746–763. [Google Scholar] [CrossRef]
- Aragón-Correa, J.A.; Hurtado-Torres, N.; Sharma, S.; García-Morales, V.J. Environmental strategy and performance in small firms: A resource-based perspective. J. Environ. Manag. 2008, 86, 88–103. [Google Scholar] [CrossRef] [PubMed]
- Nulkar, G. SMEs and environmental performance—A framework for green business strategies. Procedia Soc. Behav. Sci. 2014, 133, 130–140. [Google Scholar] [CrossRef] [Green Version]
- Claver-Cortés, E.; Molina-Azorin, J.F.; Pereira-Moliner, J.; López-Gamero, M.D. Environmental strategies and their impact on hotel performance. J. Sustain. Tour. 2007, 15, 663–679. [Google Scholar] [CrossRef]
- Fraj, E.; Matute, J.; Melero, I. Environmental strategies and organizational competitiveness in the hotel industry: The role of learning and innovation as determinants of environmental success. Tour. Manag. 2015, 46, 30–42. [Google Scholar] [CrossRef]
- Molina-Azorín, J.F.; Tarí, J.J.; Pereira-Moliner, J.; López-Gamero, M.D.; Pertusa-Ortega, E.M. The effects of quality and environmental management on competitive advantage: A mixed methods study in the hotel industry. Tour. Manag. 2015, 50, 41–54. [Google Scholar] [CrossRef]
- Atkin, T.; Gilinsky, A.; Newton, S.K. Environmental strategy: Does it lead to competitive advantage in the us wine industry? Int. J. Wine Bus. Res. 2012, 24, 115–133. [Google Scholar] [CrossRef]
- Barba-Sánchez, V.; Atienza-Sahuquillo, C. Environmental proactivity and environmental and economic performance: Evidence from the winery sector. Sustainability 2016, 8, 1014. [Google Scholar] [CrossRef] [Green Version]
- Wright, M.; Filatotchev, I.; Hoskisson, R.E.; Peng, M. Strategic research in emerging markets: Challenging the conventional wisdom. J. Manag. Stud. 2005, 42, 1–33. [Google Scholar] [CrossRef]
- Nadkarni, S.; Narayanan, V.K. Strategic schemas, strategic flexibility, and firm performance: The moderating role of industry clockspeed. Strateg. Manag. J. 2007, 28, 243–270. [Google Scholar] [CrossRef]
- General Statistic Office of Vietnam. Statistical Summary Book of Vietnam; Statistical Publishing House: Hanoi, Vietnam, 2018. [Google Scholar]
- Bansal, P.; Roth, K. Why companies go green: A model of ecological responsiveness. Acad. Manag. J. 2000, 43, 717–736. [Google Scholar]
- Buysse, K.; Verbeke, A. Proactive environmental strategies: A stakeholder management perspective. Strateg. Manag. J. 2003, 24, 453–470. [Google Scholar] [CrossRef]
- Henriques, I.; Sadorsky, P. The relationship between environmental commitment and managerial perceptions of stakeholder importance. Acad. Manag. J. 1999, 42, 87–99. [Google Scholar]
- Elijido-Ten, E. Applying stakeholder theory to analyze corporate environmental performance: Evidence from australian listed companies. Asian Rev. Account. 2007, 15, 164–184. [Google Scholar] [CrossRef]
- Hart, S.L. A natural-resource-based view of the firm. Acad. Manag. Rev. 1995, 20, 986–1014. [Google Scholar] [CrossRef] [Green Version]
- Hart, S.L.; Dowell, G. A natural-resource-based view of the firm: Fifteen years after. J. Manag. 2011, 37, 1464–1479. [Google Scholar]
- Aragon, J. Strategic proactivity and firm approach to the natural environment. Acad. Manag. J. 1998, 41, 556–567. [Google Scholar]
- Christmann, P. Effects of “best practices“ of environmental management on cost advantage: The role of complementary. Acad. Manag. J. 2000, 43, 663–680. [Google Scholar]
- Sharma, S.; Vredenburg, H. Proactive corporate environmental strategy and the development of competitively valuable organizational capabilities. Strateg. Manag. J. 1998, 19, 729–753. [Google Scholar] [CrossRef]
- Banerjee, S.B. Environmentalism: Interpretations from industry and. J. Manag. Stud. 2001, 38, 489–515. [Google Scholar] [CrossRef]
- Liu, Y.; Guo, J.; Chi, N. The antecedents and performance consequences of proactive environmental strategy: A meta-analytic review of national contingency. Manag. Organ. Rev. 2015, 11, 521–557. [Google Scholar] [CrossRef]
- Sharma, S. Managerial interpretations and orgainzational context as predcictors of corporate choice of environmental strategy. Acad. Manag. J. 2000, 43, 681–697. [Google Scholar]
- Peteraf, M.A.; Barney, J.B. Unraveling the resource-based tangle. Manag. Decis. Econ. 2003, 24, 309–323. [Google Scholar] [CrossRef]
- Porter, M.E. Competitive Advantage: Creating and Sustaining Superior Performance; The Free Press: New York, NY, USA, 1985. [Google Scholar]
- Hill, C.W.L. Differentiation versus low cost or differentiation and low cost: A contingency framework. Acad. Manag. Rev. 1988, 13, 401–412. [Google Scholar] [CrossRef]
- Newbert, S.L. Value, rareness, competitive advantage, and performance: A conceptual-level empirical investigation of the resource-based view of the firm. Strateg. Manag. J. 2008, 29, 745–768. [Google Scholar] [CrossRef] [Green Version]
- Aragón-Correa, J.A.; Rubio-López, E.A. Proactive corporate environmental strategies: Myths and misunderstandings. Long Range Plan. 2007, 40, 357–381. [Google Scholar] [CrossRef]
- Zeriti, A.; Robson, M.J.; Spyropoulou, S.; Leonidou, C.N. Sustainable export marketing strategy fit and performance. J. Int. Mark. 2014, 22, 44–66. [Google Scholar] [CrossRef] [Green Version]
- Blomquist, J.; Bartolino, V.; Waldo, S. Price premiums for providing eco-labelled seafood: Evidence from msc-certified cod in sweden. J. Agric. Econ. 2015, 66, 690–704. [Google Scholar] [CrossRef]
- Eryigit, N.; Özcüre, G. Eco-innovation as modern era strategy of companies in developing countries: Comparison between turkey and european union. Procedia Soc. Behav. Sci. 2015, 195, 1216–1225. [Google Scholar] [CrossRef] [Green Version]
- Shrivastava, P. Environmental technologies and competitive advantage. Strateg. Manag. J. 1995, 16, 183–200. [Google Scholar] [CrossRef]
- Banerjee, S.B.; Iyer, E.S.; Kashyap, R.K. Corporate environmentalism: Antecedents and influence of industry type. J. Mark. 2003, 67, 106–122. [Google Scholar] [CrossRef]
- Chenhall, R.H. Integrative strategic performance measurement systems, strategic alignment of manufacturing, learning and strategic outcomes: An exploratory study. Account. Organ. Soc. 2005, 30, 395–422. [Google Scholar] [CrossRef]
- Arthur, J.B. Effects of human resource systems on manufacturing performance and turnover. Acad. Manag. J. 1994, 37, 670–687. [Google Scholar]
- Moorman, C.; Rust, R.T. The role of marketing. J. Mark. 1999, 63, 180–197. [Google Scholar] [CrossRef]
- Song, W.; Yu, H. Green innovation strategy and green innovation: The roles of green creativity and green organizational identity. Corp. Soc. Responsib. Environ. Manag. 2018, 25, 135–150. [Google Scholar] [CrossRef]
- Dechant, K.; Altman, B. Environmental leadership: From compliance to competitive advantage. Acad. Manag. Perspect. 1994, 8, 7–27. [Google Scholar] [CrossRef]
- Davidson, J.H. Offensive Marketing: Or, How to Make your Competitors Followers; Gower: Aldershot, UK, 1987. [Google Scholar]
- Taylor, N.; Barker, K.; Simpson, M. Achieving ‘sustainable business’: A study of perceptions of environmental best practice by smes in south yorkshire. Environ. Plan. C Gov. Policy 2003, 21, 89–105. [Google Scholar] [CrossRef]
- McConnell, J.D. The price-quality relationship in an experimental setting. J. Mark. Res. 1968, 5, 300–303. [Google Scholar] [CrossRef]
- Wolinsky, A. Prices as signals of product quality. Rev. Econ. Stud. 1983, 50, 647–658. [Google Scholar] [CrossRef]
- Gerstner, E. Do higher prices signal higher quality? J. Mark. Res. 1985, 22, 209–215. [Google Scholar] [CrossRef]
- Cooper, R. Costing techniques to support corporate strategy: Evidence from japan. Manag. Account. Res. 1996, 7, 219–246. [Google Scholar] [CrossRef]
- Darnall, N.; Henriques, I.; Sadorsky, P. Adopting proactive environmental strategy: The influence of stakeholders and firm size. J. Manag. Stud. 2010, 47, 1072–1094. [Google Scholar] [CrossRef]
- Chen, Y.-S. The driver of green innovation and green image – green core competence. J. Bus. Ethics 2008, 81, 531–543. [Google Scholar] [CrossRef]
- Brammer, S.; Hoejmose, S.; Marchant, K. Environmental management in smes in the uk: Practices, pressures and perceived benefits. Bus. Strategy Environ. 2012, 21, 423–434. [Google Scholar] [CrossRef]
- Betts, T.K.; Wiengarten, F.; Tadisina, S.K. Exploring the impact of stakeholder pressure on environmental management strategies at the plant level: What does industry have to do with it? J. Clean. Prod. 2015, 92, 282–294. [Google Scholar] [CrossRef] [Green Version]
- Wilson, A. Marketing Research; Macmillan International Higher Education: Great Britain, UK, 2018. [Google Scholar]
- Agya Yalley, A.; Singh Sekhon, H. Service production process: Implications for service productivity. Int. J. Prod. Perform. Manag. 2014, 63, 1012–1030. [Google Scholar] [CrossRef]
- González-Benito, J.; González-Benito, Ó. A review of determinant factors of environmental proactivity. Bus. Strategy Environ. 2006, 15, 87–102. [Google Scholar] [CrossRef]
- Dang, C.; Li, Z.; Yang, C. Measuring firm size in empirical corporate finance. J. Bank. Financ. 2018, 86, 159–176. [Google Scholar] [CrossRef]
- Podsakoff, P.M.; MacKenzie, S.B.; Lee, J.-Y.; Podsakoff, N.P. Common method biases in behavioral research: A critical review of the literature and recommended remedies. J. Appl. Psychol. 2003, 88, 879–903. [Google Scholar] [CrossRef]
- Stump, R.L.; Heide, J.B. Controlling supplier opportunism in industrial relationships. J. Mark. Res. 1996, 33, 431–441. [Google Scholar] [CrossRef]
- Nguyen, T.N.; Lobo, A.; Greenland, S. Pro-environmental purchase behaviour: The role of consumers’ biospheric values. J. Retail. Consum. Serv. 2016, 33, 98–108. [Google Scholar] [CrossRef]
- Nguyen, T.N.; Lobo, A.; Greenland, S. The influence of cultural values on green purchase behaviour. Mark. Intell. Plan. 2017, 35, 377–396. [Google Scholar] [CrossRef]
- Das, A.K.; Biswas, S.R.; Abdul Kader Jilani, M.M.; Uddin, M.A. Corporate environmental strategy and voluntary environmental behavior—Mediating effect of psychological green climate. Sustainability 2019, 11, 3123. [Google Scholar] [CrossRef] [Green Version]
- Nguyen, T.T.H.; Yang, Z.; Nguyen, N.; Johnson, L.W.; Cao, T.K. Greenwash and green purchase intention: The mediating role of green skepticism. Sustainability 2019, 11, 2653. [Google Scholar] [CrossRef] [Green Version]
- Ateş, M.A.; Bloemhof, J.; Van Raaij, E.M.; Wynstra, F. Proactive environmental strategy in a supply chain context: The mediating role of investments. Int. J. Prod. Res. 2012, 50, 1079–1095. [Google Scholar] [CrossRef]
- Sharma, S.; Durvasula, S.; Dillon, W.R. Some results on the behavior of alternate covariance structure estimation procedures in the presence of non-normal data. J. Mark. Res. 1989, 26, 214–221. [Google Scholar] [CrossRef]
- Hair, J.F.; Black, W.C.; Babin, B.J.; Anderson, R.E. Multivariate Data Analysis, 7th ed.; Prentice Hall: Upper Saddle River, NJ, USA, 2010. [Google Scholar]
- Hu, L.t.; Bentler, P.M. Cutoff criteria for fit indexes in covariance structure analysis: Conventional criteria versus new alternatives. Struct. Equ. Model. A Multidiscip. J. 1999, 6, 1–55. [Google Scholar] [CrossRef]
- Stevens, J.P. Outliers and Influential Data Points in Regression Analysis. Psychol. Bull. 1984, 95, 334–344. [Google Scholar] [CrossRef]
- Conway, J.M.; Lance, C.E. What reviewers should expect from authors regarding common method bias in organizational research. J. Bus. Psychol. 2010, 25, 325–334. [Google Scholar] [CrossRef] [Green Version]
- Fornell, C.; Larcker, D.F. Evaluating structural equation models with unobservable variables and measurement error. J. Mark. Res. 1981, 18, 39–50. [Google Scholar] [CrossRef]
- Bagozzi, R.P.; Yi, Y. Assessing method variance in multitrait-multimethod matrices: The case of self-reported affect and perceptions at work. J. Appl. Psychol. 1990, 75, 547–560. [Google Scholar] [CrossRef]
- Bentler, P.M. EQS 6 Structural Equations Program Manual; Multivariate Software, Inc.: Encino, CA, USA, 2006. [Google Scholar]
- Tong, X.; Zhang, Z.; Yuan, K.-H. Evaluation of Test Statistics for Robust Structural Equation Modeling With Nonnormal Missing Data. Struct. Equ. Model. A Multidiscip. J. 2014, 21, 37–41. [Google Scholar] [CrossRef]
- Yuan, K.; Bentler, P.M. Three Likelihood-Based Methods for Mean and Covariance Structure Analysis with Nonnormal Missing Data. Sociol. Methodol. 2000, 30, 165–200. [Google Scholar] [CrossRef]
- Miles, M.P.; Covin, J.G. Environmental marketing: A source of reputational, competitive, and financial advantage. J. Bus. Ethics 2000, 23, 299–311. [Google Scholar] [CrossRef]
- Aragón-Correa, J.A.; Sharma, S. A contingent resource-based view of proactive corporate environmental strategy. Acad. Manag. Rev. 2003, 28, 71–88. [Google Scholar] [CrossRef] [Green Version]
- Miles, M.P.; Covin, J.G.; Heeley, M.B. The relationship between environmental dynamism and small firm structure, strategy, and performance. J. Mark. Theory Pract. 2015, 8, 63–78. [Google Scholar] [CrossRef]
- Sen, P.; Roy, M.; Pal, P. Exploring role of environmental proactivity in financial performance of manufacturing enterprises: A structural modelling approach. J. Clean. Prod. 2015, 108, 583–594. [Google Scholar] [CrossRef]
- Nguyen, N.; Greenland, S.; Lobo, A.; Nguyen Hoang, V. Demographics of sustainable technology consumption in an emerging market: The significance of education to energy efficient appliance adoption. Soc. Responsib. J. 2019, 15, 803–818. [Google Scholar] [CrossRef]
- Finisterra do Paço, A.M.; Raposo, M.L.B. Green consumer market segmentation: Empirical findings from portugal. Int. J. Consum. Stud. 2010, 34, 429–436. [Google Scholar] [CrossRef]
- Wang, M.-L.; Kuo, T.-C.; Liu, J.-W. Identifying target green 3c customers in taiwan using multiattribute utility theory. Expert Syst. Appl. 2009, 36, 12562–12569. [Google Scholar] [CrossRef]


| Constructs | Items | Standardized Loadings | t-Value | α | CR | AVE | Mean | SD |
|---|---|---|---|---|---|---|---|---|
| Product (PR) | 0.87 | 0.82 | 0.69 | 3.17 | 1.05 | |||
| PR1 | 0.85 | * | 3.18 | 1.35 | ||||
| PR2 | 0.76 | 6.59 | 3.22 | 1.25 | ||||
| PR3 | 0.88 | 5.32 | 3.13 | 1.32 | ||||
| Production process (PP) | 0.88 | 0.81 | 0.66 | 3.97 | 1.33 | |||
| PP1 | 0.75 | * | 4.20 | 1.39 | ||||
| PP2 | 0.82 | 11.52 | 3.69 | 1.46 | ||||
| PP3 | 0.87 | 10.79 | 4.01 | 1.40 | ||||
| Organizational System (OS) | 0.84 | 0.80 | 0.60 | 3.07 | 1.12 | |||
| OS1 | 0.78 | * | 3.06 | 1.35 | ||||
| OS2 | 0.71 | 10.54 | 3.13 | 1.29 | ||||
| OS3 | 0.83 | 10.12 | 3.01 | 1.31 | ||||
| Supply chain and recovery (SCR) | 0.93 | 0.86 | 0.62 | 3.68 | 1.29 | |||
| SCR1 | 0.76 | * | 4.02 | 1.42 | ||||
| SCR2 | 0.78 | 7.47 | 3.24 | 1.32 | ||||
| SCR3 | 0.82 | 8.95 | 3.78 | 1.35 | ||||
| External relationship (EXR) | 0.84 | 0.80 | 0.68 | 3.14 | 1.16 | |||
| EXR1 | 0.84 | * | 3.15 | 1.38 | ||||
| EXR2 | 0.72 | 8.12 | 3.04 | 1.35 | ||||
| EXR3 | 0.91 | 8.32 | 3.22 | 1.37 | ||||
| Differentiation competitive advantage (DCA) | 0.93 | 0.87 | 0.75 | 3.75 | 1.22 | |||
| DCA1 | 0.91 | * | 4.13 | 1.47 | ||||
| DCA2 | 0.82 | 16.2 | 4.01 | 1.55 | ||||
| DCA3 | 0.90 | 15.7 | 3.29 | 1.42 | ||||
| DCA4 | 0.84 | 12.3 | 3.55 | 1.51 | ||||
| Cost leadership competitive advantage (CCA) | 0.78 | 0.72 | 0.58 | 3.51 | 1.01 | |||
| CCA1 | 0.83 | * | 3.70 | 1.32 | ||||
| CCA2 | 0.81 | 5.36 | 3.64 | 1.11 | ||||
| CCA3 | 0.62 | 6.25 | 3.19 | 1.22 | ||||
| Product performance (PRP) | 0.88 | 0.83 | 0.53 | 3.75 | 1.14 | |||
| PRP1 | 0.68 | * | 3.32 | 1.46 | ||||
| PRP2 | 0.83 | 6.63 | 4.16 | 1.12 | ||||
| PRP3 | 0.75 | 7.13 | 3.85 | 1.25 | ||||
| PRP4 | 0.71 | 7.51 | 3.72 | 1.31 | ||||
| PRP5 | 0.72 | 7.57 | 3.55 | 1.23 | ||||
| PRP6 | 0.65 | 7.47 | 3.87 | 1.34 | ||||
| Strategic performance (SP) | 0.90 | 0.85 | 0.55 | 3.73 | 1.17 | |||
| SP1 | 0.68 | * | 4.05 | 1.36 | ||||
| SP2 | 0.83 | 9.29 | 3.67 | 1.32 | ||||
| SP3 | 0.72 | 9.21 | 3.22 | 1.34 | ||||
| SP4 | 0.71 | 8.31 | 4.06 | 1.33 | ||||
| SP5 | 0.75 | 7.88 | 3.65 | 1.32 | ||||
| Production performance (PPE) | 0.84 | 0.79 | 0.63 | 3.29 | 1.11 | |||
| PPE1 | 0.79 | * | 3.05 | 1.49 | ||||
| PPE2 | 0.78 | 7.32 | 3.79 | 1.44 | ||||
| PPE3 | 0.81 | 7.08 | 3.02 | 1.36 | ||||
| Financial performance (FP) | 0.88 | 0.81 | 0.53 | 3.28 | 1.03 | |||
| FP1 | 0.83 | * | 3.14 | 1.45 | ||||
| FP2 | 0.63 | 5.72 | 3.12 | 1.47 | ||||
| FP3 | 0.70 | 6.34 | 3.57 | 1.39 |
| Constructs | 1 | 2 | 3 | 4 | 5 | 6 | 7 | 8 | 9 | 10 | 11 |
|---|---|---|---|---|---|---|---|---|---|---|---|
| 1. Product | 0.83 | ||||||||||
| 2. Production process | 0.27 | 0.81 | |||||||||
| 3. Organizational system | 0.09 | 0.22 | 0.77 | ||||||||
| 4. Supply chain and recovery | 0.37 | 0.12 | 0.45 | 0.79 | |||||||
| 5. External relationship | 0.08 | 0.56 | 0.36 | 0.21 | 0.82 | ||||||
| 6. Differentiation advantage | 0.18 | 0.02 | 0.01 | 0.69 | 0.41 | 0.87 | |||||
| 7. Cost leadership advantage | 0.26 | 0.69 | 0.45 | 0.33 | 0.39 | 0.42 | 0.76 | ||||
| 8. Product performance | 0.01 | 0.35 | 0.13 | 0.13 | 0.06 | 0.15 | 0.27 | 0.73 | |||
| 9. Strategic performance | 0.23 | 0.47 | 0.32 | 0.67 | 0.25 | 0.03 | 0.14 | 0.31 | 0.74 | ||
| 10. Production performance | 0.11 | 0.05 | 0.13 | 0.01 | 0.36 | 0.45 | 0.27 | 0.03 | 0.08 | 0.79 | |
| 11. Financial performance | 0.23 | 0.37 | 0.22 | 0.27 | 0.55 | 0.33 | 0.64 | 0.16 | 0.43 | 0.31 | 0.73 |
| Hypothesized Paths | β | t-Value | p-Value | |
|---|---|---|---|---|
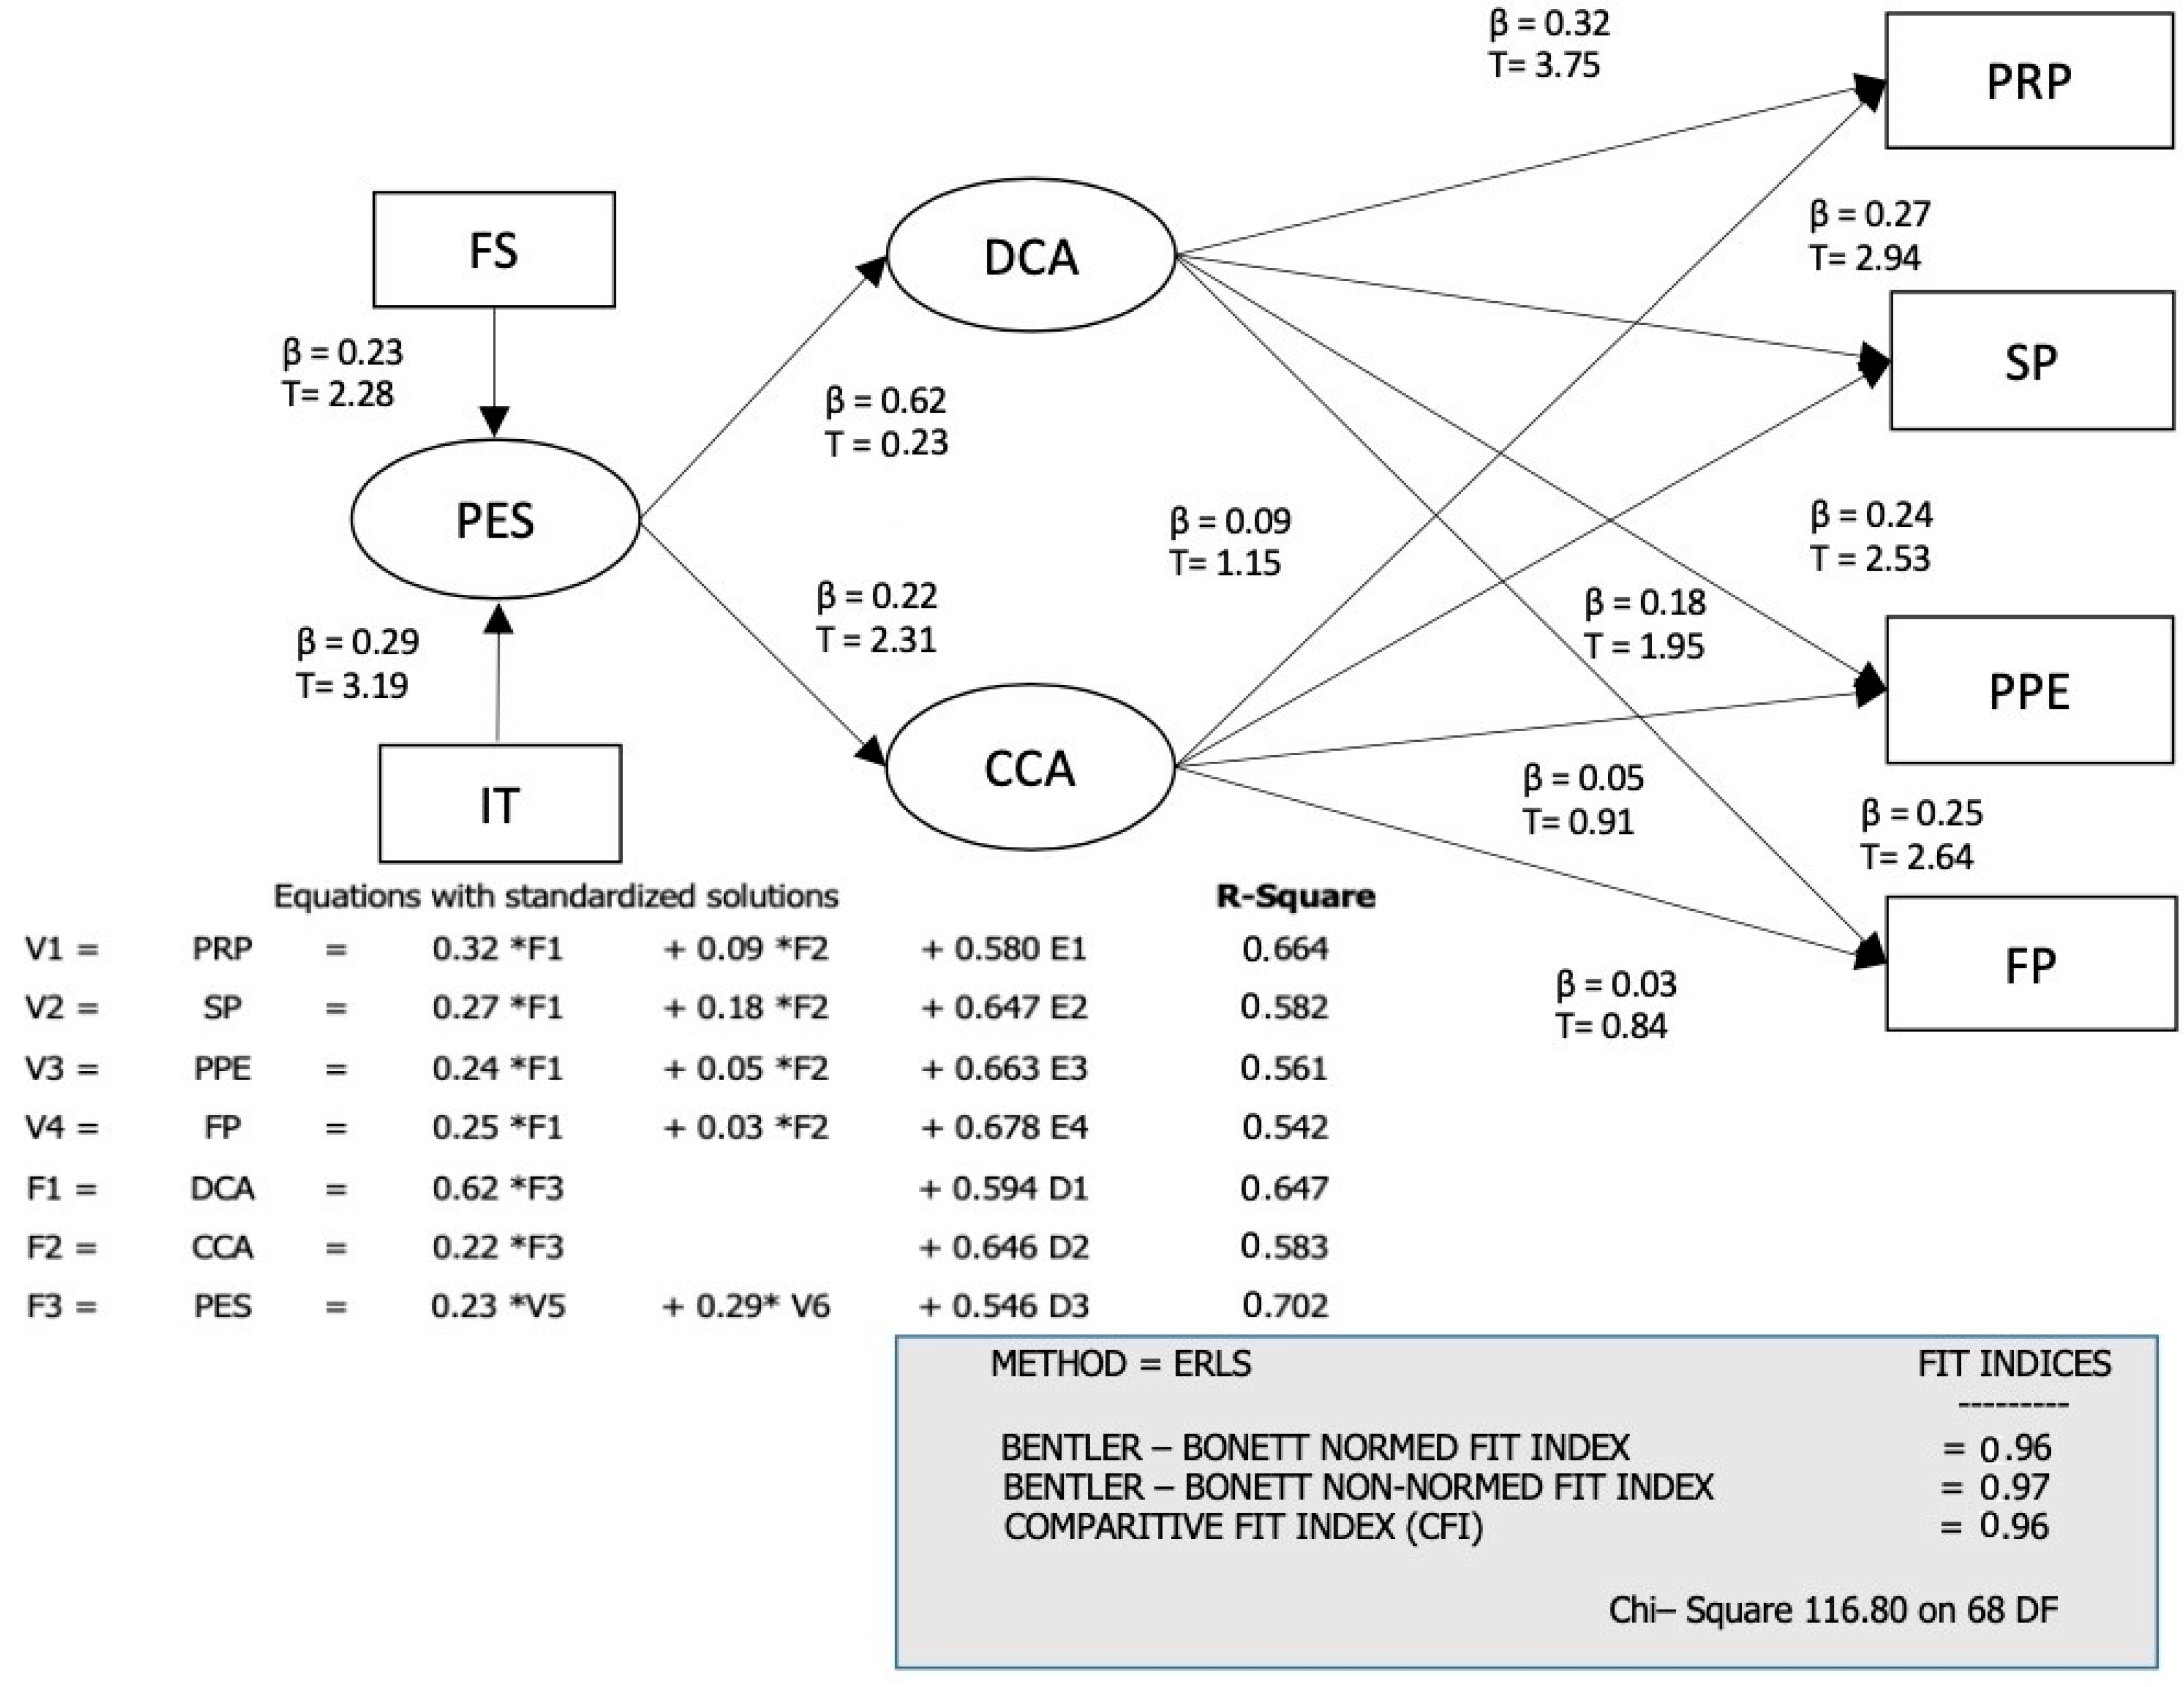
| H1 | Proactive environmental strategy → Differentiation competitive advantage | 0.62 | 7.23 | 0.00 |
| H2 | Proactive environmental strategy → Cost leadership competitive advantage | 0.22 | 2.31 | 0.04 |
| H3a | Differentiation competitive advantage → Product performance | 0.32 | 3.75 | 0.00 |
| H3b | Differentiation competitive advantage → Strategic performance | 0.27 | 2.94 | 0.01 |
| H3c | Differentiation competitive advantage → Production performance | 0.24 | 2.53 | 0.03 |
| H3d | Differentiation competitive advantage → Financial performance | 0.25 | 2.64 | 0.02 |
| H4a | Cost leadership competitive advantage → Product performance | 0.09 | 1.15 | 0.56 |
| H4b | Cost leadership competitive advantage → Strategic performance | 0.18 | 1.95 | 0.04 |
| H4c | Cost leadership competitive advantage → Production performance | 0.05 | 0.91 | 0.40 |
| H4d | Cost leadership competitive advantage → Financial performance | 0.03 | 0.84 | 0.62 |
| Control Effects | ||||
| Firm size → Proactive environmental strategy | 0.23 | 2.28 | 0.04 | |
| Industry type → Proactive environment strategy | 0.29 | 3.19 | 0.03 | |
| Statistic | p-Value | Parameter Estimates | ||||
|---|---|---|---|---|---|---|
| Est. | Standard Error | z | ||||
| 11.492 | 0.175 | 61.125 | 12.063 | 4.563 | ||
| TRES | 12.593 | 0.123 | 72.437 | 8.871 | 8.286 | |
| TYB(RES) | 10.823 | 0.212 | 66.617 | 9.128 | 7.500 | |
| TF(RES) | 1.433 | 0.200 | 65.833 | 15.253 | 4.267 | |
© 2020 by the authors. Licensee MDPI, Basel, Switzerland. This article is an open access article distributed under the terms and conditions of the Creative Commons Attribution (CC BY) license (http://creativecommons.org/licenses/by/4.0/).
Share and Cite
Do, B.; Nguyen, N. The Links between Proactive Environmental Strategy, Competitive Advantages and Firm Performance: An Empirical Study in Vietnam. Sustainability 2020, 12, 4962. https://doi.org/10.3390/su12124962
Do B, Nguyen N. The Links between Proactive Environmental Strategy, Competitive Advantages and Firm Performance: An Empirical Study in Vietnam. Sustainability. 2020; 12(12):4962. https://doi.org/10.3390/su12124962
Chicago/Turabian StyleDo, Binh, and Ninh Nguyen. 2020. "The Links between Proactive Environmental Strategy, Competitive Advantages and Firm Performance: An Empirical Study in Vietnam" Sustainability 12, no. 12: 4962. https://doi.org/10.3390/su12124962
APA StyleDo, B., & Nguyen, N. (2020). The Links between Proactive Environmental Strategy, Competitive Advantages and Firm Performance: An Empirical Study in Vietnam. Sustainability, 12(12), 4962. https://doi.org/10.3390/su12124962